

The Correlation Factors and Mechanisms of Diffusion for P and S in the Cu Single Crystal


Abstract
1. Introduction
2. Materials and Methods
2.1. The Effective Diffusion Model—5-Frequency Model
2.2. Computational Details
3. Results
3.1. Vacancy Formation Energies and Vacancy–Impurity Interactions
3.2. Correlation Effects: The Effective Diffusion Model or 5-Frequency Model for the Diffusion of P and S in Cu
4. Discussion
5. Conclusions
Author Contributions
Funding
Institutional Review Board Statement
Informed Consent Statement
Data Availability Statement
Conflicts of Interest
References
- Raiko, H.; Sandström, R.; Rydén, H.; Johansson, M. Design Analysis Report For the Canister; Swedish Nuclear Fuel and Waste Management Co.: Stockhom, Sweden, 2010. [Google Scholar]
- Le Claire, A.D. Diffusion. In Treatise on Solid State Chemistry: Volume 4 Reactivity of Solids; Hannay, N.B., Ed.; Springer: Boston, MA, USA, 1976; pp. 1–59. [Google Scholar]
- Pacheco-Pozo, A.; Sokolov, I.M. Random walks in correlated diffusivity landscapes. arXiv 2023, arXiv:2307.16504. [Google Scholar] [CrossRef]
- Renshaw, E.; Henderson, R. The Correlated Random Walk. J. Appl. Probab. 1981, 18, 403–414. [Google Scholar] [CrossRef]
- Lidiard, A.B. Correlation effects in diffusion in solids. Il Nuovo Cimento (1955–1965) 1958, 7, 620–631. [Google Scholar] [CrossRef]
- Manning, J.R. Correlation Factors for Impurity Diffusion—Fcc Lattice. Phys. Rev. 1962, 128, 2169–2174. [Google Scholar] [CrossRef]
- Lomaev, I.L.; Novikov, D.L.; Okatov, S.V.; Gornostyrev, Y.N.; Cetel, A.; Maloney, M.; Montero, R.; Burlatsky, S.F. On the mechanism of sulfur fast diffusion in 3-D transition metals. Acta Mater. 2014, 67, 95–101. [Google Scholar] [CrossRef]
- Manning, J.R. Correlation Effects in Impurity Diffusion. Phys. Rev. 1959, 116, 819–827. [Google Scholar] [CrossRef]
- Manning, J.R. Correlated Walk and Diffusion Equations in a Driving Force. Phys. Rev. 1965, 139, A126–A135. [Google Scholar] [CrossRef]
- Adams, J.B.; Foiles, S.M.; Wolfer, W.G. Self-diffusion and impurity diffusion of fcc metals using the five-frequency model and the Embedded Atom Method. J. Mater. Res. 1989, 4, 102–112. [Google Scholar] [CrossRef]
- Moya, F.; Moya-Gontier, G.E.; Cabane-Brouty, F. Sulphur Diffusion in Copper: Departure from the Arrhenius Plot. Phys. Status Solidi (B) 1969, 35, 893–901. [Google Scholar] [CrossRef]
- Spindler, P.; Nachtrieb, K. Diffusion of phosphorus in copper. Phys. Status Solidi (A) 1976, 37, 449–456. [Google Scholar] [CrossRef]
- Maier, K. Self-diffusion in copper at “low” temperatures. Phys. Status Solidi (A) 1977, 44, 567–576. [Google Scholar] [CrossRef]
- Mullen, J.G. Effect of Bardeen-Herring Correlation on Vacancy Diffusion in Anisotropic Crystals. Phys. Rev. 1961, 124, 1723–1730. [Google Scholar] [CrossRef]
- Mehrer, H.; Stolica, N.; Stolwijk, N.A. 2.2.11 Noble Metals: Datasheet from Landolt-Börnstein—Group III Condensed Matter Volume 26 (https://doi.org/10.1007/10390457_20). In Diffusion in Solid Metals and Alloys; Mehrer, H., Ed.; In Springer Materials; Springer: Berlin/Heidelberg, Germany, 1990. [Google Scholar]
- Murch, G.E. Diffusion Kinetics in Solids. In Materials Science and Technology; Cahn, R.W., Haasen, P., Kramer, E.J., Eds.; Wiley: New York, NY, USA, 2013. [Google Scholar]
- Mehrer, H. Atomic jump processes in self-diffusion. J. Nucl. Mater. 1978, 69-70, 38–60. [Google Scholar] [CrossRef]
- Koettgen, J.; Zacherle, T.; Grieshammer, S.; Martin, M. Ab initio calculation of the attempt frequency of oxygen diffusion in pure and samarium doped ceria. Phys. Chem. Chem. Phys. 2017, 19, 9957–9973. [Google Scholar] [CrossRef]
- Neumann, G.; Hirschwald, W. The Correlation Factor of Impurity Diffusion in F.C.C. Metals. Z. Phys. Chem. 1974, 89, 309–319. [Google Scholar] [CrossRef]
- Wert, C.; Zener, C. Interstitial Atomic Diffusion Coefficients. Phys. Rev. 1949, 76, 1169–1175. [Google Scholar] [CrossRef]
- Ledbetter, H.M.; Naimon, E.R. Elastic Properties of Metals and Alloys. II. Copper. J. Phys. Chem. Ref. Data 2009, 3, 897–935. [Google Scholar] [CrossRef]
- Kresse, G.; Furthmüller, J. Efficient iterative schemes for ab initio total-energy calculations using a plane-wave basis set. Phys. Rev. B 1996, 54, 11169–11186. [Google Scholar] [CrossRef]
- Perdew, J.P.; Burke, K.; Ernzerhof, M. Generalized Gradient Approximation Made Simple. Phys. Rev. Lett. 1996, 77, 3865, Erratum in Phys. Rev. Lett. 1997, 78, 1396. [Google Scholar] [CrossRef]
- Blöchl, P.E. Projector augmented-wave method. Phys. Rev. B 1994, 50, 17953–17979. [Google Scholar] [CrossRef]
- Kresse, G.; Joubert, D. From ultrasoft pseudopotentials to the projector augmented-wave method. Phys. Rev. B 1999, 59, 1758–1775. [Google Scholar] [CrossRef]
- Lousada, C.M.; Korzhavyi, P.A. Segregation of P and S to frequently occurring grain boundaries of Cu: Single atoms and cooperative effects. J. Phys. Chem. Solids 2024, 193, 112124. [Google Scholar] [CrossRef]
- Lousada, C.M.; Korzhavyi, P.A. Segregation of P and S Impurities to A Σ9 Grain Boundary in Cu. Metals 2020, 10, 1362. [Google Scholar] [CrossRef]
- Lousada, C.M.; Korzhavyi, P.A. Hydrogen sorption capacity of crystal lattice defects and low Miller index surfaces of copper. J. Mater. Sci. 2020, 55, 6623–6636. [Google Scholar] [CrossRef]
- Sandström, R.; Lousada, C.M. The role of binding energies for phosphorus and sulphur at grain boundaries in copper. J. Nucl. Mater. 2021, 544, 152682. [Google Scholar] [CrossRef]
- Methfessel, M.; Paxton, A.T. High-precision sampling for Brillouin-zone integration in metals. Phys. Rev. B 1989, 40, 3616–3621. [Google Scholar] [CrossRef]
- Henkelman, G.; Jóhannesson, G.; Jónsson, H. Methods for Finding Saddle Points and Minimum Energy Paths. In Theoretical Methods in Condensed Phase Chemistry; Schwartz, S.D., Ed.; Springer: Dordrecht, The Netherlands, 2002; pp. 269–302. [Google Scholar]
- Jónsson, H.; Mills, G.; Jacobsen, K.W. Nudged elastic band method for finding minimum energy paths of transitions. In Classical and Quantum Dynamics in Condensed Phase Simulations; World Scientific Publishing: Singapore, 1998; pp. 385–404. [Google Scholar]
- Fluss, M.J.; Smedskjaer, L.C.; Siegel, R.W.; Legnini, D.G.; Chason, M.K. Positron annihilation measurement of the vacancy formation enthalpy in copper. J. Phys. F Met. Phys. 1980, 10, 1763. [Google Scholar] [CrossRef]
- Ganchenkova, M.G.; Yagodzinskyy, Y.N.; Borodin, V.A.; Hänninen, H. Effects of hydrogen and impurities on void nucleation in copper: Simulation point of view. Philos. Mag. 2014, 94, 3522–3548. [Google Scholar] [CrossRef]
- Korzhavyi, P.A.; Sandström, R. Monovacancy in copper: Trapping efficiency for hydrogen and oxygen impurities. Comput. Mater. Sci. 2014, 84, 122–128. [Google Scholar] [CrossRef]
- Lousada, C.M.; Korzhavyi, P.A. Single vacancies at Σ5, Σ9 and Σ11 grain boundaries of copper and the geometrical factors that affect their site preference. J. Phys. Chem. Solids 2022, 169, 110833. [Google Scholar] [CrossRef]
- Behr, S.; Graswald, B.R. Dissociation limit in Kohn–Sham density functional theory. Nonlinear Anal. 2022, 215, 112633. [Google Scholar] [CrossRef]
- Bao, J.L.; Gagliardi, L.; Truhlar, D.G. Self-Interaction Error in Density Functional Theory: An Appraisal. J. Phys. Chem. Lett. 2018, 9, 2353–2358. [Google Scholar] [CrossRef] [PubMed]
- Bligaard, T.; Nørskov, J.K.; Dahl, S.; Matthiesen, J.; Christensen, C.H.; Sehested, J. The Brønsted–Evans–Polanyi relation and the volcano curve in heterogeneous catalysis. J. Catal. 2004, 224, 206–217. [Google Scholar] [CrossRef]
- Korzhavyi, P.A.; Abrikosov, I.A.; Johansson, B. Theoretical investigation of sulfur solubility in pure copper and dilute copper-based alloys. Acta Mater. 1999, 47, 1417–1424. [Google Scholar] [CrossRef]
- Hans Magnusson, K.F. Self-Diffusion and Impurity Diffusion of Hydrogen, Oxygen, Sulphur and Phosphorus in Copper; Swerea KIMAB AB: Kista, Sweden, 2013. [Google Scholar]
- Toijer, E.; Messina, L.; Domain, C.; Vidal, J.; Becquart, C.S.; Olsson, P. Solute-point defect interactions, coupled diffusion, and radiation-induced segregation in fcc nickel. Phys. Rev. Mater. 2021, 5, 013602. [Google Scholar] [CrossRef]
- Ke, J.-H.; Young, G.A.; Tucker, J.D. Ab initio study of phosphorus effect on vacancy-mediated process in nickel alloys—An insight into Ni2Cr ordering. Acta Mater. 2019, 172, 30–43. [Google Scholar] [CrossRef]
- LeClaire, A.D.; Neumann, G. 3.2.11 Noble Metals: Datasheet from Landolt-Börnstein—Group III Condensed Matter Volume 26 (https://doi.org/10.1007/10390457_39). In Diffusion in Solid Metals and Alloys; Mehrer, H., Ed.; In Springer Materials; Springer: Berlin/Heidelberg, Germany, 1990. [Google Scholar]
- Kidson, G.V. 9.4.11 Noble Metals: Datasheet from Landolt-Börnstein—Group III Condensed Matter Volume 26 (https://doi.org/10.1007/10390457_102). In Diffusion in Solid Metals and Alloys; Mehrer, H., Ed.; In Springer Materials; Springer: Berlin/Heidelberg, Germany, 1990. [Google Scholar]
- Mehrer, H. Correlation in Solid-State Diffusion. In Diffusion in Solids: Fundamentals, Methods, Materials, Diffusion-Controlled Processes; Mehrer, H., Ed.; Springer: Berlin/Heidelberg, Germany, 2007; pp. 105–125. [Google Scholar]
- Lousada, C.M.; Korzhavyi, P.A. Pathways of hydrogen atom diffusion at fcc Cu: Σ9 and Σ5 grain boundaries vs single crystal. J. Mater. Sci. 2023, 58, 17004–17018. [Google Scholar] [CrossRef]


| ΔEP | ΔES | ΔEvac | ΔEvac_P | ΔEvac_S |
|---|---|---|---|---|
| −0.653 | −0.511 | 1.176 | −0.229 | −0.432 |
| P | ||||
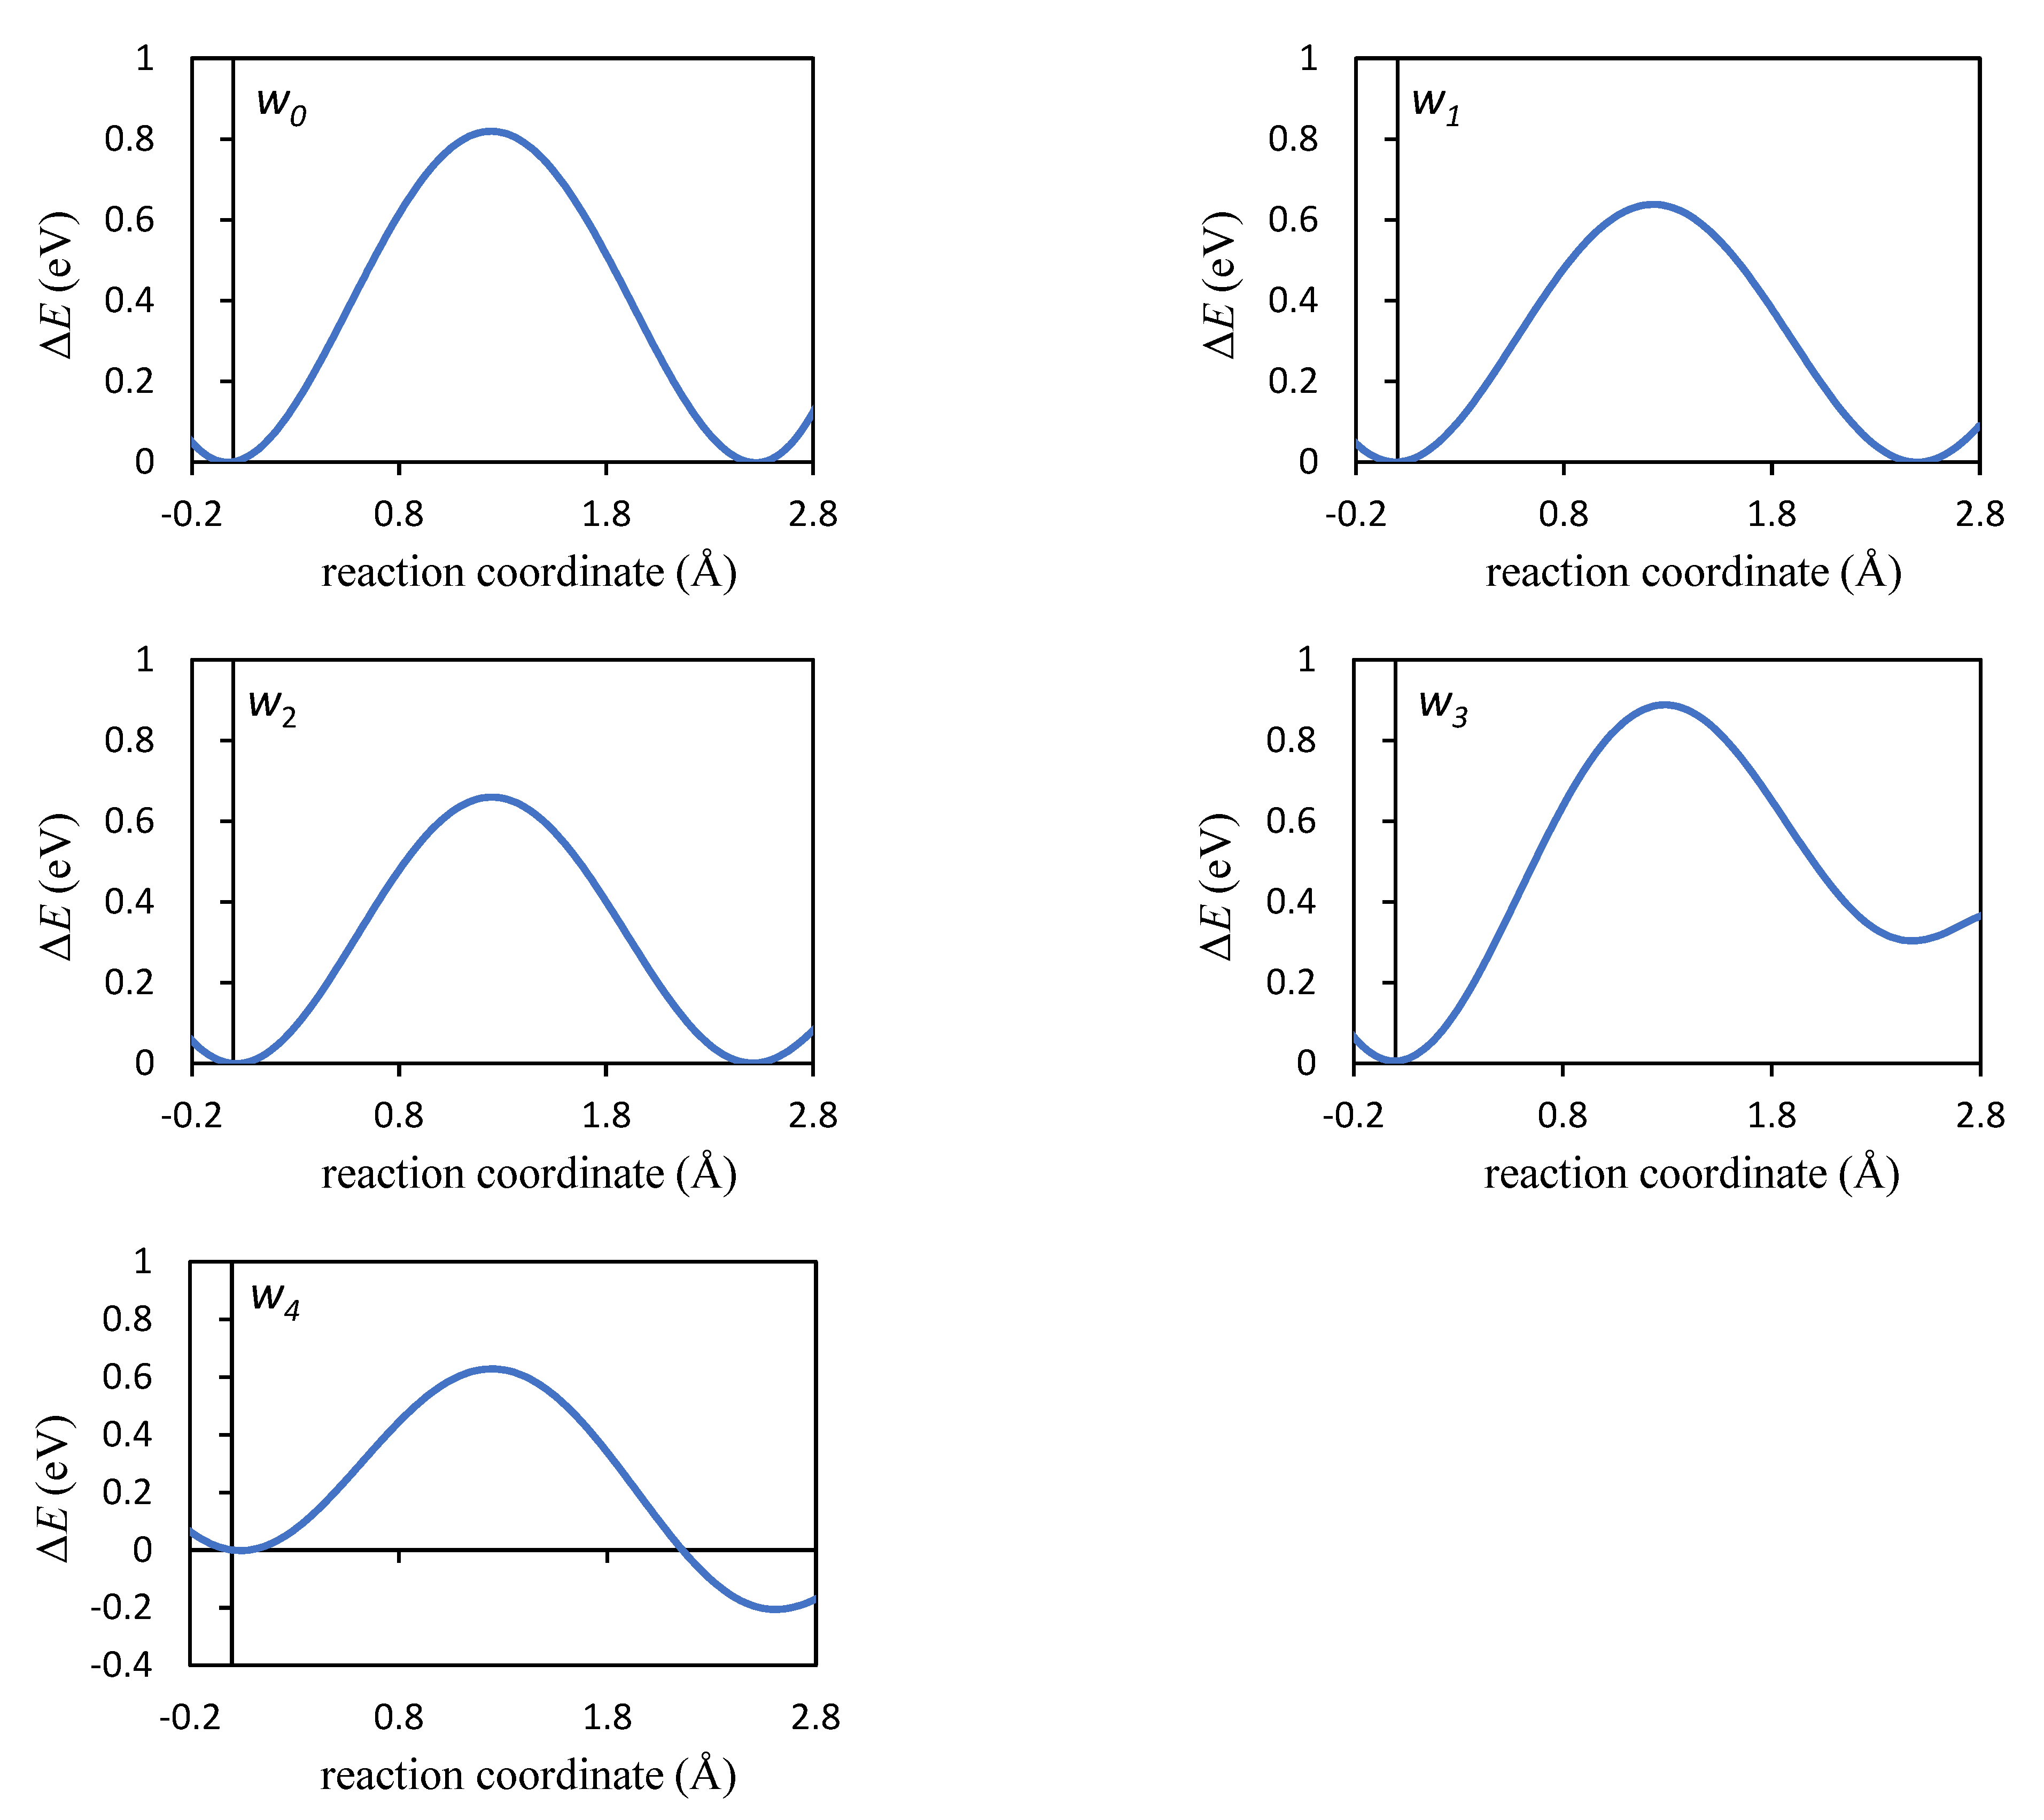
| Jump | λ (Å) | ΔEa (eV) | ΔZPE (eV) | ΔHa (eV) |
| w1 | 2.518 | 0.639 | 0.012 | 0.650 |
| w2 | 2.501 | 0.663 | 0.005 | 0.668 |
| w3 | 2.545 | 0.884 | 0.005 | 0.889 |
| w4 | 2.521 | 0.626 | −0.014 | 0.611 |
| w0 | 2.495 | 0.819 | 0.008 | 0.828 |
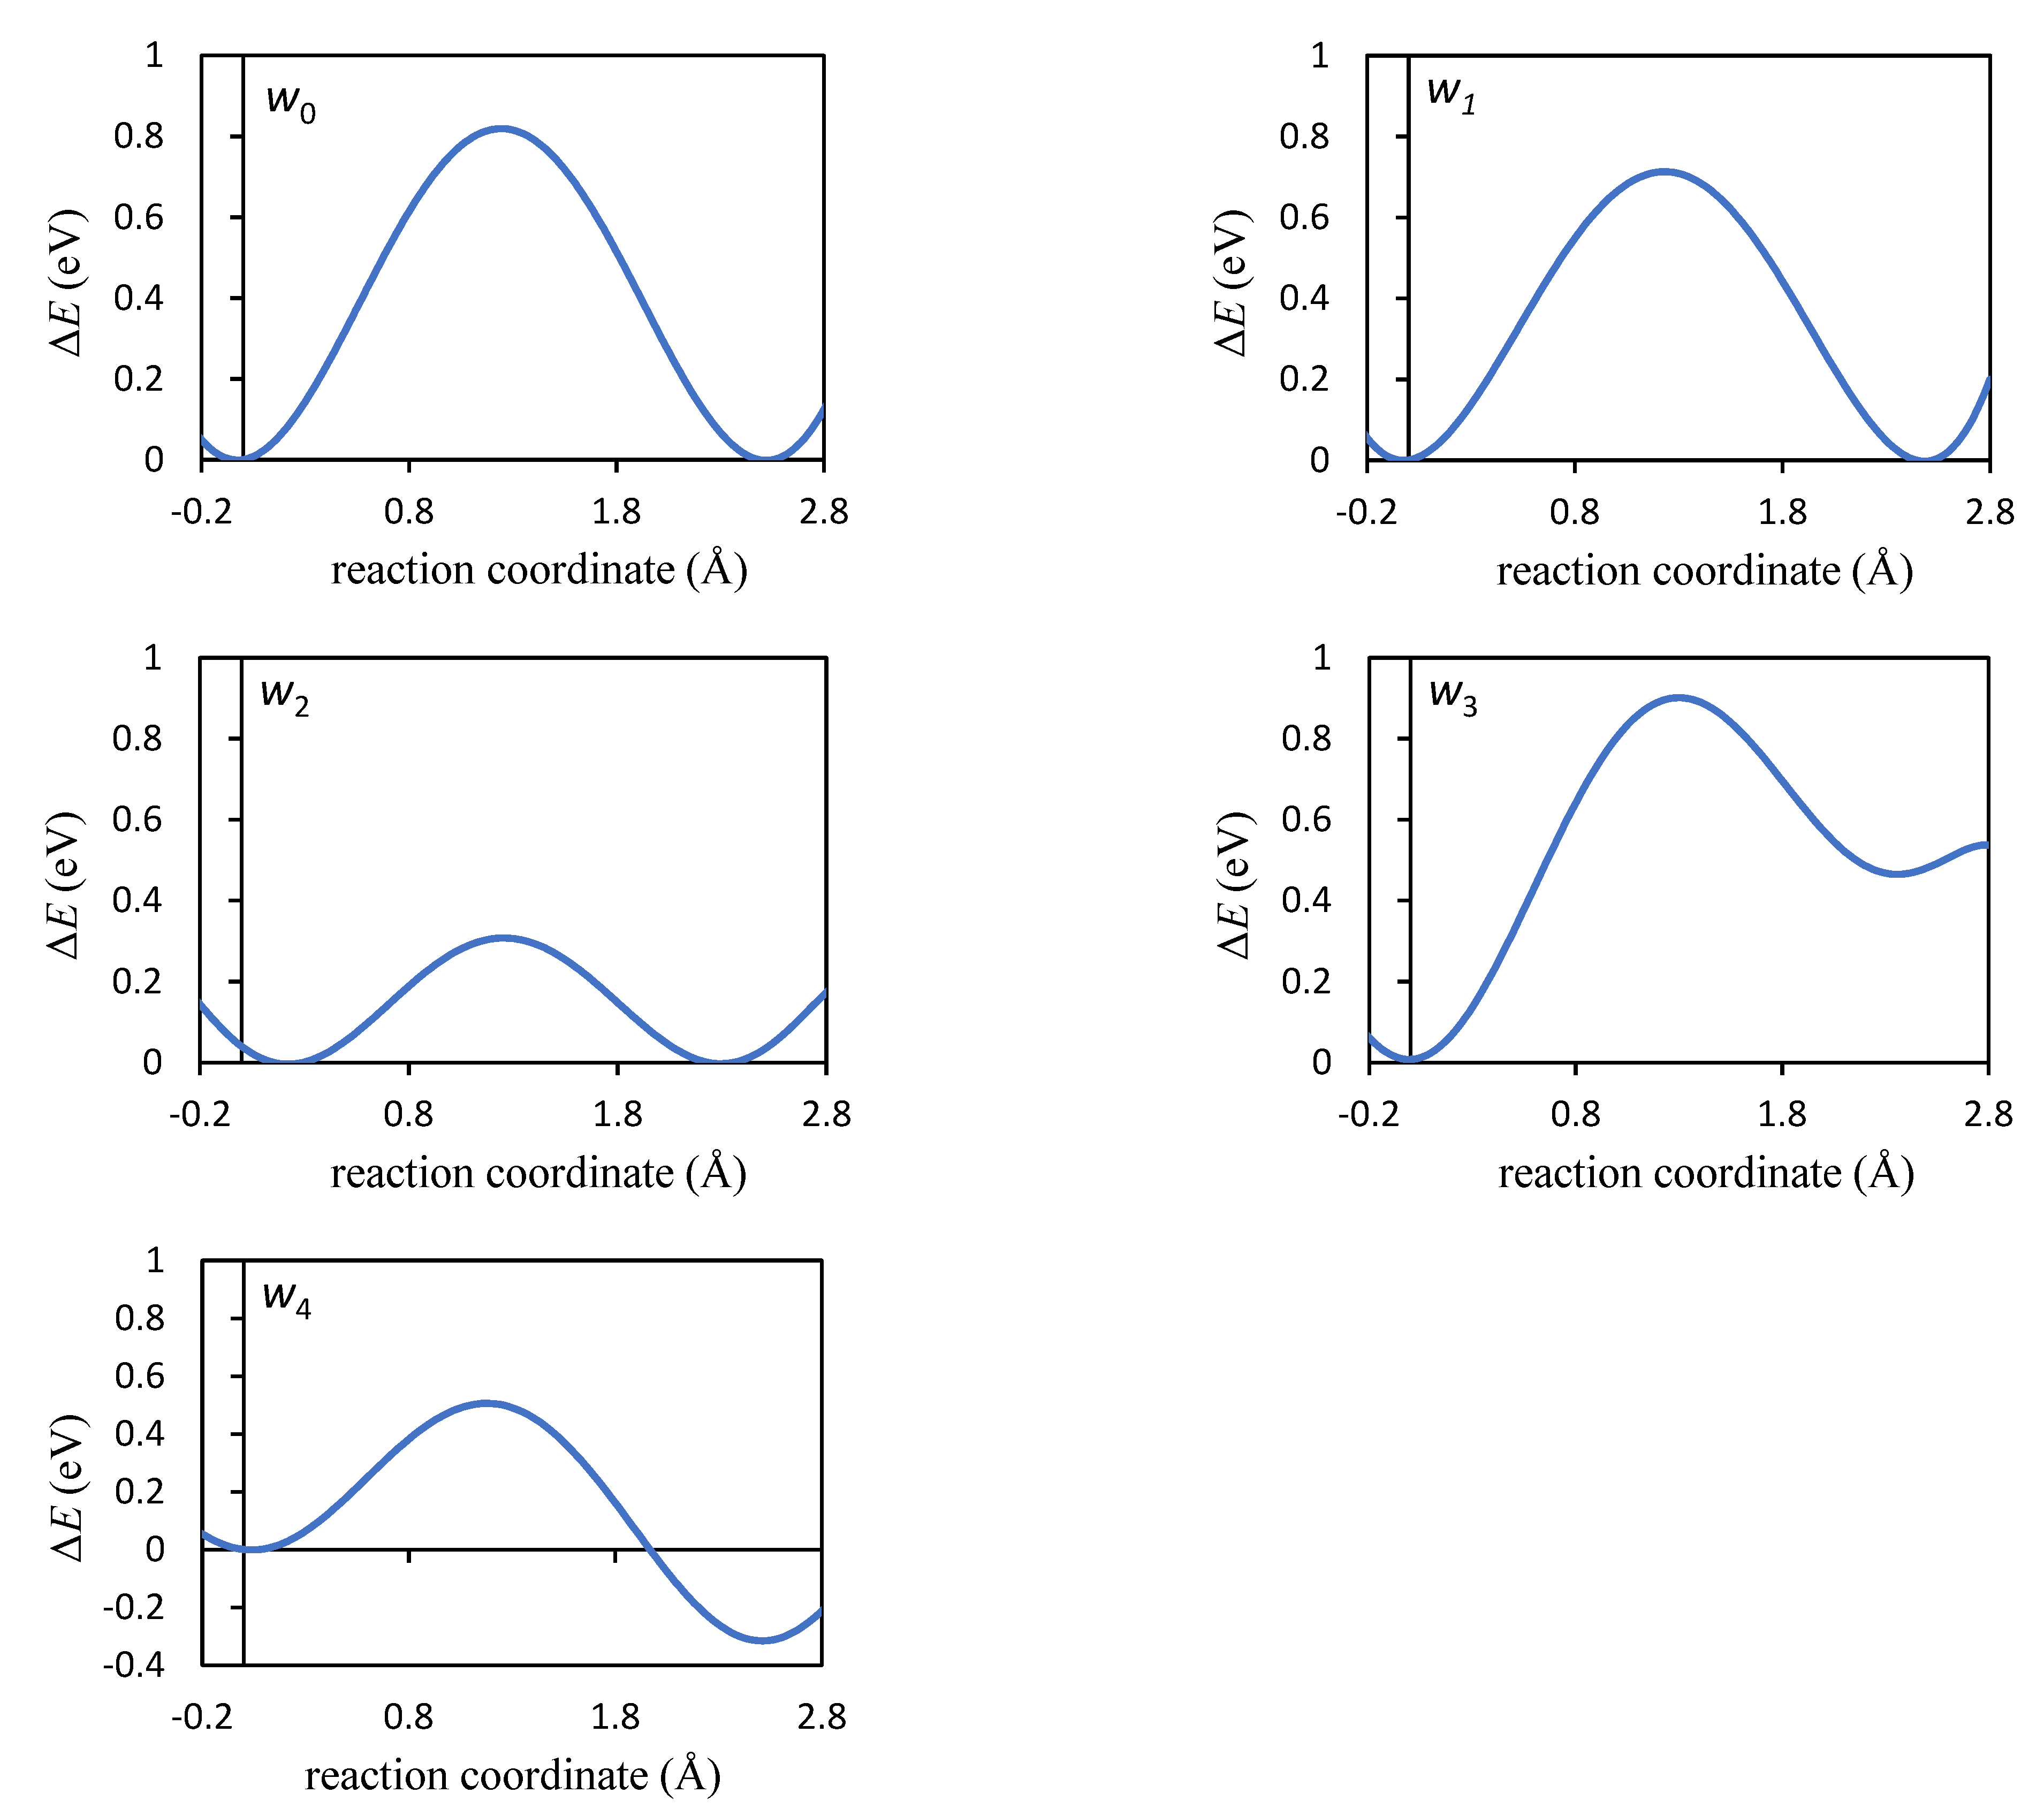
| S | ||||
| Jump | λ (Å) | ΔEa (eV) | ΔZPE (eV) | ΔHa (eV) |
| w1 | 2.518 | 0.714 | 0.010 | 0.724 |
| w2 | 2.501 | 0.315 | 0.012 | 0.327 |
| w3 | 2.545 | 0.895 | 0.009 | 0.904 |
| w4 | 2.459 | 0.505 | −0.008 | 0.496 |
| w0 | 2.495 | 0.819 | 0.008 | 0.828 |
| Jump Index i | P | S | ||
|---|---|---|---|---|
| ν (Hz) | wi (Hz) | ν (Hz) | wi (Hz) | |
| 1 | 8.982 × 10⁹ | 0.0905146 | 9.478 × 10⁹ | 0.0053790 |
| 2 | 1.313 × 10¹⁰ | 0.0665103 | 9.031 × 10⁹ | 26661.4233049 |
| 3 | 1.039 × 10¹⁰ | 9.5 × 10⁻⁶ | 1.048 × 10¹⁰ | 5.3 × 10⁻⁶ |
| 4 | 8.701 × 10⁹ | 0.3974227 | 8.038 × 10⁹ | 32.2438087 |
| 0 | 1.023 × 10¹⁰ | 1.020 × 10⁻⁴ | 1.023 × 10¹⁰ | 1.020 × 10⁻⁴ |
| Quantity | Impurity | |
|---|---|---|
| P | S | |
| T = 298 K | ||
| x | 324.53063 | 26,336.58531 |
| y | 324.61396 | 26,336.66865 |
| F | 0.28609 | 0.28572 |
| f2 | 0.57637 | 2.0195 × 10⁻⁷ |
| f0 (fcc lattice) | 0.781 | 0.781 |
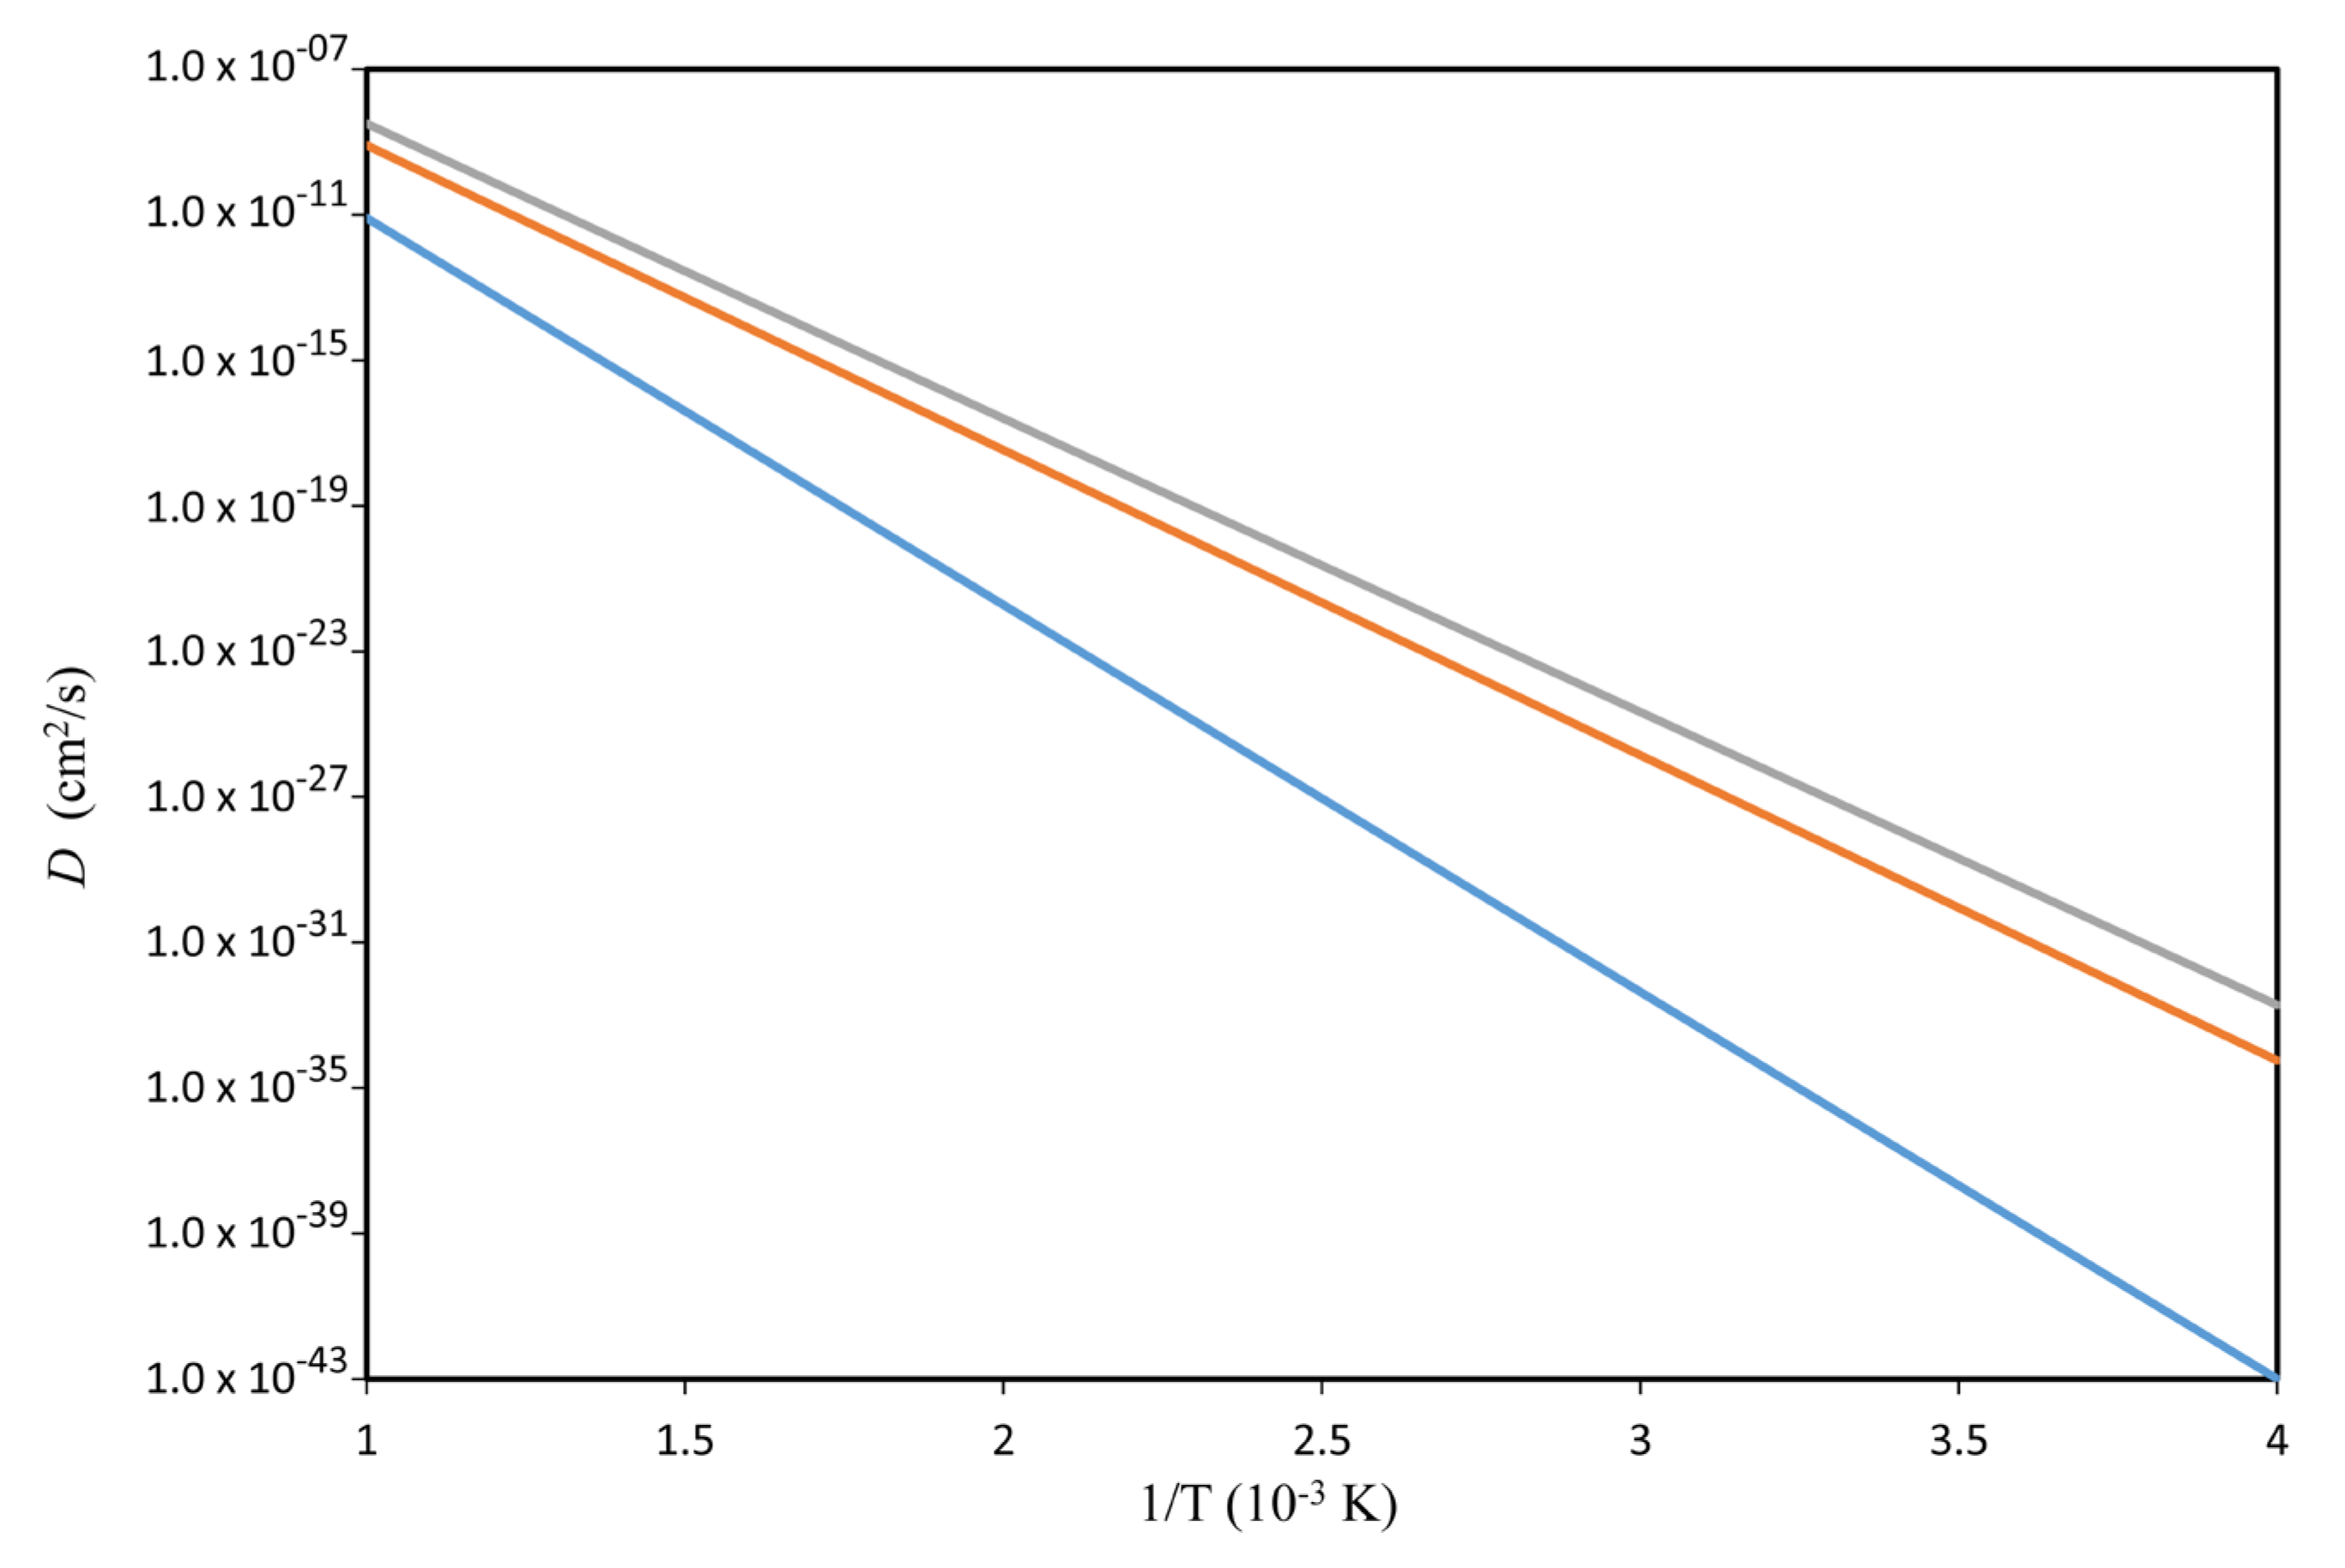
| D (cm2·s−1) | 1.44 × 10⁻²⁹ | 2.95 × 10⁻²⁸ |
| D (cm2·year−1) | 4.56 × 10⁻²² | 9.30 × 10⁻²¹ |
| D (cm2·100,000 year−1) | 4.56 × 10⁻¹⁷ | 9.30 × 10⁻¹⁶ |
| Diffusion length √(Dt) (cm·year−1) | 2.13 × 10⁻¹¹ | 9.64 × 10⁻¹¹ |
| Diffusion length √(Dt) (cm·100,000 year−1) | 0.674 × 10⁻⁸ | 3.05 × 10⁻⁸ |
| T = 373 K | ||
| D (cm2·s−1) | 6.61× 10⁻²⁴ | 8.06 × 10⁻²³ |
| D (cm2·year−1) | 2.09 × 10⁻¹⁶ | 2.54 × 10⁻¹⁵ |
| D (cm2·100,000 year−1) | 2.09 × 10⁻¹¹ | 2.54 × 10⁻¹⁰ |
| Diffusion length √(Dt) (cm·year−1) | 1.44 × 10−08 | 5.04 × 10−08 |
| Diffusion length √(Dt) (cm·100,000 year−1) | 4.57 × 10−06 | 1.60 × 10−05 |
Disclaimer/Publisher’s Note: The statements, opinions and data contained in all publications are solely those of the individual author(s) and contributor(s) and not of MDPI and/or the editor(s). MDPI and/or the editor(s) disclaim responsibility for any injury to people or property resulting from any ideas, methods, instructions or products referred to in the content. |
© 2025 by the authors. Licensee MDPI, Basel, Switzerland. This article is an open access article distributed under the terms and conditions of the Creative Commons Attribution (CC BY) license (https://creativecommons.org/licenses/by/4.0/).
Share and Cite
Lousada, C.M.; Korzhavyi, P.A. The Correlation Factors and Mechanisms of Diffusion for P and S in the Cu Single Crystal. Appl. Sci. 2025, 15, 3305. https://doi.org/10.3390/app15063305
Lousada CM, Korzhavyi PA. The Correlation Factors and Mechanisms of Diffusion for P and S in the Cu Single Crystal. Applied Sciences. 2025; 15(6):3305. https://doi.org/10.3390/app15063305
Chicago/Turabian StyleLousada, Cláudio M., and Pavel A. Korzhavyi. 2025. "The Correlation Factors and Mechanisms of Diffusion for P and S in the Cu Single Crystal" Applied Sciences 15, no. 6: 3305. https://doi.org/10.3390/app15063305
APA StyleLousada, C. M., & Korzhavyi, P. A. (2025). The Correlation Factors and Mechanisms of Diffusion for P and S in the Cu Single Crystal. Applied Sciences, 15(6), 3305. https://doi.org/10.3390/app15063305