Abstract
With ongoing technological advancements, artificial tactile systems have become a prominent area of research, aiming to replicate human tactile capabilities and enabling machines and devices to interact with their environments. Achieving effective artificial tactile sensing relies on the integration of high-performance pressure sensors, precise signal acquisition, robust transmission, and rapid data processing. In this study, we developed a sensor array system based on flexible pressure sensors designed to recognize objects of varying shapes and sizes. The system comprises a multi-channel acquisition circuit and a signal transmission circuit and employs a convolutional neural network (CNN) to classify distinct signal patterns. In a test on an individual, the test results demonstrate that the system achieves a high recognition accuracy of 99.60% across two sphere sizes, three cylinder sizes, a cone, and a rectangular prism. In a group of eight people, it can achieve a recognition accuracy of 93.75%. Furthermore, we applied this sensor array system in an experimental setting involving a ball-throwing action, and it effectively recognized four distinct stages: empty hand, holding the ball, throwing, and catching. In repeated tests by other individuals, it was also able to clearly distinguish each stage. The development of artificial tactile systems allows robots to engage with their environments in a more nuanced and precise manner, enabling complex tasks such as surgical procedures, enhancing the interactive experience of wearable devices, and increasing immersion in virtual reality (VR) and augmented reality (AR). When integrated with deep learning, artificial tactile sensing shows significant potential for creating more intelligent and efficient applications.
1. Introduction
The artificial tactile system [1] is a revolutionary technology developed to replicate human tactile perception capabilities [2], enabling robots and other intelligent devices to achieve refined environmental recognition and interaction [3]. This technology integrates advanced sensors and algorithms [4], allowing the system to sense and interpret physical stimuli—such as contact force, pressure, and temperature—thereby enabling precise object recognition and manipulation [5]. Human tactile perception generally involves three main stages: sensing, transmission, and processing [6]. In the sensing stage, tactile receptors in the skin detect various types of physical stimuli; in the transmission stage, signals are transmitted through the nervous system to the brain; and finally, in the processing stage, the brain interprets these signals, enabling the recognition of object properties. The primary objective of artificial tactile systems is to emulate this process, allowing robots, prosthetics, and virtual reality systems to interact seamlessly with the physical world [7,8]. Tactile feedback is essential in this technology, enabling robots to perceive and respond to environmental information in real time and thus perform more complex tasks [9,10,11,12,13,14]. For instance, in surgical applications, robots equipped with tactile feedback can enhance both surgical precision and safety [15]. Similarly, in manufacturing, artificial tactile systems support automated production lines by ensuring that each step meets quality standards through real-time product monitoring. Tactile sensors can detect surface defects and make necessary adjustments to maintain the final product’s quality [16].
Current research is focused on enhancing the sensitivity [17,18], resolution [19,20], stretchability [21,22], and multi-modal integration [23,24] of artificial tactile systems. Researchers are developing more sensitive sensor materials capable of detecting multiple tactile cues, such as pressure, temperature, and vibration [25]. These advanced sensors more accurately simulate the sensing abilities of human skin, thereby improving system performance [26]. To meet the demands for flexibility and stretchability, significant research is devoted to creating flexible electronic materials [27], allowing sensors to conform to irregular surfaces and maintain functionality during movement. For instance, flexible sensors can be applied to robotic fingers, retaining their sensing capabilities while grasping objects of diverse shapes [28]. Furthermore, multi-modal integration has emerged as a crucial research direction [29]. By effectively combining various types of tactile information, researchers aim to replicate the human tactile experience more closely. This approach requires both advanced sensor design and robust data processing to extract meaningful information from large datasets. With advancements in Artificial Intelligence (AI), artificial tactile systems are increasingly integrated with machine learning and deep learning algorithms, allowing these systems to adapt to new tasks, enhance responsiveness to environmental changes, and support more complex decision-making and predictive capabilities [30,31,32,33]. By learning and extracting features from extensive tactile data, artificial tactile systems can more accurately identify object attributes, including material, shape, and surface texture. Convolutional neural networks (CNNs), for instance, are highly effective in processing complex tactile data and accurately recognizing various types of tactile information [16,34,35,36].
In the future, artificial tactile systems are expected to play a critical role in a wide range of applications [37,38]. In human–robot collaboration, as robotic technology advances, artificial tactile systems will enable robots to better understand and adapt to human operational methods, facilitating smoother cooperation [39,40]. For remote operations, these systems can provide operators with realistic tactile feedback, enabling a true tactile experience even over long distances [41,42]. This capability is particularly valuable in fields such as healthcare and military operations, where real-time tactile feedback during remote surgery or other operations enhances control and precision [37,43,44]. In disaster relief, robots equipped with artificial tactile systems can carry out precise operations in complex environments, aiding rescuers in executing hazardous tasks. With tactile feedback, these robots can detect their surroundings, identify and clear obstacles, and even assist in rescuing individuals trapped during emergencies [30,45,46,47,48]. As technology advances, future tactile systems are anticipated to become more sensitive [17,18], adaptable [49,50], and capable of engaging effectively with humans in increasingly complex environments [51,52,53]. The potential applications of this technology in diverse fields promise to enhance societal intelligence and elevate the quality of life. Through ongoing research and innovation, artificial tactile systems will progress toward their ultimate objective—simulating human touch to provide precise solutions for human needs.
This paper introduces the design of an array-based, multi-channel acquisition system utilizing flexible sensors. The system incorporates high-sensitivity, flexible sensors made from PET fabric, which detect varying pressures with minimal sensitivity to frequency fluctuations. Compared with other devices described in the supplementary document (Table S1), our sensors demonstrate a significant advantage in low-pressure detection. Moreover, they feature a simple structure and are made from easily accessible materials. The sensor demonstrates rapid responses in load and unload pressure tests, with response and recovery times of 119 ms and 68 ms, respectively, while sustaining a reliable performance over 1000 testing cycles. A signal acquisition circuit was developed for the hand-shaped sensor array, and a real-time signal acquisition hardware system was constructed using the STM32F104C8T6 microcontroller. Utilizing a trained convolutional neural network (CNN) model, the system accurately identifies objects of various shapes and sizes, achieving an impressive accuracy of 99.60% on the test set. Moreover, in a test conducted by a group consisting of five men and three women, the classification accuracy on the test set reached 93.75%. Additionally, it effectively distinguishes four stages of a ball-throwing motion: empty hand, holding, throwing, and catching. Furthermore, this result is also applicable to other repetitive throws.
2. Materials and Methods
2.1. The Fabrication of Flexible Pressure Sensor Materials
The fabrication process of the flexible sensors mainly refers to reference [54], with the material and equipment information detailed in Table S2 in the supplementary document. Figure 1 illustrates the main fabrication workflow of preparing flexible pressure sensor materials. In the production of polyester (120.32 g/m2, twill weave), chemical lubricants are often added to enhance the fiber’s spinnability, necessitating the washing of the polyester fibers. Initially, a 2 g/L solution of detergent 209 is prepared, followed by ultrasonic washing for 30 min at a bath ratio of 1:50, and then rinsed with deionized water. After washing, the sample is dried in an oven at 80 °C. Next, a precise amount of polydimethylsiloxane (PDMS) is dissolved in anhydrous ethanol and accurately weighed on an electronic balance. The solution undergoes 10 min of ultrasonic stirring to ensure thorough mixing. The cleaned fabric is then cut to the specified dimensions, immersed in the PDMS solution, and subjected to ultrasonic impregnation for 10 min at 30 °C. This process is repeated three times, followed by drying at 60 °C. The sample prepared using this method is designated PET-d-PDMS. Subsequently, plasma is conducted using a plasma device with an RF power source set at 13.56 MHz, employing capacitively coupled plasma (CCP) discharge. Argon gas is utilized, with adjustments made to the gas pressure (30 Pa), discharge power (100 W), and discharge time (20 s). The sample obtained from this step is labeled PET-g-PDMS. Next, 2 g of multi-walled carbon nanotubes (MWCNTs) is added to 100 mL of anhydrous ethanol, and probe ultrasonication is performed at 20 kHz for 2 h. The resulting dispersion is gently centrifuged at 2000 rpm for 20 min to remove any free MWCNTs.
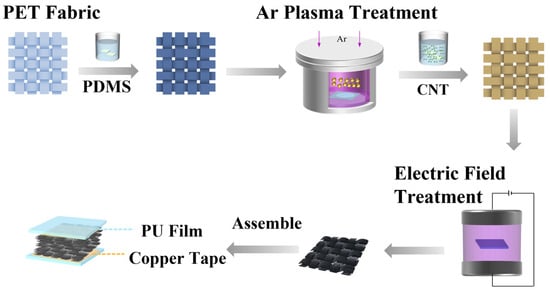
Figure 1.
Preparation process diagram.
The pretreated PET fabric is then immersed in the CNT dispersion for 30 min, dried in an oven at 60 °C, and subsequently cured by applying an alternating current (AC) electric field (ctp2000 k) between two electrode plates until the anhydrous ethanol completely evaporates. Finally, the fabric is cured and dried again at 60 °C. Now, the material preparation for the flexible pressure sensor is complete. The assembly and structure of the flexible pressure sensor will be introduced in Section 2.2.
2.2. Performance Characterization
The structure of the flexible sensor is depicted in Figure 2a. The pressure sensor is composed of five layers of hydrophobic conductive fabric, each measuring 1 cm × 1 cm, with conductive copper tape utilized as the top and bottom electrodes. This size was chosen considering the size of the fingers, while the thickness was determined to achieve the best balance for wearer comfort. To mitigate the impact of contact resistance during testing, the outer sides of the electrodes are wrapped in medical-grade polyurethane (PU) film, ensuring stable electrical performance signals from the sensor. The performance of the fabricated sensor was tested using an electrochemical workstation (CHI660E, Shanghai Chenhua Instrument Co., Ltd., Shanghai, China). The sensor exhibits different signal responses under pressures of 0.1 kPa, 0.2 kPa, 0.5 kPa, 1 kPa, 2 kPa, and 5 kPa, demonstrating its capability to detect a range of pressure levels (Figure 2b). Under a constant pressure of 0.5 kPa, the sensor was tested at frequencies of 0.5 Hz, 1 Hz, 2 Hz, and 3 Hz, revealing that the different frequencies had minimal impact on the sensor’s relative current change (Figure 2c). Current–voltage curves were obtained at pressures of 0 kPa, 0.1 kPa, 0.2 kPa, 0.5 kPa, 1 kPa, 2 kPa, and 5 kPa. Within the limits of the sensor’s functionality, the resistance exhibited a linear change, which amply demonstrated that the material possessed practical piezoresistive properties (Figure 2d). Under a pressure of 0.5 kPa, loading and unloading tests were conducted, yielding response and recovery times of 119 ms and 68 ms, respectively, as shown in the inset of Figure 2e, indicating a rapid response. The sensor exhibited stability after 1000 loading and unloading cycles at a pressure of 0.5 kPa. The magnified view in the inset displays the relative current changes from the 35th to 39th and the 957th to 961st cycles, which are nearly identical, thereby verifying its long-term stability (Figure 2f).
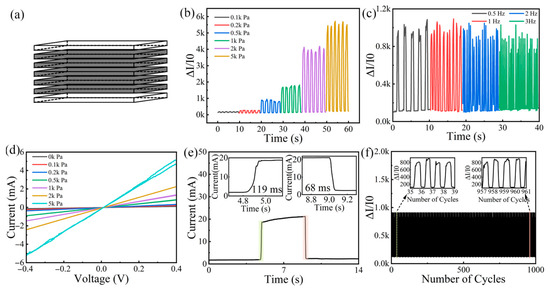
Figure 2.
Analysis and performance characterization of the flexible sensor. (a) A schematic diagram of the flexible sensor. (b) Response characteristics of the sensor under different pressures. (c) The performance of the sensor under varying frequency pressures. (d) The current–voltage curve of the sensor. (e) Response and recovery time curves of the sensor. (f) The cycling stability test of the sensor.
Compared to the sensor in reference [54], the sensor fabricated in this study has a greater advantage in low-pressure detection, whereas the sensor in reference [54] is more suitable for detection within the medium to high pressure range. Additionally, the sensor in this study is also more appropriate for routine static or low-frequency dynamic pressure monitoring.
2.3. Data Acquisition
To achieve effective signal acquisition in flexible tactile systems, Bao et al. [55] developed an integrated intelligent tactile system for a humanoid robot, emphasizing the importance of real-time data collection with minimal system interference. Building on this concept, we designed a signal acquisition circuit based on a flexible sensor array, as depicted in Figure 3. This design aims to achieve real-time multi-channel data collection while preserving the flexibility of the hand. The circuit consists of five main components, as illustrated in Figure 3a: a sensor array module, data acquisition module, microcontroller (MCU) module, data transmission module, and PC data receiving module.
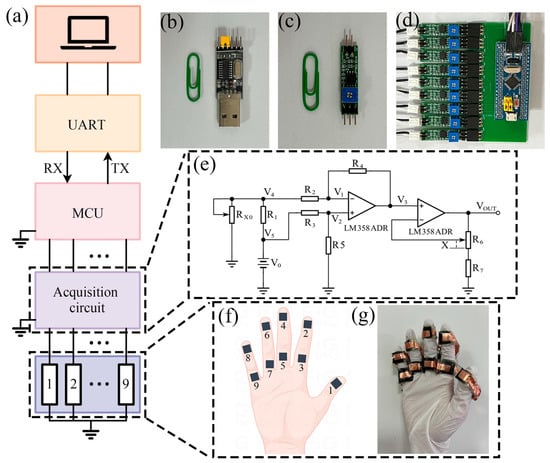
Figure 3.
Design and components of the data acquisition circuit. (a) The hierarchical structure of the data acquisition module, consisting of the sensor array, acquisition circuit, MCU module, data transmission module, and computer data receiving end from bottom to top. (b) A photograph of the serial-to-USB adapter. (c) A photograph of the data acquisition circuit module. (d) A photograph showing the MCU module connected to the data acquisition circuit via an adapter board. (e) A schematic diagram of the data acquisition circuit. (f,g) A schematic and photograph of the sensor array, showing nine sensors distributed across five fingers.
We use nine flexible pressure sensors to form a flexible pressure sensor array, with the sensors distributed across the five fingers of a hand, as shown in Figure 3f. Figure 3g presents a photograph of the sensor array. The nine pressure sensors are evenly distributed across the five fingers of the right hand. Compared to having just one or two sensors on a single finger, this arrangement significantly improves the accuracy and flexibility of tactile perception. The multi-point sensor design allows for finer detection of pressure differences between the fingers, providing more accurate tactile feedback, which is especially crucial for robotic grasping and object manipulation tasks. Sensors distributed across multiple fingers better simulate the tactile perception of the human hand, enhancing the system’s precision in spatial awareness, object recognition, and classification. Additionally, the distributed design of the sensors increases the system’s fault tolerance, ensuring stable tactile feedback even if one sensor fails [56,57,58]. The sensor array is responsible for converting pressure signals into electrical signals. These signals are collected by the data acquisition circuit (Figure 3c) and transmitted to the MCU module (Figure 3d). We selected the STM32F104C8T6 microcontroller (STMicroelectronics, Geneva, Switzerland) from STMicroelectronics, which utilizes its built-in analog-to-digital converter (ADC) module to convert analog signals into digital signals through programming.
Data transmission employs the asynchronous serial communication protocol (UART), facilitating the transfer of data from the microcontroller (MCU) to the PC data receiving end. UART communication utilizes two data lines, with each line connecting devices via RX (receive) and TX (transmit) pins, where the RX and TX pins are cross-connected between the two devices. Figure 3b presents a photograph of the serial-to-USB adapter based on the CH340 chip used, which is part of the STM32 development kit.
Figure 3e displays a schematic diagram of the data acquisition circuit, which uses two operational amplifiers to extract the signals. The first operational amplifier converts the current signal into a voltage signal. When current flows through R1, a voltage difference is generated across R1. Based on the virtual short principle, there is no current flowing into the input of the operational amplifier, so
From the virtual short principle, we can conclude that
Assuming R2 = R3 and R4 = R5, we can derive the following from the above three equations:
Here, (V5 − V4) represents the voltage difference across R1, which is the converted voltage signal. When RX0 senses a change in pressure, a corresponding voltage change will be reflected across R1. To ensure that the output of the operational amplifier is not distorted, we conservatively set R2 = R4, resulting in V3 = (V5 − V4).
This section explains the relationship between (V5 − V4) and RX0. Here, V0 is directly provided by a pin of the STM32, with a value of 3.3 V. In this case, during the component selection, we ensured that the resistance of R1 is much smaller than that of RX0, allowing the relationship between the two to be simplified as follows:
The second operational amplifier primarily amplifies the voltage signal. Again, based on the principles of virtual short and virtual ground, we can derive the following from the second operational amplifier:
where X represents the resistance value of the adjustable resistor R6, which is situated near R7. X = 0 for R7 ensures that the inverting terminal of the operational amplifier is not directly grounded. RX0 represents the sensors.
The relationship between the output signal and the sensor can ultimately be expressed as follows:
3. Results and Discussion
3.1. Signal Acquisition of Object Shape
In this experiment, the designed signal acquisition circuit was employed to collect signals during grasp tests on variously shaped objects, ensuring that the bottom surface of each object remained on the table throughout the testing process. The test subjects included a cone (height 21 cm, diameter 12.5 cm), a rectangular cuboid (length 6 cm, width 6 cm, height 10 cm), a sphere, and a cylinder. Specifically, two spheres (with diameters of 6 cm and 10 cm) and three cylinders (each 10 cm in height, with diameters of 4 cm, 6 cm, and 8 cm) were tested.
In Figure 4a, the signal data for grasping objects of different shapes and sizes are summarized. Significant signal differences were observed for the various object shapes. For example, when grasping the cone (Figure 4b), channels 3 and 9 exhibited relatively weak signal intensities. In contrast, for the rectangular cuboid (Figure 4c), which requires greater fingertip strength, the primary signals were concentrated in channels 1, 2, 4, 6, and 8. When grasping a sphere with a 10 cm diameter (Figure 4e), channels 3, 4, 6, and 9 displayed varying signal strengths. Specifically, channels 3 and 9 exhibited weaker signals, while channel 6 registered approximately 0.7 V, and channel 4 demonstrated the strongest signal among the four. For a cylinder with a 6 cm diameter (Figure 4g), the signals in channels 3 and 9 showed significant differences from the other channels, with their signal amplitudes being roughly half of those in the others.
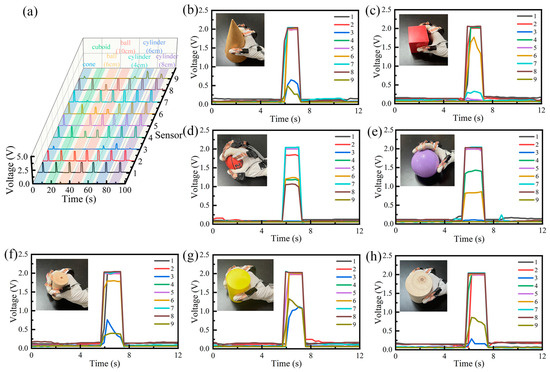
Figure 4.
Signal responses of the sensor array when a male tester grasps different objects. (a) Signals when grasping seven different objects. (b) Signals when grasping a cone. (c) Signals when grasping a rectangular prism. (d) Signals when grasping a sphere with a diameter of 6 cm. (e) Signals when grasping a sphere with a diameter of 10 cm. (f) Signals when grasping a cylinder with a diameter of 4 cm. (g) Signals when grasping a cylinder with a diameter of 6 cm. (h) Signals when grasping a cylinder with a diameter of 8 cm, with all cylinders having a height of 10 cm.
Further analysis was conducted on the signal differences across channels for different object sizes (Figure 4d–h). Comparing the signals for the two spheres (Figure 4d,e), there was a notable difference in intensity in channels 6 and 8. For the smaller sphere, channel 8 was weaker, and channel 6 was slightly stronger; conversely, for the larger sphere, channel 4 exhibited a tendency toward higher signal strength. Figure 4f–h display the signal variations for grasping cylinders of three different sizes, with channels 3 and 9 showing the most significant changes. When grasping the cylinder with a 6 cm diameter, these channels exhibited the strongest signals. For the cylinder with a 4 cm diameter, channel 3 demonstrated moderate signal strength, while it was weakest for the 8 cm diameter cylinder. Conversely, channel 9 exhibited moderate signal strength for the 8 cm cylinder and was weakest for the 4 cm cylinder.
In summary, the signal intensity across different sensor channels varied significantly when grasping different objects. These differences not only provide a basis for distinguishing objects of various shapes and sizes but also lay a foundation for the intelligent development of artificial tactile systems. Combined with deep learning algorithms, these signal differences can be utilized for more accurate object recognition and classification, enabling robots to perform complex tasks with greater flexibility and precision. In scenarios such as surgery and rescue, tactile feedback allows for safer and more efficient operations. Furthermore, leveraging these signal differences can enhance tactile experiences in virtual (VR) and augmented reality (AR), making human–computer interactions more natural and realistic, as demonstrated by Wen et al. [59], who explored the use of conductive triboelectric textiles for gesture recognition in VR/AR applications.
3.2. Signal Recognition Based on Deep Learning
We first selected a 27-year-old male participant who is right-handed and conducted the test on him individually. We constructed a dataset based on the seven signal characteristics mentioned above. The sample data for each dataset were collected by the sensor array, capturing data from all nine sensors simultaneously during a single test as one sample. Each type of grasping action data includes 500 samples, with each sample comprising data from five tests, resulting in a total of 3500 samples for the dataset. Each class of data is stored in separate folders. The dataset is divided into training, validation, and test sets, containing 2500, 500, and 500 samples, respectively.
To further validate the potential of CNN-based deep learning in this application, we implemented a CNN algorithm using the PyTorch library (Python version: 3.10.4; PyTorch version: 2.5.1+cpu). The CNN architecture, illustrated in Figure 5a, is designed to recognize grasping signals from various objects. This network consists of an input layer, two convolutional layers, two pooling layers, a fully connected layer, and an output layer. The input layer has nine channels with dimensions of 1 × 9 × 150. Here, the first “1” indicates that the data are one-dimensional; the “9” represents the nine input channels; and the “150” denotes the specified length of the data in each sample. For data that are shorter than this length, zero-padding is applied before inputting them into the CNN to reach the specified length. For data longer than this length, the excess part is truncated. The choice of data length should take into account the actual range of data lengths to ensure that the specified length can accurately reflect the data information.
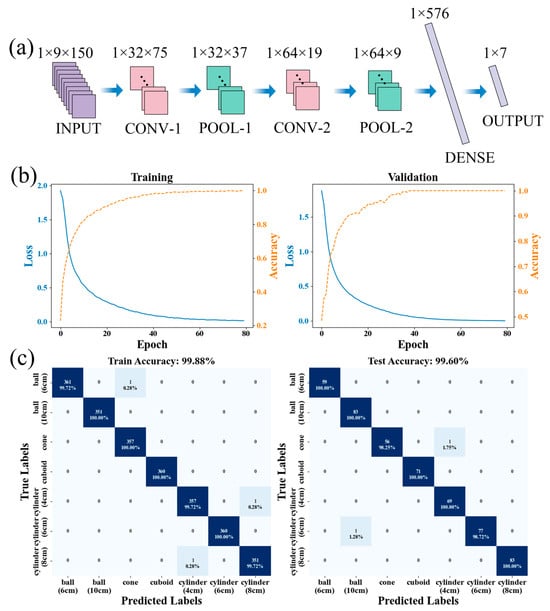
Figure 5.
Application of deep learning in recognizing grasped objects. (a) A schematic diagram of the convolutional neural network (CNN) structure used for recognizing different grasped objects. (b) Loss function and accuracy curves of the CNN on the training and validation sets during the training process. (c) Confusion matrices showing the training and testing sets for the object recognition tasks.
In the first convolutional layer, a convolutional kernel of size 3 is employed, utilizing 32 kernels, a stride of 2, and a padding of 1. Padding is applied to prevent the length of the feature map from decreasing due to edge effects. The convolution is mathematically expressed as
where O[i] denotes the value of the output feature map at position i after convolution. In this context, X is the input, W represents the kernel weight, b is the bias term, k denotes the kernel size, and i and j are indices associated with the output and kernel, respectively. Following each convolutional layer, a ReLU activation function is applied, defined as
where x represents the input. This non-linear activation function enhances the network’s expressiveness, allowing it to model complex patterns more effectively. The first pooling layer has a window size of 2, which reduces the feature map size by selecting the maximum value within each region. This pooling process is mathematically expressed as
where is the value at window i, and k is the pooling window size. This operation reduces computational complexity while preserving essential features. The second convolutional layer uses a kernel size of 3, with 64 kernels, a stride of 2, and a padding of 1. The second pooling layer also has a window size of 2. Following two layers of convolution and pooling, the features are flattened into a one-dimensional vector and fed into the fully connected layer, which contains 576 neurons, mathematically expressed as
where X denotes the input feature vector, W represents the weight matrix, and b is the bias term. The output of the fully connected layer is subsequently mapped to seven categories. To assess the model’s performance, we utilized the cross-entropy loss function, defined as
where C is the number of categories, is the one-hot-encoded true label, and is the predicted probability. A dropout layer with a dropout rate of 0.5 was added during training to prevent overfitting, and the dropout operation is given by
where p is the dropout rate, is the i-th element of the input features, and Odropout is the output after dropout, which reduces the model’s dependency on specific neurons.
Figure 5b illustrates the loss and accuracy curves for both the training and validation sets. After 80 epochs, the loss decreased, and the accuracy increased to satisfactory levels. Figure 5c presents the confusion matrix for the training and test sets of the dataset comprising various grasped objects, where the horizontal axis denotes predicted labels, and the vertical axis represents true labels. Following 80 epochs, the accuracy of the training set reached 99.88%, while the accuracy of the test set reached 99.60%, indicating a high level of recognition accuracy for the model. This is consistent with recent findings on the effectiveness of machine learning-assisted sensors for motion and gait recognition [60] and is also in line with the theoretical basis related to tactile recognition [61].
Further, we expanded the range of participants. The selected participants’ information is listed in Table S3 of the supplementary document, consisting of five males and three females, for a total of eight people. The participants’ ages ranged from 20 to 30. Each participant tested each task 100 times with their right hand. The data obtained were used to build a dataset for different populations. Given the increased complexity of the samples, we appropriately increased the complexity of the CNN. The number of neurons in each layer was increased to 128, the stride of each convolutional layer was adjusted to 1, the kernel size of the pooling layer was adjusted to 2, and the number of training iterations was increased to 150. Finally, as can be seen in Figure S1, the classification accuracy of the training set reached 95.30%, and that of the test set reached 93.75%. It can be observed that after increasing the complexity of the dataset, the accuracy rate decreased slightly.
3.3. Throwing a Ball
To demonstrate the system’s real-time capability, we collected data during a ball-tossing motion. Figure 6a illustrates the four stages of this action: initially, the hand is empty and in a preparatory phase (Figure 6a(i)); next, the ball is placed in the hand (Figure 6a(ii)); then, the ball is tossed upward, leaving the palm (Figure 6a(iii)); and finally, the ball is caught after being tossed (Figure 6a(iv)). Figure 6b displays the data collected throughout these four stages. In stage i, the signal strength across all channels is low, generally remaining below 0.3 V. In stage ii, with the ball in hand, the signal strength in channels 2, 5, and 7 significantly increases, reaching approximately 0.5 V, 1.3 V, and 0.7 V, respectively. In stage iii, as the ball is tossed, the upward acceleration causes the signal strength in channel 5 to rise again; however, once the ball fully leaves the hand, the signal will return to its initial level. In stage iv, at the moment of catching the ball, the downward acceleration causes the sensor that first comes into contact with the ball to produce a signal amplitude greater than that when normally holding the ball in the hand. At this point, the sensor corresponding to channel 2 in Figure 6b is the first to come into contact with the falling ball, which is exactly reflected in the data. Once the ball stabilizes in the palm, the signal strength will stabilize again. The changes in the signal can clearly distinguish each stage. Due to slight variations in ball-gripping positions each time, minor differences in channel signal strength are to be expected. Moreover, when testing other individuals, similar results can be obtained, which is reflected in Figure S2a,b in the supplementary document. Additionally, in Figure S2c, during consecutive throws, each throw can be distinguished from the changes in the signal. This action sequence demonstrates that the system possesses excellent real-time responsiveness for capturing dynamic signals, making it well suited for measuring signal changes during dynamic processes.
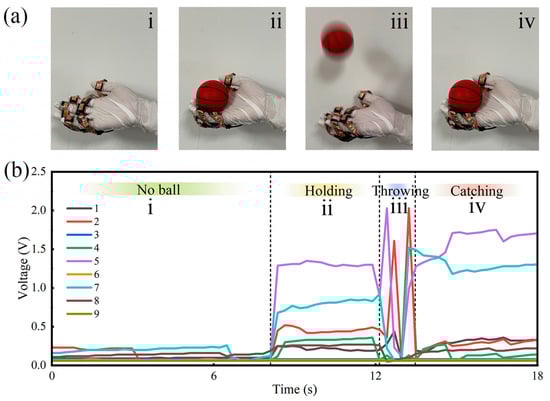
Figure 6.
The data collection process for the throwing motion. (a) The four key stages of the throwing motion using the sensor array glove: (i) the initial stage, empty-handed; (ii) the preparation stage, holding the ball; (iii) the execution stage, throwing the ball; (iv) the completion stage, catching the ball. (b) Collected data for each stage of the throwing motion.
4. Conclusions
In this study, we developed a flexible sensor array system capable of perceiving and identifying objects of various shapes and sizes. Utilizing a custom-designed multi-channel acquisition and signal transmission circuit, the system enables real-time signal transmission and has successfully collected data on two different-sized spheres, three different-sized cylinders, a cone, and a rectangular block. Leveraging these datasets, a convolutional neural network (CNN) was employed to train a deep learning model, achieving an impressive overall recognition rate of 99.60% on the test set. When testing groups composed of different genders, the model achieved a classification accuracy rate of 93.75% on the test set. Furthermore, during dynamic tests—such as the ball-tossing motion—the system accurately distinguished different action phases, which also applied to others repeating the same action. This research significantly contributes to the field of artificial tactile technology, providing valuable insights for the future development of more intelligent robotics.
Supplementary Materials
The following supporting information can be downloaded at: https://www.mdpi.com/article/10.3390/app15063302/s1, Figure S1: CNN Training Results Obtained from Different Population Data; Figure S2: Participant F: repeated throwing results and continuous throwing results; Table S1: Comparison with other sensors; Table S2: Comparison with the Process Steps in Reference [54]; Table S3: S3 Participant Information.
Author Contributions
Investigation, H.Z.; Methodology, H.Z.; Validation, H.Z.; Project administration, Y.T.; Formal analysis, K.S.; Resources, J.L.; Writing—review & editing, J.S., S.X. and Y.G. All authors have read and agreed to the published version of the manuscript.
Funding
This work was funded by the National Natural Science Foundation of China (Nos. 12175036 and 12205041). This work was also supported by AI-Enhanced Research Program of Shanghai Municipal Education Commission (SMEC-AI-DHUY-07).
Institutional Review Board Statement
The study was approved by the Institutional Review Board of Science and Technology Ethics Committee of Donghua University (protocol code SRSY202503140032 and date of approval: 14 March 2025).
Informed Consent Statement
Informed consent was obtained from all subjects involved in the study.
Data Availability Statement
The data presented in this study are available on request from the corresponding author. The data are not publicly available due to privacy.
Conflicts of Interest
The authors declare no conflict of interest.
Correction Statement
This article has been republished with a minor correction to the Funding statement. This change does not affect the scientific content of the article.
References
- Sun, T.; Feng, B.; Huo, J.; Xiao, Y.; Wang, W.; Peng, J.; Li, Z.; Du, C.; Wang, W.; Zou, G.; et al. Artificial Intelligence Meets Flexible Sensors: Emerging Smart Flexible Sensing Systems Driven by Machine Learning and Artificial Synapses. Nano-Micro Lett. 2023, 16, 14. [Google Scholar] [CrossRef]
- Wei, D.; Guo, J.; Qiu, Y.; Liu, S.; Mao, J.; Liu, Y.; Chen, Z.; Wu, H.; Yin, Z. Monitoring the delicate operations of surgical robots via ultra-sensitive ionic electronic skin. Natl. Sci. Rev. 2022, 9, nwac227. [Google Scholar] [CrossRef]
- Wang, Y.; Zhu, P.; Sun, Y.; Li, P.; Mao, Y. Recent advances in stretchable triboelectric nanogenerators for use in wearable bioelectronic devices. Bio-Design Manuf. 2024, 7, 566–590. [Google Scholar] [CrossRef]
- Shatwell, D.G.; Murray, V.; Barton, A. Real-time ore sorting using color and texture analysis. Int. J. Min. Sci. Technol. 2023, 33, 659–674. [Google Scholar] [CrossRef]
- Jiang, L.; Lu, M.; Yang, P.; Fan, Y.; Huang, H.; Xiong, J.; Wang, Z.; Gu, H.; Wang, J. Self-powered sensitive pressure sensor matrix based on patterned arrays of flexible (K,Na)NbO3 piezoelectric nanorods. Sci. China Mater. 2023, 66, 1494–1503. [Google Scholar] [CrossRef]
- Shih, B.; Shah, D.; Li, J.; Thuruthel, T.G.; Park, Y.-L.; Iida, F.; Bao, Z.; Kramer-Bottiglio, R.; Tolley, M.T. Electronic skins and machine learning for intelligent soft robots. Sci. Robot. 2020, 5, eaaz9239. [Google Scholar] [CrossRef]
- Kellmeyer, P.; Mueller, O.; Feingold-Polak, R.; Levy-Tzedek, S. Social robots in rehabilitation: A question of trust. Sci. Robot. 2018, 3, eaat1587. [Google Scholar] [CrossRef]
- Sun, H.; Kuchenbecker, K.J.; Martius, G. A soft thumb-sized vision-based sensor with accurate all-round force perception. Nat. Mach. Intell. 2022, 4, 135–145. [Google Scholar] [CrossRef]
- Ren, X.; He, J.; Han, T.; Liu, S.; Lv, M.; Zhou, R. Exploring the effect of fingertip aero-haptic feedforward cues in directing eyes-free target acquisition in VR. Virtual Real. Intell. Hardw. 2024, 6, 113–131. [Google Scholar] [CrossRef]
- Wang, C.; Pan, C.; Wang, Z. Electronic Skin for Closed-Loop Systems. ACS Nano 2019, 13, 12287–12293. [Google Scholar] [CrossRef]
- Chortos, A.; Liu, J.; Bao, Z. Pursuing prosthetic electronic skin. Nat. Mater. 2016, 15, 937–950. [Google Scholar] [CrossRef]
- Bartolozzi, C.; Natale, L.; Nori, F.; Metta, G. Robots with a sense of touch. Nat. Mater. 2016, 15, 921–925. [Google Scholar] [CrossRef]
- Wen, F.; Zhang, Z.; He, T.; Lee, C. AI enabled sign language recognition and VR space bidirectional communication using triboelectric smart glove. Nat. Commun. 2021, 12, 5378. [Google Scholar] [CrossRef] [PubMed]
- Zhu, M.; Sun, Z.; Lee, C. Soft Modular Glove with Multimodal Sensing and Augmented Haptic Feedback Enabled by Materials’ Multifunctionalities. ACS Nano 2022, 16, 14097–14110. [Google Scholar] [CrossRef]
- Schostek, S.; Ho, C.; Kalanovic, D.; Schurr, M.O. Artificial tactile sensing in minimally invasive surgery—A new technical approach. Minim. Invasive Ther. Allied Technol. 2006, 15, 296–304. [Google Scholar] [CrossRef]
- Wang, R.; Hu, S.; Zhu, W.; Huang, Y.; Wang, W.; Li, Y.; Yang, Y.; Yu, J.; Deng, Y. Recent progress in high-resolution tactile sensor array: From sensor fabrication to advanced applications. Prog. Nat. Sci. 2023, 33, 55–66. [Google Scholar] [CrossRef]
- Li, J.; Bao, R.; Tao, J.; Dong, M.; Zhang, Y.; Fu, S.; Peng, D.; Pan, C. Visually aided tactile enhancement system based on ultrathin highly sensitive crack-based strain sensors. Appl. Phys. Rev. 2020, 7, 011404. [Google Scholar] [CrossRef]
- He, J.; Xiao, P.; Lu, W.; Shi, J.; Zhang, L.; Liang, Y.; Pan, C.; Kuo, S.-W.; Chen, T. A Universal high accuracy wearable pulse monitoring system via high sensitivity and large linearity graphene pressure sensor. Nano Energy 2019, 59, 422–433. [Google Scholar] [CrossRef]
- Pan, C.; Dong, L.; Zhu, G.; Niu, S.; Yu, R.; Yang, Q.; Liu, Y.; Wang, Z.L. High-resolution electroluminescent imaging of pressure distribution using a piezoelectric nanowire LED array. Nat. Photon- 2013, 7, 752–758. [Google Scholar] [CrossRef]
- Peng, Y.; Que, M.; Lee, H.E.; Bao, R.; Wang, X.; Lu, J.; Yuan, Z.; Li, X.; Tao, J.; Sun, J.; et al. Achieving high-resolution pressure mapping via flexible GaN/ ZnO nanowire LEDs array by piezo-phototronic effect. Nano Energy 2019, 58, 633–640. [Google Scholar] [CrossRef]
- Wang, X.; Zhang, Y.; Zhang, X.; Huo, Z.; Li, X.; Que, M.; Peng, Z.; Wang, H.; Pan, C. A Highly Stretchable Transparent Self-Powered Triboelectric Tactile Sensor with Metallized Nanofibers for Wearable Electronics. Adv. Mater. 2018, 30, 1706738. [Google Scholar] [CrossRef]
- Jang, K.-I.; Chung, H.U.; Xu, S.; Lee, C.H.; Luan, H.; Jeong, J.; Cheng, H.; Kim, G.-T.; Han, S.Y.; Lee, J.W.; et al. Soft network composite materials with deterministic and bio-inspired designs. Nat. Commun. 2015, 6, 6566. [Google Scholar] [CrossRef]
- Hua, Q.; Sun, J.; Liu, H.; Bao, R.; Yu, R.; Zhai, J.; Pan, C.; Wang, Z.L. Skin-inspired highly stretchable and conformable matrix networks for multifunctional sensing. Nat. Commun. 2018, 9, 244. [Google Scholar] [CrossRef] [PubMed]
- Sun, B.; McCay, R.N.; Goswami, S.; Xu, Y.; Zhang, C.; Ling, Y.; Lin, J.; Yan, Z. Gas-Permeable, Multifunctional On-Skin Electronics Based on Laser-Induced Porous Graphene and Sugar-Templated Elastomer Sponges. Adv. Mater. 2018, 30, 1804327. [Google Scholar] [CrossRef]
- Mu, C.; Wang, Y.; Mei, D.; Wang, S. Development of robotic hand tactile sensing system for distributed contact force sensing in robotic dexterous multimodal grasping. Int. J. Intell. Robot. Appl. 2022, 6, 760–772. [Google Scholar] [CrossRef]
- Tanner, N.A.; Niemeyer, G. Improving Perception in Time-delayed Telerobotics. Int. J. Robot. Res. 2005, 24, 631–644. [Google Scholar] [CrossRef]
- Li, Y.; Li, Y.; Wu, S.; Wu, X.; Shu, J. Laser-Scribed Graphene for Human Health Monitoring: From Biophysical Sensing to Biochemical Sensing. Nanomaterials 2024, 14, 942. [Google Scholar] [CrossRef]
- Azhari, S.; Yousefi, A.T.; Tanaka, H.; Khajeh, A.; Kuredemus, N.; Bigdeli, M.M.; Hamidon, M.N. Fabrication of piezoresistive based pressure sensor via purified and functionalized CNTs/PDMS nanocomposite: Toward development of haptic sensors. Sens. Actuators A Phys. 2017, 266, 158–165. [Google Scholar] [CrossRef]
- Wang, S.; Bi, Y.; Shi, J.; Wu, Q.; Zhang, C.; Huang, S.; Gao, W.; Bi, M. Deep learning-based hydrogen leakage localization prediction considering sensor layout optimization in hydrogen refueling stations. Process. Saf. Environ. Prot. 2024, 189, 549–560. [Google Scholar] [CrossRef]
- Dar, F.; Emenike, H.; Yin, Z.; Liyanage, M.; Sharma, R.; Zuniga, A.; Hoque, M.A.; Radeta, M.; Nurmi, P.; Flores, H. The MIDAS touch: Thermal dissipation resulting from everyday interactions as a sensing modality. Pervasive Mob. Comput. 2022, 84, 101625. [Google Scholar] [CrossRef]
- Wei, C.; Lin, W.; Liang, S.; Chen, M.; Zheng, Y.; Liao, X.; Chen, Z. An All-In-One Multifunctional Touch Sensor with Carbon-Based Gradient Resistance Elements. Nano-Micro Lett. 2022, 14, 131. [Google Scholar] [CrossRef] [PubMed]
- Nicolelis, M.A.L. Brain–machine–brain interfaces as the foundation for the next generation of neuroprostheses. Natl. Sci. Rev. 2021, 9, nwab206. [Google Scholar] [CrossRef] [PubMed]
- Zhu, M.; Ali, M.U.; Zou, C.; Xie, W.; Li, S.; Meng, H. Tactile and temperature sensors based on organic transistors: Towards e-skin fabrication. Front. Phys. 2020, 16, 13302. [Google Scholar] [CrossRef]
- Pyun, K.R.; Kwon, K.; Yoo, M.J.; Kim, K.K.; Gong, D.; Yeo, W.-H.; Han, S.; Ko, S.H. Machine-learned wearable sensors for real-time hand-motion recognition: Toward practical applications. Natl. Sci. Rev. 2024, 11, nwad298. [Google Scholar] [CrossRef]
- Liu, H.; Guo, D.; Sun, F.; Yang, W.; Furber, S.; Sun, T. Embodied tactile perception and learning. Brain Sci. Adv. 2020, 6, 132–158. [Google Scholar] [CrossRef]
- Liu, Q.; Zhao, T. Quality-of-Experience in Human-in-the-Loop Haptic Communications. ZTE Commun. 2019, 17, 48–55. [Google Scholar]
- Sakai, M.; Watanabe, K.; Ishimine, H.; Okada, Y.; Yamauchi, H.; Sadamitsu, Y.; Kudo, K. Thermal Molding of Organic Thin-Film Transistor Arrays on Curved Surfaces. Nanoscale Res. Lett. 2017, 12, 349. [Google Scholar] [CrossRef]
- Wiederer, C.; Fröhlich, M.; Strohmayr, M. Improving tactile sensation in laparoscopic surgery by overcoming size restrictions. Curr. Dir. Biomed. Eng. 2015, 1, 135–139. [Google Scholar] [CrossRef]
- Wu, H.Y.; Fan, K. Online Direction Classification and Recognition Using an Intuitive Tactile Communication. Appl. Mech. Mater. 2014, 543–547, 1542–1545. [Google Scholar] [CrossRef]
- Schmidtler, J.; Bengler, K. Fast or Accurate?—Performance Measurements for Physical Human-robot Collaborations. Procedia Manuf. 2015, 3, 1387–1394. [Google Scholar] [CrossRef]
- Liu, M.; Dai, Z.; Zhao, Y.; Ling, H.; Sun, L.; Lee, C.; Zhu, M.; Chen, T. Tactile Sensing and Rendering Patch with Dynamic and Static Sensing and Haptic Feedback for Immersive Communication. ACS Appl. Mater. Interfaces 2024, 16, 53207–53219. [Google Scholar] [CrossRef] [PubMed]
- Fennel, M.; Zea, A.; Hanebeck, U.D. Intuitive and immersive teleoperation of robot manipulators for remote decontamination: Intuitive und immersive Teleoperation von Robotermanipulatoren für die Dekontamination aus der Ferne. At-Autom. 2022, 70, 888–899. [Google Scholar] [CrossRef]
- Hale, K.S.; Stanney, K.M.; Malone, L. Enhancing virtual environment spatial awareness training and transfer through tactile and vestibular cues. Ergonomics 2009, 52, 187–203. [Google Scholar] [CrossRef]
- Chen, J.Y.; Terrence, P.I. Effects of tactile cueing on concurrent performance of military and robotics tasks in a simulated multitasking environment. Ergonomics 2008, 51, 1137–1152. [Google Scholar] [CrossRef] [PubMed]
- Arend, M.G.; Benz, T.M.; Mertens, A.; Brandl, C.; Nitsch, V. Do multimodal search cues help or hinder teleoperated search and rescue missions? Ergonomics 2023, 66, 1255–1269. [Google Scholar] [CrossRef] [PubMed]
- Yang, Y.; Ding, Z.; Modares, H. Data-Driven Human-Robot Interaction Without Velocity Measurement Using Off-Policy Reinforcement Learning. IEEE/CAA J. Autom. Sin. 2022, 9, 47–63. [Google Scholar] [CrossRef]
- Zhou, Z. Wearable Haptic Feedback System and Interfaces. Highlights Sci. Eng. Technol. 2023, 45, 18–24. [Google Scholar] [CrossRef]
- Du, G.; Shao, Y.; Luo, B.; Liu, T.; Zhao, J.; Qin, Y.; Wang, J.; Zhang, S.; Chi, M.; Gao, C.; et al. Compliant Iontronic Triboelectric Gels with Phase-Locked Structure Enabled by Competitive Hydrogen Bonding. Nano-Micro Lett. 2024, 16, 170. [Google Scholar] [CrossRef]
- SRoy, S.; Sinha, D.; Pal, R.K.; Roy, U. A unique approach towards keystroke dynamics-based entry-point user access control. Int. J. Biom. 2024, 16, 133–157. [Google Scholar]
- Lee, E.I.; Park, J.W. A self-powered, single-mode tactile sensor based on sensory adaptation using piezoelectric-driven ion migration. Adv. Mater. Technol. 2022, 7, 2200691. [Google Scholar] [CrossRef]
- O’Nascimento, R. “I am feeling blue… and red”: Exploring alternative ways of feeling colours through a wearable haptic artefact. Multimodality Soc. 2023, 3, 444–452. [Google Scholar] [CrossRef]
- Yoshida, S.; Xie, H.; Miyata, K. Omnidirectional Haptic Stimulation System via Pneumatic Actuators for Presence Presentation. Sensors 2023, 23, 584. [Google Scholar] [CrossRef] [PubMed]
- Vaquero-Melchor, D.; Bernardos, A.M. Enhancing Interaction with Augmented Reality through Mid-Air Haptic Feedback: Architecture Design and User Feedback. Appl. Sci. 2019, 9, 5123. [Google Scholar] [CrossRef]
- Zhang, P.; Gu, L.; Liu, W.; Ge, D.; Yang, L.; Guo, Y.; Shi, J. Underwater Highly Pressure-Sensitive Fabric Based on Electric-Induced Alignment of Graphene. Materials 2023, 16, 1567. [Google Scholar] [CrossRef]
- Bao, R.; Tao, J.; Zhao, J.; Dong, M.; Li, J.; Pan, C. Integrated intelligent tactile system for a humanoid robot. Sci. Bull. 2023, 68, 1027–1037. [Google Scholar] [CrossRef]
- Dahiya, R.S.; Metta, G.; Valle, M.; Sandini, G. Tactile Sensing—From Humans to Humanoids. IEEE Trans. Robot. 2010, 26, 1–20. [Google Scholar] [CrossRef]
- Liu, H.; Guo, D.; Sun, F. Object Recognition Using Tactile Measurements: Kernel Sparse Coding Methods. IEEE Trans. Instrum. Meas. 2016, 65, 656–665. [Google Scholar] [CrossRef]
- Schmitz, A.; Maiolino, P.; Maggiali, M.; Natale, L.; Cannata, G.; Metta, G. Methods and Technologies for the Implementation of Large-Scale Robot Tactile Sensors. IEEE Trans. Robot. 2011, 27, 389–400. [Google Scholar] [CrossRef]
- Wen, F.; Sun, Z.; He, T.; Shi, Q.; Zhu, M.; Zhang, Z.; Li, L.; Zhang, T.; Lee, C. Machine Learning Glove Using Self-Powered Conductive Superhydrophobic Triboelectric Textile for Gesture Recognition in VR/AR Applications. Adv. Sci. 2020, 7, 2000261. [Google Scholar] [CrossRef]
- Zhang, D.; Xu, Z.; Wang, Z.; Cai, H.; Wang, J.; Li, K. Machine-learning-assisted wearable PVA/Acrylic fluorescent layer-based triboelectric sensor for motion, gait and individual recognition. Chem. Eng. J. 2023, 478, 147075. [Google Scholar] [CrossRef]
- Liu, H.; Wu, Y.; Sun, F.; Guo, D. Recent Progress on Tactile Object Recognition. Int. J. Adv. Robot. Syst. 2017, 14, 1729881417717056. [Google Scholar] [CrossRef]
Disclaimer/Publisher’s Note: The statements, opinions and data contained in all publications are solely those of the individual author(s) and contributor(s) and not of MDPI and/or the editor(s). MDPI and/or the editor(s) disclaim responsibility for any injury to people or property resulting from any ideas, methods, instructions or products referred to in the content. |
© 2025 by the authors. Licensee MDPI, Basel, Switzerland. This article is an open access article distributed under the terms and conditions of the Creative Commons Attribution (CC BY) license (https://creativecommons.org/licenses/by/4.0/).