Article

MVCG-SPS: A Multi-View Contrastive Graph Neural Network for Smart Ponzi Scheme Detection

1
School of Computer Science and Engineering, Beihang University, Beijing 100191, China
2
Tiande Company, Beijing 102400, China
*
Author to whom correspondence should be addressed.
Appl. Sci. 2025, 15(6), 3281; https://doi.org/10.3390/app15063281
Submission received: 23 January 2025 / Revised: 13 March 2025 / Accepted: 14 March 2025 / Published: 17 March 2025

Abstract

:
Detecting fraudulent activities such as Ponzi schemes within smart contract transactions is a critical challenge in decentralized finance. Existing methods often fail to capture the heterogeneous, multi-faceted nature of blockchain data, and many graph-based models overlook the contextual patterns that are vital for effective anomaly detection. In this paper, we propose MVCG-SPS, a Multi-View Contrastive Graph Neural Network designed to address these limitations. Our approach incorporates three key innovations: (1) Meta-Path-Based View Construction, which constructs multiple views of the data using meta-paths to capture different semantic relationships; (2) Reinforcement-Learning-Driven Multi-View Aggregation, which adaptively combines features from multiple views by optimizing aggregation weights through reinforcement learning; and (3) Multi-Scale Contrastive Learning, which aligns embeddings both within and across views to enhance representation robustness and improve anomaly detection performance. By leveraging a multi-view strategy, MVCG-SPS effectively integrates diverse perspectives to detect complex fraudulent behaviors in blockchain ecosystems. Extensive experiments on real-world Ethereum datasets demonstrated that MVCG-SPS consistently outperformed state-of-the-art baselines across multiple metrics, including F1 Score, AUPRC, and Rec@K. Our work provides a new direction for multi-view graph-based anomaly detection and offers valuable insights for improving security in decentralized financial systems.

1. Introduction

The widespread adoption of blockchain technology and decentralized finance (DeFi) has fundamentally transformed financial ecosystems, enabling automated asset transfers, lending, and crowdfunding through self-executing smart contracts. However, this enhanced accessibility and transparency have also opened new avenues for illicit activities, notably Ponzi schemes, which pose significant threats to the integrity of blockchain networks [1,2]. Timely and accurate detection of such fraudulent behaviors is crucial for maintaining trust and security within these emerging financial infrastructures [3].
Early attempts at anomaly detection in this domain primarily relied on statistical methods [4,5,6] and traditional machine learning models [7,8,9]. While these approaches have demonstrated utility in specific scenarios, they often treat blockchain data as isolated instances, failing to fully exploit the inherently relational and heterogeneous structure. Recently, Graph Neural Networks (GNNs) have emerged as promising solutions for modeling complex interactions within blockchain transaction networks [10,11,12,13]. By representing entities and their relationships as nodes and edges, GNNs can jointly encode topological and attribute-based information, providing a richer and more holistic view of the data.
However, despite their potential, existing GNN-based approaches often assume a single-view representation, concatenating all features into a shared latent space. This practice overlooks the multi-faceted nature of blockchain data, which includes feature modalities ranging from transaction frequency and structural dependencies to temporal dynamics [14]. Treating these features uniformly risks obscuring the subtle, cross-view discrepancies that are essential for identifying complex schemes. For instance, a sophisticated Ponzi scheme may maintain stable structural patterns, while simultaneously exhibiting typical transaction frequencies or time-sensitive anomalies [15,16].
Although prior studies have proposed various feature aggregation strategies within GNNs, they generally fail to exploit the full potential of multi-view representations. Methods such as FraudRE [12] and HeteroEmbed [13], along with techniques designed for heterogeneous graphs like H2GCN [17], do not explicitly disentangle data into multiple views. Consequently, these methods may overlook or dilute important cross-view interactions, limiting their capacity to detect sophisticated fraud patterns. In multi-view learning  [18,19,20,21], a prevalent strategy is to use stochastic perturbation-based data augmentation (e.g., edge modification [19] and feature perturbation [20]) to create multiple views. While successful in some graph representation tasks [19,20,21], these methods are ill-suited for Ponzi scheme detection, due to their low sensitivity to anomalies. Given the similarity between normal and anomalous graphs in real-world datasets, perturbations may inadvertently generate anomaly-like data from normal data, leading to erroneous model behavior [22]. As a result, maximizing cross-view mutual information (MI) could decrease a model’s ability to distinguish between normal and abnormal data, impairing anomaly detection performance [21]. Moreover, perturbation-based methods lack the necessary differentiation, violating the Mutual Information Bottleneck (MIB) principle [18], which requires views to be both distinguishable and mutually redundant.
In summary, despite their potential, existing GNN-based anomaly detection methods exhibit three significant limitations:
(1) Inability to Leverage Multi-Dimensional Data for Fraud Detection. Most GNN-based methods fail to capture the multi-dimensional attributes of smart contract data, which include transaction network structures, contract text, and fund flow dynamics. These features offer complementary information critical for detecting complex fraud. Single-view approaches are unable to capture these multi-dimensional properties. Meanwhile, multi-view strategies relying on perturbation-based data augmentation (e.g., edge or feature perturbations [20]) also prove inadequate, as they reduce differentiation and exhibit low anomaly sensitivity. This shortfall is particularly pronounced in Ponzi scheme detection, where perturbations can introduce anomaly-like data from normal samples, undermining the model’s ability to detect subtle, cross-dimensional fraud patterns [23].
(2) Lack of Dynamic Feature Aggregation Mechanisms, Leading to Information Loss. Existing methods typically rely on fixed weights or basic feature aggregation strategies, rendering them incapable of dynamically adjusting the importance of different feature views under varied data conditions. For example, certain fraud behaviors may manifest prominently in transaction frequency features, while in other cases, temporal dynamics may offer stronger fraud indicators. Fixed-weight feature aggregation strategies can lead to the loss of critical features, thereby impairing detection accuracy [12,13].
(3) Insufficient Cross-View Feature Alignment Capabilities. In multi-view settings, semantic discrepancies among different views often cause information inconsistencies. For instance, an abnormal transaction frequency in one view might not correspond to distinctive features in another. If a model fails to effectively align intra-view and cross-view features, its ability to detect complex fraud patterns diminishes. Furthermore, current methods lack mechanisms to integrate global and local information across views, further limiting their ability to capture multi-dimensional anomaly patterns [24,25].
To address these limitations, we introduce the Multi-View Contrastive Graph Neural Network (MVCG-SPS), a novel framework specifically designed for Ponzi scheme detection in smart contract transactions. Our approach exploits the multi-view nature of blockchain data to enhance fraud detection. The key innovations of MVCG-SPS are as follows:
(1) Multi-View Representation: In contrast to single-view models or multi-view strategies that rely on perturbation-based data augmentation, MVCG-SPS decomposes blockchain data into multiple distinct views through meta-path decomposition. Each view captures specific semantic relationships, such as transaction frequency or call patterns, enriching feature representations. This strategy effectively captures cross-view interactions, strengthening anomaly detection.
(2) Adaptive Multi-View Aggregation: To optimize feature aggregation, MVCG-SPS introduces a reinforcement-learning-based dynamic aggregation mechanism. By dynamically adjusting the contribution of each view, the model adapts to the changing data characteristics in real-world scenarios, thereby improving detection accuracy.
(3) Cross-View Contrastive Learning: MVCG-SPS employs a multi-scale contrastive learning mechanism that aligns and integrates features within and across views. This approach performs multi-scale comparisons of both global and local features, strengthening the consistency of the learned representations, while preserving the unique characteristics of each view. This significantly enhances the robustness and anomaly detection performance of the model.
In summary, MVCG-SPS goes beyond existing GNN approaches by explicitly modeling and exploiting the heterogeneous, multi-faceted structure of blockchain data. Our contributions are fourfold:
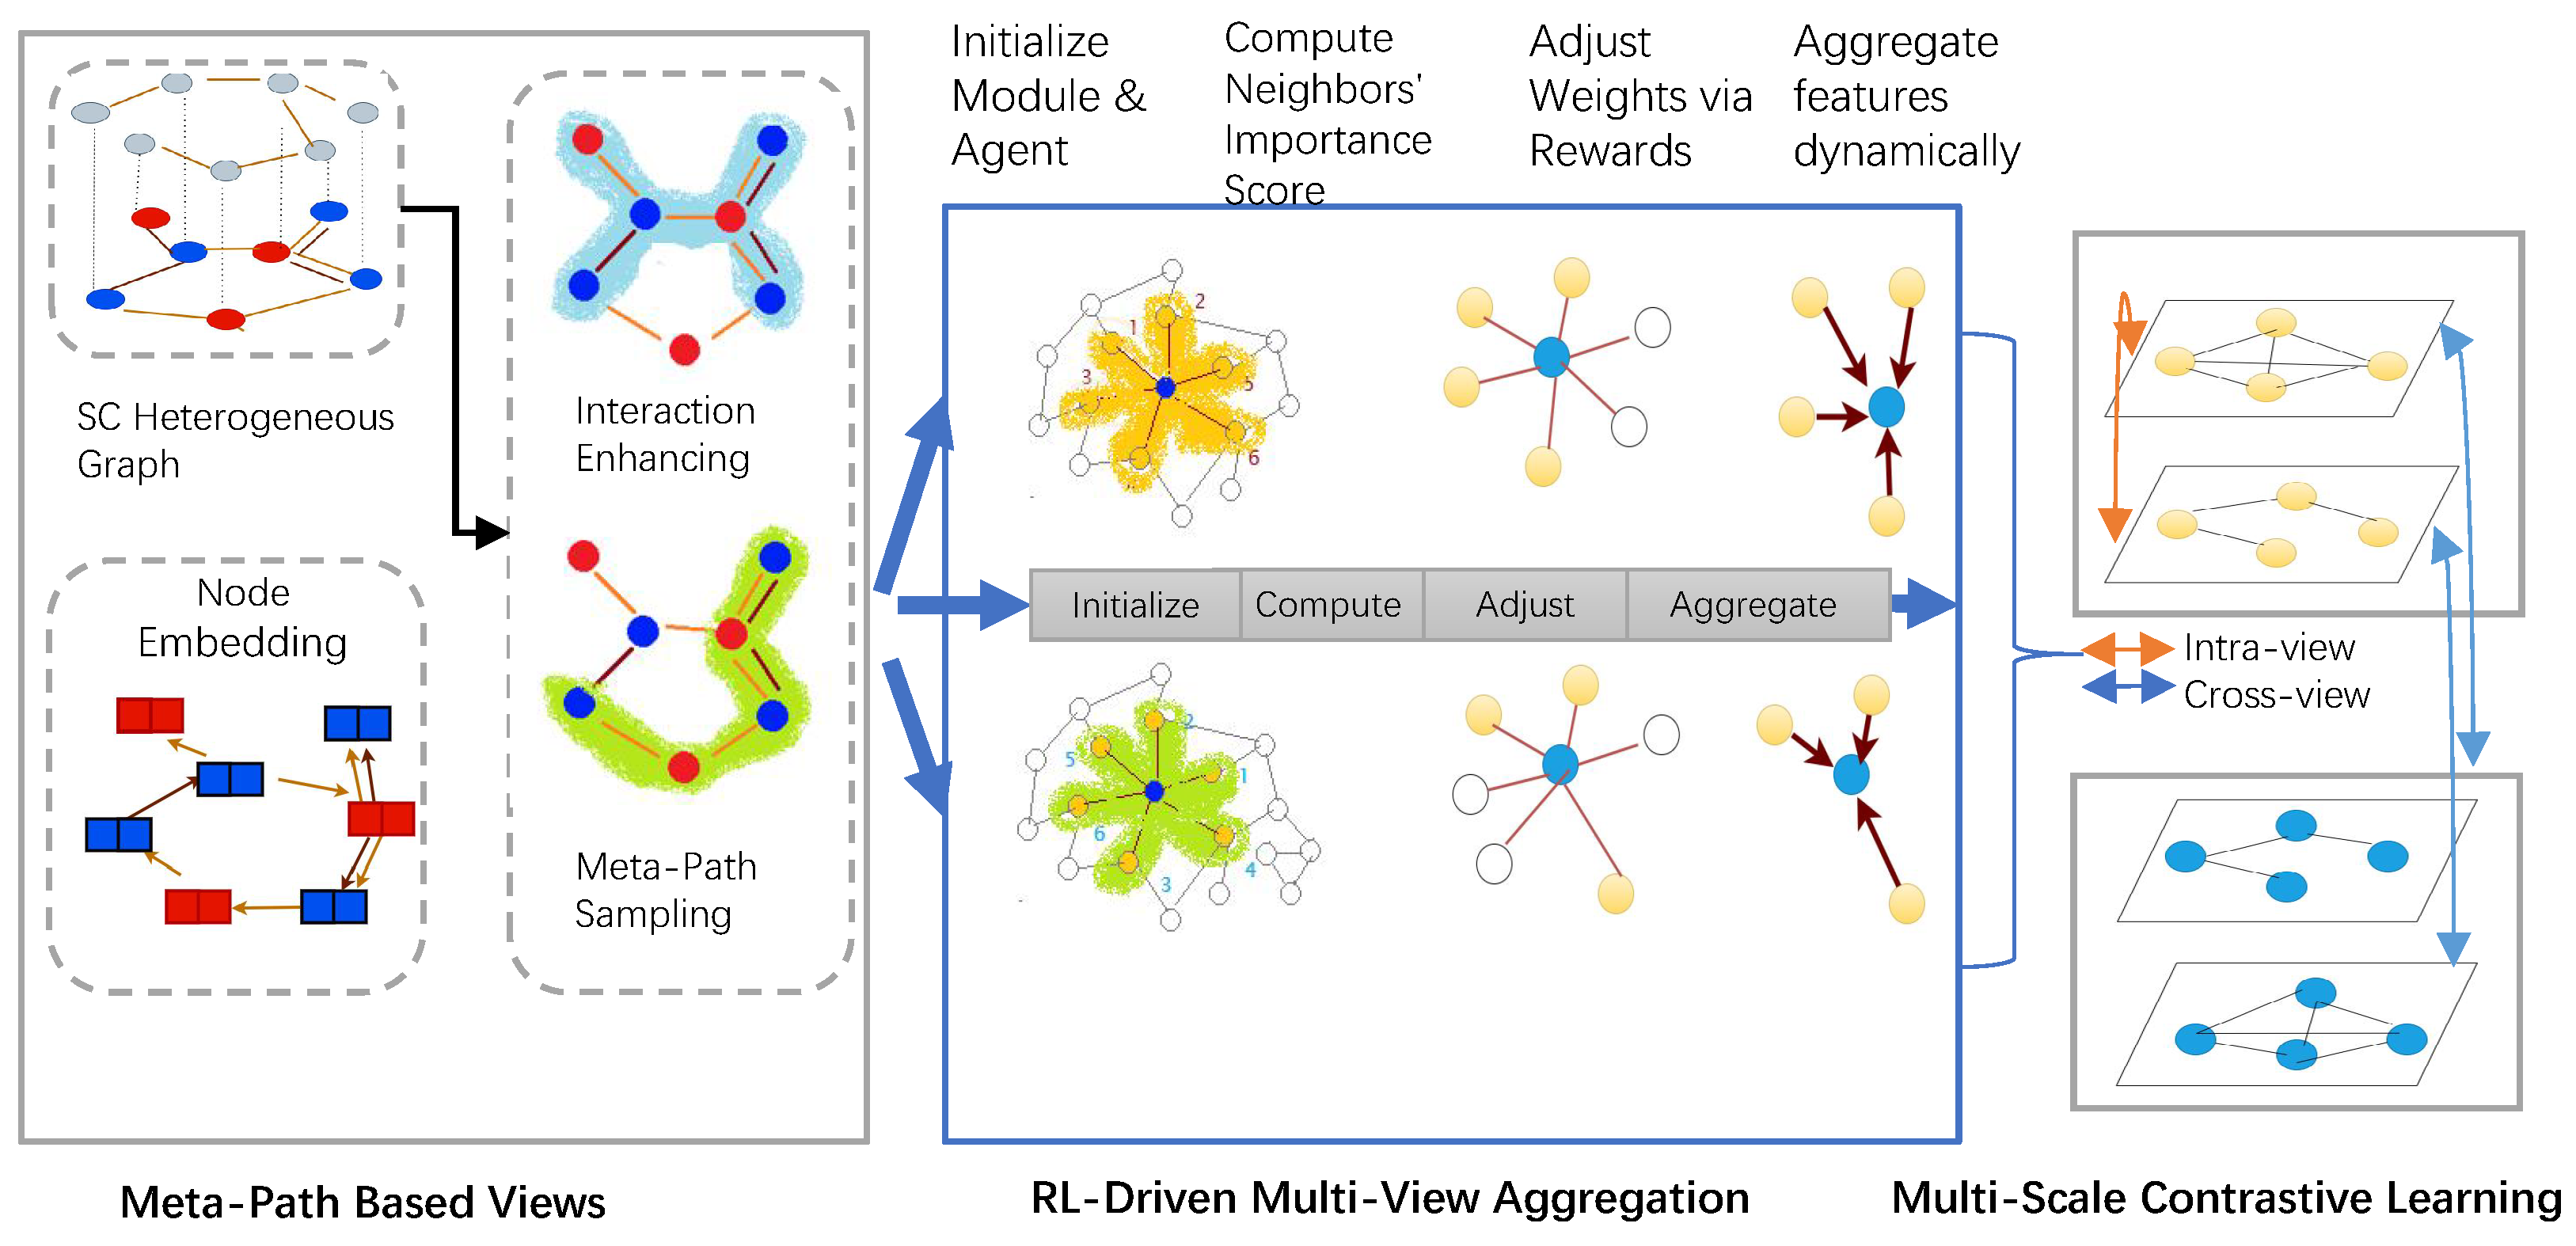
  • We propose a multi-view GNN framework that decomposes blockchain data into distinct meta-path-based views, enabling rich cross-view anomaly detection.
  • We design a meta-path-based view construction module that ensures diverse semantic relationships are well-represented, improving both the interpretability and robustness of the learned embeddings.
  • We integrate a reinforcement-learning-driven aggregation mechanism to dynamically adjust view weights, maximizing the model’s fraud detection capabilities.
  • We implement a contrastive learning approach to align embeddings across views, enhancing the overall robustness and discriminative power of the model.
Extensive experiments on real-world Ethereum datasets demonstrated that MVCG-SPS significantly outperformed state-of-the-art methods across key metrics such as F1 Score, Area Under the Precision–Recall Curve (AUPRC), and Recall at K (RecK). Notably, MVCG-SPS excelled in identifying low-rate anomalies, a critical requirement for high-stakes, real-world financial applications.
The remainder of this paper is organized as follows: Section 2 reviews related works on financial anomaly detection and multi-view graph models. Section 3 provides the necessary preliminary concepts and formal definitions. Section 4 details the methodology of MVCG-SPS, including its key modules and design principles. Section 5 describes the experimental setup and presents empirical results demonstrating the effectiveness of our approach. Finally, Section 6 concludes the paper and discusses potential avenues for future research.

2. Related Work

Graph-based methods for fraud detection, particularly in financial transaction networks, have advanced significantly with the development of Graph Neural Networks (GNNs). In this section, we review existing literature on multi-view graph representation learning, contrastive learning, and the application of GNNs in fraud detection.

2.1. Multi-View Graph Representation Learning

Multi-view graph representation learning has emerged as a powerful paradigm to integrate diverse perspectives of graph data. Early approaches focused on combining multiple Laplacian matrices to adaptively encode different graph views, as exemplified in Multi-View Adaptive Graph Convolution (MV-GCN) [26]. MV-GCN employed hybrid Laplacians to integrate the feature space and graph structure, demonstrating its effectiveness in graph classification tasks. MERIT [27] introduced a multi-scale contrastive learning framework that dynamically re-weights instance-level features using a transformer, enabling it to effectively align node embeddings across views. Recent advances, such as CopulaGNN [28], further extended these methods by leveraging copula functions to model complex dependencies across views, ensuring that representational and relational roles are preserved. These works have laid a strong foundation for multi-view learning, but their focus has largely been on general-purpose graph classification, rather than fraud detection. Our method, MVCG-SPS, builds upon this research by integrating multi-view learning with domain-specific features and temporal information for smart contract fraud detection.

2.2. Graph Neural Networks for Fraud Detection

GNNs have demonstrated exceptional capabilities in modeling complex relationships in financial fraud detection. Relational Graph Neural Networks (RGCNs) [29] were among the early models to process heterogeneous graphs, capturing interactions between accounts, transactions, and entities. Vimal et al. [30] advanced the field by introducing reinforcement learning into fraud detection systems, where dynamic decision-making enhanced the adaptability of fraud detection models. Kim et al. [31] proposed a hybrid approach that integrates graph convolutional networks with reinforcement learning to identify fraudulent patterns in transaction networks, achieving higher accuracy and better adaptability to changing fraud tactics. Additionally, SAMCL [32] proposed subgraph-aligned contrastive learning for anomaly detection, utilizing subgraph similarity to identify fraud in large-scale transaction networks. Despite these advances, most GNN-based fraud detection methods focus on static or single-view graph representations. Static graph methods struggle to capture temporal dynamics and cross-view relationships, which are critical in detecting sophisticated schemes like Ponzi fraud. MVCG-SPS addresses this limitation by integrating temporal, relational, and frequency-aware features across multiple views.

3. Preliminary

3.1. Multi-View Heterogeneous Graph Structure

A multi-view heterogeneous graph, denoted as G MV , is designed to represent interactions within complex systems like smart contract networks, incorporating multiple perspectives or “views” of the same underlying data. Formally, G MV is defined as G MV = { G v v V } , where V represents the set of views, and each view G v is a distinct graph G v = ( N , E v , F v , H v ) . Here, N is a shared set of nodes representing entities (e.g., smart contracts, users), and E v denotes the set of edges specific to view v, capturing relationships or interactions defined by that view. Each node n N is associated with a feature vector f n R d N , while edges e i j E v have view-specific features e i j ( v ) R d E ( v ) . Multiple views G v may represent complementary information, such as transaction frequency, temporal patterns, or functional dependencies, enhancing the ability to capture diverse characteristics of the system.

3.2. Meta-Path-Based Views

In heterogeneous graphs, a meta-path is defined as a sequence of relations connecting different types of entities. Formally, a meta-path is represented as v 1 v 2 v n , where v i denotes a node type, and the arrows denote specific relations. Meta-paths encapsulate the composite relations between the starting node v 1 and the ending node v n , providing a structured representation of semantic interactions.
Each meta-path is treated as a unique meta-path view, containing the semantic information specific to that relationship sequence. For instance, for detecting Ponzi schemes in smart contracts, meta-paths can capture critical interaction patterns indicative of fraudulent behavior. Examples include
1.
E O A C A : Externally Owned Accounts (EOA) to Contract Accounts (CA), representing fund inflows.
2.
C A E O A : CA to EOA, representing fund outflows or transfers.
Constructing views based on these meta-paths yields a multi-view representation of the data. Each meta-path view constructed from these relations provides a distinct perspective on the data, capturing different semantic aspects that are crucial for identifying Ponzi schemes.

3.3. Anomaly Detection in Multi-View Graphs

The goal is to detect anomalies in a multi-view graph, where each view provides a unique perspective on smart contract interactions. For each view v V , the framework learns embeddings Z v R N × D capturing view-specific interaction patterns. These view-specific embeddings are then adaptively aggregated into a unified representation Z agg that preserves cross-view consistency while amplifying behavioral deviations indicative of fraud.
The aggregated embedding Z agg dynamically integrates multi-view features through meta-path-guided fusion, enabling the detection of rare but high-risk fraudulent activities such as Ponzi schemes. By leveraging meta-path-based views and multi-view integration, the anomaly detection framework identifies deviating behaviors across multiple perspectives, significantly enhancing robustness and accuracy.

4. MVCG-SPS Method

The Multi-View Contrastive Graph Neural Network (MVCG-SPS) framework proposed in this paper uses multi-view heterogeneous graphs and graph contrastive learning methods to detect Ponzi schemes in smart contract transactions. As illustrated in Figure 1, the framework consists of the following four stages: (1) Smart Contract Heterogeneous Graph Construction: Construct a heterogeneous graph representation by extracting nodes (EOA, CA) and their interaction relationships (transactions, calls). (2) Meta-Path Based View Decomposition: Generate multiple views using two data augmentation methods: interaction enhancement, and meta-path sampling. Each method enhances different levels of information, capturing complex behavior patterns and diverse semantic relationships in smart contract interactions, thus enhancing representation learning capabilities. (3) Adaptive Multi-View Aggregation: Use reinforcement learning to dynamically adjust the contribution of each view, achieving optimal fusion of multi-view features. (4) Multi-Scale Contrastive Learning: Align embeddings within views and across views using a contrastive learning mechanism, enhancing the consistency and robustness of the representations.

4.1. Smart Contract Heterogeneous Graph Construction

To comprehensively model the complex interaction behaviors in smart contract networks, we designed a heterogeneous graph-based modeling method. The participating entities in the smart contract network include EOA and CA, which interact through various relationships (such as transactions and calls) to form a complex network structure, thus comprehensively characterizing the characteristics and dynamic changes of the blockchain network.
We model the smart contract network as a heterogeneous graph G = ( N , E , T n , T e ) , where
  • N : Node set, including EOA and CA.
  • E : Edge set, capturing interaction relationships between entities, including transaction edges (Pay, Invest Edge) and call edges (Call Edge).
  • T n : Node type set (EOA or CA).
  • T e : Edge type set (Transaction or Call).
Each node n N is associated with a feature vector f n R d n , representing attributes like account balance or contract deployment time, etc.). Each edge e E is associated with a feature vector f e R d e , describing contextual information such as transaction amounts or call frequencies. This structured representation of the smart contract network lays the groundwork for the subsequent multi-view feature extraction and aggregation.

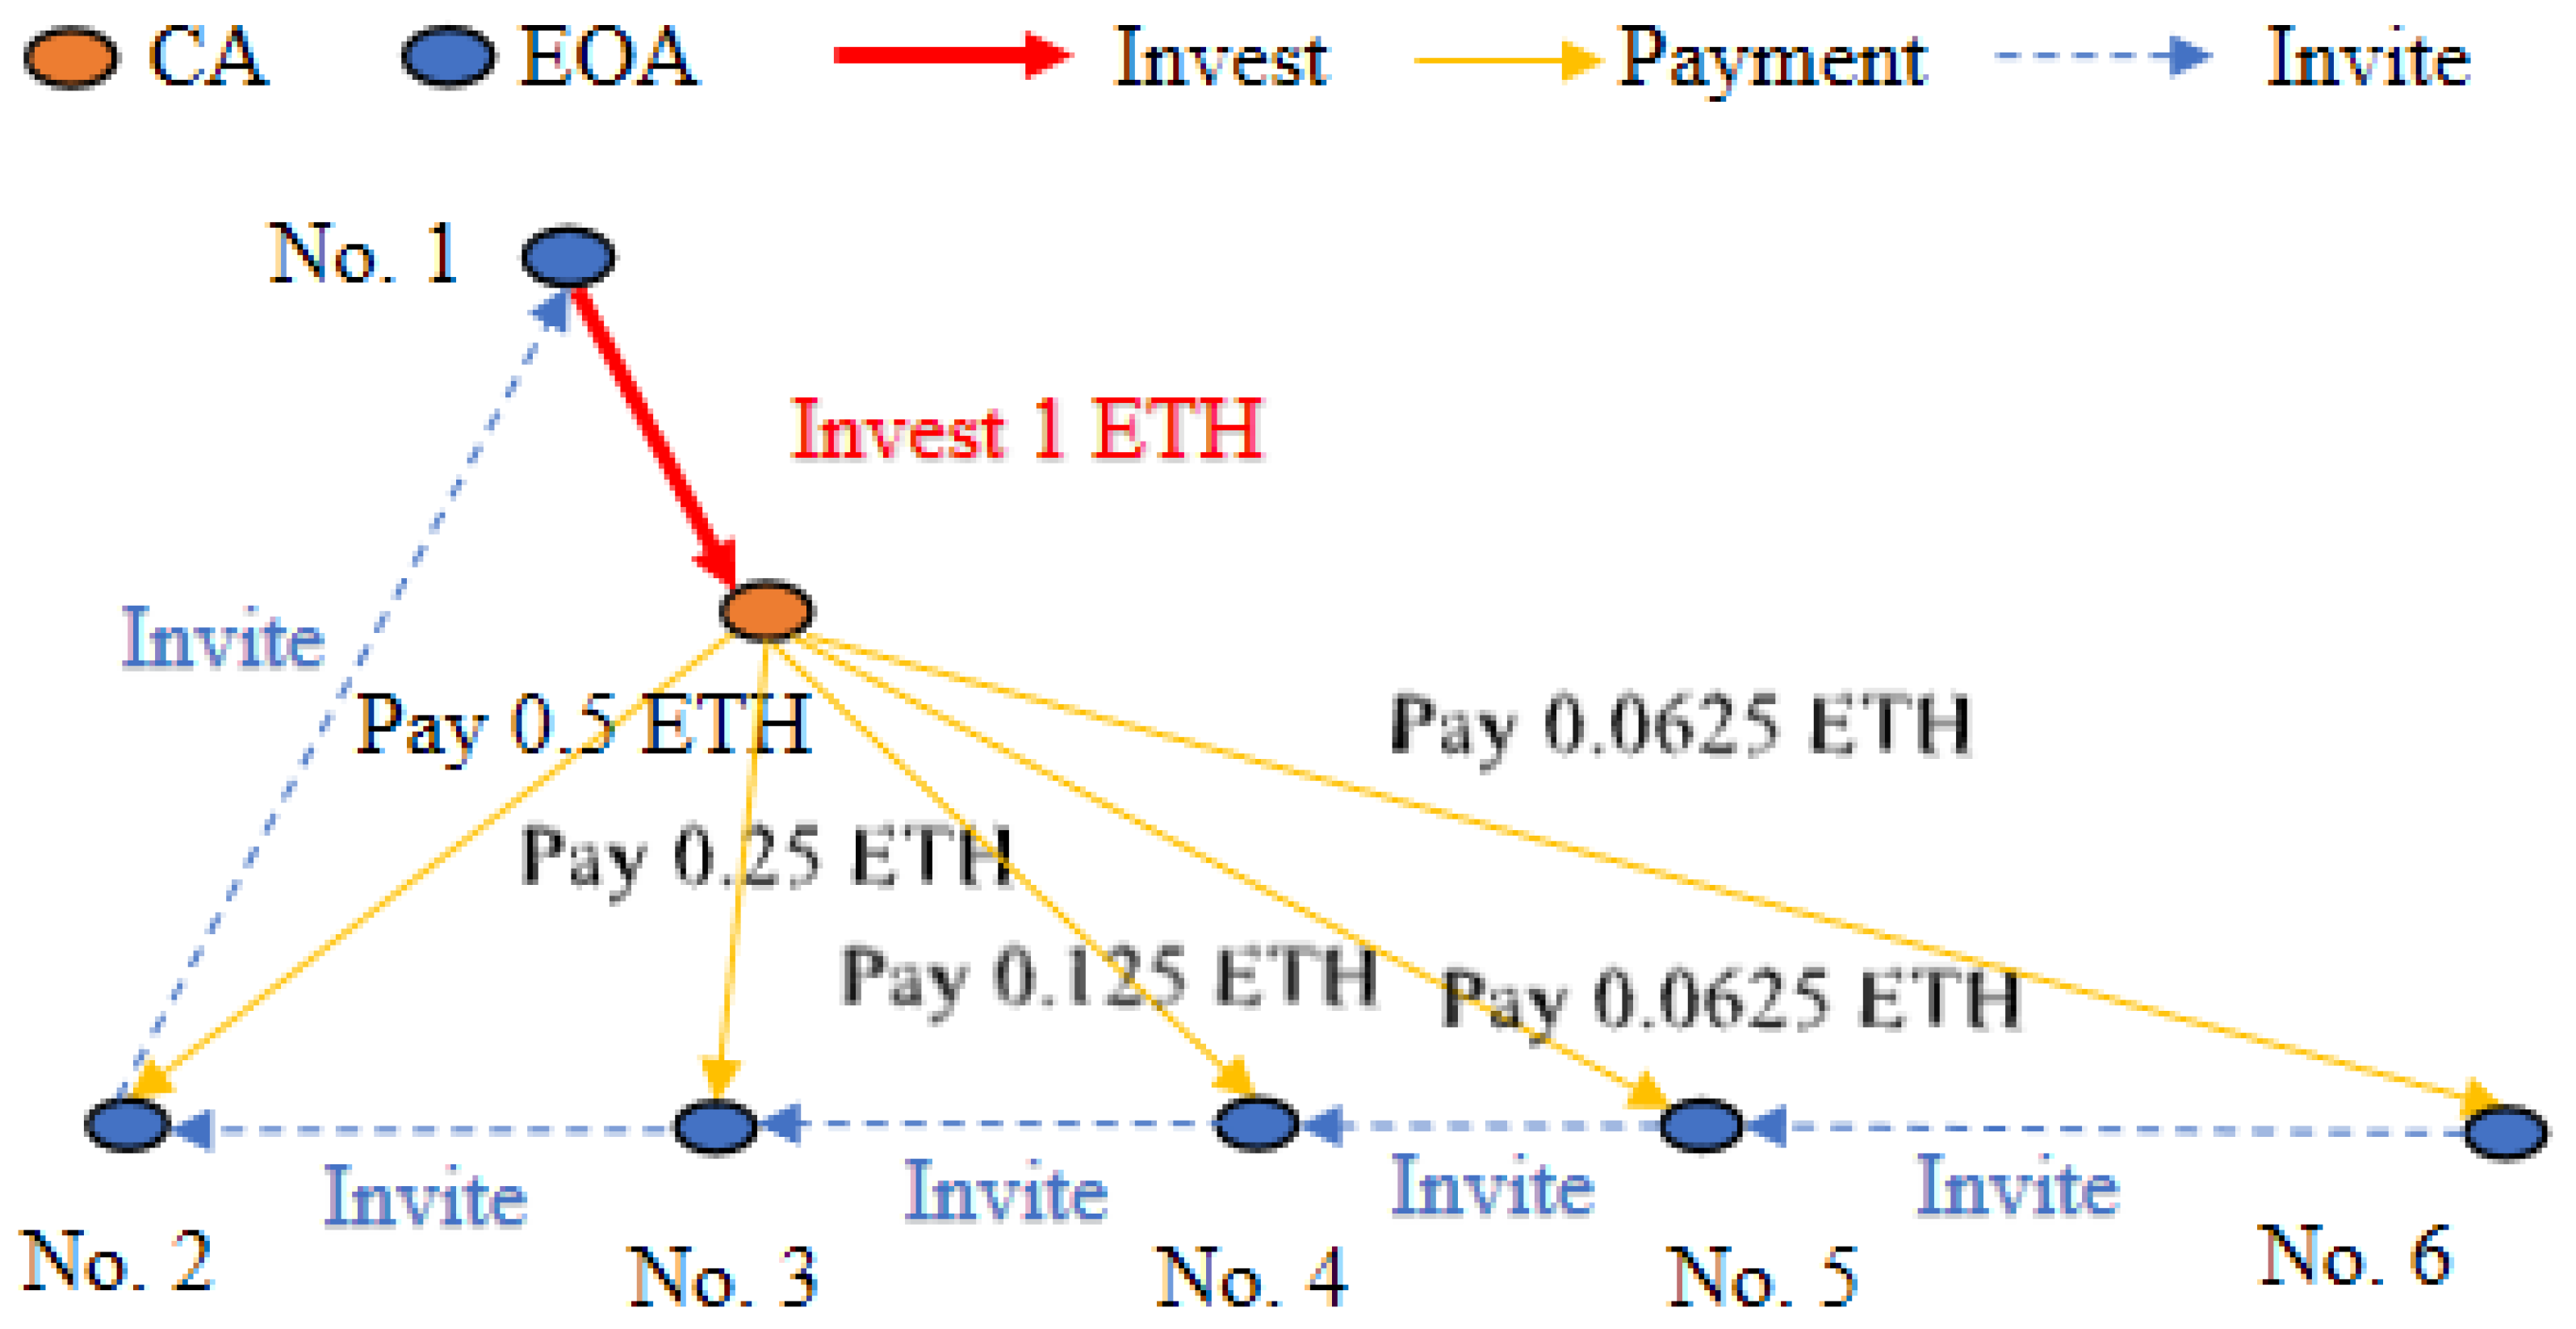
4.2. Meta-Path-Based Multi-View Generation

To effectively capture Ponzi scheme behaviors in smart contract transactions, we combine two distinct data augmentation methods to generate multiple views, thereby enhancing the fraud detection capability. View decomposition captures the node interaction relationships under different semantic contexts, generating highly discriminative feature representations that support the subsequent feature aggregation and contrastive learning. Data augmentation is performed using the following two methods. The chosen meta-paths are derived from domain-specific insights into Ethereum Ponzi schemes. For interaction enhancement, P 1 explicitly models invitation chains, while P 2 captures the investment–payment cycle critical to sustaining Ponzi schemes. For meta-path sampling, P 1 and P 2 focus on contract-triggered fund redistribution, which aligns with the life cycle of fraudulent smart contracts. These paths were prioritized due to their ability to expose the hierarchical and cyclical transaction patterns observed in labeled Ponzi datasets.
1. Interaction Enhancement
The interaction enhancement method generates augmented contrastive instances by expanding the interaction relationships between nodes and edges in the graph. These augmented instances can reveal more potential fraudulent behaviors, especially fund flows across accounts and contracts. By using meta-paths as a guide, we enhance the interaction patterns between contract nodes based on predefined relationships.
The specific implementation steps are as follows:
(1) Use predefined meta-paths P m , starting from the target node, and perform random walks to search for interactions with neighboring nodes. (2) Expand the neighboring nodes, add new interaction relationships, and mark them in the adjacency matrix. (3) Generate an enhanced heterogeneous graph, providing more information for the model to learn.
For example, in Ponzi scheme detection, interaction enhancement can be achieved by expanding the invitation relationships between EOAs to reveal the flow patterns of funds. One EOA invites other EOAs into a smart contract, forming a typical Ponzi scheme network. Figure 2 shows an example of interaction enhancement:
EOA No.1 invests 1 ETH into the CA. In turn, its upstream EOAs each receive a proportional share of returned ETH. For example, EOA No.2, who invited No.1, receives 0.5 ETH; EOA No.3, who invited No.2, obtains 0.25 ETH; and so on, until the root EOA (the contract creator) acquires 0.0625 ETH. This return process illustrates an invitation chain, indicated by blue dashed lines:
  • No.6 → No.5: EOA No.6 invited EOA No.5.
  • No.5 → No.4: EOA No.5 invited EOA No.4.
  • No.4 → No.3: EOA No.4 invited EOA No.3.
  • No.3 → No.2: EOA No.3 invited EOA No.2.
  • No.2 → No.1: EOA No.2 invited EOA No.1.
Through this method, the fund flow forms a typical Ponzi scheme network structure. We generate augmented interaction instances using meta-paths, and these paths help us better identify the flow and distribution of funds, thereby revealing fraudulent behaviors. The following meta-paths are used to generate interaction-enhanced instances:
  • P 1 : E O A invite E O A : Represents the invitation pattern between EOAs.
  • P 2 : E O A invest C A pay E O A : Represents the relationship between smart contracts and external accounts, where external accounts invest in the smart contract and the contract returns the investment to the upstream EOAs, capturing the fund flow.
Interaction enhancement helps the model better identify complex fraudulent behaviors, such as fund transfers between multiple accounts. Below is the pseudocode (Algorithm 1) for generating multi-views based on interaction enhancement:
Algorithm 1 Interaction-Enhancement-Based View Decomposition Algorithm
1:
Input: Heterogeneous graph G = ( N , E , T n , T e ) , predefined meta-path P m
2:
Output: Enhanced subgraph set { G enhanced }
3:
Initialize enhanced subgraph set { G enhanced }
4:
for each target node P T in graph G do
5:
    Start from target node P T , perform random walk based on meta-path P m
6:
    Search for explicit neighborhood T P T and neighborhood of neighbors N P T
7:
    Expand neighbors T P T and N P T to first-order neighbors
8:
    for each node n T P T N P T  do
9:
        Perform random walk based on meta-path P m , searching for more interaction relationships
10:
        Update adjacency matrix, marking new interaction relationships as 1
11:
    end for
12:
    Generate enhanced heterogeneous graph G enhanced
13:
    Add enhanced subgraph G enhanced to { G enhanced }
14:
end for
15:
return { G enhanced }
2. Meta-Path Sampling
The meta-path sampling method extracts subgraphs from the original heterogeneous graph based on predefined meta-paths, generating independent views. These views reveal behaviors such as fund flows, payments, and contract calls, further enhancing the detection of fraudulent activities like Ponzi schemes.
We use the following two meta-paths to generate views related to Ponzi schemes:
  • P 1 : C A t call C A trans E O A call C A : Represents the fund flow pattern where the Ponzi account interacts with external accounts via contract calls.
  • P 2 : E O A call C A t trans E O A trans C A : Describes the behavior pattern where the Ponzi account distributes funds after receiving them, revealing the fund transfer path.
By applying meta-path sampling, we extract subgraphs and generate independent views for each subgraph. These views are then used for further contrastive learning and model training, enhancing the overall detection performance.
Below is the pseudocode (Algorithm 2) for generating multi-views through meta-path sampling:
Algorithm 2 Meta-Path Sampling View Decomposition Algorithm
Input: Heterogeneous graph G = ( N , E , T n , T e )
2:
Output: Set of subgraphs { G P i }
Initialize the set of subgraphs { G P i }
4:
for each meta-path P i  in the predefined set of meta-paths do
     G P i ExtractSubgraph ( G , P i )
6:
    Compute the node features of G P i
    Add G P i to the set { G P i }
8:
end for
return { G P i }

4.3. Reinforcement-Learning-Driven Multi-View Aggregation

The Reinforcement-Learning-Driven Multi-View Aggregation module is a key component in the MVCG-SPS framework, aimed at dynamically optimizing the aggregation of features from multiple views. This module leverages reinforcement learning (RL) to dynamically adjust the feature weights of each view, optimizing the performance of multi-view aggregation, effectively capturing potential correlations between views and avoiding information redundancy, thereby enhancing the representation learning of multi-view graphs.
The module operates under the assumption that not all neighbors contribute positively to the feature aggregation process. Some neighbors may introduce noise, which can hinder the learning of accurate representations, particularly in the context of the complex structures inherent in multi-view graphs. To address this, the RL-based multi-view aggregation module includes two main functions: neighbor importance measurement and filtering threshold calculation. By integrating these components, the RL module enables the MVCG-SPS framework to adaptively learn the optimal filtering threshold for each view, thereby enhancing the feature aggregation and improving multi-view representation learning.
1. Multi-View Aggregation
The process of multi-view feature aggregation is as follows:
Z agg = v V w v · Z v ,
where
  • V represents the set of views,
  • Z v is the node representation of view v,
  • w v is the weight for view v, dynamically optimized by the RL module.
2. Neighbor Importance Measurement
In each view, the importance of a neighbor node to the central node is calculated based on edge weights and node feature similarity. This measure uses a fully connected neural network (FNN) to predict node labels and calculates the similarity between nodes based on their features. The importance score (IMP) for a neighbor node k to the central node k at layer l is computed as follows:
I M P j ( l ) ( k , k ) = A i , j ( k , k ) ( 1 D I S T j ( l ) ( k , k ) )
where A i , j ( k , k ) denotes the edge weight, ⊗ represents the multiplication operation, and D I S T is the Euclidean distance between the central node and its neighboring node, computed based on the output of the FNN, as follows:
D I S T ( l ) ( k , k ) = NORM σ ( F N N ( f k ) ) σ ( F N N ( f k ) ) 2 ,
where F N N is a single-layer fully connected neural network used to predict node labels and generate feature embeddings.
3. RL Module Design
The core task of the RL module is to automatically compute the optimal filtering threshold for each view, to select the most valuable neighboring nodes. This is crucial, as different views may require different thresholds to optimally fuse features. The RL agent performs actions to increase or decrease the filtering threshold based on the reward signal, which is derived from the change in average neighbor importance between iterations.
(1) Action Space
The action of the RL agent is to adjust the threshold, and the action space is defined as { + S , S } , where S is the adjustment step size.
(2) Reward Signal
The reward signal is based on the change in average neighbor importance between the current and previous iterations, defined as
R E W j ( l ) [ p ] = + 1 , if A V G j ( l ) [ p ] > A V G j ( l ) [ p 1 ] 1 , otherwise
where A V G j ( l ) [ p ] represents the average neighbor importance at iteration p.
A V G j ( l ) [ p ] = k N k N ( k ) I M P ( k , k ) k N | N ( k ) | .
The reward function R E W j ( l ) [ p ] measures changes in average neighbor importance, which directly reflects the multi-view aggregation quality. This design aligns with the graph information bottleneck principle [33], enhancing discriminative power, while filtering irrelevant edges. Alternatives like accuracy-based rewards introduced latency, while feature similarity rewards caused over-smoothing.
(3) Termination Condition
The RL module stops training when the reward signal converges over the last T iterations:
T E R = p T p R E W j ( l ) [ p ] ϵ ,
where ϵ is the convergence threshold.
(4) Weight Update Algorithm
The RL algorithm (e.g., REINFORCE) is used to dynamically update the view weights:
w v t + 1 = w v t + α · w R ( w ) ,
where α is the learning rate, and w R ( w ) is the gradient based on the reward signal.
The RL-guided multi-view aggregation proceeds as follows: (1) Initialize the neighbor importance measurement module and the RL agent. (2) In each iteration, compute the importance score of neighbors for each view. (3) Adjust the weights and filtering thresholds for each view according to the reward signal. (4) Dynamically aggregate node features using the updated view weights.
This module enhances the effectiveness of multi-view feature fusion through dynamic and adaptive processes, helping to capture the complex semantic information in multi-view heterogeneous graphs.

4.4. Multi-Scale Contrastive Learning

The core objective of contrastive learning is to minimize the embedding distance between positive sample pairs, while maximizing the embedding distance between negative sample pairs. The Multi-Scale Contrastive Learning (MSCL) module within the MVCG-SPS framework aims to enhance the model’s anomaly detection capabilities by integrating complementary information from different scales of graph representation. The core hypothesis is that the fusion of features at different granularities can provide a more comprehensive perspective on the network structure, which is critical for identifying anomalous behaviors that may not be evident when relying solely on local or global information. This module effectively captures the complex interaction patterns in multi-view heterogeneous graphs by designing contrastive learning loss functions for both within-view and cross-view learning.
1. Formulation of Multi-Scale Contrastive Learning
Let G = ( V , E , X ) denote an attributed graph, where V is the set of nodes, E is the set of edges, and X is the attribute matrix. Through K layers of Graph Convolutional Networks (GCNs), we obtain K different scales of graph representations, denoted as { G ( k ) } k = 1 K , where G ( 1 ) represents the most local information, and G ( K ) represents the most global information.
The goal of the MSCL module is to learn a representation H that minimizes the contrastive loss function L contrastive . The contrastive loss is defined as follows:
L contrastive = 1 N i = 1 N log exp ( sim ( z i , z i + ) ) exp ( sim ( z i , z i + ) ) + j i exp ( sim ( z i , z j ) ) ,
where z i and z i + represent the embeddings of positive sample pairs, z j represents the embedding of negative samples, and sim ( · , · ) is the similarity function (e.g., cosine similarity).
2. Intra-View Contrastive Learning
In intra-view learning, the node embeddings and their corresponding subgraph embeddings need to be aligned. Given the node embedding h i and its corresponding subgraph embedding g i , the intra-view contrastive learning loss is defined as follows:
L intra = 1 N i = 1 N log σ ( h i g i ) j i log σ ( h i g j ) ,
where σ ( x ) is the Sigmoid function used to ensure consistency within the view.
3. Cross-View Subgraph Alignment
Cross-view contrastive learning aims to align non-aligned subgraph pairs generated by different views. Earth Mover’s Distance (EMD) is used to measure the transportation cost between subgraph distributions:
EMD ( P , Q ) = inf γ Γ ( P , Q ) ( p , q ) P × Q γ ( p , q ) p q ,
where Γ ( P , Q ) represents all possible transportation plans between distributions P and Q.
The cross-view contrastive loss is defined as follows:
L inter = 1 M i = 1 M EMD ( S i ( 1 ) , S i ( 2 ) ) ,
where S i ( 1 ) and S i ( 2 ) are the subgraph embeddings from two different views.
4. Multi-Scale Loss Integration
Multi-scale contrastive learning integrates local and global information, and the final loss function is
L total = λ intra L intra + λ inter L inter ,
where λ intra and λ inter are the weight factors for intra-view and cross-view losses, used to balance their importance.
Subgraph embeddings are generated using a graph convolution encoder. Data augmentation techniques include edge random dropping and feature masking, to enhance the effectiveness of contrastive learning. Additionally, by adjusting the subgraph size (e.g., K 1 , K 2 ) and the weight factors λ intra and λ inter , the model performance is optimized (Algorithm 3).
The multi-scale contrastive learning module can capture the semantic and structural characteristics of heterogeneous graphs, significantly improving detection accuracy and model robustness in tasks such as Ponzi scheme detection and anomaly detection.
Algorithm 3 Multi-Scale Contrastive Learning
1:
Input: Heterogeneous graph G = ( V , E , X ) , node embeddings h i , graph convolutional layers K
2:
Output: Optimized node embeddings z i
3:
for each graph convolution layer k [ 1 , K ]  do
4:
    Compute multi-scale graph representations G ( k )
5:
    for each node pair i , j  do
6:
        Calculate positive and negative sample embeddings z i and z j
7:
        Compute contrastive loss L contrastive
8:
    end for
9:
    Update the node embeddings z i based on the contrastive loss
10:
end for
11:
Compute intra-view and inter-view contrastive losses L intra and L inter
12:
Combine losses to get total loss L total
13:
Return optimized embeddings z i

5. Experiments

5.1. Dataset Preprocessing

For our experiments focused on detecting Ponzi schemes within the Ethereum ecosystem, we utilized datasets extracted from the “Heterogeneous Feature Augmentation for Ponzi Detection in Ethereum” study [34]. Specifically, we employed the **Heterogeneous Ghet** dataset, which encompasses 57,130 nodes and 156,255 edges, and includes 4616 CAs and 52,514 EOAs, with 69,653 call edges and 86,602 transaction edges, labeled with 191 Ponzi accounts(see Table 1).
To prepare these datasets for our MVCG-SPS model, we conducted a meticulous preprocessing phase. The graph construction involved nodes representing Ethereum accounts (both CAs and EOAs) and edges denoting various interactions, such as transactions and contract calls. Node features were meticulously extracted to reflect account behaviors, including but not limited to the average transaction amount and the frequency of contract deployments.
These features were processed using a Meta-Path Based View approach to construct multiple heterogeneous views of the data, capturing different semantic relationships and complementary information. This approach allowed us to better integrate diverse perspectives, including the transaction frequency, fund flows, and functional dependencies, which are crucial for detecting complex fraudulent behaviors in blockchain ecosystems.

5.2. Evaluation Metrics

Given the imbalanced nature of financial fraud datasets, selecting appropriate evaluation metrics is critical. We adopted the following metrics, which are widely used in anomaly and fraud detection literature:
1. F1 Score: A harmonic mean of precision and recall, the F1 score evaluates the balance between false positives and false negatives, providing a comprehensive performance measure. 2. AUPRC: Focuses on the model’s ability to distinguish fraudulent transactions in highly imbalanced datasets, emphasizing precision over recall. 3. RecK: Measures the effectiveness of the model in prioritizing critical anomalies among the top-K predictions. This metric is particularly valuable in operational fraud detection scenarios, where quick responses to high-risk cases are required.
These metrics collectively provide a holistic assessment of the model’s detection capabilities, covering anomaly identification accuracy and prioritization performance.

5.3. Baselines

To evaluate MVCG-SPS, we compared it against representative methods from various categories, including traditional machine learning models, homogeneous and heterogeneous graph neural networks (GNNs), and state-of-the-art perturbation-based multi-view methods commonly used in blockchain fraud detection tasks:
1. Machine Learning Methods: Random Forest (RF) employs ensemble decision trees combined with manually engineered transaction features to classify accounts [35]. XGBoost is an optimized gradient boosting framework that is effective at handling structured tabular data and widely applied in fraud detection tasks [36].
2. Homogeneous Graph Methods: GCN aggregates neighborhood structural information via convolutional operations, capturing relational patterns among homogeneous nodes [10]. Simple Graph Convolution (SGC) streamlines a GCN by removing non-linearities between layers, reducing computational complexity for larger graphs [37]. Graph Isomorphism Network (GIN) employs injective aggregation strategies to effectively distinguish unique graph structures, improving the representational capability [38]. GraphSAGE generates inductive node embeddings by sampling local neighborhoods and aggregating their features, making it scalable for large graphs [39]. Graph Attention Network (GAT) enhances node embedding by assigning adaptive attention weights to neighbors, emphasizing significant local interactions [11].
3. Heterogeneous Graph Methods: RGCN extends graph convolutions to heterogeneous graphs, explicitly modeling different node and edge types [29]. Relational Graph Attention Network (RGAT) combines multi-head attention mechanisms with relation-specific transformations, capturing heterogeneous relationships [40]. Heterogeneous Graph Transformer (HGT) utilizes transformer-style attention to model complex interactions across multiple types of nodes and edges, enhancing representational accuracy [41].
4. Perturbation-Based Methods: Contrastive Multi-View Representation Learning (MVGRL) creates augmented graph views through random perturbations and aligns embeddings via contrastive learning, improving robustness [42]. Multi-View Embedding with Re-weighted Instance and Transformer (MERIT) dynamically integrates multiple graph views through transformer-based re-weighting of instances, enhancing representation flexibility [27].
These baselines cover a diverse set of methodologies, ensuring a comprehensive comparison of MVCG-SPS’s performance in detecting Ponzi schemes within Ethereum-based smart contracts.

5.4. Results and Analysis

5.4.1. Performance Evaluation

To evaluate the performance of MVCG-SPS, we compared its results with state-of-the-art baseline models.
Table 2 presents a performance comparison of the MVCG-SPS model against several baseline models on the Heterogeneous Ghet dataset. The evaluation metrics included F1 score, AUPRC, and RecK, which comprehensively assessed the anomaly detection performance from the perspectives of overall performance, adaptability to class imbalance, and high-risk detection capability.
1. Overall Performance (F1 Score): The F1 score of MVCG-SPS reached 0.902, significantly higher than the highest score of 0.889 achieved by the MERIT model. The F1 score, as the harmonic mean of precision and recall, reflected the model’s ability to balance false positives and false negatives. Compared to the baseline models, the high score of MVCG-SPS indicated stronger robustness and generalization in accurately identifying Ponzi scheme transactions.
2. Adaptability to Class Imbalance (AUPRC): MVCG-SPS also excelled in the AUPRC metric, achieving a score of 0.891, which was about 2.2% higher than the closest competitor, MERIT (0.872). Since AUPRC focuses on the precision of the positive class rather than overall accuracy, it is more representative for datasets with severe class imbalances. The advantage of MVCG-SPS is attributed to its multi-view feature aggregation and contrastive learning mechanism, which effectively capture key information from multiple views, such as transaction frequency and call relationships, thereby enhancing anomaly detection in complex data distributions.
3. High-Risk Priority Detection (Top-K Recall): In real-world scenarios, the early detection of high-risk anomalies is critical. MVCG-SPS also achieved the highest score for the RecK metric, with a value of 0.871, 1.6% higher than the nearest competitor, MERIT. Top-K recall evaluates a model’s ability to successfully identify anomalies among the high-risk transactions ranked at the top. This result demonstrates that MVCG-SPS can effectively filter out potential high-risk Ponzi schemes in the early stages, providing a more reliable basis for subsequent interventions and decisions.
While the traditional ML methods (XGBoost, RF) achieved moderate performance, their reliance on manual feature engineering limits their capability to capture multi-step fraud patterns. MVCG-SPS outperformed non-graph baselines like Random Forest (F1: +13.1%) and XGBoost (F1: +12.1%), demonstrating the necessity of graph-based modeling for relational fraud detection. A superior AUPRC (0.891 vs. 0.752) further confirmed that graph-based learning better handled class imbalance by exploiting topological anomaly signals. Compared to traditional graph neural networks (e.g., GCN and SGC), MVCG-SPS showed a clear advantage, indicating that simple single-view methods struggle to capture the complex interaction patterns in blockchain data. Additionally, compared to models that support heterogeneous graphs (e.g., HGT and RGCN), MVCG-SPS showcased its unique advantage in multi-view feature decomposition and adaptive aggregation. Compared to perturbation-based multi-view methods such as MVGRL and MERIT, the improved performance of MVCG-SPS demonstrated that semantic-aware meta-paths are more robust than random perturbations for fraud detection.

5.4.2. Ablation Study

To understand the contribution of each module in MVCG-SPS, we performed an ablation study by systematically removing key components of the model. The configurations analyzed included the following:
1. MVCG-SPS (Full Model): The complete model with all modules. 2. MVCG-SPS w/o RL: Removing reinforcement-learning-driven multi-view aggregation. 3. MVCG-SPS w/o MSCL: Excluding the multi-scale contrastive learning module. 4. MVCG-SPS w/o MPBV: Removing the meta-path-based view decomposition module.
Table 3 presents the results of the ablation study. The full MVCG-SPS model achieved the highest scores across all metrics, underscoring the effectiveness of each integrated module.
1. MVCG-SPS (Full Model): The complete MVCG-SPS model incorporated meta-path-based view decomposition, reinforcement-learning-driven multi-view aggregation, and multi-scale contrastive learning modules. This configuration achieved the best performance, with an F1 Score of 0.902, an AUPRC of 0.891, and a Rec@K of 0.871. The synergy of these modules allows the model to capture semantic diversity, dynamically adjust view contributions, and enhance feature alignment, culminating in superior anomaly detection capabilities.
2. MVCG-SPS (w/o RL): Removing the reinforcement-learning-driven multi-view aggregation module resulted in a decrease in F1 Score to 0.879, AUPRC to 0.861, and Rec@K to 0.843. This decline of approximately 3.4% in F1 Score and 3.2% in Rec@K highlights the critical role of adaptive weight adjustment in effectively merging multi-view features. Without the RL aggregation module, the model struggled to prioritize important views, leading to suboptimal feature fusion and reduced detection performance.
3. MVCG-SPS (w/o MSCL): Excluding the multi-scale contrastive learning module led to an F1 Score of 0.868, an AUPRC of 0.853, and a Rec@K of 0.835. The absence of this module diminished the model’s ability to align and integrate global and local features, thereby weakening its robustness and capacity to detect complex interaction patterns within the data.
4. MVCG-SPS (w/o MPBV): The removal of the meta-path-based view decomposition module resulted in the most significant performance drop, with the F1 Score decreasing to 0.854, AUPRC to 0.840, and Rec@K to 0.822. This substantial decline underscores the importance of meta-path-based view decomposition in capturing the multifaceted semantic relationships within blockchain data. Without this module, the model lost its ability to analyze transaction behaviors from multiple perspectives, severely impairing its anomaly detection effectiveness.
The results unequivocally demonstrate that each module within MVCG-SPS contributes significantly to the overall performance. The meta-path-based view decomposition enhances semantic modeling by capturing hierarchical invitation chains and investment cycles, while the RL-driven aggregation optimizes view weight contributions, and the multi-scale contrastive learning ensures effective feature alignment. Notably, removing meta-path decomposition caused the largest performance degradation (5.3% F1 drop), emphasizing its role as the cornerstone of the framework’s ability to model Ethereum-specific fraud behaviors.

5.4.3. Sensitivity Analysis

To investigate how hyperparameter choices affected the performance of MVCG-SPS, we focused on three critical aspects: meta-path selection, the number of meta-path views V in the meta-path-based view decomposition, and the reward discount factor γ in the reinforcement-learning-driven aggregation.
All hyperparameters were tuned using an exhaustive grid search (and Bayesian optimization for selected parameters) on a dedicated validation set. For each parameter, we defined a reasonable search space, informed by preliminary experiments and prior work (see Table 4). Models were trained on the training data, with a reserved validation subset used solely for evaluation, and the optimal configuration was chosen based on the highest validation accuracy.
Our analysis of meta-path selection revealed that alternative configurations significantly impacted the detection performance. Replacing P 2 in the interaction enhancement module with a meta-path emphasizing temporal transactions,
CAt pay EOA invite EOA ,
resulted in a 3.1% reduction in F1 Score (from 0.902 to 0.874) and a similar drop in AUPRC (from 0.891 to 0.863). In contrast, adding an extra sampling meta-path,
EOA trans EOA call CA ,
improved the F1 Score by 2.4% (to 0.924) and increased AUPRC to 0.912, although this incurred an 18% increase in runtime. These findings, summarized in Table 5, underscore that, while alternative meta-paths can offer marginal improvements in some metrics, they also introduce trade-offs in computational cost. Our current configuration thus represents a balanced trade-off between detection performance and efficiency, while remaining adaptable to other fraud detection scenarios.
The number of meta-path views V was varied over the set { 2 , 3 , 5 , 7 } . Increasing V from 2 to 5 yielded significant performance improvements, because additional views captured richer semantic information. However, when V was increased to 7, the performance plateaued or slightly declined, likely due to redundancy and the introduction of noise. Similarly, we evaluated the reward discount factor γ over { 0.5 , 0.7 , 0.9 , 0.99 } . Our experiments indicated that increasing γ generally enhances performance, with the optimal value found to be 0.9; values above 0.9 lead to marginal decreases, as the model becomes less sensitive to short-term reward signals. Figure 3 illustrates the sensitivity of MVCG-SPS with respect to both V and γ .
In summary, our sensitivity analysis highlighted the critical role of hyperparameter tuning. The experiments demonstrated that preserving investment–payment semantics in meta-path design is essential. A moderate number of meta-path views (approximately 5) captures diverse semantic nuances without introducing redundancy, while an optimal reward discount factor of 0.9 effectively balances long-term and short-term rewards. These insights confirm the robustness of MVCG-SPS to parameter variations and provide a solid reference for future research in multi-view GNN-based blockchain fraud detection.

5.4.4. Explainability Analysis

To enhance interpretability, we conducted a SHAP (SHapley Additive exPlanations) analysis on a representative Ponzi scheme case (Table 6). The results highlight that features such as upstream invitations (SHAP value = +0.23) and investment-to-payment ratio (SHAP value = +0.19) are critical discriminators. These findings align with known Ponzi scheme mechanics, where hierarchical recruitment and unsustainable returns are hallmark traits. Such interpretability not only validates MVCG-SPS’s decision logic but also provides actionable insights for forensic analysts.

5.4.5. Complexity and Scalability

We analyzed the computational complexity and scalability of our approach. Let N, E, M, and d denote nodes, edges, views, and feature dimension, respectively. The time complexity of our method is governed by multiple components. The interaction enhancement phase, which involves meta-path-guided random walks, operates in O ( N · L ) , where L is the average walk length. The feature encoding process, executed by type-specific MLPs for multi-view aggregation, incurs a cost of O ( N · d 2 ) . Additionally, the computation of contrastive loss, thanks to the use of negative sampling, scales as O ( M · N ) . In terms of space complexity, storing the sparse adjacency matrix requires O ( N + E ) space, and maintaining multi-view features demands O ( M · N · d ) space.
  • Time: O ( N · L ) (interaction enhancement) + O ( N · d 2 ) (encoding) + O ( M · N ) (contrastive loss)
  • Space: O ( N + E ) (sparse adjacency) + O ( M · N · d ) (multi-view features)
Scalability experiments conducted on synthetic graphs further demonstrated the efficiency of our approach. As shown in Table 7, the training time per epoch increased linearly with the number of nodes, achieving an R 2 of 0.98, which indicated an excellent parallelization performance. Furthermore, the GPU memory usage increased sublinearly, with a graph of 1 million nodes requiring only 0.5 GB of memory. Importantly, the F1 score remained robust across various scales, confirming that our model maintained a competitive detection performance even as the dataset size grew.

6. Conclusions

This paper introduced MVCG-SPS, a novel Multi-View Contrastive Graph Neural Network designed to detect Ponzi schemes in smart contract transactions. By incorporating meta-path-based view construction, reinforcement-learning-driven aggregation, and multi-scale contrastive learning, MVCG-SPS effectively addresses the challenges posed by the heterogeneous and dynamic nature of blockchain interactions.The empirically chosen two-layer GCN structure addresses the performance degradation caused by over-smoothing in deeper architectures. Experimental evaluations on real-world Ethereum datasets demonstrated MVCG-SPS’s superior performance over state-of-the-art baselines across F1 Score, AUPRC, and Rec@K metrics. The framework excelled at handling imbalanced datasets, highlighting its robustness in detecting subtle yet critical anomalies within blockchain transactions. Ablation studies further confirmed the essential contributions of the meta-path view construction and multi-scale contrastive learning mechanisms. While MVCG-SPS is designed for platform-agnostic fraud detection, its current validation remains limited to Ethereum and Ponzi scheme detection. Real-world deployment challenges and the need for enhanced explainability (e.g., causal analysis) require further investigation. Future work will focus on extending MVCG-SPS to diverse blockchain ecosystems (e.g., Solana, Binance Smart Chain) by adapting modular components to platform-specific interactions and emerging fraud patterns (e.g., phishing, money laundering), while developing adaptive meta-path frameworks with continual learning to automate dynamic adjustments. Additionally, we plan to optimize real-time deployment through model pruning and incremental learning, validate operational feasibility via DeFi platform partnerships, and prioritize cross-chain fraud detection alongside IoT security applications for evolving decentralized systems.

Author Contributions

Conceptualization, data curation, methodology, software, writing, X.J.; validation, W.-T.T. All authors have read and agreed to the published version of the manuscript.

Funding

This research received no external funding.

Institutional Review Board Statement

Not applicable.

Informed Consent Statement

Not applicable.

Data Availability Statement

The raw data supporting the conclusions of this article will be made available by the authors on request.

Conflicts of Interest

Author Wei-Tek Tsai was employed by the company Tiande Company. The remaining author declares that the research was conducted in the absence of any commercial or financial relationships that could be construed as a potential conflict of interest.

References

  1. Hassan, M.U.; Rehmani, M.H.; Chen, J. Anomaly detection in blockchain networks: A comprehensive survey. IEEE Commun. Surv. Tutorials 2022, 25, 289–318. [Google Scholar] [CrossRef]
  2. Chen, W.; Zheng, Z.; Cui, J.; Ngai, E.; Zheng, P.; Zhou, Y. Detecting ponzi schemes on ethereum: Towards healthier blockchain technology. In Proceedings of the 2018 World Wide Web Conference, Lyon, France, 23–27 April 2018; pp. 1409–1418. [Google Scholar]
  3. Fernandes, G.; Rodrigues, J.J.; Carvalho, L.F.; Al-Muhtadi, J.F.; Proença, M.L. A comprehensive survey on network anomaly detection. Telecommun. Syst. 2019, 70, 447–489. [Google Scholar] [CrossRef]
  4. Quinlan, J.R. Induction of decision trees. Mach. Learn. 1986, 1, 81–106. [Google Scholar] [CrossRef]
  5. Chandola, V.; Banerjee, A.; Kumar, V. Anomaly detection: A survey. Acm Comput. Surv. (CSUR) 2009, 41, 1–58. [Google Scholar] [CrossRef]
  6. Callegari, C.; Coluccia, A.; D’Alconzo, A.; Giordano, S. A Methodological Overview on Anomaly Detection. In Data Traffic Monitoring and Analysis; Springer: Berlin/Heidelberg, Germany, 2013; pp. 148–183. [Google Scholar] [CrossRef]
  7. LeCun, Y.; Bengio, Y.; Hinton, G. Deep learning. Nature 2015, 521, 436–444. [Google Scholar] [CrossRef]
  8. Khan, S.; Yairi, T. A Review of Machine Learning and Deep Learning Techniques for Anomaly Detection. Appl. Sci. 2021, 11, 5320. [Google Scholar] [CrossRef]
  9. Khan, S.; Madden, M.G. A comprehensive survey of anomaly detection techniques for high dimensional big data. J. Big Data 2014, 2, 1–22. [Google Scholar] [CrossRef]
  10. Kipf, T.N.; Welling, M. Semi-supervised classification with graph convolutional networks. arXiv 2016, arXiv:1609.02907. [Google Scholar]
  11. Velickovic, P.; Cucurull, G.; Casanova, A.; Romero, A.; Lio, P.; Bengio, Y. Graph attention networks. Stat 2017, 1050, 10–48550. [Google Scholar]
  12. Zhang, Z.; Zhang, J.; Xie, R.; Dai, H.; Yuan, B.; Wang, W.; Philip, S.Y. FRAUDRE: Fraud Detection in Ethereum via Learning Representations of Transaction Subgraphs. In Proceedings of the 27th ACM SIGKDD Conference on Knowledge Discovery & Data Mining, Virtually, 14–18 August 2021; pp. 2954–2962. [Google Scholar] [CrossRef]
  13. Liu, Y.; Zheng, V.W.; Zhao, Z.; Li, K.C.C. HeteroEmbed: Heterogeneous Information Network Embedding for Fraud Detection. In Proceedings of the 43rd International ACM SIGIR Conference on Research and Development in Information Retrieval, Virtually, 25–30 July 2020; pp. 1111–1120. [Google Scholar] [CrossRef]
  14. Zhang, X.; Yang, H.; Zhang, C.; Chawla, N.V. Graph Neural Networks for Multi-View Learning: A Taxonomic Review. Artif. Intell. Rev. 2024, 57, 341. [Google Scholar]
  15. Rossi, E.; Chamberlain, B.; Frasca, F.; Eynard, D.; Monti, F.; Bronstein, M. Temporal Graph Networks for Deep Learning on Dynamic Graphs. arXiv 2020, arXiv:2006.10637. [Google Scholar]
  16. Yang, X.; Li, X.; Yang, J.; Ming, Q.; Wang, W.; Tian, Q.; Yan, J. Beyond the Spectrum: Detecting Deepfakes via Re-Synthesis. arXiv 2021, arXiv:2105.14376. [Google Scholar]
  17. Zhu, J.; Yan, Y.; Zhao, L.; Heimann, M.; Akoglu, L.; Koutra, D. Beyond Homophily in Graph Neural Networks: Current Limitations and Effective Designs. In Proceedings of the Advances in Neural Information Processing Systems, Virtually, 6–12 December 2020; Curran Associates, Inc.: Red Hook, NY, USA, 2020; Volume 33, pp. 15987–16002. [Google Scholar]
  18. Federici, M.; Dutta, A.; Forré, P.; Kushman, N.; Akata, Z. Learning robust representations via multi-view information bottleneck. In Proceedings of the International Conference on Learning Representations, Addis Ababa, Ethiopia, 30 April 2020. [Google Scholar]
  19. You, Y.; Chen, T.; Sui, Y.; Chen, T.; Wang, Z.; Shen, Y. Graph contrastive learning with augmentations. Adv. Neural Inf. Process. Syst. 2020, 33, 5812–5823. [Google Scholar]
  20. Zhu, Y.; Xu, Y.; Yu, F.; Liu, Q.; Wu, S.; Wang, L. Graph contrastive learning with adaptive augmentation. In Proceedings of the Web Conference 2021, Ljubljana, Slovenia, 19–23 April 2021; pp. 2069–2080. [Google Scholar]
  21. Liu, Y.; Zheng, Y.; Zhang, D.; Lee, V.C.; Pan, S. Beyond smoothing: Unsupervised graph representation learning with edge heterophily discriminating. In Proceedings of the AAAI conference on artificial intelligence, Montréal, QC, Canada, 8–10 August 2023; Volume 37, pp. 4516–4524. [Google Scholar]
  22. Golan, I.; El-Yaniv, R. Deep anomaly detection using geometric transformations. In Proceedings of the Advances in Neural Information Processing Systems, Montréal, QC, Canada, 3–8 December 2018; Volume 31. [Google Scholar]
  23. Cheng, D.; Wang, X.; Zhang, Y.; Zhang, L. Graph neural network for fraud detection via spatial-temporal attention. IEEE Trans. Knowl. Data Eng. 2020, 34, 3800–3813. [Google Scholar] [CrossRef]
  24. Akoglu, L.; Tong, H.; Koutra, D. Graph based anomaly detection and description: A survey. Data Min. Knowl. Discov. 2015, 29, 626–688. [Google Scholar] [CrossRef]
  25. Peng, Z.; Luo, M.; Li, J.; Xue, L.; Zheng, Q. A deep multi-view framework for anomaly detection on attributed networks. IEEE Trans. Knowl. Data Eng. 2020, 34, 2539–2552. [Google Scholar] [CrossRef]
  26. Adaloglou, N.; Vretos, N.; Daras, P. Multi-view adaptive graph convolutions for graph classification. In Proceedings of the Computer Vision–ECCV 2020: 16th European Conference, Glasgow, UK, 23–28 August 2020; Proceedings, Part XXVI 16. Springer: Berlin/Heidelberg, Germany, 2020; pp. 398–414. [Google Scholar]
  27. Tan, M.J.; Zheng, Y.; Li, Y.F.; Gong, C.; Zhou, C.; Pan, S. Multi-scale contrastive siamese networks for self-supervised graph representation learning. In Proceedings of the 30th International Joint Conference on Artificial Intelligence (IJCAI). IJCAI, Virtually, 23–29 July 2021; pp. 1588–1594. [Google Scholar] [CrossRef]
  28. Ma, J.; Chang, B.; Zhang, X.; Mei, Q. Copulagnn: Towards integrating representational and correlational roles of graphs in graph neural networks. arXiv 2020, arXiv:2010.02089. [Google Scholar]
  29. Schlichtkrull, M.; Kipf, T.N.; Bloem, P.; Van Den Berg, R.; Titov, I.; Welling, M. Modeling relational data with graph convolutional networks. In Proceedings of the The semantic web: 15th international conference, ESWC 2018, Heraklion, Crete, Greece, 3–7 June 2018; proceedings 15. Springer: Berlin/Heidelberg, Germany, 2018; pp. 593–607. [Google Scholar]
  30. Vimal, S.; Kayathwal, K.; Wadhwa, H.; Dhama, G. Application of Deep Reinforcement Learning to Payment Fraud. arXiv 2021, arXiv:2112.04236. [Google Scholar]
  31. Kim, H.; Choi, J.; Whang, J.J. Dynamic Relation-Attentive Graph Neural Networks for Fraud Detection. arXiv 2023, arXiv:2310.04171. [Google Scholar]
  32. Hu, J.; Xiao, B.; Jin, H.; Duan, J.; Wang, S.; Lv, Z.; Wang, S.; Liu, X.; Zhu, E. SAMCL: Subgraph-Aligned Multiview Contrastive Learning for Graph Anomaly Detection. IEEE Trans. Neural Netw. Learn. Syst. 2023, 36, 1664–1676. [Google Scholar] [CrossRef]
  33. Wu, T.; Ren, J.; Li, P.; Leskovec, J. Graph Information Bottleneck for Subgraph Recognition. arXiv 2020, arXiv:2010.05563. [Google Scholar]
  34. Jin, C.; Jin, J.; Zhou, J.; Wu, J.; Xuan, Q. Heterogeneous feature augmentation for ponzi detection in ethereum. IEEE Trans. Circuits Syst. II Express Briefs 2022, 69, 3919–3923. [Google Scholar] [CrossRef]
  35. Breiman, L. Random forests. Mach. Learn. 2001, 45, 5–32. [Google Scholar] [CrossRef]
  36. Chen, T.; Guestrin, C. XGBoost: A scalable tree boosting system. In Proceedings of the 22nd ACM SIGKDD International Conference on Knowledge Discovery and Data Mining, San Francisco, CA, USA, 13–17 August 2016; pp. 785–794. [Google Scholar]
  37. Wu, F.; Souza, A.; Zhang, T.; Fifty, C.; Yu, T.; Weinberger, K. Simplifying graph convolutional networks. In Proceedings of the International conference on machine learning. PMLR, Long Beach, CA, USA, 9–15 June 2019; pp. 6861–6871. [Google Scholar]
  38. Xu, K.; Hu, W.; Leskovec, J.; Jegelka, S. How powerful are graph neural networks? In Proceedings of the International Conference on Learning Representations, New Orleans, LA, USA, 6–9 May 2019. [Google Scholar]
  39. Hamilton, W.L.; Ying, Z.; Leskovec, J. Inductive representation learning on large graphs. In Proceedings of the Advances in Neural Information Processing Systems, Long Beach, CA, USA, 4–9 December 2017; pp. 1024–1034. [Google Scholar]
  40. Busbridge, D.; Sherburn, D.; Cavallo, P.L. Relational graph attention networks. In Proceedings of the Graph Representation Learning Workshop, NeurIPS, Vancouver, BC, Canada, 8–14 December 2019. [Google Scholar]
  41. Hu, Z.; Dong, Y.; Wang, K.; Sun, Y. Heterogeneous graph transformer. In Proceedings of the 26th ACM SIGKDD International Conference on Knowledge Discovery & Data Mining, Virtually, 6–10 July 2020; pp. 2704–2713. [Google Scholar]
  42. Hassani, K.; Khasahmadi, A.H. Contrastive multi-view representation learning on graphs. In Proceedings of the International Conference on Machine Learning. PMLR, Virtually, 13–18 July 2020; pp. 4116–4126. [Google Scholar]
Figure 1. Overview of the MVCG-SPS framework.
Applsci 15 03281 g001
Figure 2. Smart contract interaction enhancement example.
Applsci 15 03281 g002
Figure 3. Sensitivity analysis of MVCG-SPS with respect to the number of meta-path views V and the reward discount factor γ .
Applsci 15 03281 g003
Table 1. Dataset statistics for smart Ponzi scheme detection.
DescriptionNumberDetection Relevance
Nodes57,130Entities involved in transactions
Edges156,255Transaction network topology
CA4616Smart contracts facilitating interactions
EOA52,514User-controlled accounts
Call edges69,653Execution events triggering scheme
Transaction edges86,602Monetary transfers indicative of fund flows
Labeled Ponzi accounts191Known fraudulent targets (imbalanced ratio 1:299)
Table 2. Performance comparison across blockchain fraud detection methods.
Model CategoryF1 ScoreAUPRCRecK
Machine Learning Methods:
RF0.7460.7280.692
XGBoost0.7710.7520.718
Homogeneous Graph Methods:
GCN0.8120.7890.751
SGC0.8010.7710.733
GIN0.8310.8100.792
GraphSAGE0.8450.8270.811
GAT0.8430.8240.812
Heterogeneous Graph Methods:
RGCN0.8540.8350.822
RGAT0.8780.8610.846
HGT0.8650.8470.830
Perturbation-Based Methods:
MVGRL0.8760.8600.841
MERIT0.8890.8720.855
Proposed Method:
MVCG-SPS (Ours)0.9020.8910.871
Table 3. Ablation study results.
ConfigurationF1 ScoreAUPRCRecK
MVCG-SPS (Full Model)0.9020.8910.871
MVCG-SPS w/o RL0.879(−2.6%)0.861(−3.4%)0.843(−3.2%)
MVCG−SPS w/o MSCL0.868(−3.8%)0.853(−4.3%)0.835(−4.1%)
MVCG−SPS w/o MPBV0.854(−5.3%)0.840(−5.7%)0.822(−5.6%)
Table 4. Hyperparameter tuning summary.
HyperparameterSearch RangeFinal Value
Learning Rate{0.001, 0.005, 0.01, 0.05}0.01
Hidden Layer Dimension{64, 128, 256}128
RL Learning Rate ( α ){0.01, 0.05, 0.1}0.05
λ intra / λ inter [0.1, 1.0]0.7/0.3
Meta-Path Views (V){2, 3, 5, 7}5
Reward Discount Factor ( γ ){0.5, 0.7, 0.9, 0.99}0.9
Table 5. Impact of alternative meta-path configurations on detection performance.
ConfigurationF1 ScoreAUPRC
Baseline (Full Model)0.9020.891
Replace P 2 with temporal path0.874 (−3.1%)0.863 (−3.1%)
Add extra sampling meta-path0.924 (+2.4%)0.912 (+2.4%)
Table 6. SHAP value analysis for representative case (Ponzi scheme identification).
FeatureSHAP ValueDomain Significance
Upstream invitation density+0.23Reflects pyramid recruitment patterns
Investment/payment ratio+0.19Indicates unsustainable returns
Table 7. Scalability analysis on synthetic graphs.
NodesTraining Time (s/epoch)GPU Memory (GB)F1 Score
10K12.30.20.901
100K124.70.30.895
500K618.40.40.887
1M1235.10.50.881
Disclaimer/Publisher’s Note: The statements, opinions and data contained in all publications are solely those of the individual author(s) and contributor(s) and not of MDPI and/or the editor(s). MDPI and/or the editor(s) disclaim responsibility for any injury to people or property resulting from any ideas, methods, instructions or products referred to in the content.

