Article

Biological Activities of Selected Medicinal and Edible Plants Aqueous Infusions

1
Faculty of Chemistry and Technology, University of Split, Ruđera Boškovića 35, 21000 Split, Croatia
2
School of Medicine, University of Split, Šoltanska 2, 21000 Split, Croatia
3
Department of Ecology and Agronomy, University of Zadar, Mihovila Pavlinovića 1, 23000 Zadar, Croatia
4
Faculty of Food Technology and Biotechnology, Centre in Zadar, University of Zagreb, P. Kasandrića 6, 23000 Zadar, Croatia
5
Faculty of Pharmacy and Biochemistry, University of Zagreb, Ante Kovačića 1, 10000 Zagreb, Croatia
6
Faculty of Science, University of Zagreb, Horvatovac 102a, 10000 Zagreb, Croatia
*
Author to whom correspondence should be addressed.
Appl. Sci. 2025, 15(6), 3254; https://doi.org/10.3390/app15063254
Submission received: 14 February 2025 / Revised: 10 March 2025 / Accepted: 13 March 2025 / Published: 17 March 2025
(This article belongs to the Special Issue Novel Research on Bioactive Compounds in Plant Products)

Abstract

:
This study investigated the phenolic profile and biological activities (antioxidant, antimicrobial, anti-hyperglycemic and antiproliferative) of aqueous infusions prepared from the following medicinal and edible plants: Geranium macrorrhizum L., Verbascum thapsus L., Ononis spinosa L., Achillea millefolium L., and Polygonum aviculare L. Despite their long-term usage and numerous scientific results on various solvent extracts of selected plants, they are still un-explored in terms of certain aspects of in vitro biological activities, especially in the form of aqueous infusions, which are a very common form of consumption of medicinal plants. The phenolic analysis of the selected infusions was carried out using the HPLC-DAD method and showed the highest content of total phenols in G. macrorrhizum and P. aviculare, the highest total flavonoid content in P. aviculare, and a high content of procyanidins in G. macrorrhizum. The highest antioxidant activity according to the three methods (DPPH, FRAP and Rancimat) was achieved by G. macrorrhizum and A. millefolium. The aqueous infusions of the selected plants showed no antimicrobial activity against Escherichia coli ATCC 25922 and Staphylococcus aureus ATCC 25923. The highest anti-hyperglycemic activity by inhibition of the enzymes α-glucosidase and α-amylase and the highest antiproliferative activity against MD-MBA-231, A549 and T24 cells was obtained from G. macrorrhizum.

1. Introduction

The global market for medicinal and aromatic plants, driven by the growing awareness of a healthy balance (homeostasis or physiological equilibrium) during the pandemic, is creating economic value in many sectors, from herbal production to the health and beauty care industry. The COVID-19 pandemic provided an opportunity for herbal manufacturers to launch more herbal products that boost immunity [1]. According to the WHO, almost 10–15% of the population in developed countries regularly use herbal products in some form [2].
Herbal infusions involve bringing water to a boil and then pouring it over leaves, stems or flowers. This type of herbal drink offers a more natural way of ingesting herbs and is one of the most popular forms of herbal medicine worldwide. Herbal infusions are widely used in the traditional Mediterranean diet as well as in many other regions of the world and their consumption is associated with their health benefits (functional drinks) as well as their sensory properties [3,4]. For real infusions, the roots, shoots, leaves and flowers of the plant are usually used, while teas use only the leaves in the steeping process. Herbal infusions are sometimes referred to as “tisanes” and do not involve the use of the plant material of Camellia sinensis L. [5]. Infusions are a very good source of highly bioaccessible bioactive compounds. [6]. The most common bioactive compounds found in herbal infusions include polyphenols, which are known as strong antioxidants [7].
This study investigated the bioactive potential (antioxidant, antibacterial, antiproliferative and anti-hyperglycemic) of five medicinal plant infusions (Geranium macrorrhizum L.—bigroot geranium, Achiella millefolium L.—yarrow, Ononis spinosa L.—spiny restharrow, Polygonum aviculare L.—knotgrass, and Verbascum thapsus L.—great mullein). The rhizome and plant of G. macrorrhizum L. (Geraniaceae) have been utilized for a long time as a medicinal plant. Its essential oil showed antibacterial activity, while the methanolic leaf extract showed strong antibacterial, antioxidant and hepatoprotective effects [8]. In addition, the antiproliferative effect of G. macrorrhizum against leukemia cell lines (CCRF-CEM and CEM/ADR 5000) was investigated [9]. There are no data on the biological activity of G. macrorrhizum as an infusion. The aqueous-alcoholic extract of V. thapsus (Scrophulariaceae) has compounds with antibacterial properties [10]. Several biological activities are attributed to this plant (anti-inflammatory, antioxidant, anticancer, antimicrobial, antiviral, anti-hyperlipidemic) [11]. This plant is commonly used to treat inflammatory diseases, asthma, spasmodic coughs, diarrhoea, and migraine headaches [12]. A. millefolium (Asteraceae) is known as a remedy for the treatment of wounds, bleedings, headaches, inflammation, pain, spasmodic diseases, flatulence, and dyspepsia, while P. aviculare (family Polygonaceae) is known for its antioxidant, antimicrobial, antifungal, anti-inflammatory, anticancer, neuroprotective, estrogenic, and lipid-regulating effects [13,14]. O. spinosa (Fabaceae) is used for inflammation of the urinary tract, in the treatment of rheumatism, and as an antiseptic [15]. Extracts prepared for its root have shown various biological activities (anti-inflammatory, wound-healing effect, antioxidant, antibacterial, antifungal, cytotoxic and antitumor) [16].
It is known that the choice of solvent has a quantitative (yield) and qualitative (phenolic profile) influence on the extraction of phenols. Water, alcohols (ethanol and methanol) and their mixtures are optimal for the extraction of highly hydroxylated aglycone forms of phenolic compounds, while less polar solvents such as ethyl acetate, acetone, chloroform are optimal for the extraction of highly methoxylated aglycone forms of phenolic compounds [17]. The available data showed that despite the generally higher phenolic content in the methanol extract compared to the water extract, the water extract may have higher biological activity, such as antiproliferative activity [18] or antioxidant activity [19]. However, the aim of this study was not to determine the influence of the extraction solvents on the phenolic concentration and composition, but to investigate the biological potential of the aqueous infusions, which are considered to be natural functional drinks.
The aim of this study was to investigate the dominant phenolic compounds from aqueous infusions of selected medicinal and edible plants and to evaluate their bioactive potential in vitro: antioxidant, antibacterial, anti-hyperglycemic and antiproliferative. The phenolic profile was determined using the HPLC-PDA method and the antioxidant potential of the prepared aqueous infusions was determined by three antioxidative methods: the 2,2-diphenyl-1-picryl-hydrazyl-hydrate (DPPH) free radical assay, the ferric reducing antioxidant power (FRAP) assay, and the accelerated oxidation test (Rancimat method). The antibacterial activity was tested on Escherichia coli ATCC 25922 and Staphylococcus aureus ATCC 25923 as representatives of Gram-negative and Gram-positive bacteria, respectively. The anti-hyperglycemic activity was determined through inhibition of α-glucosidase and α-amylase. The antiproliferative activity was tested using different cancer cell lines: breast cancer cells (MDA-MB-231), bladder cancer cells (T24), and lung cancer cells (A549).

2. Materials and Methods

2.1. Plant Material

The plant material (dried) was purchased in a Phyto Pharma shop in Split (Croatia): Geranium marrorhizum L.—bigroot geranium (whole plant), Verbascum thapsus L.—great mullein (flower), Achillea millefolium L.—yarrow (whole plant), Polygonum aviculare L.—knotgrass (whole plant), Ononis spinosa L.—spiny restharrow (root).

2.2. Preparation of Aqueous Herbal Infusions

Dried plant material (15 g) was infused in 200 mL of boiling distilled water for 30 min (with occasional stirring). The infusate was filtered through Whatman No. 1 and concentrated to dryness using a rotary evaporator (Rotavapor R-200, Büchi, Flawil, Switzerland). The residue obtained was dissolved in distilled water to obtain a final concentration of 60 g/L. The samples were stored at—20 °C until further analysis.

2.3. HPLC Analysis of Phenolic Compounds

High performance liquid chromatography (HPLC) with photo diode detector (PDA) analysis of the individual phenolic compounds in the herbal extracts was performed using an Agilent Infinity HPLC-PDA instrument (Agilent 1260 series, equipped with quaternary pump, injector, TCC column compartment and UV/Vis-PDA VL + detector) with OpenLAB ChemStation software v. C.01.03 (Agilent, Santa Clara, CA, USA). The phenolic compounds were separated on a 250 × 4.6 mm, 5 µm film thickness Luna 100–5 C18 column (Phenomenex, Torrance, CA, USA). The injection volume was 20 µL, and the column temperature was set to 30 °C. The composition of the mobile phases and the gradient elution were set as previously described by Bilušić et al. [20]. The phenolic compounds were identified by comparing the retention time and spectral data with those of the standards, i.e., gallic acid, protocatechuic acid, caffeic acid, chlorogenic acid, p-coumaric acid, ferulic acid as well as quercetin-3-glucoside, and kaempferol-3-glucoside, luteolin, and apigenin (Sigma Aldrich, St. Louis, MO, USA). Gallic acid (y = 30.025x), procyanidin B2 (y = 3.50x), catechin (y = 12.097x), chlorogenic acid (y = 63.539x), caffeic acid (y = 68.301x), p-coumaric acid (y = 135.81x), kaempferol 3-rutinoside (y = 41.313x), quercetin-3-glucoside (y = 37.386x), epicatechin (y = 10.929x), ferulic acid (y = 132,11x), protocatehuic acid (y = 27.196x), luteolin (y = 119.39x), apigenin (y = 107.04x), syringic acid (y = 75.15x), rosmarinic acid (y = 31.594x). The quantification of the phenolic compounds was carried out using the calibration curves of the standards mentioned above. The quantification of the individual derivatives of the phenolic compounds was carried out using standards that matched the spectra. The results are expressed in mg of phenolic compounds per liter of aqueous plant infusion.

2.4. In Vitro Antioxidant Activity

2.4.1. DPPH (2,2-Diphenyl-1-picrylhydrazyl) Scavenging Activity)

The DPPH scavenging ability of the samples was measured according to the method described by Yen and Duh [21]. The results obtained are reported as IC50 values (the amount of extract needed to decrease by 50% the initial DPPH concentration).

2.4.2. FRAP (Ferric Reducing/Antioxidant Power)

The reducing potential of aqueous plant infusions was measured by the method of Benzie and Strain [22]. The principle of the method is the rapid reduction of ferric-tripyridyltriazine (FeIII—TPTZ) by antioxidants from the analyzed samples to a blue coloured ferrous-tripyridyltriazine (FeII—TPTZ).

2.4.3. Rancimat Assay (Oxidative Stability Test)

Aqueous plant infusions (0.16% by mass) were tested for their effect on the oxidative stability of extra virgin olive oil (3 g) at a temperature of 120 °C (ΔT = 1.4 °C) and a constant air flow of 20 L/h using the Rancimat 743 instrument (Methrom, Herisau, Switzerland). The results are expressed as a relative protection factor (RPF) which was calculated using the equation RPF = sample induction time/(control induction time × mass of antioxidant) [23].

2.5. Antibacterial Activity

Antibacterial tests were carried out in vitro on Escherichia coli ATCC 25922 (gram negative bacteria) and Staphylococcus aureus ATCC 25923 (gram positive bacteria). The activity of the analyzed samples was investigated using the two-fold microdilution method according to The European Committee on Antimicrobial Susceptibility Testing -EUCAST [24] and performed in 96-well microtiter plates as previously described [25]. Freshly prepared Mueller Hinton broth was used for overnight bacterial growth to mid exponential phase. Then, serial dilutions of samples (4–0.0078 mg/mL) were added to a final bacterial load of 5 × 10⁵ CFU/mL in 100 μL per well. The suspension was incubated at 37 °C for 18–20 h and the minimum inhibitory concentration (MIC) was determined as the lowest concentration of the complex that showed no visually detectable bacterial growth. Experiments was performed in triplicate.

2.6. In Vitro Antidabetic Activity

2.6.1. Glucosidase Inhibitory Activity

α-glucosidase inhibition was performed with slight modifications [26]. Samples (30 μL) were incubated with 75 μL α-glucosidase from Saccharomyces cerevisiae (0.2 U/mL dissolved in 0.1 M phosphate buffer, pH 6.8) in a 96-well microplate for 10 min at 37 ° C. The substrate (75 μL 1 mM p-nitrophenyl-α-D-glucopyranoside prepared in the same buffer) was added to the reaction mixture and the release of p-nitrophenol was measured spectrophotometrically at 405 nm after 5 min of incubation. Buffer (75 μL) was used a blank. The control sample contained distilled water (30 µL). The percentage of enzyme inhibition was calculated as follows: (1 − B/A) × 100 where A is absorbance of control while B represents absorbance of sample containing extract. All analyses were performed in triplicate and acarbose was used as a positive control. The IC50 value is defined as the concentration of the test sample required to inhibit 50% of the activity of the enzyme under the conditions tested.

2.6.2. Amylase Inhibitory Activity

Sample solution (0.5 mL) at various concentrations and phosphate buffer (0.5 mL pH 6.9, 20 mM) containing porcine α-amylase (0.8 U/mL) were preincubated at 25 ° C for 10 min according to the method by Marijan et al. [27]. Soluble starch (0.5 mL, 0.5% solution in the same buffer) was added to the reaction mixtures and incubated at 25 °C for 10 min. The reaction was terminated with 1 mL of 3.5-dinitrosalicylic acid color reagent (1 mL, 96 mM) and the test tubes were incubated in a boiling water bath for 10 min and cooled to room temperature. The reaction mixtures were diluted by adding 10 mL of distilled water and the absorbance was measured at 540 nm. The percentage of enzyme inhibition was calculated as described above. The control corresponds to 100% enzyme activity and was prepared by replacing the extract with the solvent used for extraction. Blanks measured absorbance produced by the extracts and were prepared by replacing the enzyme solution with buffer. All analyses were performed in triplicate and acarbose was used as a standard reference (positive control). The concentration of extract required to inhibit the activity of the enzyme by 50% (IC50) was calculated by regression analysis.

2.7. Cell Culture

Breast cancer cells MDA-MD-231, bladder cancer cells T24, and lung cancer cells A549 were purchased from ATCC (LGC standards). Cells were cultured in a atmosphere with 5% CO2 at 37 °C, in a Dulbecco’s modified Eagle’s medium (DMEM Euroclone, Milan, Italy) with 10% fetal bovine serum (FBS) and 1% antibiotics (Penicillin Streptomycin, Euroclone, Milan, Italy).

2.8. Cell Proliferation Assay (MTT)

An equal number of cells (1 × 10⁴) were seeded in 96-well plates and incubated overnight according to the method by Bilušić et al. [28] Cells were treated with samples (0.1, 0.25, 0.5, and 1 mg/mL) in triplicate for 4, 24, 48, and 72 h. After treatment, the cells were incubated with 0.5 g MTT/L solution (MTT, [3-(4,5-dimethylthiazol-2-yl)-2,5-diphenyl tetrazolium bromide]) at 37 °C for 2 h, after which the medium was removed and dimethylsulphoxide (DMSO) was added for a further 10 min at 37 °C with shaking. The absorbance was measured using a HiPo MPP-96 microplate reader (Biosan, Riga, Latvia) at 570 nm. The data were calculated in relation to the untreated control (100%) from three independent measurements.

2.9. Microstructure Analysis

Dried plant material of selected medicinal and edible plants (15 g) was infused in 200 mL of boiling distilled water for 30 min. The samples were filtered and the wet plant material was allowed to stand at room temperature until dry. The microstructures of the plants before and after hot water treatment were characterized using a Schottky field emission scanning electron microscope (SEM) JEOL JSM-7610FPlus (Jeol Ltd., Tokyo, Japan). Prior to the examination, the samples were coated with a 5 nm thick gold layer using the Quorum Q150 ES plus sputter coater (Quorum, Laughton, UK). The signal of the backscattered electrons was used for imaging, with an acceleration voltage of 1 kV and a working distance of 15 mm.

2.10. Statistical Analysis

Statistical analysis was performed using the Statistica 14.0 programme (TIBCO Software Inc., Palo Alto, CA, USA). The mean values of several samples were compared using a one-way analysis of variance (ANOVA) and post-hoc Duncan’s new multiple range test (DNMRT). When comparing two samples, Student’s t-test was used. A p-value of less than 0.05 was considered statistically significant. To assess the similarity or dissimilarity of the samples based on their phytochemical content, antioxidant and anti-hyperglycemic properties, multivariate principal component analysis (PCA), hierarchical clustering using Euclidean distance between samples, and single linkage clustering were performed. Pearson’s linear correlation coefficients were calculated to determine the relationships between the phytochemical compounds and the bioactivity values.

3. Results and Discussion

3.1. HPLC Analysis of Aqueous Herbal Infusions

The main phenolic compounds from selected herbal infusions are shown in Table 1. The highest total phenolics values were found in G. macrorrhizum (1531.45 mg/L.) and P. aviculare (1254.72 mg/L), the highest total phenolic acids in A. millefolium (648.13 mg/L), and the highest total flavonoids in P. aviculare (1060.99 mg/L). The main phenolic acids detected in A. millefolium were chlorogenic acid and its derivatives (337.38 mg/L) and ferulic acid and its derivatives (189.66 mg/L), while other infusions, especially P. aviculare did not have a very high content of phenolic acids (17.59 mg/L). The most important flavonoids in the selected herbal infusions were: flavan-3-ols (P. aviculare and O. spinosa), quercetin and its derivatives (P. aviculare and G. macrorrhizum), kaempferol and its derivatives (P. aviculare and G. macrorrhizum), luteolin and its derivatives (G. macrorrhizum), and catechin and its derivatives (P. aviculare). A high content of procyanidins was found in the infusion of G. macrorrhizum (744.48 mg/L).
There is no study comparing the phenolic composition from aqueous infusions prepared of the plants used in this study. Moreover, most studies on the plants used in this study are based on the phenolic composition of different extracts (ethanolic, methanolic, acetone, hexane, ethyl acetate) and not on aqueous infusions or aqueous extracts. It is known that the total phenolic content and the phenolic composition vary depending on the extraction method, the analytical method and the plant part as well as the origin of the plant. Dias et al. [29] investigated the biological potential and phenolic composition of the infusion of A. millefolium and also reported the high content of apigenin derivatives. Aljaafreh et al. [30] found high content of flavonoids in A. millefolium compared to other 12 studied plants commonly used in Jordan. Other studies mostly reported the presence of various phenolic compounds in different extracts of selected plants. Phenolic acids, flavonoid glycosides and aglycones and other related compounds were identified in the methanol extract from the aerial part of O. spinosa [16]. Yu et al. [31] performed the phytochemical analysis of P. aviculare in which they found mainly flavonoids, which is consistent with results obtained. Some authors found the presence of various phenolic acids in Polygonum sp., while in this study, very low content of total phenolic acids was found in P. aviculare [32]. The predominant presence of flavonoids, mainly quercetin and kaempferol, in the extract of G. macrorrhizum has been reported, which is in agreement with the results obtained [33,34,35,36]. Other studies confirmed the considerable content of procyanidins in Geranium sp., which is consistent with our results [34]. Many phenolic acids (ferulic acid, rosmarinic acid, salicylic acid) and flavonoids (rutin, quercetin, luteolin) were found in the extract of V. thapus flowers [37]. In our study, quercetin and kaempferol and its derivatives were found to be dominant in V. thapsus.

3.2. Antioxidant Activity of Aqueous Herbal Infusions

DPPH radical scavenging method, ferric reducing antioxidant potential (FRAP) and accelerated oxidation test (Rancimat assay) were used to determine the antioxidant activity of infusions. The results obtained are shown in Table 2. The highest antioxidant activity in all methods was obtained from G. macrorrhizum and A. millefolium, while V. thapus and O. spinosa showed the lowest activity. The antioxidant activity of P. aviculare was moderate. The results obtained are compared with those of the most commonly used synthetic antioxidants (butylated hydroxytoluene—BHT, butlyted hydroxyansiole—BHA and ascorbic acid) (Table 2). As we have already emphasized, there is no comparative study on the biological potential of selected medicinal and edible plants. Furthermore, there are no data on the lipid oxidation inhibitory activity of selected plants using the Rancimat method. This test is particularly useful for the food and pharma industries to extend the shelf life of lipid-based products containing selected medicinal and edible plants. There are many data on the free radical potential and ferric reducing activity of the extracts from selected plants. Mahdavi et al. [38] reported low DPPH inhibitory activity of the ethanolic extract of V. thapsus, while Gupta et al. [37] found high ferric reducing activity of the flower extract of V. thapsus (ethyl acetate, aqueous, n-hexane). Selseleh et al. [39] found low DPPH and FRAP activity of V. thapsus methanol extract compared to other Verbascum species. High antioxidant potential of G. macrorrhizum methanol extract by DPPH and FRAP method was also found by other authors [9,40]. The antioxidant activity of methanolic extract of O. spinosa by DPPH and FRAP method was reported by Stojković et al. [16]. Idoudi et al. [32] reported the antioxidant activity of the ethanolic extract of P. aviculare by DPPH test. Navaie et al. [41] investigated the antioxidant activity of the aqueous and hydroalcoholic (methanolic and ethanolic) extracts of the leaf and flower of A. millefolium by the DPPH and FRAP methods and found that the ethanolic extract of the leaf and the methanolic extract of the flower exhibited the highest free radical scavenging activity and ferric ion reducing activity compared to the aqueous extract.

3.3. Antibacterial and Antidabetic Activities of Aqueous Herbal Infusions

The antibacterial activity of selected aqueous plant infusions was tested against Escherichia coli ATCC 25922 and Staphylococcus aureus ATCC 25923 as representatives of gram-negative and gram-positive bacteria using the microdilution method. The antibacterial activity of the different concentrations of the infusions (4—0.0078 mg/mL) showed no inhibitory effect against Escherichia coli ATCC 25922 and Staphylococcus aureus ATCC 25923. However, many authors have found the antibacterial activity of various extracts of selected medicinal and edible plants against different bacterial strains. Most studies are based on the antibacterial activity of ethanolic and methanolic extracts, not on the aqueous extracts. The available results vary depending on the type of extract and bacterial strain and it is possible to draw completely opposite conclusions. The lack of inhibitory activity of four different solvent extracts of G. macrorrhizum and V. thapsus against E. coli is also reported by other authors [8,38,42]. Turker and Camper [43] have demonstrated the antibacterial activity of the aqueous extract of V. thapsus only against K. penumoniae and S. aureus, while E. coli did not show sensitivity to the the samples tested. The antimicrobial activity against S. aureus was found for G. macrorrhizum (ethanolic extract), V. thapsus (methanolic and ethanolic extract), O. spinosa (methanolic extract), A. millefolium (hexane, petroleum ether, methanol) [16,39,44,45].
The use of medicinal plants could play an important role in combating hyperglycemia by inhibiting digestive enzymes—α-amylase and α-glucosidase. Their inhibition delays the breakdown of carbohydrates in the small intestine and decreases postprandial blood glucose level, which is important in type 2 diabetes. The results of inhibitory activity of α-amylase and α-glucosidase by aqueous infusions of selected plants are shown in Table 3. The highest inhibitory activity of both digestive enzymes was achieved by G. macrorrhizum whose effect on α-glucosidase inhibition is even more effective than that of acarbose, a widely used drug for the treatment of type 2 diabetes. O. spinosa showed excellent inhibitory activity of α-glucosidase and good inhibitory activity of α-amylase. V. thapsus and P. aviculare showed moderate inhibitory activity of α-glucosidase. A. millefolium showed no inhibitory effect of the two digestive enzymes. The anti-hyperglycemic activity of extracts of selected plants (mostly ethanolic and methanolic) by inhibiting α-glucosidase and α-amylase has been reported by many authors [16,30,32,44,46,47,48]. Numerous studies have reported the inhibitory potential of phenolic compounds against α-amylase and α-glucosidase, explaining that the structure of polyphenol affect their ability to interact with the enzyme and the presence of methoxyl groups on benzoic acid derivatives [49]. This is consistent with our results for G. macrorrhizum, which contains high levels of syringic acid and also high level of procyanidins (Table 1).

3.4. Antiproliferative Activity of Aqueous Herbal Infusions

The antiproliferative activity of infusions was investigated against three human cancer cell lines: MD-MBA-231, T24 and A549 cells (Table 4, Table 5 and Table 6). Four different concentrations of stock solutions of each herbal infusion were tested (0.1 g/L, 0.25 g/L, 0.5 g/L, and 1 g/L) after 4, 24, 48 and 72 incubation periods. G. macrorrhizum, O spinosa and A. millefolium showed the highest and dose-dependent antiproliferative effect against MD-MBA-231 cells after all incubation periods (Table 4). After 72 h of incubation, the antiproliferative effect was 54.99% for G. macrorrhizum, 49.05% for A. millefolium and 48.53% for O. spinosa. Compared to the cancer cells MD-MBA-231, the antiproliferative activity of the tested infusions against A549 cells was significantly higher. A very high (>88%) and dose-dependent antiproliferative activity was achieved by G. macrorrhizum, O. spinosa, A. millefolium and P. aviculare (Table 5). In constrast to the low antiproliferative activity against MD-MBA-231 cells, the infusion of P. aviculare showed a very high antiproliferative activity against A549 cells after 48 h and 72 h of incubation (78.50% and 94.40%). G. macrorrhizum showed a very high antiproliferative activity against A549 cells already after 24 h of incubation (74.02%). The antiproliferative and dose-dependent activity of selected infusions against T24 cells is shown in Table 6. G. macrorrhizum (51.17% after 48 h and 96.20% after 72 h) and O. spinosa (58.96% after 72 h) showed the highest activity. In general, the antiproliferative activity of the tested infusions against T24 cells was lower compared to other cancer cell lines tested, except for G. macrorrhizum (Table 4, Table 5 and Table 6). There are no data on the comparative antiproliferative activity of selected aqueous infusions against the tested cell lines and the available results are mostly based on the antiproliferative activity of different solvent extracts from selected plants. For example, many authors demonstrated the antiproliferative activity of the methanol extracts of P. aviculare, V. thapsus, O. spinosa, A. millefolium against various cancer cell lines (breast cancer cells MCF-7, colon cancer cells CaCo2, liver cell lines HepG2 and Hep3B, glioblastoma cells A172, epidermoid carcinoma cells A431) [37,41,48]. Deipembruck et al. [50] reported that the hot water extract of O. spinosa showed no inhibitory effect on T24 cells after 24 h of incubation. In our study, the infusion of O spinosa also showed a low antiproliferative effect after 24 h of incubation (16.26%), but the effect was much higher after 48 h and 72 h of incubation (37.64% and 58.69%) (Table 6). G. macrorrhizum showed a very high and dose-dependent antiproliferative activity against all tested cancer cells (>50% for MD-MBA-231 cells and >90% for T24 and A549 cells after 72 h of incubation). The results obtained cannot be compared with similar studies as there are no data on the antiproliferative activity of G. macrorrhizum infusion against the tested cancer cell lines. Table 1 shows that G. macrorrhizum contains a very high content of quercetin and its derivatives (300.44 mg/L) and also a very high content of procyanidines (744.48 mg/L) compared to other infusions. Other authors report on the strong anticancer potential of quercetin and procyanidins [51].

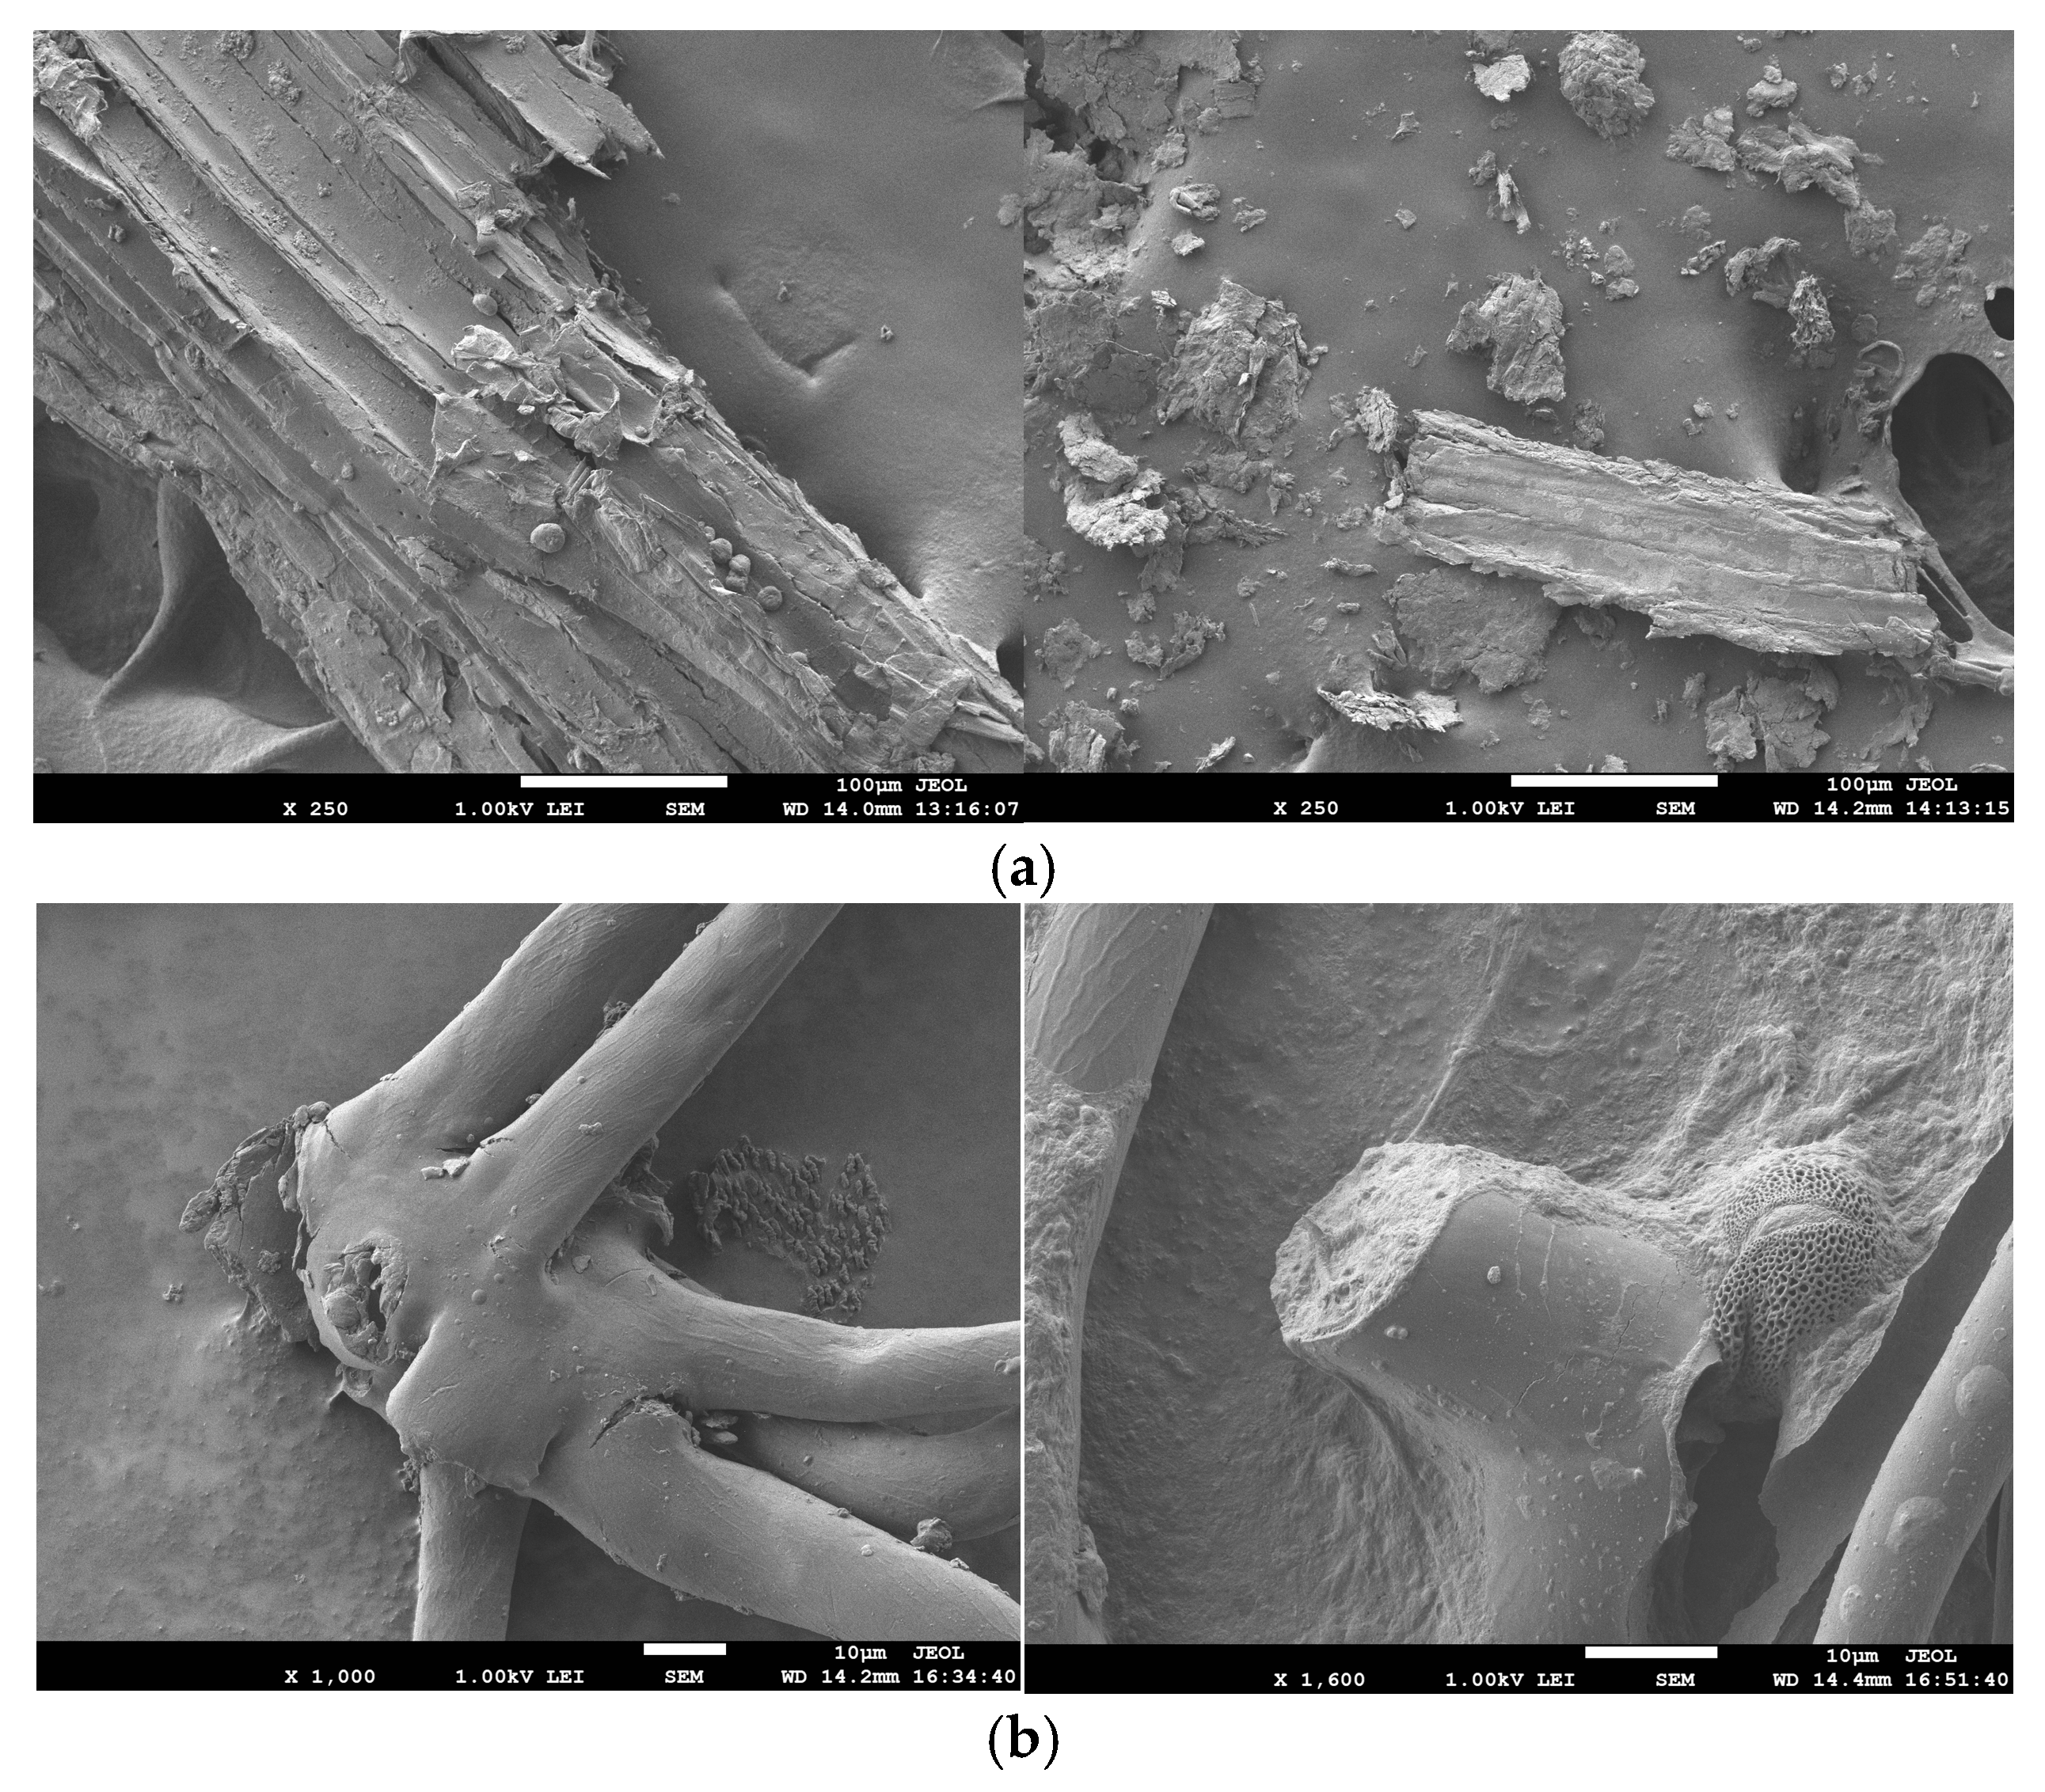
3.5. Microstructure Analysis

Figure 1a,b show the effect of hot water on the surface microstructure of the dried plant material of two plants included in this study (Geranium macrorrhizum L. and Ononis spinosa L.).
The effect of hot water on dried plant material obviously depends on the plant part (the root is more resistant to damage). After treatment with boiling water, the cells are severely damaged and thermally unstable compounds in the plant could be destroyed. Micrographs of the surface microstrucutre of all selected plants were scanned, but only two, the most representative, show the characteristic changes of the plant surface microstructure after the treatment with boiling water and the least deterrent effect on the root.

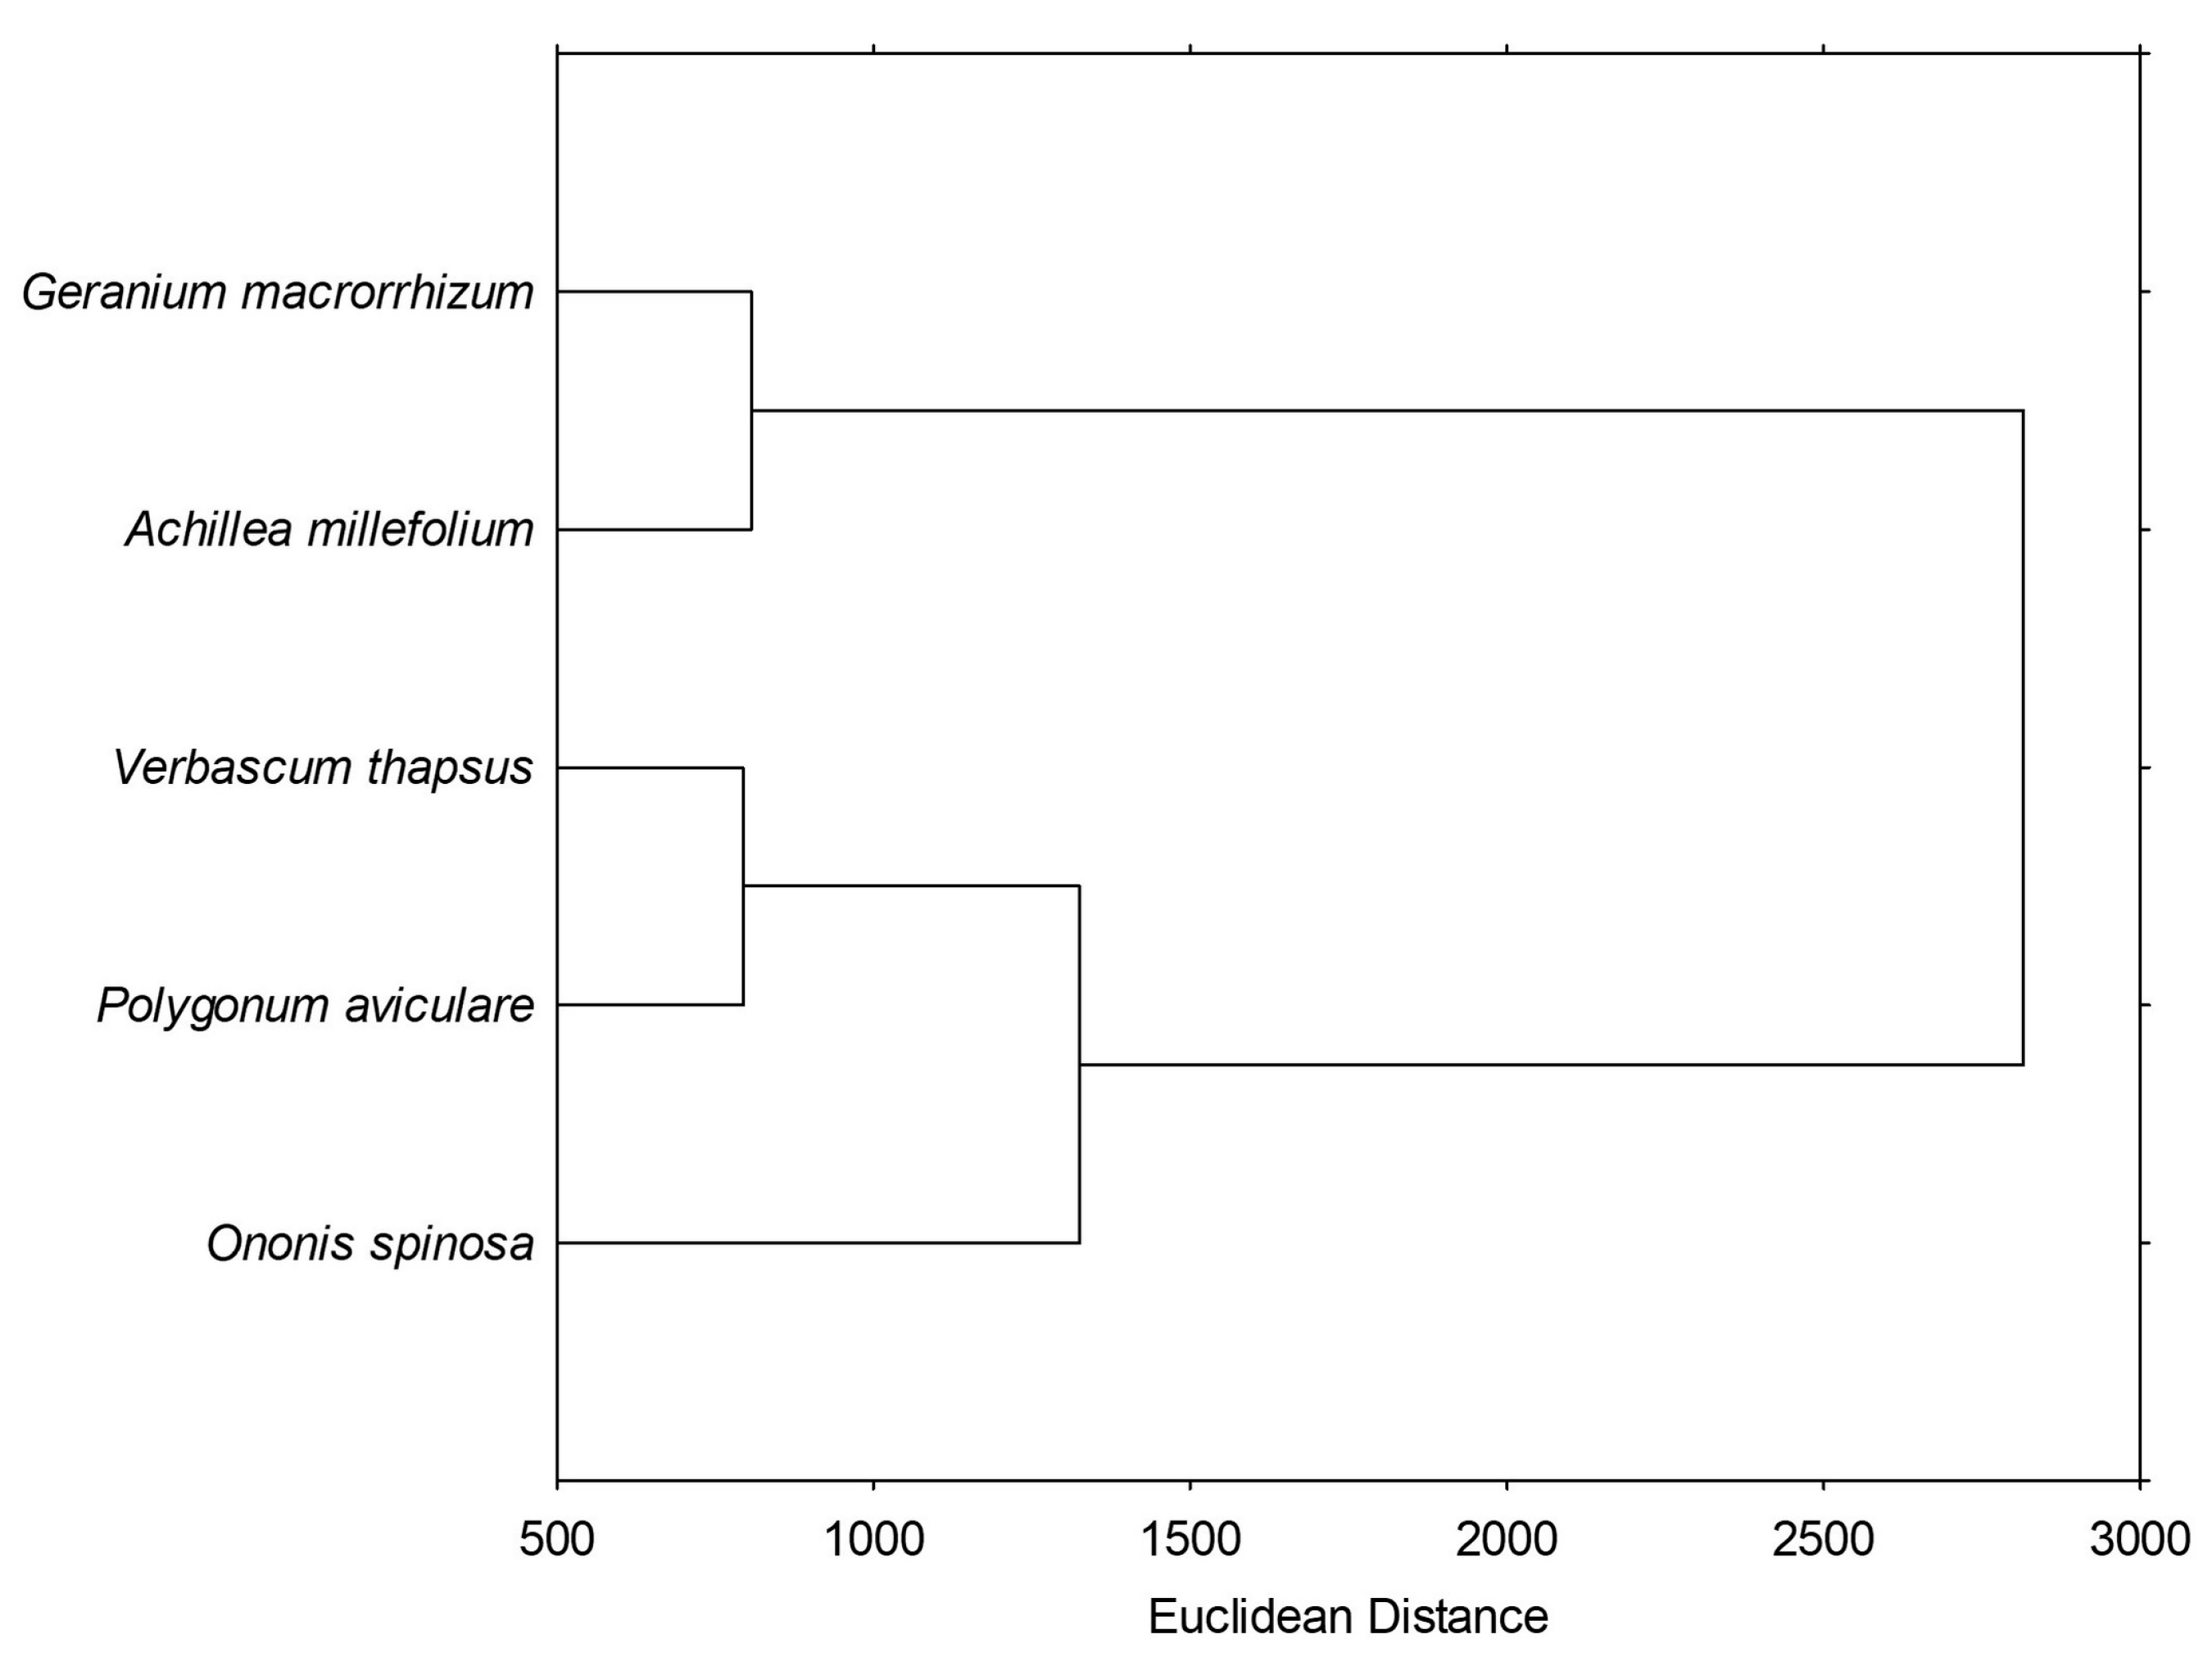
3.6. Statistical Analysis

Principal Component Analysis and Hierarchical Clustering

Principal component analysis (PCA) is a statistical approach that reduces the dimensionality of a data set to two principal components (PCs) while maximising the variance of the data. Data from three biological replicates were used for all analyses. In this study, PC 1 explained 52.56% of the variation in the data, while PC 2 increased the total explained variation to 83.18%. Figure 2 shows the results of PCA based on the total phenolic acids, flavonoids and phenolic compounds identified and the antioxidant and anti-hyperglycemic potential of the extracts are shown. It is evident that the species G. macrorrhizum and A. millefolium are grouped together, while the other three species are more dispersed (Figure 2a). The variables that contributed most to the grouping of G. macrorrhizum and A. millefolium were the concentration of total phenolic acids identified and antioxidant capacity as measured by FRAP and Rancimat assays (Figure 2b). The anti-hyperglycemic potential (inhibition of α-glucosidase and α-amylase enzymes), total identified flavonoids and compounds contributed the most to the separation of P. aviculare.
Hierachical clustering (HC) is a statistical technique in which data points are categorised into clusters or groups based on similar characteristics. The standard and default distance measure is Euclidean distance. As shown on the dendrogram at the Figure 3, G. macrorrhizum and A. millefolium formed a separate cluster, indicating that these two extracts have a greater similarity to each other than to other extracts, based on the given parameters. Three other extracts formed a separate cluster, within which V. thapsus and P. aviculare formed a subcluster, indicating that they are more similar to each other than to O. spinosa.

4. Conclusions

Herbal infusions are very popular drinks that provide a daily intake of bioactive compounds. Although the use of solvent extracts such as methanol or ethanol increases the yield of phenols from plants compared to water extracts, the biological potential of infusions is very coniderable, as the results of this study show.
The aqueous infusion of G. macrorrhizum contained the highest content of total phenols and the highest content of procyanidins. A. millefolium had a significantly higher concentration of identified total phenolic acids than all other aqueous infusions, while the identified total flavonoids were highest in P. aviculare. The major flavonoids in the selected herbal infusions were: Flavan-3-ols (P. aviculare and O. spinosa), quercetin and its derivatives (P. aviculare and G. macrorrhizum), kaempferol and its derivatives (P. aviculare and G. macrorrhizum), luteolin and its derivatives (G. macrorrhizum), and catechin and its derivatives (P. aviculare). The highest antioxidant activity according to the three methods (DPPH, FRAP and Rancimat) was achieved by G. macrorrhizum and A. millefolium. In the form of aqueous extracts, the selected plants showed no antimicrobial activity against Escherichia coli ATCC 25922 and Staphylococcus aureus ATCC 25923. The most effective extract (even more effective than acarbose) in inhibition of α-glucosidase and α-amylase was that of G. macrrorhizum followed by O. spinosa. Moreover, the aqueous infusion of G. macrorrhizum showed the highest and dose-dependent antiproliferative activity against all tested cancer cell lines (MD-MBA-231, A549 and T24).
Due to the high total phenolic content, the high content of procyanidins and the high content of specific phenolic compounds (procyanidins, syringic acid, quercetin, kaemperol and luteolin and their derivatives), G. macrorrhizum in the form of an easily prepared aqueous infusion could be recommended as a useful natural product to protect the healthy balance of the body.

Author Contributions

Conceptualization, T.B.; methodology, T.B., formal analysis, T.B., Z.Z., Z.Č., L.V., V.Č.Č. and I.Š.; investigation, T.B.; resources, T.B., Z.Z., V.Č.Č. and L.V.; data curation, T.B., V.Č.Č., L.V., I.Š. and Z.Z.; writing—review and editing, T.B., I.Š., L.V., Z.Z. and V.Č.Č.; supervision, T.B. All authors have read and agreed to the published version of the manuscript.

Funding

This research was partially supported under the project “Functional integration of the University of Split, Faculty of Science/Faculty of Chemistry and Technology/Faculty of Maritime Studies, through the development of scientific research infrastructure in the building of the three faculties” (KK. 01.1.1.02.0018).

Institutional Review Board Statement

Not applicable.

Informed Consent Statement

Not applicable.

Data Availability Statement

The data supporting our findings and analyses are contained in the article itself. Readers can access this data by referring to the article.

Acknowledgments

The authors would like to thank: Ante Bilušić from the Faculty of Science, University of Split for conducting the part of the study in which the scanning electron microscope was used; Tomislav Rončević and Ana Cvitanović from the Faculty of Science, University of Split for conducting the antimicrobial activity.

Conflicts of Interest

The authors declare no conflict of interest.

Abbreviations

HPLC-DAD (high performance liquid chromatography-diode array detector); WHO (world health organization); DPPH (2,2-diphenyl-1-picrylhydrazyl); FRAP (ferric reducing antioxidant power); SEM (scanning electron microscopy); UV-Vis-PDA (UV visible—photodiode array); ANOVA (analysis of variance); TiF (total identified flavonoids); glucose (glucose); TiC (total identified compounds); amyl (amylase); TiPA (total identified phenolic acids).

References

  1. Global Industry Analysts Inc. A $178.4 Billion Global Opportunity for Herbal Medicines by 2026—New Research from Strategy. 2021. Available online: https://www.prnewswire.com/news-releases/a-178-4-billion-global-opportunity-for-herbal-medicines-by-2026---new-research-from-strategyr-301400269.html (accessed on 12 March 2025).
  2. World Health Organization. WHO Global Report on Traditional and Complementary Medicine; World Health Organization: Geneva, Switzerland, 2019; ISBN 9789241515436. Available online: https://www.who.int/publications/i/item/978924151536 (accessed on 22 July 2017).
  3. Tomou, E.M.; Peppa, E.; Trichopoulou, A. Consumption of herbal infusions/decoctions and tea in Greece: A Planeterranean perspective on the results of Hydria survey. J. Transl. Med. 2023, 21, 899. [Google Scholar] [CrossRef] [PubMed]
  4. Sousa, A.C.; Pádua, A.; Gonçalves, V.M.F.; Ribeiro, C.; Leal, S. Exploring tea and herbal infusions consumption patterns and behaviours: The case of Portuguese consumers. Heliyon 2024, 10, e28779. [Google Scholar] [CrossRef] [PubMed]
  5. Vasić, D.; Katanić Stanković, J.S.; Urošević, T.; Kozarski, M.; Naumovski, N.; Khan, H.; Popović-Djordjević, J. Insight into bioactive compounds, antioxidant and anti-diabetic properties of rosehip (Rosa canina L.)-based tisanes with addition of hibiscus flowers (Hibiscus sabdariffa L.) and saffron (Crocus sativus L.). Beverages 2024, 10, 1. [Google Scholar] [CrossRef]
  6. Studzínska-Sroka, E.; Galanty, A.; Gościniak, A.; Wieczorek, M.; Klaput, M.; Dudek-Makuch, M.; Cielecka-Piontek, J. Herbal Infusions as a Valuable Food. Nutrients 2021, 13, 4051. [Google Scholar] [CrossRef] [PubMed]
  7. Soares Mateus, A.R.; Crisafulli, C.; Vilhena, M.; Cruz Barros, S.; Pena, A.; Sanches Silva, A. The Bright and Dark Side of Herbal Infusions: Assessment of Antioxidant Capacity and Determination of Tropane Alkaloids. Toxins 2023, 15, 245. [Google Scholar] [CrossRef] [PubMed]
  8. Radulović, N.S.; Stojković, M.B.; Mitić, S.S.; Randjelović, P.J.; Ilić, I.R.; Stojanović, N.M.; Stojanović-Radić, Z.Z. Exploitation of the Antioxidant Potential of Geranium macrorrhizum (Geraniaceae): Hepatoprotective and Antimicrobial Activities. Nat. Prod. Commun. 2012, 7, 1934578X1200701218. [Google Scholar] [CrossRef]
  9. Światek, L.; Sieniawska, E.; Sinan, K.I.; Maciejewska-Turska, M.; Boguszewska, A.; Polz-Dacewicz, M.; Senkardes, I.; Ozmen Guler, G.; Sadeer, N.B.; Fawzi Mahomoodally, M.; et al. LC-ESI-QTOF-MS/MS Analysis, Cytotoxic, Antiviral, Antioxidant, and Enzyme Inhibitory Properties of Four Extracts of Geranium pyrenaicum Burm.f: A Good Gift from the Natural Treasure. Int. J. Mol. Sci. 2021, 11, 7621. [Google Scholar] [CrossRef]
  10. Ghasemi, F.; Rezaei, F.; Araghi, A.; Abouhosseini Tabari, M. Antimicrobial Activity of Aqueous-Alchocolic Extracts and the Essential Oil of Verbascum thapsus L. Jundishapur J. Nat. Pharm. Prod. 2015, 10, e23004. [Google Scholar] [CrossRef]
  11. Riaz, M.; Zia-UI-Hay, M.; Jaafar, H.Z. Common Mullein, Pharmacological and Chemical Aspects. Rev. Bras. Farmacogn. 2013, 23, 948–959. [Google Scholar] [CrossRef]
  12. Tuker, A.U.; Ekrem, G. Common Mullein (Verbascum thapsus L.): Recent Advances in Research. Phytother. Res. 2005, 19, 733–739. [Google Scholar] [CrossRef]
  13. Saeidnia, S.; Sarkhail, P.; Moradi-Afrapoli, F.; Gohari, A.R.; Nikan, M.; Mokhber-Dezfuli, N.; Amin, G.R.; Hadjiakhoondi, A. GC/MS Analysis of the Volatile Compounds of P. hyrcanicum Diethyl Ether Extract and GC Profiling of Some Iranian Polygonum Species. Res. J. Pharmacogn. 2014, 1, 3–7. [Google Scholar]
  14. Dong, X.; Fu, J.; Yin, X.; Li, X.; Wang, B.; Cao, S.; Zhang, H.; Zhao, Y.; Ni, J. Pharmacological and Other Bioactivities of the Genus Polygonum—A Review. Trop. J. Pharm. Res. 2014, 13, 1749–1759. [Google Scholar]
  15. Al-Snafi, A. The Traditional Uses, Constituents and Pharmacological Effects of Ononis spinosa. IOSR J. Pharm. 2020, 10, 53–59. [Google Scholar]
  16. Stojković, D.; Drakulić, D.; Gašić, U.; Zengin, G.; Stevanović, M.; Rajčević, N.; Soković, M. Ononis spinosa L., an Edible and Medicinal Plant: UHPLC-LTQ-Orbitrap/MS Chemical Profiling and Biological Activities of the Herbal Extract. Food Funct. 2020, 11, 7138. [Google Scholar] [CrossRef] [PubMed]
  17. Kaczorová, D.; Karalija, E.; Dahija, S.; Bešta-Gajević, R.; Parić, A.; Ćavar Zeljković, S. Influence of extraction solvent on the phenolic profile and bioactivity of two Achillea species. Molecules 2021, 26, 1601. [Google Scholar] [CrossRef] [PubMed]
  18. Uçar, E. Polygonum aviculare L.’s biological activities: Investigating its anti-proliferative, antioxidant, chemical properties supported by molecular docking study. Inorg. Chem. Commun. 2024, 162, 112228. [Google Scholar] [CrossRef]
  19. Aleksieiev, A.; Maslowski, M.; Efenberger-Szmechtyk, M.; Strzelec, K. The influence of freeze-dried alcohol-water extracts from common yarrow (Achillea millefolium L.) and german chamomile (Matricaria chamolilla L.) on the properties of elastomer vulcanizates. Int. J. Mol. Sci. 2022, 23, 15048. [Google Scholar] [CrossRef]
  20. Bilušić, T.; Kalušević, A.; Marijanović, Z.; Jerković, I.; Mužek, M.N.; Bratanić, A.; Skroza, D.; Zorić, Z.; Pedišić, S.; Nedović, V.; et al. Influences of Freeze- and Spray-Drying vs. Encapsulation with Soy and Whey Proteins on Gastrointestinal Stability and Antioxidant Activity of Mediterranean Aromatic Herbs. Int. J. Food Sci. Technol. 2021, 56, 1582–1596. [Google Scholar] [CrossRef]
  21. Yen, G.C.; Duh, P.D. Scavenging Effect of Methanolic Extracts of Peanut Hulls on Free-Radical and Active-Oxygen Species. J. Agric. Food Chem. 1994, 42, 629–632. [Google Scholar] [CrossRef]
  22. Benzie, I.F.; Strain, J.J. The Ferric Reducing Ability of Plasma (FRAP) as a Measure of “Antioxidant Power”: The FRAP Assay. Anal. Biochem. 1996, 239, 70–76. [Google Scholar] [CrossRef]
  23. Tavares Silva, E.; Spacino, K.R.; Chanan Silva, L.R.; Signori Romagnoli, E.; Gomes Angilelli, K.; Borsato, D. Modelling of Relative Protection Factor of Antioxidants TBHQ, BHT and BHA in Mixture with Biodiesel. Acta Scient Technol. 2018, 40, e35108. [Google Scholar] [CrossRef]
  24. The European Committee on Antimicrobial Susceptibility Testing. Breakpoint Tables for Interpretation of MICs and Zone Diameters. Version 14.0. 2024. Available online: http://www.eucast.org (accessed on 22 July 2017).
  25. Rončević, T.; Gerdol, M.; Mardirossian, M.; Maleš, M.; Cvjetan, S.; Benincasa, M.; Maravić, A.; Gajski, G.; Krce, L.; Aviani, I.; et al. Anisaxins, Helical Antimicrobial Peptides from Marine Parasites, Kill Resistant Bacteria by Lipid Extraction and Membrane Disruption. Acta Biomater. 2022, 146, 131–144. [Google Scholar] [CrossRef]
  26. Bljajić, K.; Brajković, A.; Čačić, A.; Vujić, L.; Jablan, J.; Saravia de Carvalho, I.; Zovko Končić, M. Chemical composition, antioxidant and α-glucosidase-inhibiting activity of aqueous and hydroethanolic extracts of traditional antidiabetics from Croatian ethnomedicine. Horticulturae 2021, 7, 15. [Google Scholar] [CrossRef]
  27. Marijan, M.; Jakupović, L.; Vujić, L.; Jurić, M.; Zovko Končić, M. Urban parks biowaste as a sustainable source of new antidiabetics. Acta Pharm. 2024, 74, 613–633. [Google Scholar] [CrossRef] [PubMed]
  28. Bilušić, T.; Šola, I.; Čikeš Čulić, V. Identification of flavonoids, antioxidant and antiproliferative activity of aqueous infusions of Calendula officinalis L., Chelidonium majus L., Teucrium chamaedrys L. and Alchemilla vulgaris L. Food Technol. Biotechnol. 2024, 62, 49–58. [Google Scholar] [CrossRef] [PubMed]
  29. Dias, M.I.; Barros, L.; Dueňas, M.; Pereira, E.; Carvalho, A.M.; Alves, R.C.; Oliveria, B.P.P.; Santos-Buelga, C.; Ferreira, I.C.F.R. Chemical Composition of Wild and Commerical Achillea millefolium L. and Bioactivity of the Methanolic Extract, Infusion and Decoction. Food Chem. 2013, 141, 4152–4160. [Google Scholar] [CrossRef]
  30. Aljaafreh, I.; Tarawneh, A.; Al Shbailat, Y.; Alzagameem, A.; Al-Marafi, H.; Albadaineh, H.; Rababah, T.M.; Al-u-Datt, M. Antioxidant and α-Amylase Inhibition Activities of Medicinal Plants are Traditionally Used for the Treatment of Digestive Disorders in the near East Region. J. Microbiol. Bioctechnol Food Sci. 2023, 13, e9072. [Google Scholar] [CrossRef]
  31. Yu, Y.; Liu, G.; Piao, M.; Lang, M.; Wang, Y.; Jin, M.; Li, G.; Zheng, M. Chemical Constituents of Polygonum aviculare L. and their Chemotaxonomic Significance. Biochem. Systemat Ecol. 2022, 105, 104529. [Google Scholar] [CrossRef]
  32. Idoudi, S.; Tourrette, A.; Bouajila, J.; Romdhane, M.; Elfalleh, W. The Genus Polygonum: An Updated Comprehensive Review of its Ethnomedicinal, Phytochemical, Pharmacological Activities, Toxicology, and Phytopharmaceutical Formulation. Heliyon 2024, 10, e28947. [Google Scholar] [CrossRef]
  33. Renda, G.; Sari, S.; Barut, B.; Šoral, M.; Liptaj, T.; Korkmaz, B.; Özel, A.; Erik, I.; Şöhretoğlu, D. α-Glucosidase Inhibitory Effects of Polyphenols from Geranium asphodeloides: Inhibition Kinetics and Mechanistic Insights Through In Vitro and In Silico Studies. Bioorganic Chem. 2018, 81, 545–552. [Google Scholar] [CrossRef]
  34. Alshehri, B. The Geranium Species: A Comprehensive Study on Ethnomedicinal Uses, Phytochemical Compounds, and Pharmacologhical Importance. Saudi J. Biol. Sci. 2024, 31, 103940. [Google Scholar] [CrossRef] [PubMed]
  35. Ivancheva, S.; Petrova, A. A Chemosystematic Study of Eleven Geranium Species. Biochem. Systemat Ecol. 2000, 28, 255–260. [Google Scholar] [CrossRef]
  36. Miliauskas, G.; Beek, T.A.; Venskutonis, P.R.; de Ward, P. Antioxidant Activity of Geranium macrorrhizum. Eur. Food Res. Technol. 2004, 218, 253–261. [Google Scholar] [CrossRef]
  37. Gupta, A.; Atkinson, A.N.; Kumar Pandey, A.; Bishayee, A. Health-Promoting and Disease-Mitigating Potential of Verbascum thapsus L. (Common Mullein): A Review. Phyotherapy Res. 2022, 36, 1507–1522. [Google Scholar] [CrossRef] [PubMed]
  38. Mahdavi, S.; Amiradalat, M.; Babashpour, M.; Sheikhlooei, H.; Miransari, M. The Antioxidant, Anticancerogenic and Antimicrobial Properties of Verbascum thapsus L. Medicinal Chem. 2020, 16, 991–995. [Google Scholar] [CrossRef]
  39. Selseleh, M.; Ebrahimi, S.N.; Alihamadi, A.; Sonboli, A.; Mirjalili, M.H. Metabolic Profiling, Antioxidant, and Antibacterial Activity of some Iranian Verbascum L. Species. Ind. Crops Prod. 2020, 153, 112609. [Google Scholar] [CrossRef]
  40. Ilić, M.; Samardžić, S.; Kotur-Stevuljević, J.; Ušjak, D.; Milenković, M.; Kovačević, N.; Drobac, M. Polyphenol Rich Extracts of Geranium L. Species as Potential Natural Antioxidant and Antimicrobial Agents. Eur. Rev. Med. Pharmacol. Sci. 2021, 25, 6283–6294. [Google Scholar] [CrossRef]
  41. Navaie, B.A.; Kavoosian, S.; Fattahi, S.; Hajian-Tilaki, K.; Asouri, M.; Bishekolaie, R.; Akhavan-Niaki, H. Antioxidant and Cytotoxic Effect of Aqueous and Hydroalcoholic Extracts of the Achillea Millefolium L. on MCF-7 Breast Cancer Cell Line. Int. Biol. Biomed. J. 2015, 1, 119–125. [Google Scholar]
  42. Ivancheva, S.; Manolova, N.; Serkedjieva, J.; Dimov, V.; Ivanovska, N. Polyphenols from Bulgarian Medicinal Plants with Anti-Infectious Activity. Basic. Life Sci. 1992, 59, 717–728. [Google Scholar] [CrossRef]
  43. Turker, A.U.; Camper, N.D. Biological Activity of Common Mullein, A Medicinal Plant. J. Ethnopharmacol. 2002, 82, 117–125. [Google Scholar] [CrossRef]
  44. Shahbaz, F.; Akhter, N.; Shahid, M.; Riaz, M.; Anjum, F.; Hussain, F. Ultrasound Assisted Extraction and Characterization of Biaoctives from Verbascum thapsus Roots to Evaluate Their Antioxidant and Medicinal Potential. Dose Response 2022, 3, 15593258221097665. [Google Scholar] [CrossRef]
  45. Grigore, A.; Colceru-Mihul, S.; Bazdoaca, C.; Yuksel, R.; Ionita, C.; Glava, L. Antimicrobial Activity of an Achillea millefolium L. Proceedings 2020, 57, 34. [Google Scholar] [CrossRef]
  46. Noda, K.; Kato, E.; Kawabata, J. Intestinal α-Glucosidase Inhibitors in Achillea millefolium. Nat. Prod. Commun. 2017, 12, 1259–1261. [Google Scholar] [CrossRef]
  47. Cai, Y.; Wu, L.; Lin, X.; Hu, X.; Wang, L. Phenolic Profiles and Screening of Potential α-Glucosidase Inhibitors from Polygonum aviculare L. Leaves Using Ultra-Filtration Combined with HPLC-ESI-qTOF-MS/MS and Molecular Docking Analysis. Ind. Crops Prod. 2020, 154, 112673. [Google Scholar] [CrossRef]
  48. Zhang, N.; Baran, A.; Valioglu, F.; Teng, L.; Atalar, M.N.; Keskin, C.; Wang, X.X.; Hatipoğlu, A.; Baran, M.F.; Abdelsalam, A.H.; et al. Antioxidant, AChE Inhibitory, and Anticancer Effects of Verbascum thapsus Extract. Cell. Mol. Biol. 2024, 69, 211–216. [Google Scholar] [CrossRef]
  49. Aleixandre, A.; Gil, J.V.; Sineiro, J.; Rosell, C.M. Understanding Phenolic Acids Inhibition of α-Glucosidase and Influence of Reaction Conditions. Food Chem. 2022, 372, 131231. [Google Scholar] [CrossRef]
  50. Deipenbrock, M.; Sendker, J.; Hensel, A. Aqueous Root Extract from Ononis spinosa Exerts Anti-Adhesive Activity against Uropathogenic Escherichia coli. Plant Med. 2020, 86, 247–254. [Google Scholar] [CrossRef] [PubMed]
  51. Klimaszewska-Wiśniewska, A.; Halas-Wiśniewska, M.; Izdebska, M.; Gagat, M.; Grzanka, A.; Grzanka, D. Antiproliferative and Antimetastatic Action of Quercetin on A549 Non-Small Lung Cancer Cells through its Effects on the Cytoskeleton. Acta Histochem. 2017, 119, 99–112. [Google Scholar] [CrossRef]
Figure 1. (a) Micrographs of the surface microstructure of G. machrorrhizum (dried plant) and after hot water treatment (dried infusate) scanned by SEM. (b) Micrographs of the surface microstructure of O. spinosa (root) and after hot water treatment (dried infusate) scanned by SEM.
Applsci 15 03254 g001
Figure 2. The principal component analysis showing (a) the relation between plant species based on the analyzed variables, whose grouping is shown in the (b) part of the figure.
Applsci 15 03254 g002
Figure 3. Hierarchical clustering of plant species expressed as Euclidean distance, based on the measured total identified phenolic acids, flavonoids and phenolic compounds, the ability to inhibit α-amylase and α-glucosidase, and the antioxidant capacity.
Applsci 15 03254 g003
Table 1. HPLC analysis of aqueous herbal infusions.
Phenolic CompoundsMass Concentration (mg/L)
Achillea Millefolium L.Polygonum Aviculare L.Ononis Spinosa L.Geranium Macrorrhizum L.Verbascum Thapsus L.
Gallic acid12.25 ± 0.65n.d.21.36 ± 0.7923.79 ± 1.0166.72 ± 2.40
Protocatechuic acid6.30 ± 0.059.97 ± 0.15n.d.n.d.16.34 ± 0.49
Chlorogenic acid and its derivatives337.38 ± 4.724.34 ± 0.073.29 ± 0.10n.d.39.32 ± 0.97
Caffeic acid and its derivatives13.76 ± 0.17n.d.5.13 ± 0.242.39 ± 0.0416.34 ± 0.49
p-coumaric acid and its derivatives2.79 ± 0.023.27 ± 0.066.44 ± 0.14n.d.n.d.
Ferulic acid and its derivatives s189.66 ± 4.23n.d.n.d.n.d.n.d.
Syringic acid and its derivativesn.d.n.d.n.d.71.30 ± 2.0516.39 ± 0.21
Rosmarinic acidn.d.n.d.n.d.n.d.23.01 ± 0.58
Hydroxycinnamic acid (derivatives)85.98 ± 0.78n.d.82.58 ± 0.4867.55 ± 1.7725.47 ± 0.60
Total phenolic acids648.13 ± 5.47 a**17.59 ± 0.17 e118.79 ± 0.90 d165.03 ± 2.29 c 190.91 ± 3.78 b
Flavan-3-ols n.d.520.69 ± 7.43161.33 ± 4.88n.d.n.d.
Quercetin and its derivatives45.89 ± 0.69274.88 ± 2.93n.d.300.44 ± 1.5739.43 ± 0.94
Kaempferol and its derivativesn.d.223.26 ± 3.34n.d.192.55 ± 3.1444.15 ± 0.98
Luteolin and its derivatives56.02 ± 0.484.71 ± 0.29n.d.128.96 ± 3.453.76 ± 0.14
Apigenin and its derivatives72.84 ± 0.951.22 ± 0.06n.d.n.d.n.d.
Catechin and its derivativesn.d.36.23 ± 0.28n.d.n.d.n.d.
Total flavonoids174.74 ± 1.97 c1060.99 ± 6.96 a 161.33 ± 4.88 d 621.94 ± 2.00 b 87.34 ± 1.83 e
Procyanidinsn.d.176.13 ± 3.85n.d.744.48 ± 9.8694.46 ± 0.87
Total phenolic compounds822.87 ± 6.18 c1254.72 ± 8.73 b 280.12 ± 5.64 e 1531.45 ± 11.58 a 372.71 ± 1.94 d
Results are expressed as mean value ± st.dev; n.d.—not detected. ** Different letters indicate a significant difference (ANOVA, Duncan test, p ≤ 0.05).
Table 2. Antioxidant activity of aqueous herbal infusions.
SampleDPPH Assay
IC50 (mg/mL)
FRAP Assay
(mg FeCl2/L)
Rancimat (PF **)
Geranium macrorrhizum L.3.75 ± 0.02 d3584.61 ± 18.05 a1.14 ± 0.02 a
Verbascum thapsus L.23.78 ± 0.04 b265.24 ± 11.70 en.d.
Achillea millefolium L.3.75 ± 0.02 d3308.24 ± 18.33 b1.10 ± 0.01 a
Polygonum aviculare L.11.90 ± 0.01 c832.91 ± 10.04 c1.11 ± 0.02 a
Ononis spinosa L.30.00 ± 0.01 a495.81 ± 24.17 dn.d.
BHT0.018 ± 0.002/3.90 ± 0.34
BHA0.054 ± 0.002/7.2 ± 0.08
Ascorbic acidn.d.(2.60 ± 0.22) × 10−4n.d.
Values represent mean ± S.D., n = 3. PF = protection factor, BHT = butylated hydroxytoulene, BHA = butylated hydroxyanisole, n.d. = not detected, /—not determined. ** Different letters indicate a significant difference among (ANOVA, Duncan test, p ≤ 0.05).
Table 3. Anti-hyperglycemic activity of selected plants aqueous infusions through inhibition of α-glucosidase and α-amylase.
SampleInhibition of
α-Glucosidase IC50 (mg/mL)
Inhibition of
α-Amylase
IC50 (mg/mL)
Geranium macrorrhizum L.1.22 ± 0.01 c**5.03 ± 0.03 b
Verbascum thapsus L.43.61 ± 1.09 d136.39 ± 16.65 a
Achillea millefolium L.n.d.n.d.
Polygonum aviculare L.55.18 ± 5.67 an.d
Ononis spinosa L.4.09 ± 0.09 c14.45 ± 0.18 b
acarbose1.44 ± 0.01 c1.84 ± 0.01 b
Values represent mean ± S.D., n = 3. n.d. = not determined. ** Different letters indicate a significant difference among the values (ANOVA, Duncan test, p ≤ 0.05).
Table 4. In vitro antiproliferative activity (inhibition of cell proliferation (%)) of aqueous infusions at different concentrations from selected plant species against the MD-MBA-231 cancer cells.
Sample (g/L)Inhibition of Cell Proliferation (%)
t/h
1.004244872
Geranium macrorrhizum15.82 ± 1.06 a**17.03 ± 2.92 b40.48 ± 0.46 a54.99 ± 2.80 a
Verbascum thapsus12.33 ± 3.00 ab12.64 ± 2.24 c16.60 ± 1.20 d26.79 ± 0.70 d
Ononis spinosa13.61 ± 3.10 ab19.02 ± 0.96 b30.11 ± 0.85 b49.05 ± 1.47 b
Achillea millefolium11.12 ± 2.59 ab19.61 ± 1.94 b38.09 ± 1.89 a48.53 ± 3.73 b
Polygonum aviculare7.95 ± 2.45 b25.43 ± 3.18 a27.26 ± 0.72 c36.30 ± 3.03 c
0.504244872
Geranium macrorrhizum13.41 ± 2.49 a16.41 ± 1.43 ab29.77 ± 1.21 a46.07 ± 1.38 a
Verbascum thapsus////
Ononis spinosa10.56 ± 1.12 ab15.41 ± 2.39 ab30.54 ± 2.13 a38.05 ± 1.17 b
Achillea millefolium9.71 ± 0.43 ab13.48 ± 2.90 b31.70 ± 1.78 a36.78 ± 3.00 b
Polygonum aviculare8.62 ± 2.93 b19.07 ± 1.27 a20.52 ± 1.21 b28.83 ± 1.25 c
0.254244872
Geranium macrorrhizum7.35 ± 0.88 a11.34 ± 1.39 a27.93 ± 1.14 a43.98 ± 1.36 a
Verbascum thapsus////
Ononis spinosa8.75 ± 1.05 a11.69 ± 1.04 a22.06 ± 1.47 b37.08 ± 2.88 b
Achillea millefolium10.95 ± 3.48 a12.74 ± 2.45 a31.16 ± 1.44 a40.20 ± 3.31 ab
Polygonum aviculare2.20 ± 0.85 b12.30 ± 1.82 a15.60 ± 3.31 c20.33 ± 1.11 c
0.10 g/L4244872
Geranium macrorrhizum2.96 ± 0.14 b10.57 ± 2.87 a16.31 ± 1.44 b22.81 ± 2.50 b
Verbascum thapsus////
Ononis spinosa5.75 ± 0.45 a13.28 ± 3.14 a19.56 ± 0.94 b21.14 ± 3.84 b
Achillea millefolium4.07 ± 0.96 b9.11 ± 1.08 ab23.68 ± 2.11 a30.05 ± 1.74 a
Polygonum aviculare0.41 ± 0.58 c5.07 ± 1.11 b9.92 ± 2.51 c13.47 ± 0.70 c
Positive control (cisplatin 50 µg/mL)13.62 ± 2.2720.74 ± 1.7650.22 ± 0.9579.45 ± 1.54
Values represent mean ± standard deviation of 3 replicates. ** Different letters indicate a significant difference among the values in a column, for each concentration separately (ANOVA, Duncan test, p ≤ 0.05). / = not detected (due to the low activity at higher concentration).
Table 5. In vitro antiproliferative activity (inhibition of cell proliferation (%)). of aqueous infusions at different concentrations from selected plant species against the A549 cancer cells.
Sample (g/L)Inhibition of Cell Proliferation (%)
t/h
1.0042448
Geranium macrorrhizum10.17 ± 0.98 b**74.02 ± 2.70 a81.30 ± 3.37 a96.15 ± 0.16 a
Verbascum thapsus0.00 ± 0.003.37 ± 2.19 d19.77 ± 0.90 d29.88 ± 3.47 c
Ononis spinosa11.24 ± 0.75 b22.37 ± 1.80 c70.77 ± 1.56 b96.45 ± 1.24 a
Achillea millefolium5.17 ± 1.33 c23.12 ± 0.38 c39.84 ± 1.04 c88.84 ± 1.44 b
Polygonum aviculare17.82 ± 2.65 a37.54 ± 0.43 b78.50 ± 1.75 a94.40 ± 3.18 a
0.504244872
Geranium macrorrhizum9.91 ± 1.08 a23.75 ± 2.65 b29.36 ± 0.60 c34.71 ± 2.67 d
Verbascum thapsus////
Ononis spinosa7.95 ± 1.49 a15.30 ± 2.26 c21.26 ± 0.95 d41.25 ± 0.89 c
Achillea millefolium4.23 ± 1.05 b18.99 ± 1.70 bc34.24 ± 3.00 b74.98 ± 0.88 b
Polygonum aviculare8.70 ± 0.45 a32.40 ± 3.27 a74.80 ± 3.39 a87.93 ± 1.60 a
0.254244872
Geranium macrorrhizum7.51 ± 0.25 a16.11 ± 0.84 b25.34 ± 0.58 c26.68 ± 2.68 c
Verbascum thapsus////
Ononis spinosa5.42 ± 2.14 a10.65 ± 0.67 c17.17 ± 2.27 d20.92 ± 0.80 d
Achillea millefolium4.69 ± 0.83 a20.92 ± 1.93 a30.31 ± 0.62 b56.41 ± 1.91 b
Polygonum aviculare4.33 ± 1.94 a15.33 ± 1.61 b49.16 ± 1.45 a67.96 ± 1.73 a
0.104244872
Geranium macrorrhizum8.80 ± 1.18 a6.66 ± 0.41 b8.44 ± 1.60 c15.52 ± 1.24 c
Verbascum thapsus////
Ononis spinosa7.41 ± 1.58 a8.33 ± 0.77 b10.16 ± 0.53 c16.00 ± 0.18 c
Achillea millefolium2.16 ± 0.81 bc11.10 ± 2.28 a30.09 ± 3.05 b38.56 ± 1.75 a
Polygonum aviculare3.53 ± 0.73 b12.46 ± 1.26 a18.15 ± 1.65 a28.47 ± 1.93 b
Positive control
(50 µg/mL cisplatin)
0.00 ± 0.007.96 ± 1.2217.74 ± 1.7815.3 ± 0.10
Values represent mean ± standard deviation of 3 replicates. ** Different letters indicate a significant difference among the values in a column, for each concentration separately (ANOVA, Duncan test, p ≤ 0.05). / = not detected (due to the low activity at higher concentration).
Table 6. In vitro antiproliferative activity (inhibition of cell proliferation (%)) of aqueous infusions at different concentrations from selected plant species again the T24 cancer cells.
Sample (g/L)Inhibition of Cell Proliferation (%)
t/h
1.004244872
Geranium macrorrhizum3.85 ± 1.58 bc **22.13 ± 1.54 a51.17 ± 0.82 a96.20 ± 2.52 a
Verbascum thapsus3.48 ± 1.47 bc6.28 ± 0.69 c10.79 ± 2.38 d18.05 ± 2.71 d
Ononis spinosa10.94 ± 1.83 a16.26 ± 2.99 b37.64 ± 2.67 b58.96 ± 1.55 b
Achillea millefolium5.74 ± 1.85 b15.09 ± 0.82 b18.69 ± 3.11 c32.44 ± 2.55 c
Polygonum aviculare1.39 ± 0.44 c17.62 ± 1.38 b19.51 ± 0.60 c10.06 ± 1.44 e
0.504244872
Geranium macrorrhizum4.33 ± 1.98 a18.17 ± 1.48 a38.48 ± 1.74 a92.28 ± 2.06 a
Verbascum thapsus////
Ononis spinosa7.94 ± 1.56 a20.69 ± 3.44 a35.58 ± 1.03 a45.83 ± 3.35 b
Achillea millefolium////
Polygonum aviculare////
0.254244872
Geranium macrorrhizum7.23 ± 1.02 a15.46 ± 0.70 a32.75 ± 1.92 a39.51 ± 1.70 a
Verbascum thapsus////
Ononis spinosa6.66 ± 0.41 a10.43 ± 0.47 b20.28 ± 2.52 b25.61 ± 3.35 b
Achillea millefolium////
Polygonum aviculare////
0.104244872
Geranium macrorrhizum2.35 ± 0.55 a11.46 ± 2.50 a26.76 ± 0.45 a32.70 ± 1.42 a
Verbascum thapsus////
Ononis spinosa2.50 ± 0.68 a11.82 ± 1.12 a15.60 ± 0.45 b18.25 ± 2.31 b
Achillea millefolium////
Polygonum aviculare////
Positive control
(cisplatin 50 µg/mL)
8.44 ± 1.2213.67 ± 2.1943.83 ± 1.5547.69 ± 0.09
Values represent mean ± standard deviation of 3 replicates. ** Different letters indicate a significant difference among the values in a column, for each concentration separately (ANOVA and post-hoc Duncan test for multiple samples, and Student’s t-test where only the values for two plant samples were measurable; p ≤ 0.05). / = not detected (due to the low activity at higher concentration).
Disclaimer/Publisher’s Note: The statements, opinions and data contained in all publications are solely those of the individual author(s) and contributor(s) and not of MDPI and/or the editor(s). MDPI and/or the editor(s) disclaim responsibility for any injury to people or property resulting from any ideas, methods, instructions or products referred to in the content.

