Article

Influence of Terroir on Microbial Diversity and Wine Volatilome

by
María Trinidad Alcalá-Jiménez
,
Teresa García-Martínez
*,
Juan Carlos Mauricio
,
Juan Moreno
and
Rafael A. Peinado
Department of Agricultural Chemistry, Edaphology and Microbiology, Agrifood Campus of International Excellence CeiA3, University of Córdoba, 14014 Córdoba, Spain
*
Author to whom correspondence should be addressed.
Appl. Sci. 2025, 15(6), 3237; https://doi.org/10.3390/app15063237
Submission received: 20 February 2025 / Revised: 12 March 2025 / Accepted: 14 March 2025 / Published: 16 March 2025
(This article belongs to the Special Issue Wine Technology and Sensory Analysis)

Abstract

:
In this research, the differences between two terroirs belonging to the Protected Designation of Origin (PDO) Montilla–Moriles (Spain) were analyzed. Both areas share soil and climate characteristics, grape varieties, viticultural practices, and winemaking processes. Therefore, the objective of this study was to establish differences between both areas based on the microbiome of the must, the oenological parameters, and the majority and minority volatile compounds of the wines, thus determining the identity traits that make the wines from both areas so different. The results obtained are quite revealing, since at the microbiome level qualitative differences were established between the various areas. In the quality area, the predominant species is Torulaspora delbrueckii while in the production area it is Hanseniaspora opuntiae. Regarding the volatilome, it was observed that the aromatic profile of the wines from the production area has more citrus-fruity aromas and the quality area has honey-floral aromas, thus producing unique wines from each of the areas.

1. Introduction

Alcoholic fermentation, the process of transforming grape must into wine, has been extensively studied for many years. This process is carried out by yeasts, which convert the sugars present in the must into alcohol and carbon dioxide [1,2]. The microbiota of the must is sometimes unknown, which makes spontaneous fermentation a risky and unpredictable practice. In addition to yeast, filamentous fungi and bacteria are also found in the microbiota of a must [3,4].
Non-Saccharomyces, once considered undesirable during wine fermentation, have recently gained recognition for their positive contributions to wine quality [5]. These yeasts are found in vineyards and on the surface of the grapes, and they are the first to appear during spontaneous fermentation [6]. This type of fermentation is the most traditional method for carrying out alcoholic fermentation in wineries, producing a more complex organoleptic profile. Their concentration is influenced by grape variety, geographical-climatic conditions, and viticultural practices [7]. They produce a high concentration of glycerol, extracellular enzymes involved in the decrease in ethanol content and the organoleptic profile [8,9,10,11]. Jackowski et al. [12] used Non-Saccharomyces yeasts as an alternative to reduce the alcohol content in beverage fermentation. This measure could be used to mitigate the effect that global warming has had on over-ripening, producing wines with a high alcohol content.
The aroma of fruit wine is influenced by several factors, one of the main factors being the alcoholic fermentation carried out by microorganisms [10]. Sun et al. [13] studied the enzymatic activity of Non-Saccharomyces for the production of kiwi fruit wine, where β-glucosidase activity improved the aromatic complexity by releasing volatile compounds such as higher alcohols, ethyl esters, acetates, and other volatile aromatics, thus improving the aromatic quality of the fruit wine.
In the present study, some genera of Non-Saccharomyces were isolated: Hanseniaspora spp., which is the main genus present in ripe grapes, produces enzymes and aromatic compounds that increase the diversity of flavors; Lachancea spp. is also present on the surface of the grape and produces lactic acid, increasing acidification; Pichia spp. is known for its ability to increase the composition of aromatic compounds, providing thiols, terpenes, and fruity esters; and Torulaspora spp. is a genus commonly used in oenology and is recognized for its ability to improve wine quality. The objective of this study was to distinguish the production and quality areas of the Protected Designation of Origin (P.D.O.) Montilla–Moriles (Córdoba, Spain) and assess their oenological potential through analysis of microbiota and their volatilome.

2. Materials and Methods

2.1. Isolation of Autochthonous Wine Yeasts

Wine yeasts were isolated from natural musts from two regions within the Spanish wine appellation P.D.O. Montilla–Moriles, (Córdoba, Spain): (i) it is the “Quality Zone (QZ)”, which is the Sierra de Montilla, made up of the following wineries—Lagar Los Borbones (N37°35′39.245″, W4°37′57.912″), Lagar Saavedra (N37°33′17.64″, W4°38′8.518″) and Lagar Cañada Navarro (N37°31′55.743″, W4°33′29.137″); (ii) it is the “Production Zone (PZ)” which is made up of the following—Cooperativa de Aguilar de la Frontera (Coop. Aguilar de la Fra) (N37°30′53.136″, W4°39′25.811″), Cooperativa de San Acacio (Coop. San Acacio) (N37°38′52.44″, W4°41′52.079″), and Cooperativa de la Unión (Coop. La Unión) (N37°34′47.657″, W4°38′13.818″). A total of 292 isolates were collected during the spontaneous fermentation of the must. Specifically, 174 isolates were obtained from the QZ area, while 118 isolates were collected from the PZ area (Figure 1a).

2.2. Culture Media and Enzymatic Screening Procedures

2.2.1. Medium Wallerstein Laboratory (WL)

Oxoid brand dehydrated medium was prepared and mixed at 6% (w/v) with 2% (w/v) agar and distilled water, according to the manufacturer’s recommendations. It was then sterilized in an autoclave for 15 min at 120 °C. The plates were incubated at 28 °C for two days. Colonies were initially isolated on WL nutrient medium to allow the differentiation between Non-Saccharomyces yeasts (and bacteria) based on colony morphology and on their color [14].

2.2.2. Medium Lysine

The medium lysine was used to test if the isolated yeasts were Non-Saccharomyces. It was prepared from Oxoid brand dehydrated medium, mixing 6.6% (w/v) with distilled water as recommended by the manufacturer. It was then sterilized in the autoclave for 30 min with flowing steam and dispensed into Petri dishes. The result was positive if after making two consecutive passes growth was observed.

2.2.3. Determination of Yeast Killer Activity

Killer activity was measured by the method described by Ramírez et al. [15]. Yeast was tested on pH 4.0 methylene blue plates (MB) [16] seeded with 100 μL of a 48 h grown culture of the sensitive strain. The strains being tested for killer activity were either covered solid cultures or replica plated onto the sown MB plates. Then the plates were incubated for 7 days at 21 °C.

2.2.4. Medium for Detecting β-Glucosidase Activity

β-Glucosidase activity was evaluated as reported by Lodder and Kreger., [17], on a medium containing 0.5% (w/v) arbutin, 0.1% (w/v) yeast extract, and a 1% solution of ferric (v/v) chloride and 2% agar (w/v). This medium was sterilized in an autoclave for 15 min at 120 °C. The sowing was incubated at 28 °C for two weeks. The justification for this medium is based on the hydrolysis of arbutin by β-glucosidase, which reacts with ferric chloride causing the latter to change the color of the medium from brown to black if the result is positive.

2.2.5. Medium for Detecting Cellulase Activity

Cellulase activity was assessed by plating yeast on plates containing 1% (w/v) yeast extract, 2% (w/v) agar (w/v), 2% (w/v) dextrose, 2% (w/v) peptone, and 0.4% carboxymethylcellulose (CMC, Sigma, Kanagawa, Japan). Plates were left at 30 °C over five days [18]. Colonies were cleaned with distilled water before staining with Lugol’s solution. Cellulase activity was scored as positive when a clear halo appeared around the colony.

2.3. Yeast Identification

Yeast identification was carried out using MALDI TOF mass spectrometry (Matrix-Assisted Laser Desorption/Ionization Time-Of-Flight Mass Spectrometry, MALDI TOF-MS) at the Central Research Support Service of the University of Córdoba. This technique allows the identification of microorganisms by generation of a mass spectrum based on the protein profile, which is specific for each genus and species [19].
In the process of preparing the samples for analysis by MALDI-TOF-MS, the different yeast strains under study were obtained directly from the medium solids used for their short-term preservation, and they were dispensed into Eppendorf tubes in which 300 μL of Milli-Q water and 900 μL of absolute ethanol (96%) were added.

2.4. Determination of Oenological Parameters

pH, volatile and total acidity, and ethanol were analyzed according to the OIV official methods [20].

2.4.1. Analytical Determinations of Volatile Compounds

Determination Major Aroma Compounds

Chromatographic conditions were previously described by Peinado et al. [21]. Major volatile compounds were quantified in a gas chromatograph HP 6890 Series II (Agilent technologies, Santa Clara, CA, USA) equipped with a CP-WAX 57 CB (50 m in length, 0.25 mm in internal diameter, and 0.4 μm in coating thickness) capillary column and a flame ionization detector (FID). Analytical standards were used subjected to the same chromatographic conditions as the samples used to quantify the volatile compounds.

Determination Minor Aroma Compounds

Aroma extraction and determination was carried as described by Palenzuela et al. [22]. The extraction was realized by using stir bar sorptive extraction with 0.5 mm film thickness and 10 mm length (Gerstel GmbH, Mülheim an der Ruhr, Germany) covered by PDMS. Wine samples were previously diluted (1:10), and 0.1 mL of ethyl nonanoate (0.4464 mg/L) as internal standard was used. Extraction was carried out at 1500 °C over 100 min.
After that stirs bars were introduced into glass desorption tubes and these were desorbed in a GC/MS equipped with a Gerstel TDS 2 thermodesorption system. The retention time of the pure chemical compounds obtained from Merck (St. Louis, MO, USA), Sigma–Aldrich (St. Louis, MO, USA), and spectral libraries were used to identify and quantify the aroma compounds.

2.5. Calculation of Aroma Series

The odor activity values (OAV) of the volatile compounds were calculated as the ratio between the concentration of each compound and its odor perception threshold. Compounds with similar odor descriptors were categorized into aromatic series, with the value of each series determined by summing the OAVs of the volatile compounds within it. The results are provided in Supplementary Material (Table S1). In this study, eleven aroma series were identified: Chemical, Citrus, Creamy, Floral, Fruity, Green, Green fruit, Herbal, Honey, Toasty, and Waxy.

2.6. Statistical Analysis

To identity differences among the various wine zones and among wineries, all the analyzed parameters and aroma compounds were subjected to statistical analysis by using the Statgraphics Centurion (v. 16.1.11) statistical package. All the experiments were carried out in triplicate. All the quantified compounds were subjected to an ANOVA Simple, and F-tests were used for the establishment of homogenous groups (different letters indicate significant differences al 95% of confidence level) and principal component analysis (PCA).

3. Results and Discussion

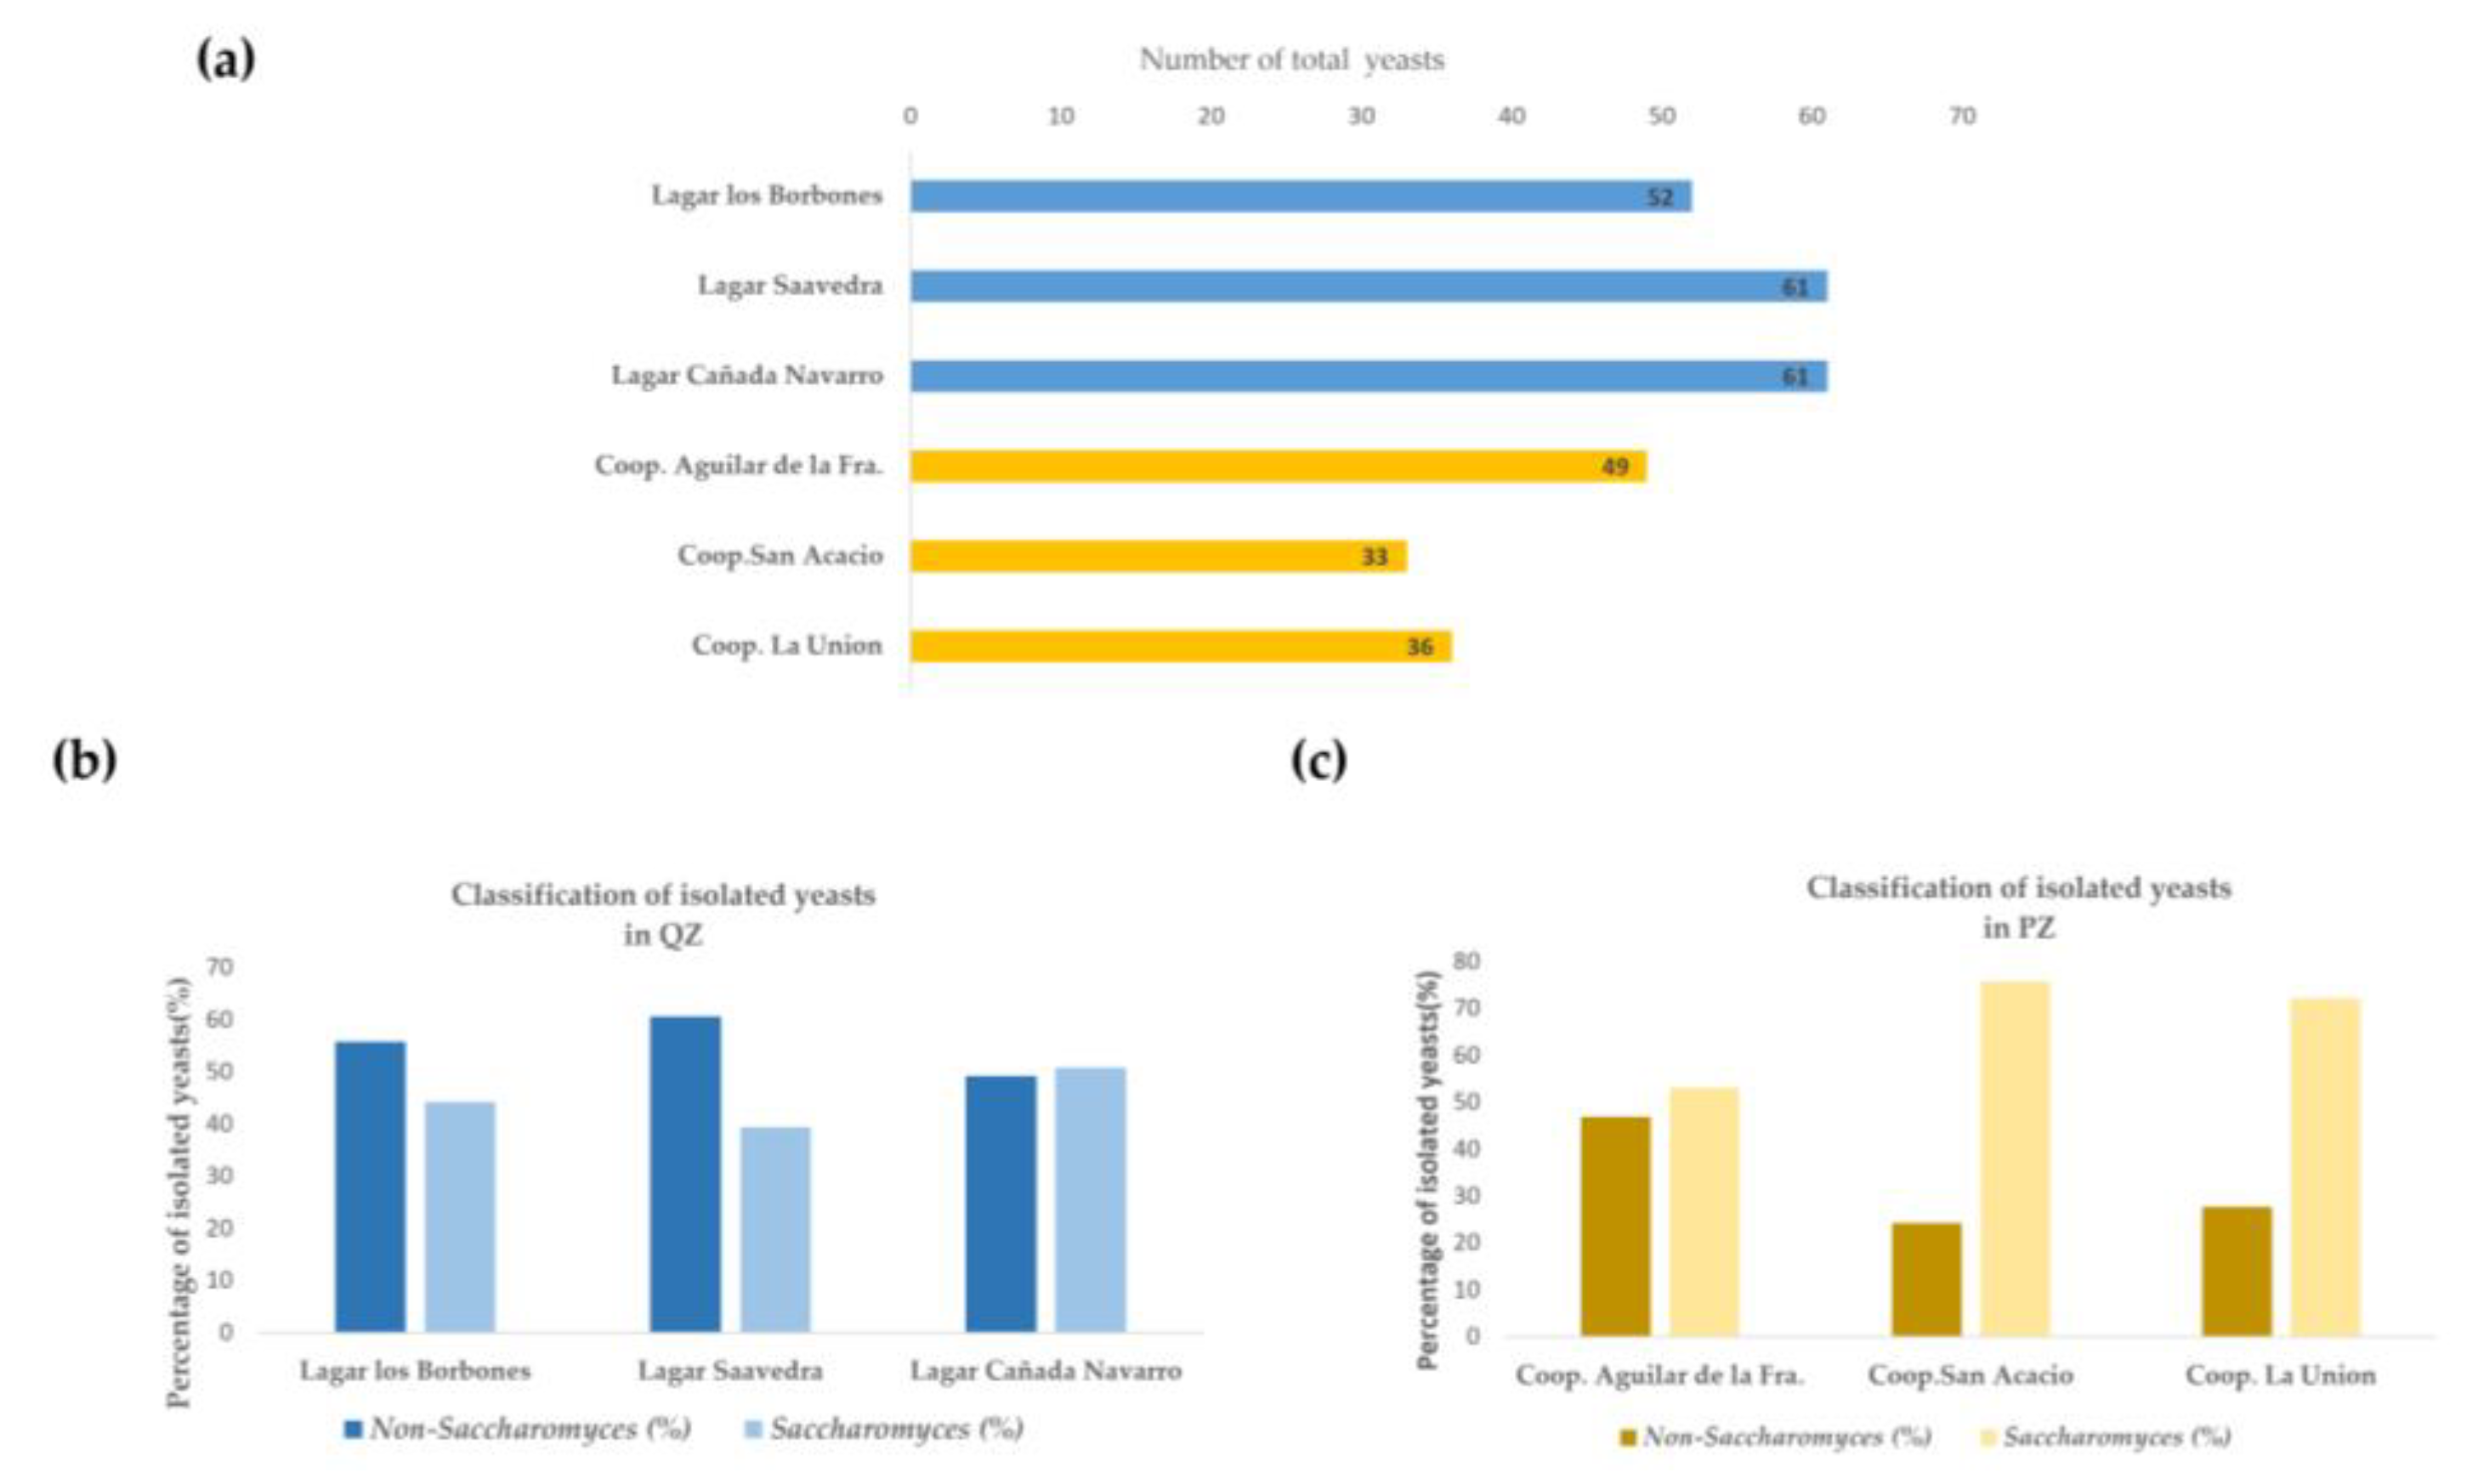
3.1. Microbiological Analysis

A total of 292 isolates were obtained during the spontaneous fermentation of the must, as mentioned in the section, “Isolation of Autochthonous Wine Yeasts” in Materials and Methods.
Total isolates from the QZ zone were used to differentiate the percentage of Saccharomyces and Non-Saccharomyces yeasts between the various wineries. It was shown that there was a greater number of isolates that corresponded to the Non-Saccharomyces genus. However, in Figure 1c, which corresponds to the PZ zone, it is observed that the highest percentage of the isolates obtained belong to the Saccharomyces genus. The results obtained in Figure 1a show that in QZ there is a greater number of yeast isolates during spontaneous fermentation of the must compared to PZ. This may be due to the absence of the qualitative killer activity of the yeasts since, as shown in Figure 2a, most of the yeasts found do not present killer activity, leading to the absence of biological control. In PZ it was found that there is greater killer activity of the yeasts, which could modify the population patterns of the fermentation and its evolution [23], obtaining a lower number of cultivable yeast isolates. Killer activity is carried out by yeasts that produce substances known as “killer substances”. These substances are antimicrobial protein compounds that inhibit the growth and development of yeast strains susceptible to these toxins, but not their own producers [24]. These proteins have a heterogeneous structure in size and complexity. This explains the lower number of cultivable isolates in the ZP zone, since by having a higher killer activity it can be concluded that in this zone there is a greater number of yeasts sensitive to these toxins. Figure 1b illustrates the distribution of yeast isolates from the QZ zone, highlighting the proportions of Saccharomyces and Non-Saccharomyces yeasts in the various wineries. The data reveal a predominance of Non-Saccharomyces isolates in this zone. In contrast, Figure 1c, which represents the PZ zone, shows a markedly different pattern. In this zone, the majority of isolates belong to the Saccharomyces genus, indicating a significant change in the dynamics of the yeast population between the two zones.
Figure 2b shows the qualitative activity of the β-glucosidase enzyme observed in the different isolates in various musts. It is noteworthy that PZ yeasts exhibit higher activity levels compared to QZ yeasts. β-glucosidase is a significant and well-studied enzyme due to its main role in the hydrolysis of substrates with glycosidic bonds, thus releasing glucose and aglycones [25]. This enzyme is responsible for the cleavage of glycosidic bonds such as 1,4-β and 1,6-α bonds, promoting the formation of free terpenes, phenylpropenes, and aliphatic esters. In fruit-based juices and wines, numerous aroma precursors exist in the form of glycosides. In grape-derived wines, the predominant aromatic glycosides are terpenes [26]. Under the catalytic action of β-glucosidase, these glycosides release volatile aromatic compounds, improving the sensory properties of the wine [27]. The aromatic compounds that are related to this activity are geraniol, nerol, citronellol, linalool, and α-terpineol [28]. Consequently, it can be concluded that PZ yeasts have a high potential to improve the aromas associated with compounds derived from glycosides; this explains, for example, that the concentration of citronellol in the production zone is higher compared to the quality zone. Also, in the minor compounds we found geraniol and nerol, however, between the zones, Figure 2c shows the results of the cellulolytic activity of the different isolates in the various musts. Cellulolytic activity allows the degradation of polysaccharides in the cell walls, thus increasing the fruity and sweet aroma of the wines due to the release of aromatic precursors and also allows better clarification and filtration of the must [29,30]. The yeasts from the production area have a lower activity than those from the quality area. This is related to the results obtained in the aromatic series section, where the wines that present a sweeter and fruitier aroma are those where the cellulitic activity is higher. Figure 2d shows the different species of yeasts that were isolated in each of the wineries and cooperatives. During the first phase of spontaneous fermentation, different genera of Non-Saccharomyces yeasts were isolated, such as Candida spp., Hanseniaspora spp., Pichia spp., and Torulaspora spp. These results agree with the research carried out by Stefanini and Cavalieri, [31]. Within the same areas there is a diversity in terms of the number of isolated species; this is due to the existence of different factors that influence the yeast communities associated with grapes, such as soil and climate factors and vineyard management [32,33]. The Non-Saccharomyces yeast species found in this study were Hanseniaspora opuntiae, Lachancea thermotolerans, Rhodotorula mucilaginosa, Torulaspora delbrueckii, Kluyveromyces marxianus, Hanseniaspora uvarum, Pichia kudriavzevii, Candida glabrata, and Pichia terricola, distributed among the cooperatives and wineries as shown in Figure 2d.

3.2. Oenological Parameters

In Table 1 the values shown represent the averages of triplicate samples (data are mean ± standard deviation (SD)). Values with different superscript letters in the same row are a significantly different test (p < 0.05). The ethanol content, volatile acidity, total acidity, and pH have values in accordance with the wines produced in the terroirs; however, significant differences are observed between the different wineries. Regarding total acidity, only Coop. La Unión and Coop. San Acacio present higher volatile acidity values than the rest of the wines. This may be due to a low level of contamination of the must with harmful microorganisms from the grapes or to the presence of Non-Saccharomyces yeasts typical of the terroir. With respect to ethanol content, only two wineries showed a higher ethanol content; this may be related to the sugar content of the grape itself.

3.3. Major Aroma Compounds

Table 2 and Supplementary Material (S2) show the results obtained for the volatility analysis for each of the wineries or cooperatives belonging to each of the areas already described. As shown, in the QZ there is a significant difference compared to the PZ in some volatile compounds in the higher alcohols. Isoamyl alcohol is produced from the decarboxylation of α-keto acids that arise from the degradation of sugars or the amino acids leucine and isoleucine. Its perception threshold is 300 mg/L [34]. This product is one of the most influential volatile compounds in the organoleptic profile, providing aromas of roses and honey [35]. There is a significant difference between both areas, although only the fermented musts from the San Acacio Coop. did not exceed the perception threshold. The highest values were found in the QZ. The volatile compound 2-phenylethanol or β-phenylethanol has a perception threshold of 140 mg/L [34], which gives the wine aromatic notes of honey and roses [36]. There is a significant difference between both areas, since only the wineries in the QZ pass the perception threshold, positively influencing the aroma of the wine. However, isobutanol and propanol, despite a significant difference between both areas, do not pass the perception thresholds and do not influence the aroma.
Methanol is not a by-product of fermentation carried out by yeasts. This compound is produced naturally from the enzymatic hydrolysis carried out by endogenous pectinases of the methoxyl groups of grape pectins [37]. In the study conducted by Peinado et al. [21], it was suggested that the concentration of methanol in wines should always be low, because methanol is potentially toxic; however, none of our samples passed the perception threshold [37].
Among the carbonyl compounds, acetaldehyde is formed during the first phase of alcoholic fermentation from pyruvic acid. Yeast produces this intermediate compound in the conversion of glucose into ethanol; the enzymes responsible are pyruvate decarboxylase or/and alcohol dehydrogenase I [38]. At low concentrations, acetaldehyde has a pleasant and fruity aroma, while at high levels, its smell becomes irritating and spicy [39]. The total acetaldehyde concentration is between 10 and 200 mg/L, with a sensory perception threshold of around 100 to 125 mg/L for free acetaldehyde. The results obtained show that all samples exceed the perception threshold except for Lagar Saavedra, positively influencing the sensory profile of the wines. However, there is a significant difference between both areas, with the highest values being found in the PZ.
With respect to the ethyl esters, ethyl acetate shows a significant difference between both zones, with the highest values for QZ. However, all samples showed an ethyl acetate concentration of less than 80 mg/L, which improves the taste of the wine and enhances the fruity smell [40]. Although there is a significant difference between the concentration of ethyl lactate between both zones, it has an olfactory threshold of 150 mg/L, and no sample passed the threshold, except for Coop. Aguilar de Fra; therefore only this one presents a pineapple, varnish, balsamic aroma.
Regarding the polyols, glycerol is a viscous polyalcohol with a certain sweet taste that contributes to the body of fermented beverages [41]. It has also been shown to improve flavor intensity [42], palatability and sweetness sensation [43], suppress musty flavor, and influence aroma volatility [44]. The results obtained from this compound showed a significant difference between the zones, since only those from the QZ exceeded the perception threshold, 1000 mg/L.

3.4. Minor Aroma Compounds

Table 3 shows all the minor compounds. Seventy-eight volatile compounds were determined, with the chemical families with the highest content being esters, aldehydes, and alcohols. As a result, of the esterification between alcohols and acids during must fermentation, esters contribute, together with alcohols, to the sweet and fruity aroma of wines [45]. Other compounds that contribute to the sweet aroma descriptor are the compounds included in the group of furanoic compounds, which are furfural and 5-methylfurfural [46], both of which have a higher concentration in wines from QZ than in PZ, as reflected in Figure 3. However, they do not pass the perception threshold, so they have no influence. Another compound is pentylfuran, which has a fruity, green odor descriptor with vegetal nuances, and its presence in wines from the quality zone can be explained by the high temperatures reached during the maturation period as explained by this author [47]. However, this only passes the perception threshold in the Lagar Cañada Navarro winery and in the Lagar Saavedra winery. According to other authors [48,49], another important group are the terpene compounds that have an important role in influencing the aroma of white wines, providing floral aromas. Within this group we have the b-citronellol, a compound that passes the threshold in all wines belonging to PZ; however, in the QZ, it is only present in Lagar Cañada Navarro; this compound gives the wines pink and green smells. Among the different families of esters, acetate esters are the most representative. The levels of acetate esters in all the wines obtained have representative values; however, only ethyl butanoate and ethyl isobutanoate exceeded the perception threshold in all wines. In the analyzed wines, we found isoamyl acetate, ethyl butanoate, ethyl 3-methylbutanoate, ethyl hexanoate, and ethyl octanoate, which passed the perception threshold, giving the wine a sweet aroma; this is supported by the study carried out by Martín-García et al. [45] and by Meng et al. [50]. 2-Phenylethanol exceeded the threshold in all wines except in the Lagar Saavedra winery and in the Coop. Aguilar de la Fra; this contributes notably to the aroma of the wines, giving the wine floral and fruity notes as shown by Lopez de Lerna et al. [51].
Within the aldehydes, those compounds that pass the threshold were decanal, (E,E)-2,4-nonadienal, 2,4-decadienal, (E,E)-, E-2-nonenal. The latter is present in all wines except in the Lagar Cañada Navarro winery and in the Lagar los Borbones, both belonging to the QZ. Nonanal is a compound that only passes the threshold in PZ wines, obtaining wines with a greater floral smell [50]. Other compounds important are limonene and butyrolactone, characterized by a citrus note with an odor reminiscent of orange [52,53]; both compounds are present in all wines.

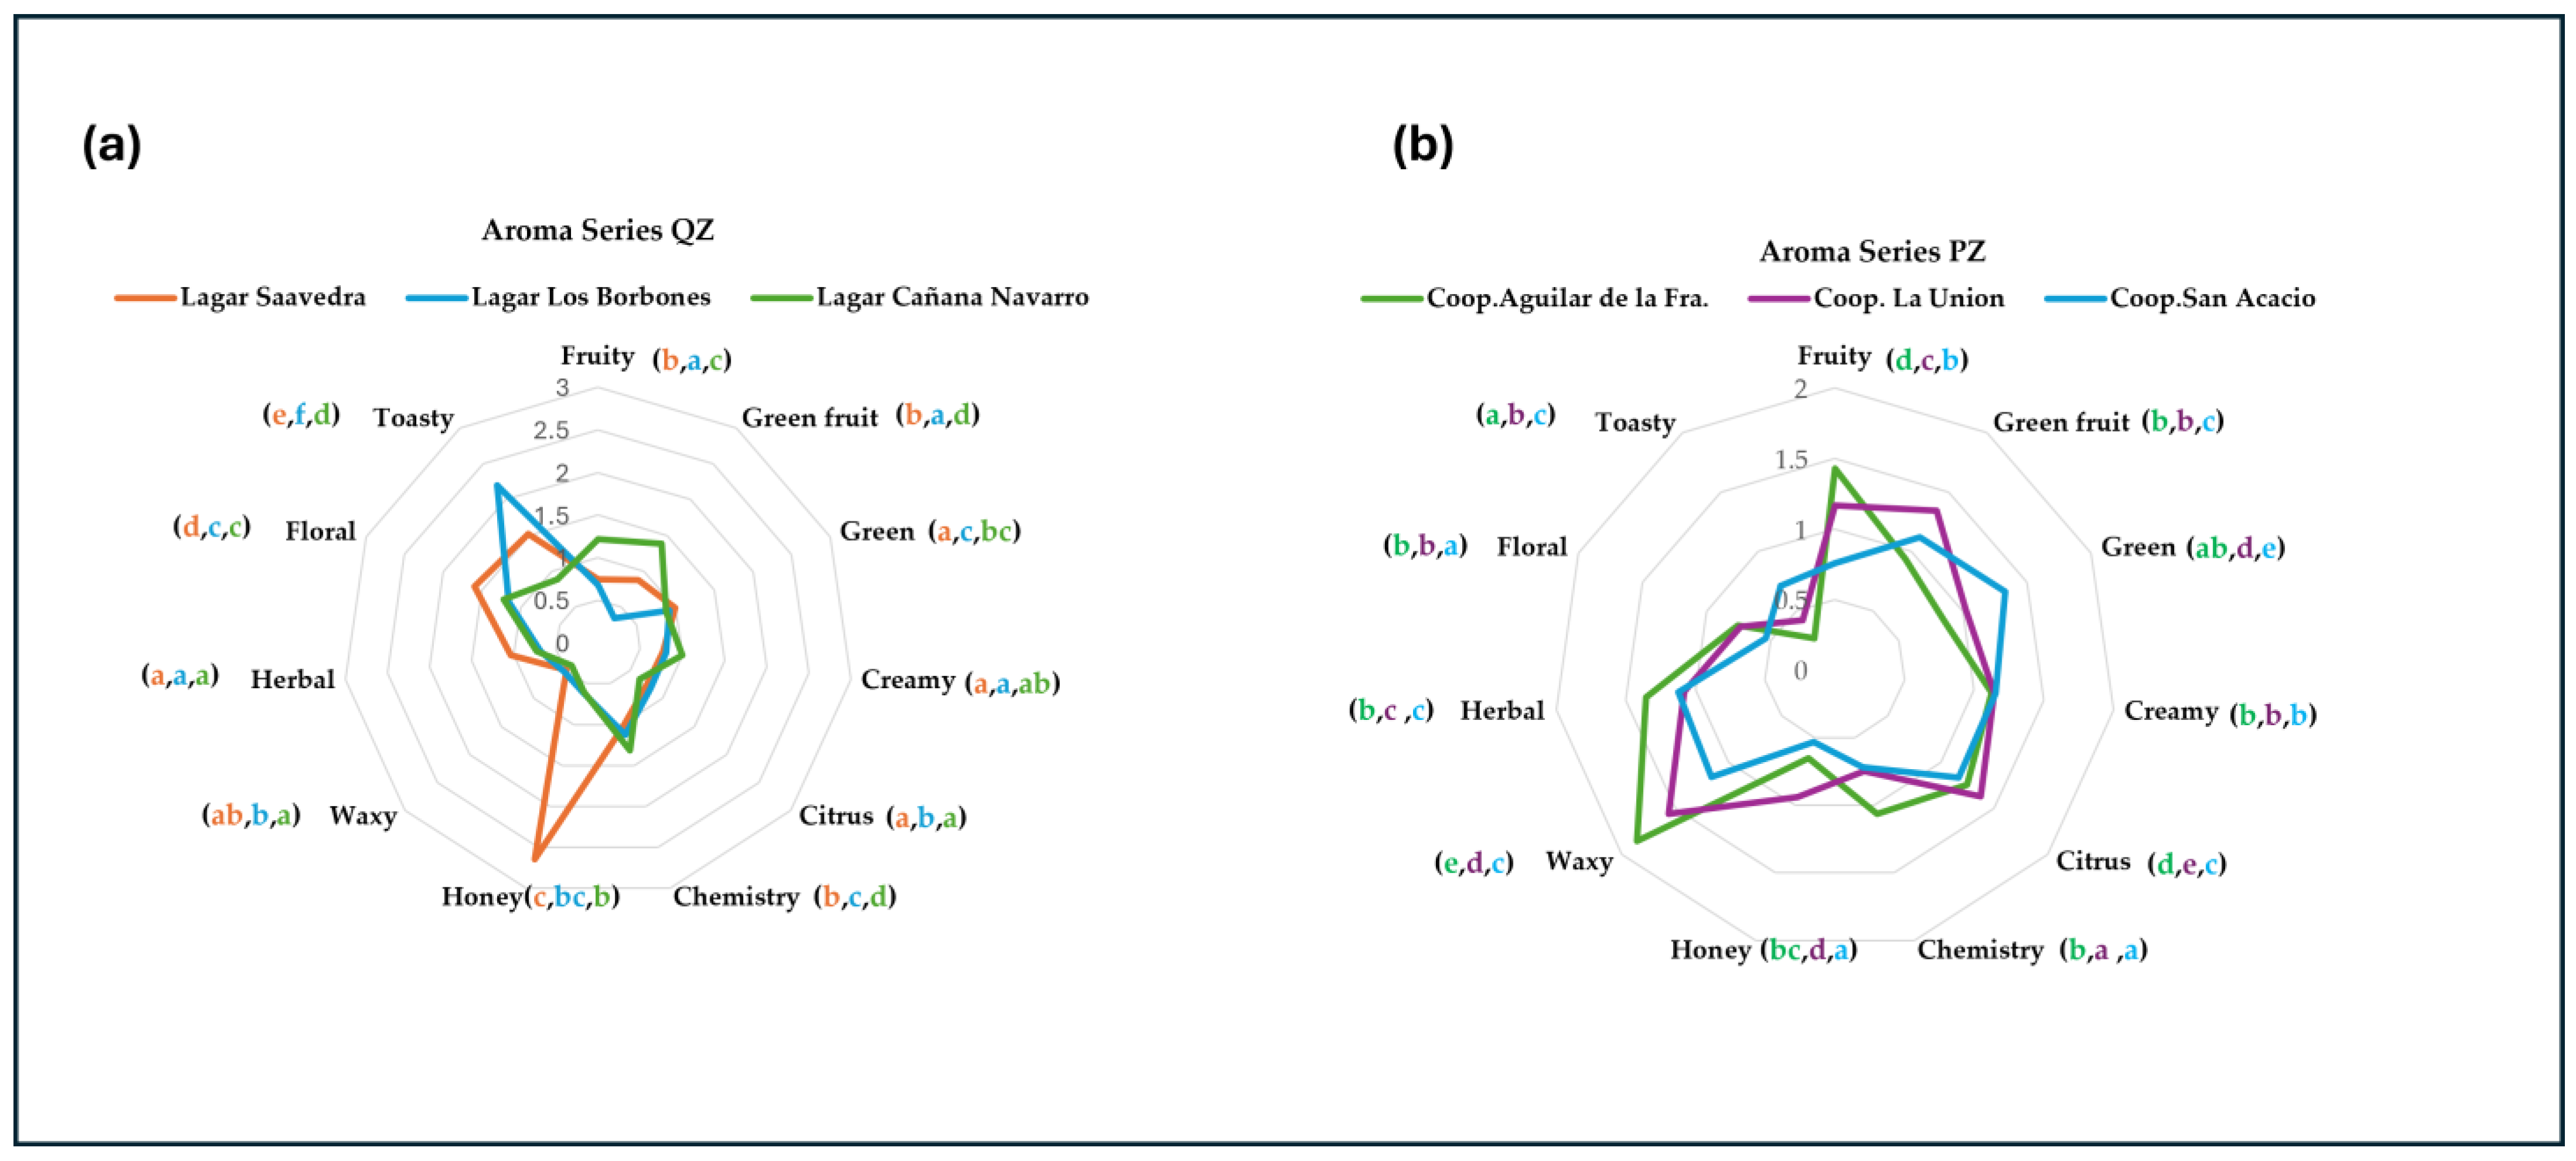
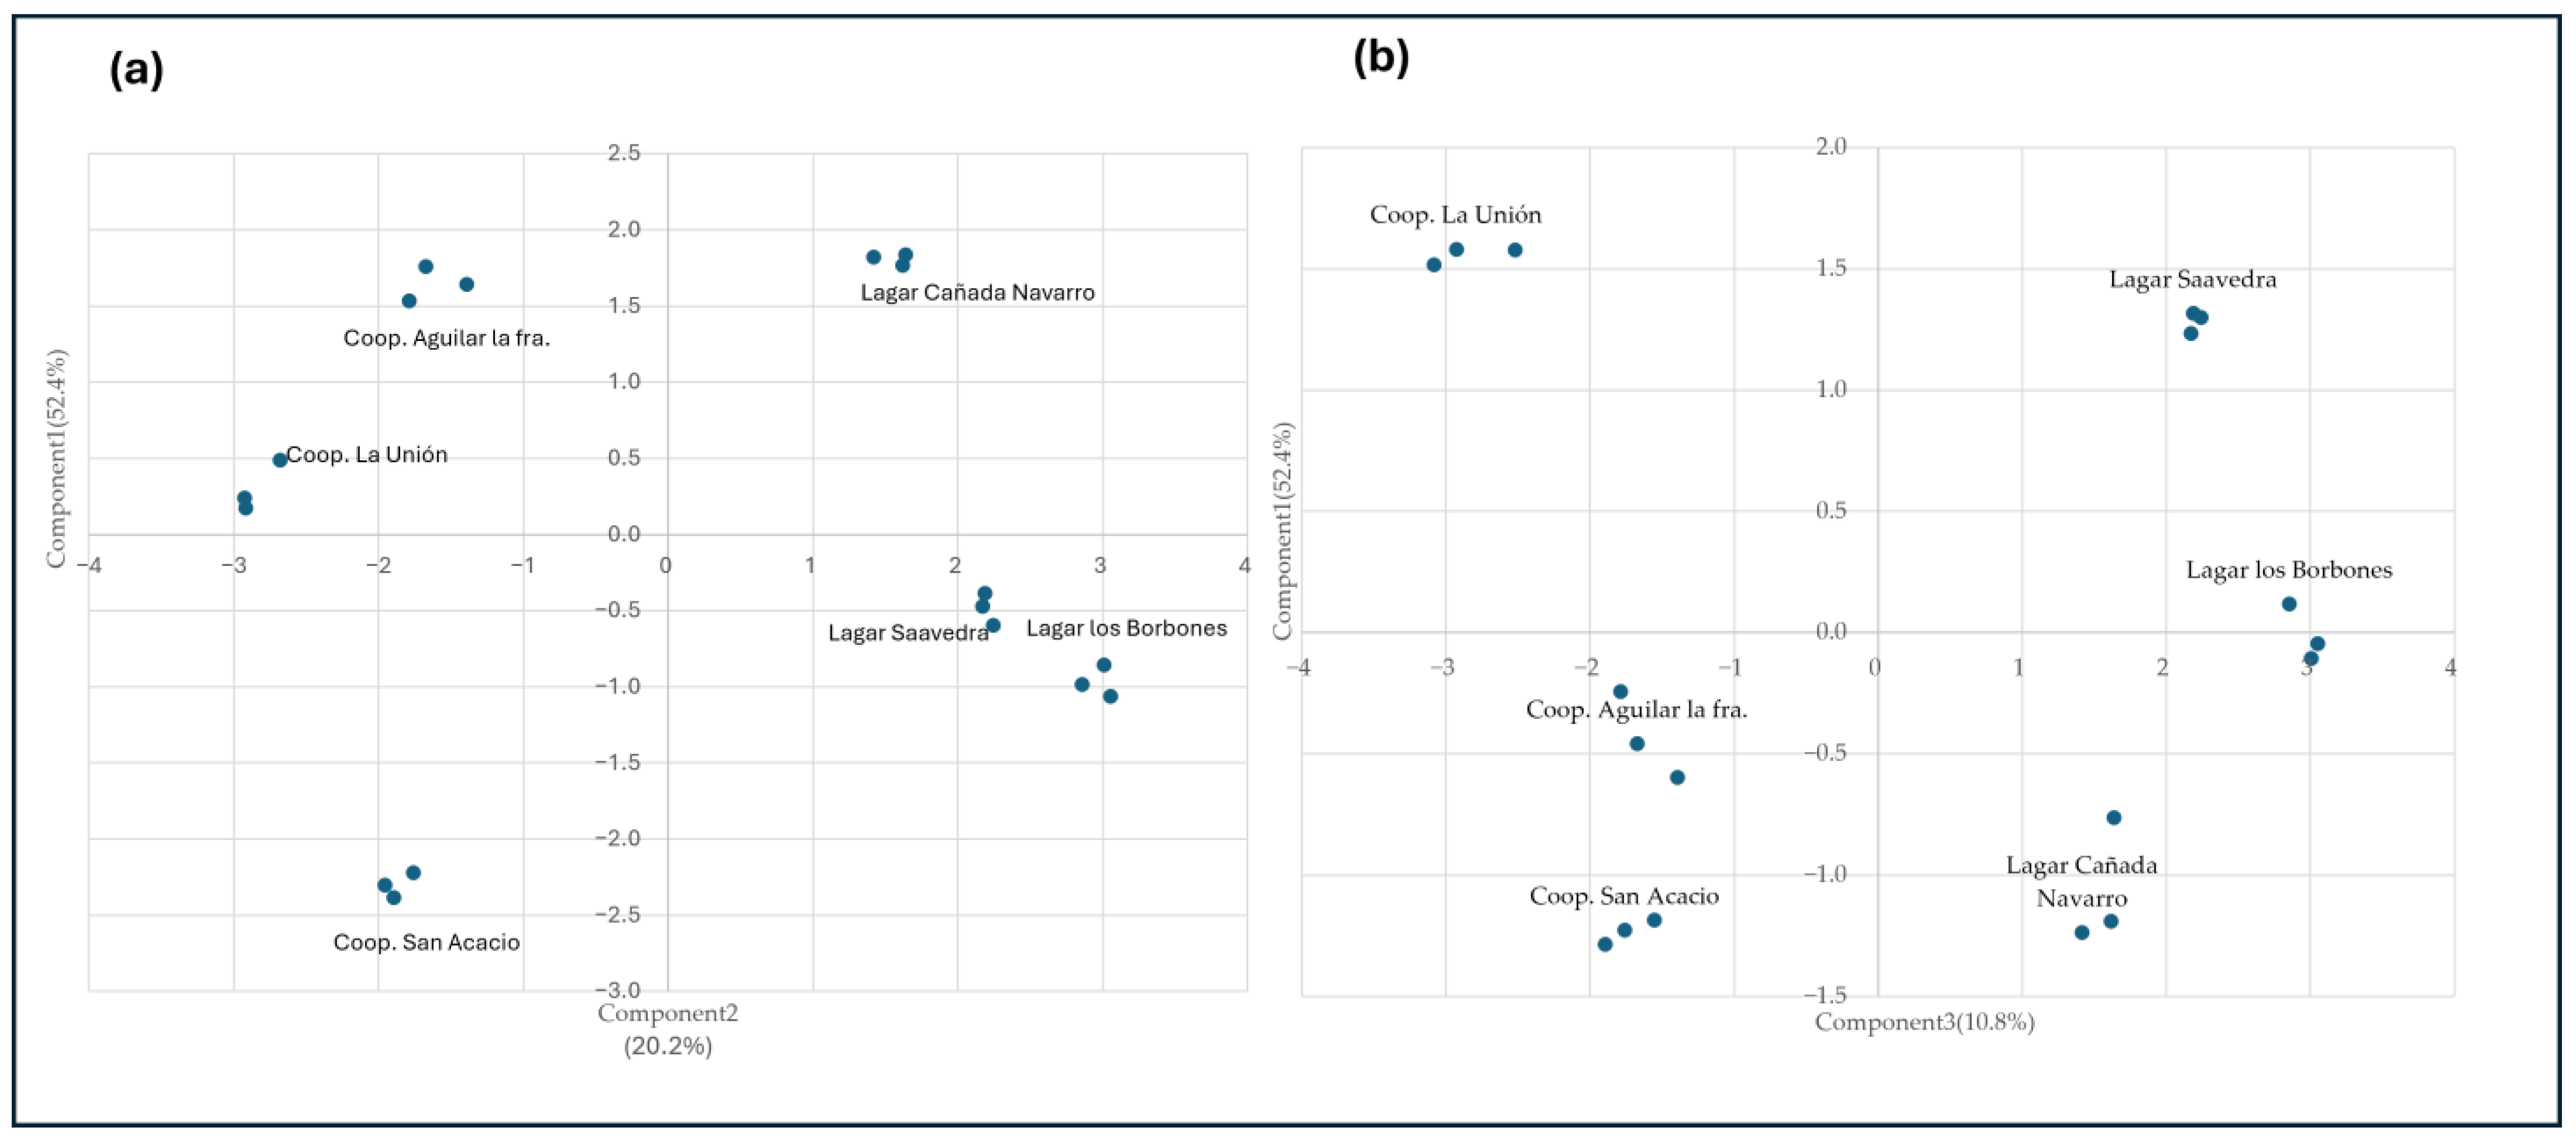
3.5. Aromatic Series, Multivariate and Principal Component Analysis

The aroma of a wine is conditioned not only by its volatilome but also by the interactions between the different compounds that compose it, giving a positive or negative interaction, as confirmed in the study by Hein, Ebeler, and Heymann [54]. The analytical fingerprint of the volatilomes can be obtained by constructing aromatic series, whose values are determined as described in the Materials and Methods Section. Several authors [22,55] previously used this clustering approach, which offers the advantage of reducing the number of variables to consider when analyzing the differences between wineries or oenological treatments.
The OAV provides us with information on the influence that a compound has on the aroma of the wine. In this way, volatile compounds with an OAV greater than one indicates a potential contribution to the aroma of the wine. In the sections on major and minor aromas, those that have a greater influence on the series of our study have been described.
The values of the aromatic series obtained are shown in Table 4. The fruity series stands out in all the wineries, with Coop. Aguilar de la Fra. and Lagar Cañada Navarro being the wineries with the highest values. Likewise, the Citrus, Chemical, Waxy, and Floral series reach values higher than 10.
A star plot with eleven rays was obtained by using multivariate analysis of the aromatic series. These were standardized, so the maximum length of the rays was the same for all the series, unity being the medium value (Figure 3). In Figure 3a, it can be observed that the Lagar Cañada Navaro and Lagar Borbones wineries have very similar olfactory tendencies. The predominant aromatic series are Fruity, Green, Green fruit, Herbal, obtaining wines with fruity aromas, while in the Lagar Saavedra winery, the predominant aroma series is sweet (Honey). In Figure 3b, all the wines present the same aromatic series Citrus, Creamy, and Floral, however in the Coop. Aguilar de la Fra. the first two series are more accentuated. Through multivariate analysis of the aromatic series, a star graph with eleven rays was obtained, which were standardized, so that the maximum length of the rays was the same for all the series, with one being the average value (Figure 3). In Figure 3a, it can be observed that the Lagar Cañada Navaro and Lagar Borbones wineries present very similar olfactory tendencies. The predominant aromatic series are Fruity, Green, Green Fruit, Herbal, obtaining wines with fruity aromas, while in the Lagar Saavedra winery, the predominant aromatic series is sweet (Honey). In Figure 3b, all the wines present the same Citrus, Creamy, and Floral aromatic series, however in the Coop. Aguilar de la Fra. The first two series are more accentuated. This type of study was carried out by other authors such as Dumitriu et al., [55] and Moyano et al., [56].
With the aim of reducing the number of variables, a principal component analysis (PCA) was carried out where components are a lineal combination of the input variables, and the interpretation of the components obtained must be done by the analyst. Here, the aromatic input was selected as input variable; the aromatic and the first three components obtained explain 83.4% of the observed variability (Figure 4a,b).
The first component clearly differentiates the wineries of the quality zone from those of the production zone. The second component differentiates among the wineries of the production zone, and the third the wineries of the quality zone. The aromatic series with the greatest influence in the first component are the Citrus, Floral, and Toasty. While in component two, the series with the greatest influence are the Chemical, Fruity, and Green series. Regarding component three, the series with the greatest influence are the Herbal and Honey series. This makes us see that the wines from the cooperatives have a clear olfactory tendency towards citrus, wavy and floral smells, while those wines belonging to the quality zone have sweeter smells, such as honey, fruity, and herbaceous.
After performing the principal component analysis (PCA) between component one and component two, a clustering can be observed between the wineries in the quality zone and the cooperatives in the production zone, since in component one the series with the greatest influence are the Citrus, Floral, and Creamy series. While in component two, the values with the greatest influence are the Chemical, Fruity, and Green series. Regarding component three, the series with the greatest influence are the Herbal, Green fruit, and Honey series. This makes us observe that the wines from the cooperatives have a clear olfactory tendency towards citrus and floral smells, while those wines belonging to the quality zone have sweeter smells, such as honey, fruity, and herbaceous. This is related to the different enzymatic activities, as indicated in Section 3.1.

4. Conclusions

The study revealed notable distinctions between the quality and production zones in terms of microbial composition and enzymatic activity, which significantly influenced the wine’s aromatic profile. The production zone exhibited a greater diversity of non-conventional yeasts and higher beta-glucosidase enzyme activity, resulting in wines with enhanced glycoside-derived aromatic compounds. Conversely, while the quality zone displayed a lower variety of non-conventional yeasts, it demonstrated superior cellulase enzyme activity, yielding wines with more pronounced fruity and clarified aromas. Analysis of the volatilome further emphasized these differences, with production zone wines characterized by citric and floral notes, while quality zone wines presented a more fruity and sweet aromatic profile. These findings underscore the complex interplay between terroir, microbial ecology, and enzymatic processes in shaping the sensory attributes of wines from different viticultural areas.

Supplementary Materials

The following supporting information can be downloaded at: https://www.mdpi.com/article/10.3390/app15063237/s1, Calculation of Aroma Series (S1). Data major (S2).

Author Contributions

Conceptualization, T.G.-M., J.C.M., J.M. and R.A.P.; methodology, M.T.A.-J., T.G.-M. and R.A.P.; software, R.A.P.; validation, T.G.-M. and R.A.P.; formal analysis, M.T.A.-J.; investigation, M.T.A.-J.; resources, T.G.-M., J.C.M., J.M. and R.A.P.; data curation, M.T.A.-J.; writing—original draft preparation, M.T.A.-J.; writing—review and editing, T.G.-M. and R.A.P.; visualization, J.C.M. and J.M.; supervision, T.G.-M. and R.A.P.; project administration, J.M.; funding acquisition, J.M. All authors have read and agreed to the published version of the manuscript.

Funding

This research was funded by Junta Andalucia (Spain) Program: Specialized Transfer Actions Universities-CEI-RIS3-FEDER. Singular Project AGROMIS-ceiA3, Subsector: Traditional Wines of Andalucia. Call 2020: Grantas for R+D+I projects in the field of Innovation Ecosystems of the International Centers of Excellence (PY2020 ECOSIS INNOV CEIS)—Grant number PYC20 RE 068 UCO.

Institutional Review Board Statement

Not applicable.

Informed Consent Statement

Not applicable.

Data Availability Statement

Data available in the supplementary material.

Acknowledgments

The authors are grateful to the workers and statements of the wineries: Lagar Los Borbones, Lagar Saavedra, Lagar Cañada Navarro, the Cooperativa de Aguilar de la Frontera, Cooperativa de San Acacio, and Cooperativa de la Unión Montilla–Moriles (Córdoba, Spain), for their collaboration in this research.

Conflicts of Interest

The authors declare no conflicts of interest. The funders had no role in the design of the study; in the collection, analyses, or interpretation of data; in the writing of the manuscript; or in the decision to publish the results.

References

  1. Cheng, T.H.; Kok, B.C.; Uttraphan, C.; Yee, M.H. Study of yeast and sugar in bio-energy generation. Bull. Electr. Eng. Inform. 2020, 9, 443–451. [Google Scholar] [CrossRef]
  2. Maicas, S. Advances in wine fermentation. Fermentation 2021, 7, 187. [Google Scholar] [CrossRef]
  3. Windholtz, S.; Vinsonneau, E.; Farris, L.; Thibon, C.; Masneuf-Pomarède, I. Yeast and filamentous fungi microbial communities in organic red grape juice: Effect of vintage, maturity stage, SO2, and bioprotection. Front. Microbiol. 2021, 12, 748416. [Google Scholar] [CrossRef] [PubMed]
  4. Franco, G.C.; Leiva, J.; Nand, S.; Lee, D.M.; Hajkowski, M.; Dick, K.; Withers, B.; Soto, L.; Mingoa, B.-R.; Acholonu, M.; et al. Soil microbial communities and wine terroir: Research gaps and data needs. Foods 2024, 13, 2475. [Google Scholar] [CrossRef]
  5. Li, R.; Feng, D.; Wang, H.; Zhang, Z.; Li, N.; Sun, Y. Genetic diversity of Non-Saccharomyces yeasts associated with spontaneous fermentation of Cabernet Sauvignon wines from Ningxia, China. Front. Microbiol. 2023, 14, 1253969. [Google Scholar] [CrossRef]
  6. Miranda, A.; Pereira, V.; Jardim, H.; Malfeito-Ferreira, M.; Marques, J.C. Impact of Non-Saccharomyces yeast fermentation in madeira wine chemical composition. Processes 2023, 11, 482. [Google Scholar] [CrossRef]
  7. Varela, C.; Borneman, A.R. Yeasts found in vineyards and wineries. Yeast 2017, 34, 111–128. [Google Scholar] [CrossRef] [PubMed]
  8. Benito, Á.; Calderón, F.; Benito, S. The influence of Non-Saccharomyces species on wine fermentation quality parameters. Fermentation 2019, 5, 54. [Google Scholar] [CrossRef]
  9. Morata, A.; Escott, C.; Bañuelos, M.A.; Loira, I.; Del Fresno, J.M.; González, C.; Suárez-Lepe, J.A. Contribution of Non-Saccharomyces yeasts to wine freshness. A review. Biomolecules 2019, 10, 34. [Google Scholar] [CrossRef]
  10. Carpena, M.; Fraga-Corral, M.; Otero, P.; Nogueira, R.A.; Garcia-Oliveira, P.; Prieto, M.A.; Simal-Gandara, J. Secondary Aroma: Influence of wine microorganisms in their aroma profile. Foods 2020, 10, 51. [Google Scholar] [CrossRef]
  11. Maicas, S.; Mateo, J.J. The life of Saccharomyces and Non-Saccharomyces yeasts in drinking wine. Microorganisms 2023, 11, 1178. [Google Scholar] [CrossRef]
  12. Jackowski, M.; Czepiela, W.; Hampf, L.; Żuczkowski, W.; Dymkowski, T.; Trusek, A. comparison of two commercially available strains, Saccharomycodes ludwigii and Torulaspora delbrueckii, for the production of low-alcohol beer. Beverages 2023, 9, 66. [Google Scholar] [CrossRef]
  13. Sun, W.; Chen, X.; Bi, P.; Han, J.; Li, S.; Liu, X.; Zhang, Z.; Long, F.; Guo, J. Screening and characterization of indigenous Non-Saccharomyces cerevisiae with high enzyme activity for kiwifruit wine production. Food Chem. 2024, 440, 138309. [Google Scholar] [CrossRef]
  14. Lin, M.; Boss, P.; Walker, M.; Sumby, K.; Grbin, P.; Jiranek, V. Evaluation of indigenous Non-Saccharomyces yeasts isolated from a south australian vineyard for their potential as wine starter cultures. Int. J. Food Microbiol. 2020, 312, 108373. [Google Scholar] [CrossRef] [PubMed]
  15. Ramírez, M.; Vinagre, A.; Ambrona, J.; Molina, F.; Maqueda, M.; Rebollo, J.E. genetic instability of heterozygous hybrid populations of natural wine yeasts. Appl. Environ. Microbiol. 2004, 70, 4686–4691. [Google Scholar] [CrossRef] [PubMed]
  16. Kaiser, C.; Michaelis, S.; Mitchell, A. Methods in Yeast Genetics; Cold Spring Harbor Laboratory Press: New York, NY, USA, 1994. [Google Scholar]
  17. Lodder, J.; Kreger-van Rij, N.J.W. The Yeasts: A Taxonomic Study, 1st ed.; Elsevier: Cham, The Netherlands, 1952; pp. 84–85. [Google Scholar]
  18. Öztekin, S.; Karbancioglu-Guler, F. Biological control of green mould on mandarin fruit through the combined use of antagonistic yeasts. Biol. Control 2023, 180, 105186. [Google Scholar] [CrossRef]
  19. Maldonado, N.; Robledo, C.; Robledo, J. La espectrometría de masas MALDI-TOF en el laboratorio de microbiología clínica. Infectio 2018, 22, 35–45. [Google Scholar] [CrossRef]
  20. International Code of Oenological Practices; OIV International Organisation of Vine and Wine: Dijon, France, 2023.
  21. Peinado, R.A.; Moreno, J.A.; Muñoz, D.; Medina, M.; Moreno, J. Gas chromatographic quantification of major volatile compounds and polyols in wine by direct injection. J. Agric. Food Chem. 2004, 52, 6389–6393. [Google Scholar] [CrossRef] [PubMed]
  22. Palenzuela, M.D.V.; López de Lerma, N.; Sánchez-Suárez, F.; Martínez-García, R.; Peinado, R.A.; Rosal, A. Aroma composition of wines produced from grapes treated with organic amendments. Appl. Sci. 2023, 13, 8001. [Google Scholar] [CrossRef]
  23. Englezos, V.; Jolly, N.P.; Di Gianvito, P.; Rantsiou, K.; Cocolin, L. Microbial interactions in winemaking: Ecological aspects and effect on wine quality. Trends Food Sci. Technol. 2022, 127, 99–113. [Google Scholar] [CrossRef]
  24. Lowes, K.F.; Shearman, C.A.; Payne, J.; MacKenzie, D.; Archer, D.B.; Merry, R.J.; Gasson, M.J. Prevention of yeast spoilage in feed and food by the yeast mycocin HMK. Appl. Environ. Microbiol. 2000, 66, 1066–1076. [Google Scholar] [CrossRef] [PubMed]
  25. Michlmayr, H.; Kneifel, W. β-Glucosidase activities of lactic acid bacteria: Mechanisms, impact on fermented food and human health. FEMS Microbiol. Lett. 2014, 352, 1–10. [Google Scholar] [CrossRef]
  26. Zhao, Y.; Zhang, B.; Gu, H.; Xu, T.; Chen, Q.; Li, J.; Zhou, P.; Guan, X.; He, L.; Liang, Y.; et al. A mutant GH3 Family β-glucosidase from Oenococcus oeni exhibits superior adaptation to wine stresses and potential for improving wine aroma and phenolic profiles. Food Microbiol. 2024, 119, 104458. [Google Scholar] [CrossRef] [PubMed]
  27. Liang, Z.; Fang, Z.; Pai, A.; Luo, J.; Gan, R.; Gao, Y.; Lu, J.; Zhang, P. Glycosidically bound aroma precursors in fruits: A comprehensive review. Crit. Rev. Food Sci. Nutr. 2022, 62, 215–243. [Google Scholar] [CrossRef]
  28. Zhang, P.; Zhang, R.; Sirisena, S.; Gan, R.; Fang, Z. Beta-glucosidase activity of wine yeasts and its impacts on wine volatiles and phenolics: A mini-review. Food Microbiol. 2021, 100, 103859. [Google Scholar] [CrossRef]
  29. Maturano, Y.P.; Toro, M.E.; Castellanos, L.I.; Vazquez, F. Determinación de actividades celulolítica y xilanolítica en levaduras no-Saccharomyces de origen enológico. Rev. De Enol. 2007, 2, 1–10. [Google Scholar]
  30. Maturano, Y.P.; Assof, M.; Fabani, M.P.; Nally, M.C.; Jofré, V.; Rodríguez Assaf, L.A.; Toro, M.E.; de Figueroa, L.I.C.; Vazquez, F. Enzymatic activities produced by mixed Saccharomyces and Non-Saccharomyces cultures: Relationship with wine volatile composition. Antonie Van Leeuwenhoek 2015, 108, 1239–1256. [Google Scholar] [CrossRef] [PubMed]
  31. Stefanini, I.; Cavalieri, D. metagenomic approaches to investigate the contribution of the vineyard environment to the quality of wine fermentation: Potentials and difficulties. Front. Microbiol. 2018, 9, 991. [Google Scholar] [CrossRef]
  32. de Celis, M.; Ruiz, J.; Benitez-Dominguez, B.; Vicente, J.; Tomasi, S.; Izquierdo-Gea, S.; Rozés, N.; Ruiz-De-Villa, C.; Gombau, J.; Zamora, F.; et al. Multi-omics framework to reveal the molecular determinants of fermentation performance in wine yeast populations. Microbiome 2024, 12, 203. [Google Scholar] [CrossRef]
  33. Liu, D.; Chen, Q.; Zhang, P.; Chen, D.; Howell, K.S. The fungal microbiome is an important component of vineyard ecosystems and correlates with regional distinctiveness of wine. Msphere 2020, 5, e00534-20. [Google Scholar] [CrossRef]
  34. Gómez-Míguez, M.J.; Cacho, J.F.; Ferreira, V.; Vicario, I.M.; Heredia, F.J. Volatile components of zalema white wines. Food Chem. 2007, 100, 1464–1473. [Google Scholar] [CrossRef]
  35. Fiorini, D.; Caprioli, G.; Sagratini, G.; Maggi, F.; Vittori, S.; Marcantoni, E.; Ballini, R. Quantitative profiling of volatile and phenolic substances in the wine vernaccia di serrapetrona by development of an HS-SPME-GC-FID/MS Method and HPLC-MS. Food Anal. Meth. 2014, 7, 1651–1660. [Google Scholar] [CrossRef]
  36. Szudera-Kończal, K.; Myszka, K.; Kubiak, P.; Drabińska, N.; Majcher, M.A. The combined effect of lactic acid bacteria and Galactomyces geotrichum fermentation on the aroma composition of sour whey. Molecules 2023, 28, 4308. [Google Scholar] [CrossRef]
  37. Hodson, G.; Wilkes, E.; Azevedo, S.; Battaglene, T. Methanol in wine. BIO Web Conf. 2017, 9, 02028. [Google Scholar] [CrossRef]
  38. Zea, L.; Serratosa, M.P.; Mérida, J.; Moyano, L. Acetaldehyde as key compound for the authenticity of sherry wines: A study covering 5 decades. Food. Sci. Food Saf. 2015, 14, 681–693. [Google Scholar] [CrossRef]
  39. Guittin, C.; Maçna, F.; Picou, C.; Perez, M.; Barreau, A.; Poitou, X.; Sablayrolles, J.-M.; Mouret, J.-R.; Farines, V. New online monitoring approaches to describe and understand the kinetics of acetaldehyde concentration during wine alcoholic fermentation: Access to production balances. Fermentation 2023, 9, 299. [Google Scholar] [CrossRef]
  40. Huang, Y.; Zhong, M.; Mu, S.; Han, Y.; Shi, Y.; Li, X.; Li, D. Assessment of the contributions of Saccharomyces cerevisiae, Hansenula sp. and Pichia kudriavzevii to volatile organic compounds and sensory characteristics of waxy rice wine. Eur. Food Res. Technol. 2023, 249, 685–697. [Google Scholar] [CrossRef]
  41. Scanes, K.T.; Hohrnann, S.; Prior, B.A. Glycerol production by the yeast Saccharomyces cerevisiae and its relevance to wine: A review. S. Afr. J. Enol. Vitic. 1998, 19, 17–24. [Google Scholar] [CrossRef]
  42. Jones, P.R.; Gawel, R.; Francis, I.L.; Waters, E.J. The influence of interactions between major white wine components on the aroma, flavour and texture of model white wine. Food. Qual. Prefer. 2008, 19, 596–607. [Google Scholar] [CrossRef]
  43. Gawel, R.; Sluyter, S.V.; Waters, E.J. The effects of ethanol and glycerol on the body and other sensory characteristics of riesling wines. Aust. J. Grape Wine Res. 2007, 13, 38–45. [Google Scholar] [CrossRef]
  44. Perpete, P.; Collin, S. Influence of beer ethanol content on the wort flavour perception. Food Chem. 2000, 71, 379–385. [Google Scholar] [CrossRef]
  45. Martín-García, F.J.; Palacios-Fernández, S.; López de Lerma, N.; García-Martínez, T.; Mauricio, J.C.; Peinado, R.A. The effect of yeast, sugar and sulfur dioxide on the volatile compounds in wine. Fermentation 2023, 9, 541. [Google Scholar] [CrossRef]
  46. Peinado, R.A.; Moreno, J.; Medina, M.; Mauricio, J.C. Changes in volatile compounds and aromatic series in sherry wine with high gluconic acid levels subjected to aging by submerged flor yeast cultures. Biotechnol. Lett. 2004, 26, 757–762. [Google Scholar] [CrossRef] [PubMed]
  47. Fuentes-Espinosa, J.M.; Muñoz-Castells, R.; Moreno-García, J.; García-Martínez, T.; Mauricio, J.C.; Moreno, J. Analytical differentiation of wines from three terroirs located in a warm winegrowing area based on their volatilome. Molecules 2025, 30, 238. [Google Scholar] [CrossRef]
  48. Alises, M.O.; Sánchez-Palomo, E.; Viñas, M.G. Effects of winemaking techniques on the volatile compounds of Chelva wines. Food Biosci. 2024, 59, 104121. [Google Scholar] [CrossRef]
  49. Filippousi, M.E.; Chalvantzi, I.; Mallouchos, A.; Marmaras, I.; Banilas, G.; Nisiotou, A. The use of Hanseniaspora opuntiae to improve ‘sideritis’ wine quality, a late-ripening greek grape variety. Foods 2024, 13, 1061. [Google Scholar] [CrossRef]
  50. Meng, D.; Zhao, D.; Yang, H.; Li, Y.; Yan, Z.; Wang, Z.; Lv, Z.; Zhao, Z. An insight into the association between volatile and other active components of sea buckthorn berries in barren soils of western China. Food Humanit. 2024, 2, 100293. [Google Scholar] [CrossRef]
  51. López de Lerma, N.; Peinado, R.A.; Puig-Pujol, A.; Mauricio, J.C.; Moreno, J.; Garcia-Martinez, T. Influence of two yeast strains in free, bioimmobilized or immobilized with alginate forms on the aromatic profile of long aged sparkling wines. Food Chem. 2018, 50, 22–29. [Google Scholar] [CrossRef]
  52. Pino, J.A.; Queris, O. Analysis of volatile compounds of mango wine. Food Chem. 2011, 125, 1141–1146. [Google Scholar] [CrossRef]
  53. Tarko, T.; Duda, A. Volatilomics of fruit wines. Molecules 2024, 29, 2457. [Google Scholar] [CrossRef]
  54. Hein, K.; Ebeler, S.E.; Heymann, H. Perception of fruity and vegetative aromas in red wine. J. Sens. Stud. 2009, 24, 441–455. [Google Scholar] [CrossRef]
  55. Dumitriu, G.D.; Peinado, R.A.; Cotea, V.V.; de Lerma, N.L. Volatilome fingerprint of red wines aged with chips or staves: Influence of the aging time and toasting degree. Food Chem. 2020, 310, 125801. [Google Scholar] [CrossRef] [PubMed]
  56. Moyano, L.; Varo, M.Á.; Núñez, L.; López-Toledano, A.; Serratosa, M.P. Discovering the volatilome fingerprint of selected traditional Cuban wines elaborated with native grapes, tropical fruits, and rice using DHS–TD–GC–MS. J. Food Sci. 2024, 89, 4926–4940. [Google Scholar] [CrossRef] [PubMed]
Figure 1. (a) Total number of isolates differentiated by wineries and cooperatives between quality and production zones. (b) Number of isolates from each winery in zone QZ, differentiating between the percentage of Saccharomyces and Non-Saccharomyces. (c) Number of isolates from each cooperative in zone PZ, differentiating between the percentage of Saccharomyces and Non-Saccharomyces.
Applsci 15 03237 g001
Figure 2. (a) Percentage of killer activity in the quality zone and production zone. (b) Percentage of β-glucosidase activity in the quality zone and production zone. (c) Percentage of cellulose activity in the quality zone and production zone. (d) Identification of Non-Saccharomyces yeast in the quality zone and production zone.
Applsci 15 03237 g002
Figure 3. Graphical representation of a multivariate analysis, derived from results of the statistical treatment of the aromatic series comes from Table 4 (simple ANOVA, Fisher test, p < 0.05). (a) Aromatic series from the quality zone. (b) Aromatic series from the production area.
Applsci 15 03237 g003
Figure 4. Principal component analysis of olfactory series of wines obtained in different areas of the PDO Montilla–Moriles. The analysis was carried out on major volatile compounds and minor volatile compounds (a) Principal component analysis between components one and two. (b) Principal component analysis between components one and three.
Applsci 15 03237 g004
Table 1. Oenological parameters of the PZ and QZ zones. Values with different superscript letters in the same row are a significantly different test (p < 0.05).
Oenological
Parameters
Lagar Los
Borbones
Lagar
Saavedra
Lagar Cañada
Navarro
Coop. Aguilar de la FraCoop. San AcacioCoop. La Unión
pH4.07 ± 0.06 e3.71 ±0.10 c3.24 ± 0.06 a3.61 ± 0.10 b3.81 ± 0.11 d3.71 ± 0.07 c
Volatile acidity (g L−1)0.71 ± 0.10 b0.49 ± 0.10 a0.81 ±0.09 c0.91 ± 0.10 d2.20± 0.11 f1.22 ± 0.10 e
Total acidity
(g L−1)
4.51 ± 0.08 a5.92 ± 0.08 c8.62 ± 0.07 f6.40 ± 0.11 d7.31 ± 0.11 e5.84 ± 0.10 b
Ethanol (% v/v)12.6 ± 0.2 a14.6 ± 0.2 c12.6 ± 0.1 a13.6 ± 0.4 b15.00 ± 0.5 d13.4 ± 0.2 b
Table 2. Major aroma compounds of the PZ and QZ zones. Values shown represent averages of triplicate samples (data are mean ± SD). Values with different superscript letters in the same row are a significantly different test (p < 0.05).
Compounds (mg/L)Lagar Los
Borbones
Lagar SaavedraLagar Cañada NavarroCoop Aguilar de la Fra.Coop San
Acacio
Coop La Unión
Alcohols
Methanol69.2 ± 1.9 a104.2 ± 7.3 c98.6 ± 7.5 bc75.0 ± 7.0 a137.2 ± 6.2 d87.9 ± 6.3 b
1-Propanol32.2 ± 1.4 ab35.5 ± 1.3 b29.4 ± 1.4 a39.9 ± 3.1 c62.2 ± 1.4 d33.1 ± 2.3 b
Isobutanol144.8 ± 3.3 e136.5 ± 5.4 d126.6 ± 1.8 c115.5 ± 3.8 b44.6 ± 0.7 a41.8 ± 1.7 a
Isoamyl alcohols367.5 ± 8.0 c444.0 ± 17.4 e416.1 ± 6.6 d345.8 ± 11.6 b207.2 ± 4.2 a338.4 ± 9.0 b
2-Phenylethanol142.0 ± 12.3 c248.0 ± 18.7 d131.7 ± 10.5 c68.5 ± 6.9 b43.5 ± 3.2 a39.4 ± 2.3 a
Carbonyl Compounds
Acetaldehyde101.6 ± 8.4 b33.9 ± 2.0 a189.6 ± 16.0 d143.4 ± 5.4 c195.2 ± 9.4 f105.2 ± 7.3 d
Acetoin85.4 ± 5.9 c18.0 ± 1.3 a77.4 ± 4.0 bc71.4 ± 2.1 b145.1 ± 14.7 d21.1 ± 1.1 a
Esters
Ethyl lactate51.1 ± 2.0 b10.1 ± 0.2 a13.1 ± 0.9 a277.7 ± 26.6 d105.9 ± 6.1 c34.5 ± 1.5 b
Diethyl succinate11.8 ± 1.1 c8.17 ± 0.60 b4.70 ± 0.30 a13.4 ± 1.3 d8.60 ± 0.80 a5.84 ± 0.44 a
Ethyl acetate52.0 ± 1.8 d19.1 ± 0.7 a86.1 ± 1.7 f69.8 ± 2.3 e31.8 ± 0.4 c24.9 ± 1.3 b
Polyols
2,3-Butanediol (levo)546.8 ± 22.5 b438.8 ± 29.2 a683.4 ± 38.4 c921.5 ± 0.6 e1326.6 ± 74.7 f779.7 ± 51.7 d
2,3-Butanediol (meso)288.7 ± 25.2 b228.0 ± 11.7 a225.1 ± 12.7 a309.3 ± 2.6 b353.0 ± 21.4 c254.0 ± 15.8 a
Glycerol (g/L)11.5 ± 1.2 c15.5 ± 1.1 d10.8 ± 0.9 bc9.50 ± 1.40 ab9.20 ± 0.81 ab8.50 ± 0.60 a
Table 3. Minor aroma compounds of the PZ and QZ zones. Values shown represent averages of triplicate samples (data are mean ± SD). Values with different superscript letters in the same row are a significantly different test (p < 0.05).
CompoundsLagar Los
Borbones
Lagar
Saavedra
Lagar Cañada NavarroCoop Aguilar de la Fra.Coop San AcacioCoop La Unión
Alcohols
Octanol132.9 ± 7.7 c56.2 ± 3.2 b137.7 ± 11.7 c207.2 ± 8.9 d22.9 ± 1.5 a149.6 ± 6.1 c
Hexanol1099.2 ± 38.2 a1310.9 ± 60.7 b1488.1 ± 65.0 bc2057.0 ± 60.7 b1741.3 ±140.9 b2663.8 ± 204.6 c
Decanol3.10 ± 0.10 a5.20 ± 0.20 b4.30 ± 0.4 ab9.10 ± 0.80 d7.50 ± 0.30 c10.8 ± 1.7 e
2-Ethyl-1-hexanol82.1 ± 3.7 a95.5 ± 3.2 d117.2 ± 8.7 e57.0 ± 2.2 b48.2 ± 2.9 c61.3 ± 2.1 b
Guaiacol23.1 ± 1.1 c24.4 ± 1.0 e12.9 ± 1.2 c4.10 ± 0.30 a11.7 ± 0.8 d6.70 ± 0.40 b
4-Vinylphenol55.4 ± 3.4 b84.0 ± 4.1 e35.4 ± 2.5 c9.20 ± 0.60 a26.2 ± 1.7 d7.20 ± 0.40 a
4-Ethylguaiacol13.3 ± 0.7 bc1.10 ± 0.10 ab5.00 ± 3.80 c0.0 ± 0.0 a3.30 ± 0.30 d0.0 ± 0.0 a
Dodecanol11.9 ± 1.0 a8.80 ± 0.30 bc10.1 ± 0.7 d7.90 ± 0.50 ab7.60 ± 0.50 e9.70 ± 0.50 cd
2-Furanmethanol19.2 ± 0.9 b18.9 ± 1.7 c8.10 ± 0.60 b2.70 ± 0.10 a6.90 ± 0.40 c4.10 ± 0.40 a
Terpenoids
E-Nerolidol2.60 ± 0.10 a2.70 ± 0.10 a2.70 ± 0.30 a2.60 ± 0.10 a2.70 ± 0.20 a2.70 ± 0.10 a
B-Citronellol15.3 ± 0.6 b12.4 ± 0.8 a27.8 ± 2.1 b45.5 ± 3.1 c25.8 ± 1.7 a28.5 ± 1.3 b
Z-Nerolidol0.50 ± 0.01 a0.20 ± 0.01 b0.50 ± 0.01 c0.10 ± 0.01 a0.0 ± 0.0 c0.0 ± 0.0 a
Limonene27.0 ± 2.9 b25.9 ± 1.9 c25.1 ± 1.1 c17.1 ± 1.5 a21.5 ± 1.4 c20.9 ± 1.0 b
Trans-Methyldihydrojasmonate2.80 ± 0.30 a3.00 ± 0.10 d2.40 ± 0.30 b1.90 ± 0.20 a1.80 ± 0.20 c2.90 ± 0.10 d
B-Farnesene7.70 ± 0.10 f4.50 ± 0.40 b3.00 ± 0.10 a5.60 ± 0.30 d6.50 ± 0.40 e4.50 ± 0.40 c
E-Citral0.20 ± 0.01 b0.90 ± 0.10 c0.50 ± 0.01 b0.50 ± 0.01 b0.50 ± 0.01 a1.00 ± 0.10 d
Z-Citral4.80 ± 0.70 c2.40 ± 0.10 b2.50 ± 0.20 bc0.80 ± 0.01 a2.80 ± 0.20 d2.70 ± 0.20 bc
Farnesol7.60 ± 0.10 d0.0 ± 0.0 a0.0 ± 0.0 a5.60 ± 0.30 a0.0 ± 0.0 a0.0 ± 0.0 c
B-Damascenone0.50 ± 0.01 b0.30 ± 0.01 a0.40 ± 0.01 a3.00 ± 0.20 d2.40 ± 0.10 a2.80 ± 0.20 c
B-Ionone0.10 ± 0.01 c0.20 ± 0.01 d0.10 ± 0.01 b0.10 ± 0.01 a0.10 ± 0.01 b0.20 ± 0.01 d
Aldehydes
(E,E)-2,4-Nonadienal0.20 ± 0.01 bc0.20 ± 0.01 bc0.10 ± 0.01 b0.30 ± 0.01 d0.10 ± 0.01 a0.20 ± 0.01 c
E-2-Octenal1.80 ± 0.10 f1.10 ± 0.01 c0.90 ± 0.01 b0.0 ± 0.0 a1.40 ± 0.10 d1.50 ± 0.10 e
2,4-Decadienal,(E,E)0.30 ± 0.10 c0.20 ± 0.10 b0.10 ± 0.10 a0.20 ± 0.01 b0.20 ± 0.01 ab0.20 ± 0.10 b
E-2-Nonenal0.40 ± 0.01 a0.90 ± 0.01 d0.50 ± 0.01 b0.70 ± 0.10 c1.00 ± 0.10 e0.90 ± 0.10 de
Heptanal0.80 ± 0.01 a0.80 ± 0.01 a0.90 ± 0.10 a0.80 ± 0.01 a0.80 ± 0.01 a1.30 ± 0.10 b
Phenylacetaldehyde1.80 ± 0.01 a2.10 ± 0.10 a2.10 ± 0.10 a3.00 ± 0.10 a1.80 ± 0.10 a2.80 ± 0.10 a
Hexanal4.62 ± 0.32 a5.80 ± 0.40 b6.10 ± 0.20 bc5.60 ± 0.20 b5.70 ± 0.60 b6.70 ± 0.50 c
Octanal0.70 ± 0.10 d0.90 ± 0.10 bc0.80 ± 0.10 ab1.00 ± 0.10 c 1.40 ± 0.10 a1.30 ± 0.10 d
Nonanal1.82 ± 0.10 d1.90 ± 0.10 b1.00 ± 0.10 a4.20 ± 0.20 c4.60 ± 0.10 b5.30 ± 0.30 e
Decanal2.40 ± 0.10 c2.30 ± 0.20 b1.30 ± 0.10 a8.40 ± 0.60 c8.10 ± 0.40 b10.00 ± 0.60 d
Benzaldehyde4.90 ± 0.40 d4.90 ± 0.20 cd4.30 ± 0.40 bc2.20 ± 0.10 a4.30 ± 0.30 b4.00 ± 0.50 b
4-Methylbenzaldehyde1.40 ± 0.20 d1.10 ± 0.90 b1.00 ± 0.10 b0.80 ± 0.10 a1.00 ± 0.10 b1.30 ± 0.10 c
3-Methylbenzaldehyde0.80 ± 0.10 c0.30 ± 0.01 a0.50 ± 0.10 b0.50 ± 0.10 b0.80 ± 0.01 d0.80 ± 0.10 c
Hexylcinnamaldehyde1.01 ± 0.01 ab1.01 ± 0.01 ab0.90 ± 0.01 a1.01 ± 0.02 bc1.10 ± 0.10 d1.00 ± 0.02 c
Ketones
Acetophenone0.10 ± 0.01 a2.20 ± 0.10 bc0.20 ± 0.01 a2.20 ± 0.10 b2.40 ± 0.40 bc2.70 ± 0.50 c
3-Methylacetophenone0.10 ± 0.01 a0.70 ± 0.10 c0.70 ± 0.10 d0.40 ± 0.30 b0.10 ± 0.00 a0.80 ± 0.01
3-Heptanone1.35 ± 0.10 ab1.40 ± 0.10 bc1.20 ± 0.13 e1.10 ± 0.10 a1.70 ± 0.10 de1.50 ± 0.10 cd
2-Decanone2.80 ± 0.01 b2.80 ± 0.01 a2.80 ± 0.01 a3.30 ± 0.10 d2.90 ± 0.01 a3.10 ± 0.01 c
3-Octen-2-one1.30 ± 0.10 e3.10 ± 0.20 d1.90 ± 0.10 b3.00 ± 0.60 d3.20 ± 0.10 a2.40 ± 0.10 c
Z-Geranylacetone1.50 ± 0.01 b1.50 ± 0.01 a1.50 ± 0.10 a2.6 ± 0.20 bc2.40 ± 0.10 a2.7 ± 0.20 c
Benzophenone6.70 ± 0.53 b3.30 ± 0.10 c5.20 ± 0.40 d0.90 ± 0.10 a1.20 ± 0.10 e1.30 ± 0.01 b
E-Geranilacetone2.40 ± 0.20 a0.70 ± 0.10 a2.00 ± 0.20 c4.40 ± 0.20 e0.80 ± 0.10 d1.60 ± 0.10 b
Esters
Ethyl butanoate25.2 ± 1.0 a59.0 ± 2.8 c55.7 ± 2.7 c55.7 ± 5.0 c36.5 ± 3.2 b31.5 ± 1.8 b
γ-Nonalactone10.1 ± 0.9 a14.7 ± 0.9 b20.1 ± 1.0 c20.4 ± 1.2 c23.7 ± 1.6 c85.5 ± 5.6 d
Ethyl 3-methylbutanoate1.20 ± 0.10 c2.90 ± 0.01 d9.00 ± 0.30 e0.90 ± 0.01 b0.60 ± 0.01 a0.50 ± 0.01 a
Ethyl isobutanoate36.5 ± 1.7 d167.5 ± 2.0 f150.3 ± 3.0 e28.5 ± 0.4 c14.4 ± 0.4 a18.0 ± 1.0 b
Butyl acetate6.40 ± 0.32 c2.30 ± 0.10 a2.90 ± 0.10 b14.6 ± 0.9 d5.10 ± 0.10 c14.6 ± 0.5 d
Octyl acetate1.60 ± 0.10 d0.70 ± 0.10 b0.90 ± 0.10 c4.0 ± 2.00 e0.60 ± 0.10 ab0.50 ± 0.01 a
Hexyl hexanoate3.80 ± 0.30 d3.50 ± 0.10 b0.0 ± 0.0 a3.50 ± 0.20 b3.50 ± 0.10 c3.50 ± 0.20 b
Ethyl benzoate0.20 ± 0.01 c0.10 ± 0.01 a0.30 ± 0.01 d0.40 ± 0.01 e0.40 ± 0.01 f0.0 ± 0.0 b
Isoamyl acetate132.3 ± 7.8 a166.7 ± 8.6 a904.0 ± 53.0 d688.9 ± 25.4 c332.7 ± 20.1 b689.2 ± 29.1 c
2-Phenylethyl butanoate1.10 ± 0.10 b6.80 ± 0.40 e2.00 ± 0.20 c2.70 ± 0.10 d0.40 ± 0.01 a1.10 ± 0.01 b
Ethyl hexanoate1.00 ± 0.10 a43.1 ± 1.9 b43.3 ± 1.7 b58.6 ± 4.1 c59.0 ± 4.0 c58.1 ± 4.9 c
Ethyl octanoate22.0 ± 1.7 a20.3 ± 0.8 a19.4 ± 0.2 a80.5 ± 3.1 d38.0 ± 4.0 b55.0 ± 3.3 c
cis-3-Hexenylbutyrate4.00 ± 0.01 ab4.40 ± 0.30 c4.20 ± 0.30 bc3.80 ± 0.20 a4.10 ± 0.20 bc3.90 ± 0.10 ab
2-Methylbutanoate0.70 ± 0.01 a4.50 ± 0.30 b5.80 ± 0.30 c0.60 ± 0.01 a0.10 ± 0.01 a0.70 ± 0.10 a
Hexyl acetate1.20 ± 0.10 a0.60 ± 0.01 a1.80 ± 0.10 a0.90 ± 1.50 c2.50 ± 0.20 a8.30 ± 0.30 b
Ethyl decanoate19.1 ± 0.8 a31.0 ± 1.0 c23.5 ± 0.5 b51.4 ± 4.0 d55.8 ± 2.7 e57.4 ± 0.6 e
Ethyl heptanoate0.0 ± 0.0 a0.10 ± 0.01 c0.10 ± 0.01 b0.10 ± 0.01 d0.10 ± 0.01 e0.20 ± 0.01 f
Z-3-Hexenol acetate1.30 ± 0.10 b0.0 ± 0.0 a5.40 ± 0.30 c0.0 ± 0.0 a10.3 ± 0.6 d3.40 ± 0.30 b
Phenylethyl hexanoate0.20 ± 0.01 b0.20 ± 0.01 c0.20 ± 0.01 b0.20 ± 0.01 c0.20 ± 0.01 b0.01 ± 0.01 a
Ethyl benzoate0.20 ± 0.01 b0.10 ± 0.01 b0.30 ± 0.01 d0.40 ± 0.01 e0.0 ± 0.0 a0.10 ± 0.01 c
Ethyl dodecanoate19.1 ± 0.7 b31.1 ± 1.0 d23.5 ± 0.4 c9.70 ± 0.50 a20.3 ± 0.9 b57.4 ± 0.6 e
Phenethyl benzoate1.20 ± 0.10 d2.10 ± 0.01 ab2.20 ± 0.01 c3.40 ± 0.20 e3.20 ± 0.10 a3.30 ± 0.10 de
Ethyl undecanoate0.50 ± 0.01 c0.60 ± 0.01 d0.60 ± 0.01 bc0.50 ± 0.01 bc0.60 ± 0.01 b0.0 ± 0.0 a
B-Phenylethyl acetate26.5 ± 1.7 a3.30 ± 0.20 b4.20 ± 0.20 b0.0 ± 0.0 a0.20 ± 0.01 c35.0 ± 3.0 d
Ethyl hexadecanoate16.4 ± 0.9 e10.6 ± 0.6 a17.7 ± 0.8 b33.0 ± 2.3 c87.1 ± 4.1 b69.0 ± 3.0 d
2-Phenylethylacetate1154.2 ± 88.9 a669.0 ± 35.0 b1619.2 ± 107.9 d650.4 ± 6.9 b385.4 ± 14.4 c1274.0 ± 99.0 c
Geranol acetate1.30 ± 0.01 c1.30 ± 0.10 a2.90 ± 0.01 c2.40 ± 0.10 b2.90 ± 0.01 a4.80 ± 0.10 d
Butyrolactone (mg/L)21.0 ± 16.0 b21.0 ± 16.0 b20.0 ± 14.0 b8.60 ± 0.70 a8.80 ± 0.60 a9.10 ± 0.40 a
2-Phenylbenzo acetate2.30 ± 0.01 a2.50 ± 0.01 d2.30 ± 0.01 b2.10 ± 0.01 a2.01 ± 0.01 c2.01 ± 0.01 a
Ethyl tetradecanoate8.70 ± 0.10 ab8.10 ± 0.40 a10.0 ± 0.9 c9.30 ± 0.70 bc8.20 ± 0.30 ab11.2 ± 1.0 d
Furanoic
5-HMF16,521.0 ± 14 a1140.1 ± 38.5 b1106.0 ± 13.6 b468.0 ± 14.0 a466.4 ± 28.1 c484.2 ± 35.6 a
Furfural1707.7 ± 12.1 a1536.7 ± 96.0 d1013.6 ± 66.7 c436.2 ± 38 b735.4 ± 44.0 e561.6 ± 46.5 a
5-Methylfurfural645.0 ± 2.6 d226.2 ± 15.2 b377.4 ± 20.6 c13.5 ± 0.7 a26.0 ± 2.7 e21.0 ± 2.0 d
Pentylfuran3.30 ± 0.20 c7.10 ± 0.20 d7.70 ± 0.40 e0.0 ± 0.0 ab0.0 ± 0.0 ab0.0 ± 0.0 a
Table 4. Aromatic series of different wines. Values shown represent averages of triplicate samples (data are mean ± SD). Values with different superscript letters in the same row are significantly a different test (p < 0.05).
Aromatic SeriesCoop. Aguilar de la Fra.Coop. La UnionCoop. San
Acacio
Lagar SaavedraLagar Los
Borbones
Lagar
Cañada
Navarro
Fruity54.9 ± 0.3 d44.8 ± 0.8 c29.0 ± 2.0 b28.7 ± 0.7 b26.1 ± 0.8 a47.0 ± 2.0 c
Green fruit4.60 ± 0.30 b6.70 ± 0.40 b5.60± 0.70 c4.40 ± 0.10 b1.70 ± 0.10 a6.80 ± 0.20 d
Green7.90 ± 0.30 ab9.40 ± 0.10 d12.2 ± 0.7 e7.40 ± 0.30 a8.50 ± 0.10 c8.10 ± 0.10 bc
Creamy5.10 ± 0.20 b5.00 ± 1.01 b5.20 ± 0.30 b3.50 ± 0.10 a3.60 ± 0.10 a4.50 ± 0.10 ab
Citrus17.0 ± 0.2 d18.8 ± 0.6 e16.0 ± 1.0 c9.90 ± 0.40 a11.1 ± 0.4 b8.90 ± 0.20 a
Chemistry16.7 ± 0.5 b11.7 ± 0.2 a11.2 ± 0.3 a16.1 ± 0.5 b17.6 ± 0.5 c20.6 ± 0.1 d
Honey0.60 ± 0.30 bc0.80 ± 0.01 d0.50 ± 0.01 a0.60 ± 0.01 c0.54 ± 0.01 bc0.50 ± 0.10 b
Waxy23.10 ± 0.5 e19.4 ± 0.8 d14.0 ± 1.0 c6.10 ± 0.20 ab6.5 ± 0.40 b5.10 ± 0.20 a
Herbal2.60 ± 0.20 b3.10 ± 0.10 c3.20 ± 0.10 c2.90 ± 0.10 c1.90 ± 0.20 a2.10 ± 0.10 a
Floral14.5 ± 0.7 b14.2 ± 0.3 b10.3 ± 0.5 a30.0 ± 2.1 d22.0 ± 1.0 c23.1 ± 1.0 c
Toasty0.10 ± 0.01 a0.10 ± 0.01 b0.20 ± 0.10 c0.35 ± 0.01 e0.50 ± 0.01 f0.20 ± 0.01 d
Disclaimer/Publisher’s Note: The statements, opinions and data contained in all publications are solely those of the individual author(s) and contributor(s) and not of MDPI and/or the editor(s). MDPI and/or the editor(s) disclaim responsibility for any injury to people or property resulting from any ideas, methods, instructions or products referred to in the content.

