Abstract
To address the limitations of traditional predictive maintenance for large wind turbines, a fault prediction method that combines a gated recurrent unit (GRU) network with an improved ant lion optimization (IALO) algorithm is proposed. Traditional fault monitoring primarily relies on the supervisory control and data acquisition (SCADA) system to monitor parameters such as oil temperature using threshold-based alarm methods. However, this approach suffers from low accuracy in judgment and delayed fault detection. To enhance the accuracy and timeliness of fault warnings, this paper selects SCADA feature variables using the Pearson correlation coefficient (PCC) and optimizes the hyperparameters of the GRU model using the IALO algorithm, which is enhanced by Latin hypercube sampling and random sampling ranking. The method is based on historical data during normal operation, and the residuals and normal distribution are used to set warning thresholds for fault prediction. The results indicate that this method overcomes the issue of traditional hyperparameter tuning falling into local optima and surpasses conventional methods in terms of prediction accuracy and timeliness. It can effectively improve the gearbox fault-warning performance.
1. Introduction
As modern society and technology continue to evolve, the scarcity of energy has become increasingly evident. The widespread development and application of clean energy sources, including solar, geothermal, and wind power, have become a major trend in today’s energy sector. In particular, the wind power industry is experiencing significant growth, with increasing wind power capacity. However, as wind turbines operate in complex and harsh environments, they face substantial challenges to the stability of their mechanical structures. The economic losses incurred by past mechanical failures indicate that components such as bearings, gears, and rotors within wind turbines are most susceptible to damage [1,2,3,4]. Consequently, the ability to effectively predict and provide early warnings for wind turbine faults has become a critical issue for enhancing the reliability of wind power equipment and reducing operational and maintenance costs.
Currently, fault warnings utilizing SCADA data from wind turbines have become widespread in the wind power industry. They serve as a key method to enhance equipment reliability and reduce operational and maintenance expenses. Deep learning, as an advanced technology, can automatically extract deep-level feature information from vast amounts of complex SCADA data, effectively modeling the operational status of wind turbines [5,6,7,8]. With this technology, the failure trend of equipment can be anticipated before or shortly after a wind turbine failure occurs, allowing for the formulation of targeted maintenance strategies in advance. This approach enhances the availability and operational efficiency of the equipment [9,10,11,12].
Ling Xiang et al. [13] proposed a convolutional neural network that incorporates an attention mechanism (AM) and a long short-term memory network (LSTM). This method conducts feature extraction and fault identification based on the operational state of wind turbines, significantly improving the accuracy and robustness of fault diagnosis. Furthermore, Imre [14] and others introduced a wind turbine prediction method that leverages LSTM and SCADA data fusion, effectively capturing the complex dynamic changes caused by the temporal span during wind turbine operation, thereby enhancing prediction accuracy.
Meng Lingchao et al. [15] proposed a PCABSMMR method. By combining principal component analysis, boundary line synthesis of a few oversampling techniques, and an improved multi-dimensional time series classification model, the efficient classification of abnormal and normal operation states of wind turbine blades was realized and achieved better performance than many existing methods, according to Puruncajas et al. [16]. By improving the sampling frequency of existing SCADA sensors, combined with a convolutional neural network (CNN) for multiple fault detection and classification of wind turbines, efficient online fault monitoring and status assessment were achieved. Jiang Guoqian et al. [17] proposed a temperature-based graph neural network model, TempGNN, using SCADA data for wind turbine system-level monitoring and a decoupling model and adaptive map structure learning, effectively reducing false positives and improving the monitoring performance through actual data validation, proving that the model, in abnormal detection, has a strong effect and robustness. He Yuchao et al. [18] proposed a false data injection attack detection model based on an improved neural network (CNN-GRU). By combining the GRU structure for spatial and temporal feature extraction and using the Mississippi open-source data set verification, the model showed good accuracy in attack detection.
Xie Yuan et al. [19] proposed a CNN-LSTM model based on an attention mechanism. By extracting features through CNN, LSTM captures the temporal relationship and optimizes the output when combined with the attention mechanism, which further improves the efficiency, accuracy, and generalization ability of the model. Due to the high model complexity of LSTM, the hyperparameters need to be optimized to ensure their effectiveness in different datasets and scenarios. In this regard, Sun Yiyang et al. [20] proposed an LSTM hyperparameter optimization method based on particle swarm optimization (PSO). By automatically adjusting the key parameters of LSTM, it not only improves the prediction accuracy of the model but also reduces the need for manual intervention. Zhang Jingjing et al. [21] proposed a PSO-based BP neural network regression prediction method and developed a PSO-BP joint prediction model using wind farm SCADA data to evaluate the prediction error by monitoring whether the residuals exceeded the threshold.
In addition, Henry et al. [22] improved the wavelet core limit-learning machine (WKELM) based on the enhanced ant lion optimization algorithm (CALO) and enhanced the global optimization capability by introducing the Cauchy mutation operator. Rashid et al. [23] used machine-learning technology to build a state-monitoring system based on SCADA data and successfully predicted the failure of the turbine gearbox by using the bagged regression method, giving a warning 68 days in advance.
In the recurrent neural network (RNN) model processing temporal data, a GRU as an improved RNN has less of a gating mechanism and a higher computational efficiency than LSTM. GRU is able to effectively handle the dependence of long time series, but in practice, the choice of its hyperparameters has an important impact on the prediction accuracy of the model. In order to ensure that the model achieves the best prediction effect, it is crucial to optimize the reasonable hyperparameters. Therefore, current research is focused on the improvement of fault prediction accuracy by optimizing the GRU hyperparameters
Based on this, this paper utilizes historical normal and fault data collected from the wind turbine SCADA system, combined with the GRU network model, to implement fault early warning for wind turbines. To avoid the issue of poor fitting results caused by manual parameter selection, the ant lion optimizer (ALO) algorithm is used to optimize the GRU model parameters. Compared to similar optimization algorithms, such as particle swarm optimization (PSO), the ALO demonstrates higher computational efficiency in solving complex problems involving global optimization, multimodality, and high dimensionality. To overcome the limitations of the optimization algorithm itself, the paper not only improves the ALO algorithm but also employs the PCC method for selecting input features, further enhancing the model’s computational efficiency and accuracy.
2. Wind Turbine Parameter Description and Feature Selection
2.1. Description of the Wind Turbine Parameters
This study selected a 2 MW wind turbine located on a wind farm in Dabancheng, Xinjiang province from 1 January to 31 December 2020. The rated power of the wind turbine is 2 MW. Its cut-in wind speed is set at 4 m/s, and the cut-out wind speed is 25 m/s, while the rated wind speed is 15 m/s. The SCADA system records the operating parameters of the wind turbine every 10 min, including but not limited to key indicators such as wind speed, generating power, rotation speed, and temperature. At the same time, the system will also record the start of wind turbines, shutdown and safety chain disconnection, and other key state information. These exhaustive data are crucial to assess and analyze the performance of wind turbines. In view of the environmental and structural uncertainties, the parameter values of wind turbines are usually set to a wide range of changes. To improve the accuracy of the model, the necessary preprocessing of the data recorded by the SCADA system is an indispensable step. The following are the main methods for data preprocessing.
2.1.1. Data Validity Check
Usually, by setting a reasonable range of various monitoring parameters (such as wind speed, power, etc.), any data outside of this range can be considered as an exception. For example, check the wind speed, the generator power, and the range of the set power values. Wind speeds above a certain set range (e.g., >50 m/s) may be untrue. When analyzing the power curve, it is usually found that, when the wind speed meets the requirements of grid connection, the power value is near zero in some cases. As shown in Figure 1 and Figure 2, the main cause of this phenomenon may be the interference data caused by the wind abandon or other factors of the wind turbine.
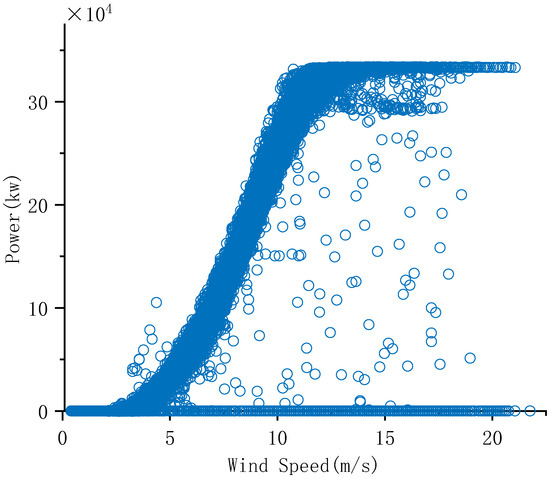
Figure 1.
Raw wind speed–power diagram.
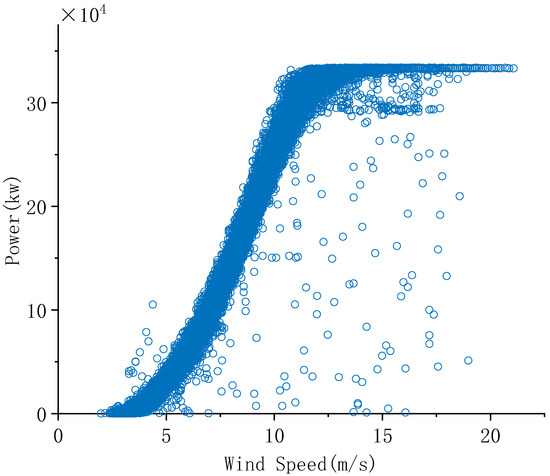
Figure 2.
Data after removing the power abnormalities.
2.1.2. Identification and Handling of Data Outliers
In data processing, it is crucial to identify and handle outliers. Linear or spline interpolations are usually used to fill in the missing values in the data. However, when the missing values are too many, deleting these values may become an option, although doing so may result in data loss. If there is a change in a data point versus an adjacent time point, this may indicate the pre-processed completed data. In this case, removing samples of those variables outside of the normal change range is necessary, and identifying the cause of the abnormality is equally important.
The SCADA data of wind turbines contains a large amount of valuable information. Deleting all the data would result in the loss of useful content, negatively impacting the model’s training and prediction. Therefore, removing only the abnormal or unexpected data helps preserve the normal operational data. Excessive data removal could lead to a sparse training set, affecting the model’s learning ability. Since there is a nonlinear relationship between wind speed and power, not all of the wind speed-power values are considered anomalies. By applying specific filtering criteria, unreasonable data can be removed while retaining most of the valid data and eliminating obvious outliers, as shown in Figure 3.
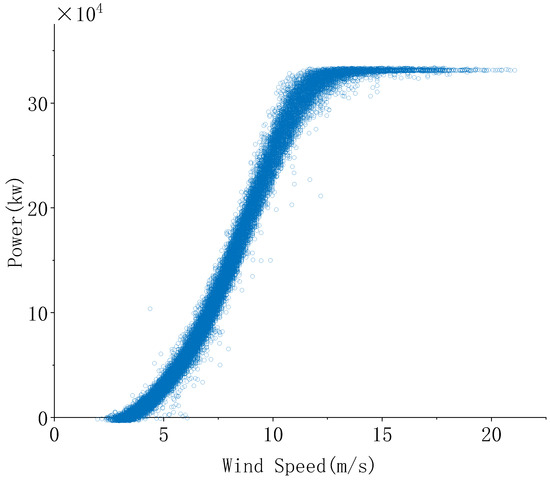
Figure 3.
Pre-processed completed data.
2.2. Selection of Feature Parameters
The oil temperature monitoring of the wind turbine gearbox is an important means of wind turbine fault early warning, The reason is that the oil temperature change of the gearbox can reflect the internal mechanical state and lubrication of the gearbox. As a key component of the wind turbine, the normal good operation of the gearbox depends on the normal circulation of the lubricating oil. Too high or too low oil temperature may indicate insufficient mobility of the lubricating oil, which will affect the lubrication effect of the gearbox, lead to excessive wear or lag, and increase the risk of failure. Generally, the gearbox-lubricating oil temperature is selected as the monitoring point of the fault-warning model.
2.2.1. Multi-Input Model
In the practical application of a wind turbine gearbox, there are two input models: single-input model and multi-input model. Given that wind turbines usually require long operation, their maintenance and failure prediction rely on accurate temperature predictions. The oil temperature of the wind turbine is affected by many factors, such as load, rotation speed, ambient temperature, etc. It is difficult for a single input model to fully capture these changes. In contrast, multi-input models are able to capture the complex interactions between these factors, thereby improving prediction accuracy. Therefore, using the multi-input model is an effective strategy to improve the accuracy of oil temperature prediction and ensure the efficient and stable operation of wind turbines. The MISO model [24,25,26] uses historical data of other m-related parameters as the input and temperature data as the output. The structure of the MISO model is shown in Equations (1) and (2).
where is the observed value of the input parameter at the m-th correlation parameter at time t, and is the input parameter.
2.2.2. Pearson Correlation Coefficient
However, during the MISO model-training process, the more input parameters, the longer the training time, which may lead to the overfitting phenomenon of the model. Therefore, in order to simplify the dimension, it becomes very important to extract the parameters that affect the oil temperature change in the gearbox. Therefore, in Refs. [27,28,29], the Pearson correlation coefficient method is used to reduce the input dimension and select the operating parameters with strong correlation. The correlation coefficient is expressed as follows:
where r is the Pearson correlation coefficient, and are the mean of the sample, and n is the number of sample values.
Characteristic selection of preprocessed wind turbine SCADA operating data used Pearson’s correlation coefficient method (results are shown in Table 1). Parameters with an absolute value of the correlation coefficient greater than 0.7 are selected as the input of the model. The selected variables include 17 parameters, such as ambient wind speed, ambient temperature, gearbox bearing temperature, active power, generator speed, reactive power, impeller speed, and generator bearing temperature.

Table 1.
Correlation coefficient for the partial parameters.
3. Method, Principle, and Improvement
3.1. The GRU Network Model
A GRU (gated cycle unit) is a recursive neural network (RNN) variant proposed by Cho et al. [30] in 2014 to process sequence data. The GRU [31,32] is designed to solve the gradient disappearance problem often encountered by traditional RNNs with long sequence data and to improve the model memory of time steps by introducing a gating mechanism. Compared to an LSTM (long and short-term memory network), a GRU simplifies the structure while maintaining similar performance and, therefore, is more computationally efficient and comparable to LSTM in many tasks. The core idea of GRU is to use gating mechanisms to regulate the flow of information between time steps to dynamically determine which information needs to be retained and which needs to be discarded. This mechanism enables the GRU to efficiently address long-term dependency issues. Compared to the traditional RNN, the GRU has two main gatings: the update door and the reset gate. The update gate combines the forgetting gate and the input gate of the LSTM to regulate the retention of information, while the reset gate controls the discarding of information. With this structure, a GRU can effectively capture dependencies in temporal data while reducing training time and maintaining high prediction accuracy. The GRU memory unit structure is shown in Figure 4.
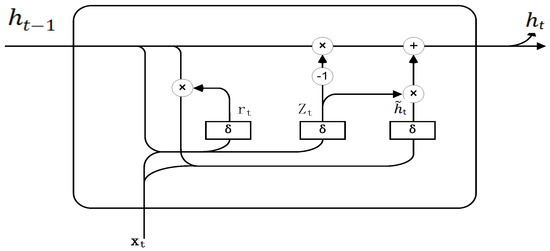
Figure 4.
The GRU memory unit network structure.
For the input time series, the GRU units separately conduct the following calculations:
where is the Sigmoid activation function; , , , , and are the weight matrix; is the input of time t; is the memory information of time t − 1; is the new memory information; and is the output vector.
3.2. Optimization of the GRU Model Based on the Modified Ant Lion Optimization
3.2.1. Ant Lion Optimization Algorithm (ALO)
As a variant of the RNN neural network, a GRU (gated cycle unit) can solve the problem of gradient explosion and long-term dependence and can significantly improve the prediction accuracy for the long sequence data. Reasonable setting of the GRU hyperparameters has a great influence on the predictive ability of the model, and choosing appropriate hyperparameters can effectively accelerate the convergence process. The initial learning rate, the number of hidden-layer neurons, the hidden-layer dimension, and the batch size determine the learning ability, training complexity, and training effect of the model. Therefore, in this paper, the improved ant lion optimization algorithm (IALO) is used to optimize the four hyperparameters of the GRU iteratively, so as to achieve the prediction effect of the model.
The ant lion optimization algorithm is an optimization algorithm based on simulating the behavior of ant lion hunting ants in nature. Ant lions live in the desert and catch ants by digging sand pits, an algorithm proposed in 2015 by Seyedali Mirjalili [33]. The algorithm mimics the ant lion predation process and uses the interaction between ants and lions for global optimization. In the algorithm, ants represent the solution in the search space, which adjusts the position to avoid the capture of the ant lion, while the ant lion acts as the global searcher, simulating the way the ant lion catches ants. Ant movement updates are both influenced by local attraction and guided by ant lion capture mechanisms, ultimately enabling optimized search.
The ant’s update formula is usually expressed as follows:
where represents the new position of ants, represents the current position, represents the global optimal solution, L represents the best position of the ant lion (i.e., bunker), and and represent the weight parameters controlling the local and global search, respectively.
Update the formula for the ant lion:
where and represent the old and new locations of ant lions, represents the best position for all ants, and represents the weight of their position updates.
Although the ant lion optimization algorithm performs well in many application scenarios, there are also some shortcomings and limitations. The ant lion optimization algorithm easily falls into the local optimal solution, and there are a series of problems with slow convergence speed and low search accuracy in the later stage, especially in the complex high-dimensional optimization problems. Although the algorithm has some exploratory power by simulating the interaction between ants and ant lions, it may still converge prematurely to some local optimal solution and fail to find a global optimal solution. At the same time, because the iteration process depends on the alternating behavior between the ant and the ant lion, the update process is relatively slow. Therefore, in the traditional ALO algorithm [34], the Latin hypercube sampling (LHS) algorithm is introduced and the Levy flight algorithm optimizes the ant lion and avoids the local search trap, forming an improved ant lion optimization algorithm.
3.2.2. Latin Ultra-Cube Sampling
The original ant and ant positions are initialized by randomization, which may lead to the initial position distribution not being uniform enough, which will reduce the diversity of positions and make the algorithm face high uncertainty. Latin hypercube sampling [35] is a sampling technique commonly used for global optimization, which is particularly suitable for uniform sampling in high-dimensional space. As shown in Figure 5, the problem of uneven sample distribution, which is possible during random initialization, can be solved. The uniform stratification of Latin hypercubic sampling can improve the randomness of its distribution, effectively improving the searchability of the algorithm and avoiding falling into the local trap.
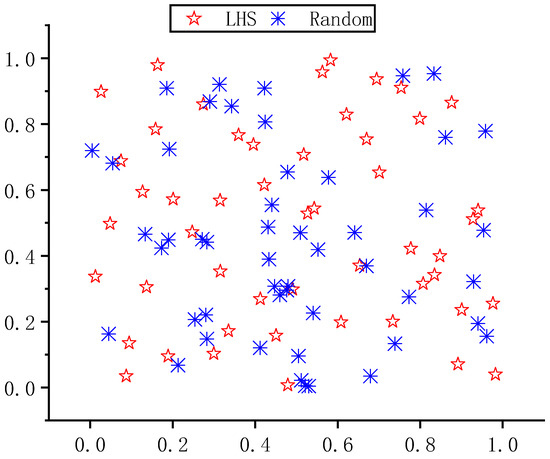
Figure 5.
Method of sampling.
Then, this paper adopts the elite strategy, which combines Latin hypercube sampling initialization and random initialization, to initially calculate the adaptability of each initial ant and ant lion, rank them, and select the ants and ant lions with better adaptability. In the above way, the initial position can be more uniform, making the initial position more likely, thus improving the global optimization performance.
3.2.3. Levy Flight Algorithm
The Levy flight algorithm is a non-Gaussian random walk strategy. The advantage is that it can occasionally make long-distance jumps while walking short distances, which can effectively balance local search and global exploration capabilities. The location update formula is as follows:
where is the current position of the ant, is a random step, and is a dot product. Step s can be expressed as follows:
where the and parameters in the above equation have a Gaussian distribution and are obtained as follows:
To improve the search capability, a random dynamic search step is introduced:
where and are the current iteration and the maximum number of iterations.
3.3. Improved IALO-GRU Prediction Model
Based on the SCADA data of the wind turbine, to realize the state of wind motor gearbox prediction using the data with a nonlinear, dimensional, complex, and temporal time span, research shows that GRU can effectively handle such data, but for the super parameter setting of the experiment, the paper puts forward the prediction model of IIALO-GRU. The specific process is shown in Figure 6.
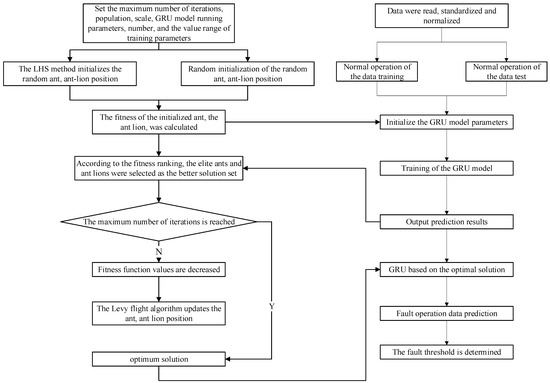
Figure 6.
The IALO-GRU prediction model process.
- For the optimization objective and algorithm initialization, the optimization objective function is set to initialize the improved IALO population M, in which the number of ants and ant lions is M/2, the optimization target parameter dimension is four, and the number of iterations is set at 50;
- For initial sample generation and location initialization, Latin hypercubic sampling (LHS) uses the uniform-sampling and random-sampling methods to generate the initial sampling points to ensure the uniform coverage of the search space. Use these sample points to initialize the population locations. During the iteration, the mean square error (MSE) based on the GRU network model was evaluated as a function of fitness;
- For GRU hyperparameter setting and optimization, set the hyperparameters, such as the hidden-layer cells, GRU unit layers, training batch size, and learning rate of the GRU network. The IALO model combined with the flight algorithm updates the position and speed to further optimize the local solution;
- For adaptive value adjustment and convergence judgment, as the iteration process progresses, the adaptive value gradually decreases, and the current optimal solution is recorded. When the IALO algorithm reaches the maximum number of iterations or satisfies the termination condition, the solution is treated as a convergence, finally obtaining the optimal hyperparameter solution of the GRU network.
4. Experimental Validation
4.1. Experimental Design Based on the IALO-GRU Model
The transmission oil temperature warning model based on the IALO-GRU method consists of two parts. For gearbox normal data processing, first, eliminate the invalid data and incorrect data from the historical normal SCADA data set, and select reasonable input parameters with the Pearson correlation coefficient. Second, the test residual of gearbox oil temperature in a healthy state is obtained by the IALO-GRU prediction method. Since the residuals generally conform to the normal distribution principle under the predicted and real data, about 99.7% of the data will fall within μ ± 3σ. Thus, residuals beyond this range are generally considered outliers. For gearbox abnormal data processing, first, the real-time SCADA data are preprocessed, and then, the input parameters are obtained through the correlation coefficient analysis. Second, the predicted value was obtained from the model prediction of abnormal data trained on the IALO-GRU normal data. Finally, to determine whether the moving window residue is the threshold calculated during the hypermodel procedure, if the set threshold is exceeded, the monitoring system will issue a warning signal. If neither exceeds the threshold, the transmission is running well and then continues to monitor the running status of the transmission.
4.2. Analysis of Prediction Results of Normal Data of Gearbox Operation
The wind turbine had only one gearbox failure in a year. The fault occurred at about 8:00 on 19 September 2022, and the maintenance personnel found that the gearbox was seriously damaged. The data from 0:00 on 10 January to 0:00 on 10 September 2022, were used as the normal training set, and the data from 0:00 on 10 September to 23:00 on 11 September 2022, were used as the model validation set.
4.2.1. Optimize the Model Parameter Setting
Standardized data are fed into the IALO-GRU model, which is trained by adjusting the GRU hyperparameters (such as hidden-layer cells, GRU cell layers, training batch size, and learning rate), whose parameter ranges are detailed in Table 2.
Table 2.
Optimize parameter settings.
4.2.2. Comparative Analysis of Hyperparameter Optimization of Different Models
In order to evaluate the accuracy of the model in predicting the lubricating oil temperature of the gearbox, four models, PSO-GRU, IALO-LSTM, ALO-GRU, and GRU, were constructed for comparative analysis. All models used the same data samples and optimized parameter settings to predict the oil temperature of the gearbox during normal operation. The experimental results are shown in Figure 7. To evaluate the accuracy and parameter fit of the five models, root mean square error (RMSE), mean absolute percentage error (MAPE), and goodness of fit statistics (r2) were used as the evaluation indexes. The specific expressions are as follows:
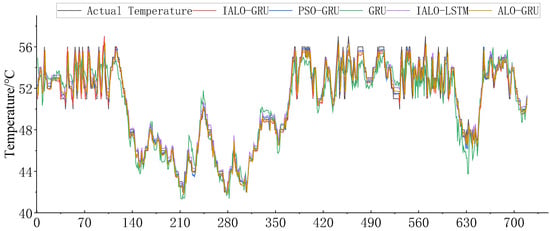
Figure 7.
Oil temperature prediction for different models.
In the above evaluation indexes, lower RMSE and MAPE values and higher values all indicate better fit and higher prediction accuracy. As can be seen from Figure 8, the IALO-GRU model based on normal operation data performs the best on the root mean square error (RMSE) and average absolute percentage error (MAPE) and has the best fit, indicating that it can quickly and accurately detect abnormalities when failure occurs.
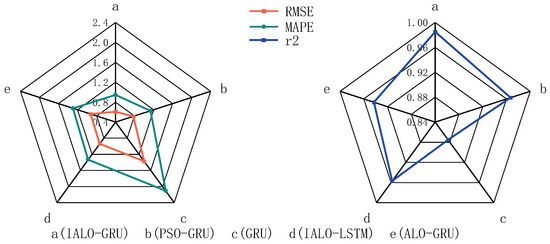
Figure 8.
Different model evaluation.
4.2.3. Comparison Analysis of Different Residuals of Different Models
The fault alarm threshold of the model will be set based on normal data and the 3 σ principle following normal distribution. By using the model trained with normal samples, the residual between the actual value and the predicted value should remain within the set alarm range. Once an abnormal situation occurs, the predicted residual will fluctuate significantly and exceed the alarm threshold range, thus realizing the fault warning. The methods for calculating the threshold range are detailed in Equations (18) and (19).
where represents the mean of the residual between the actual and predicted value and represents the standard deviation.
The results are shown in Figure 9 and Figure 10. Due to the minimal threshold range determined by the IALO-GRU model, the early-warning model achieves higher precision and sensitivity in the identification of anomalous data. Further explained, the model will be better able to capture those unusual and more difficult-to-detect abnormal data. This helps to identify the abnormalities in advance, ensuring that the abnormalities are not missed. So that the model can ensure effective detection, it improves the maintenance efficiency of operation and maintenance personnel and can provide strong data support for decision-making.
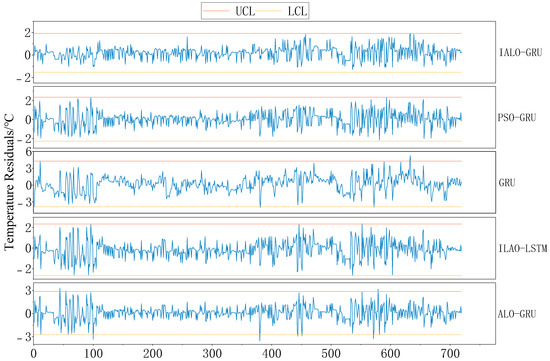
Figure 9.
Residual results of the different models.
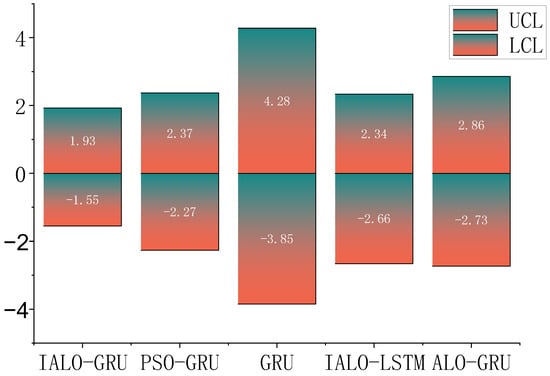
Figure 10.
Range of the different model thresholds.
4.2.4. Comparative Analysis of the Iteration Effect of Different Models
To evaluate the performance and fitting effect of the IALO-GRU algorithm during parameter optimization, the fitness function’s MSE values, shown in Figure 11 show that the modified IALO-GRU model stabilized after 21 iterations. Relatively, the PSO-GRU model also stabilized after 15 iterations, but its loss value was slightly higher than the IALO optimization algorithm compared to the LSTM prediction method. The GRU network shows a faster convergence rate and smaller loss values under the same optimization algorithm. Thus, the improved IALO-GRU model exhibits faster convergence under the present experimental conditions, thus verifying the advantages of the proposed IALO-GRU algorithm in the solution process.
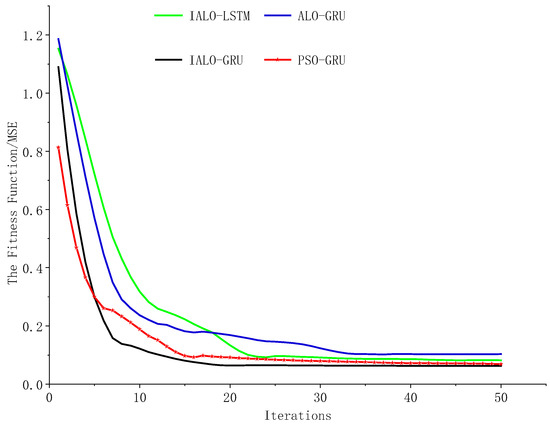
Figure 11.
Different model iteration effects.
4.3. Analysis of the Prediction Results of Abnormal Gearbox Operation Data
The fault sample test set data are the SCADA data from 0:00 to 8 a.m. on 19 September 2022. As shown in the above experiments, the IALO-GRU model training based on normal running data showed better fitting ability and a smaller threshold range. The theoretical performance should have a better fault identification ability. To confirm this point of view, the abnormal sample test experiment’s results are shown in Figure 12, as well as the IALO-GRU model on the 17th. And the alarm’s frequent residual beyond the threshold range in the following time confirmed that the model can effectively predict a fault and alarm in time. The frequent alarms in the other models were relatively late. The PSO-GRU model detected the residual oil temperature beyond the threshold at 1 a.m. on the 18th. The GRU model alerted at 6 a.m. on the 18th. The IALO-LSTM alerted at 8 am on the 18th, and ALO-GRU triggered the alarm at 10 am on the 18th. However, the IALO-LSTM and PSO-GRU had failed alarms during normal operation, probably because of improper threshold range setting in these models, resulting in poor fitting with abnormal samples and triggering false positives.
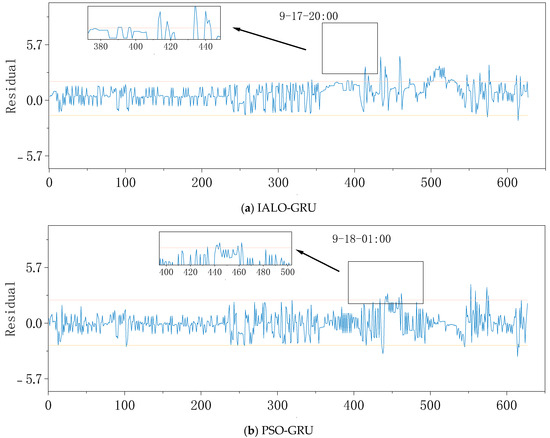
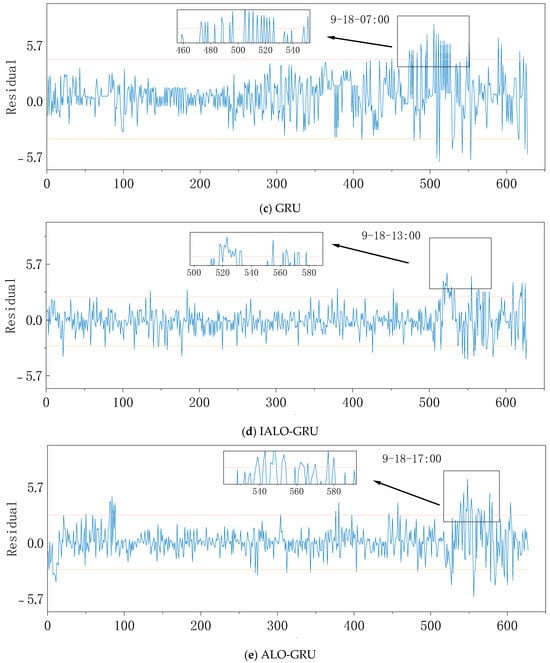
Figure 12.
(a–e) are the prediction results of different model exception samples, respectively.
Based on the results of the five models with normal and abnormal gearbox samples, the IALO algorithm has a higher fitting degree and a smaller threshold range, giving it a better sensitivity and alarm effect. Compared with the LSTM network model, the GRU model has a better fit effect for processing the high-dimensional temporal data.
5. Conclusions
This paper presents an in-depth investigation into early-warning methods for wind turbine gearboxes, proposing a novel M-IALO-GRU prediction model. By integrating wind turbine SCADA data, the model predicts the gearbox oil temperature and determines the alarm threshold range using the principle. An alarm signal is triggered when the residual between the actual oil temperature and the predicted value exceeds the threshold, enabling effective fault early warning for the gearbox. To enhance model performance, the Pearson correlation coefficient is employed to filter SCADA time-series data, aligning it with the characteristics of the GRU network. Furthermore, the improved ant lion optimizer (IALO) algorithm is utilized to optimize the GRU hyperparameters, addressing issues of poor model fitting caused by suboptimal parameter selection. Validation is conducted using one year of operational data and fault logs from a wind turbine at the Dabancheng Wind Farm, Xinjiang. Comparative experiments with five distinct early-warning models demonstrate that the M-IALO-GRU method outperforms existing approaches under the tested conditions. Specifically, it achieves a narrower alarm threshold range, higher sensitivity, and improved early-warning accuracy, significantly reducing the risk of severe accidents caused by delayed alarms. This advancement contributes to the safe and stable operation of wind turbines by enabling timely fault detection and intervention.
Author Contributions
Conceptualization, Y.W. and H.L.; methodology, Y.W.; software, Y.W.; validation, Y.W. and H.L.; formal analysis, Y.W.; investigation, Y.W.; resources, W.S.; data curation, Y.W. and S.W.; writing—original draft preparation, Y.W.; writing—review and editing, Y.W.; visualization, Y.W. and H.L.; supervision, W.S.; project administration, Y.W. and Q.Z.; funding acquisition, W.S. All authors have read and agreed to the published version of the manuscript.
Funding
This research was supported by research on the trend prediction method of operation stability deterioration of large-scale wind energy generating units (Grant number: 51565055) and research on multimodal intelligent perception and the migration method of spindle bearings of wind turbines under the Collaborative Framework (Grant number: 2022B01049).
Institutional Review Board Statement
Not applicable.
Informed Consent Statement
Not applicable.
Data Availability Statement
The data presented in this study are available on request from the corresponding author due to privacy.
Acknowledgments
The authors would like to thank the Xinjiang Wind Energy Group in Xinjiang, China, for their support throughout the research project.
Conflicts of Interest
The authors declare no conflicts of interest.
References
- Wang, L.; Cai, G.; Wang, J.; Jiang, X.; Zhu, Z. Dual-Enhanced Sparse Decomposition for Wind Turbine Gearbox Fault Diagnosis. IEEE Trans. Instrum. Meas. 2019, 68, 450–461. [Google Scholar] [CrossRef]
- Fu, Y.; Zhou, Q.; Jia, F. Fault prediction of offshore wind turbines based on SCADA data visualization. CSEE J. Power Energy Syst. 2022, 42, 7465–7475. [Google Scholar]
- Wang, J.; Gao, R.X.; Yan, R. Integration of EEMD and ICA for wind turbine gearbox diagnosis. Wind Energy 2014, 17, 757–773. [Google Scholar] [CrossRef]
- Zhao, Y.; Han, B.; Fang, G. Overview of state monitoring and fault diagnosis technology of wind turbine generator. Therm. Power Gener. 2016, 10, 1–5. [Google Scholar]
- Jin, X.; Sun, Y.; Shan, J.; Wu, G. A review of fault diagnosis and prediction techniques for wind turbines. J. Instrum. Instrum. 2017, 38, 1041–1053. [Google Scholar]
- Yadav, G.; Paul, K. Architecture and security of SCADA systems: A review. Int. J. Crit. Infrastruct. Prot. 2021, 34, 100433. [Google Scholar] [CrossRef]
- Queiroz, C.; Mahmood, A.; Tari, Z. SCADASim—A framework for building SCADA simulations. IEEE Trans. Smart Grid 2011, 2, 589–597. [Google Scholar] [CrossRef]
- Hentea, M. Improving security for SCADA control systems. Interdiscip. J. Inf. Knowl. Manag. 2008, 3, 73. [Google Scholar]
- Chen, X.; Li, J.; Cheng, H.; Li, B.; He, Z. Research and progress on condition monitoring and fault diagnosis techniques for wind turbines. J. Mech. Eng. 2011, 47, 45–52. [Google Scholar] [CrossRef]
- Yang, L.; Zhang, Z. Wind turbine gearbox failure detection based on SCADA data: A deep learning-based approach. IEEE Trans. Instrum. Meas. 2020, 70, 1–11. [Google Scholar] [CrossRef]
- Alvarez, E.J.; Ribaric, A.P. An improved-accuracy method for fatigue load analysis of wind turbine gearbox based on SCADA. Renew. Energy 2018, 115, 391–399. [Google Scholar] [CrossRef]
- Castellani, F.; Natili, F.; Astolfi, D.; Vidal, Y. Wind turbine gearbox condition monitoring through the sequential analysis of industrial SCADA and vibration data. Energy Rep. 2024, 12, 750–761. [Google Scholar] [CrossRef]
- Xiang, L.; Wang, P.; Yang, X.; Hu, A.; Su, H. Fault detection of wind turbine based on SCADA data analysis using CNN and LSTM with attention mechanism. Measurement 2021, 175, 109094. [Google Scholar] [CrossRef]
- Delgado, I.; Fahim, M. Wind turbine data analysis and LSTM-based prediction in SCADA system. Energies 2020, 14, 125. [Google Scholar] [CrossRef]
- Meng, L.; Gao, J.; Yuan, Y.; Yang, H.; Heng, F. Anomaly detection in wind turbine blades based on PCA and convolutional kernel transform models: Employing multivariate SCADA time series analysis. Meas. Sci. Technol. 2024, 35, 085109. [Google Scholar] [CrossRef]
- Puruncajas, B.; Alava, W.; Davila, E.; Tutiven, C.; Vidal, Y. Convolutional neural network for wind turbine failure classification based on SCADA data. Renew. Energy Power Qual. J. 2021, 19, 447–451. [Google Scholar] [CrossRef]
- Jiang, G.; Li, W.; Fan, W.; He, Q.; Xie, P. TempGNN: A temperature-based graph neural network model for system-level monitoring of wind turbines with SCADA data. IEEE Sens. J. 2022, 22, 22894–22907. [Google Scholar] [CrossRef]
- He, Y.; Li, L.; Qian, H.; Yao, S. CNN-GRU based fake data injection attack detection method for power grid. In Proceedings of the 2022 2nd International Conference on Electrical Engineering and Control Science (IC2ECS), Nanjing, China, 16–18 December 2022; IEEE: Piscataway, NJ, USA, 2022; pp. 408–411. [Google Scholar]
- Xie, Y.; Zhao, J.; Qiang, B.; Mi, L.; Tang, C.; Li, L. Attention Mechanism-Based CNN-LSTM Model for Wind Turbine Fault Prediction Using SSN Ontology Annotation. Wirel. Commun. Mob. Comput. 2021, 1, 6627588. [Google Scholar] [CrossRef]
- Sun, Y.; Wang, X.; Yang, J. Modified particle swarm optimization with attention-based LSTM for wind power prediction. Energies 2022, 15, 4334. [Google Scholar] [CrossRef]
- Zhang, J.; Liu, L.; Wang, L.; Xi, W. Fault detection of key parts of wind turbine based on BP neural network combination prediction model. Energy Inform. 2024, 7, 1–20. [Google Scholar] [CrossRef]
- Taylor, H.; Brown, A. A Fault Diagnosis Method for Wind Turbine Generators Based on Improved Ant Lion Optimization Algorithm and Wavelet Kernel Extreme Learning Machine. J. Comput. Sci. Softw. Appl. 2024, 4, 20–25. [Google Scholar]
- Rashid, H.; Khalaji, E.; Rasheed, J.; Batunlu, C. Fault prediction of wind turbine gearbox based on SCADA data and machine learning. In Proceedings of the 2020 10th International Conference on Advanced Computer Information Technologies (ACIT), Deggendorf, Germany, 16–18 September 2020; IEEE: Piscataway, NJ, USA, 2020; pp. 391–395. [Google Scholar]
- Yuan, Z.; Zhang, L.; Duan, L. A novel fusion diagnosis method for rotor system fault based on deep learning and multi-sourced heterogeneous monitoring data. Meas. Sci. Technol. 2018, 29, 115005. [Google Scholar] [CrossRef]
- Sharkawy, A.N.; Ameen, A.G.; Mohamed, S.; Abdel-Jaber, G.T.; Hamdan, I. Design, Assessment, and Modeling of Multi-Input Single-Output Neural Network Types for the Output Power Estimation in Wind Turbine Farms. Automation 2024, 5, 190–212. [Google Scholar] [CrossRef]
- Liu, T.; Zhao, Q.; Wang, J.; Gao, Y. A novel interval forecasting system for uncertainty modeling based on multi-input multi-output theory: A case study on modern wind stations. Renew. Energy 2021, 163, 88–104. [Google Scholar] [CrossRef]
- Pearson, K. VII. Mathematical contributions to the theory of evolution—III. Regression, heredity, and panmixia. Philos. Trans. R. Soc. Lond. Ser. A Contain. Pap. A Math. Phys. Character 1896, 187, 253–318. [Google Scholar]
- Natili, F.; Daga, A.P.; Castellani, F.; Garibaldi, L. Multi-scale wind turbine bearings supervision techniques using industrial SCADA and vibration data. Appl. Sci. 2021, 11, 6785. [Google Scholar] [CrossRef]
- Jin, X.; Xu, Z.; Qiao, W. Condition monitoring of wind turbine generators using SCADA data analysis. IEEE Trans. Sustain. Energy 2020, 12, 202–210. [Google Scholar] [CrossRef]
- Cho, K. Learning phrase representations using RNN encoder-decoder for statistical machine translation. arXiv 2014, arXiv:1406.1078. [Google Scholar]
- Encalada-Dávila, Á.; Moyón, L.; Tutivén, C.; Puruncajas, B.; Vidal, Y. Early fault detection in the main bearing of wind turbines based on Gated Recurrent Unit (GRU) neural networks and SCADA data. IEEE/ASME Trans. Mechatron. 2022, 27, 5583–5593. [Google Scholar] [CrossRef]
- Kong, Z.; Tang, B.; Deng, L.; Liu, W.; Han, Y. Condition monitoring of wind turbines based on spatio-temporal fusion of SCADA data by convolutional neural networks and gated recurrent units. Renew. Energy 2020, 146, 760–768. [Google Scholar] [CrossRef]
- Mirjalili, S. The ant lion optimizer. Adv. Eng. Softw. 2015, 83, 80–98. [Google Scholar] [CrossRef]
- Yang, Y.; Liu, A.; Xin, H.; Wang, J. Fault early warning of wind turbine gearbox based on multi-input support vector regression and improved ant lion optimization. Wind Energy 2021, 24, 812–832. [Google Scholar] [CrossRef]
- McKay, M.D.; Beckman, R.J.; Conover, W.J. A comparison of three methods for selecting values of input variables in the analysis of output from a computer code. Technometrics 2000, 42, 55–61. [Google Scholar] [CrossRef]
Disclaimer/Publisher’s Note: The statements, opinions and data contained in all publications are solely those of the individual author(s) and contributor(s) and not of MDPI and/or the editor(s). MDPI and/or the editor(s) disclaim responsibility for any injury to people or property resulting from any ideas, methods, instructions or products referred to in the content. |
© 2025 by the authors. Licensee MDPI, Basel, Switzerland. This article is an open access article distributed under the terms and conditions of the Creative Commons Attribution (CC BY) license (https://creativecommons.org/licenses/by/4.0/).