1. Introduction
Temperature monitoring in harsh environments, such as in the automotive, aerospace, energy, and industrial sectors, is essential for detecting structural degradation and preventing functional failures in critical components like bearings with limited operating temperatures [
1]. Conventional wired temperature sensors are impractical in such applications due to limitations in physical connections and power supply constraints. Wireless passive temperature sensors overcome these challenges by eliminating the need for local power sources.
Several wireless sensing techniques have been explored, including surface acoustic wave (SAW) sensors, LC resonators, and antenna backscattering methods. SAW sensors often produce weak signals, necessitating amplification or advanced signal processing techniques such as filtering and noise reduction to ensure accurate readings [
2]. Additionally, their intricate design requires precise engineering, leading to increased manufacturing complexity, calibration challenges, and higher deployment costs [
3]. Similarly, LC resonator sensors involve complex designs due to the need for precise alignment of inductive coupling components [
4]. Their weak output signals, which are prone to noise interference, require sophisticated signal processing to enhance their reliability [
5]. Furthermore, LC sensor performance deteriorates with increased distance from the reader due to variations in coupling efficiency, resulting in inconsistent measurements, particularly in large setups or obstructed environments [
6].
In contrast, the antenna backscattering method offers a simpler, low-cost, and highly efficient design, featuring well-defined resonant frequency characteristics and ease of implementation. This method enables high-frequency operation (2.4–15.5 GHz) and supports communication distances ranging from 20 to 500 mm [
7,
8,
9,
10,
11]. Daniel et al. demonstrated a 500 mm communication distance using a high-gain horn antenna as the interrogator and a rectangular patch antenna as the sensor, achieving a sensitivity of 2.2 MHz/°C [
8].
The antenna backscattering method relies on wireless interaction between the interrogator antenna and the sensor antenna, where the sensor is wirelessly powered by the coupling energy transmitted from the interrogator antenna [
7]. While this method offers advantages in wireless sensing, its performance varies depending on whether it operates in the near-field or far-field region. In near-field operation, strong energy coupling enables impedance mismatch techniques, which enhance backscattered signal strength [
12]. In far-field operation, however, energy transfer efficiency decreases with distance, making impedance matching essential for reliable sensing. Since impedance mismatch is ineffective in far-field applications, antenna optimization is crucial for maintaining backscattering efficiency and signal stability [
13].
Among various antenna configurations for wireless passive temperature sensing, rectangular microstrip patch antennas (MPAs) have been extensively investigated due to their well-established performance. However, alternative geometries, such as circular and equilateral triangular MPAs, possess inherent advantages in compactness, radiation efficiency, and mode diversity [
14,
15], which could potentially enhance backscattering signal strength and stability. Despite these promising attributes, no prior study has explored the feasibility of circular and equilateral triangular MPAs as sensor antennas for passive wireless sensing applications.
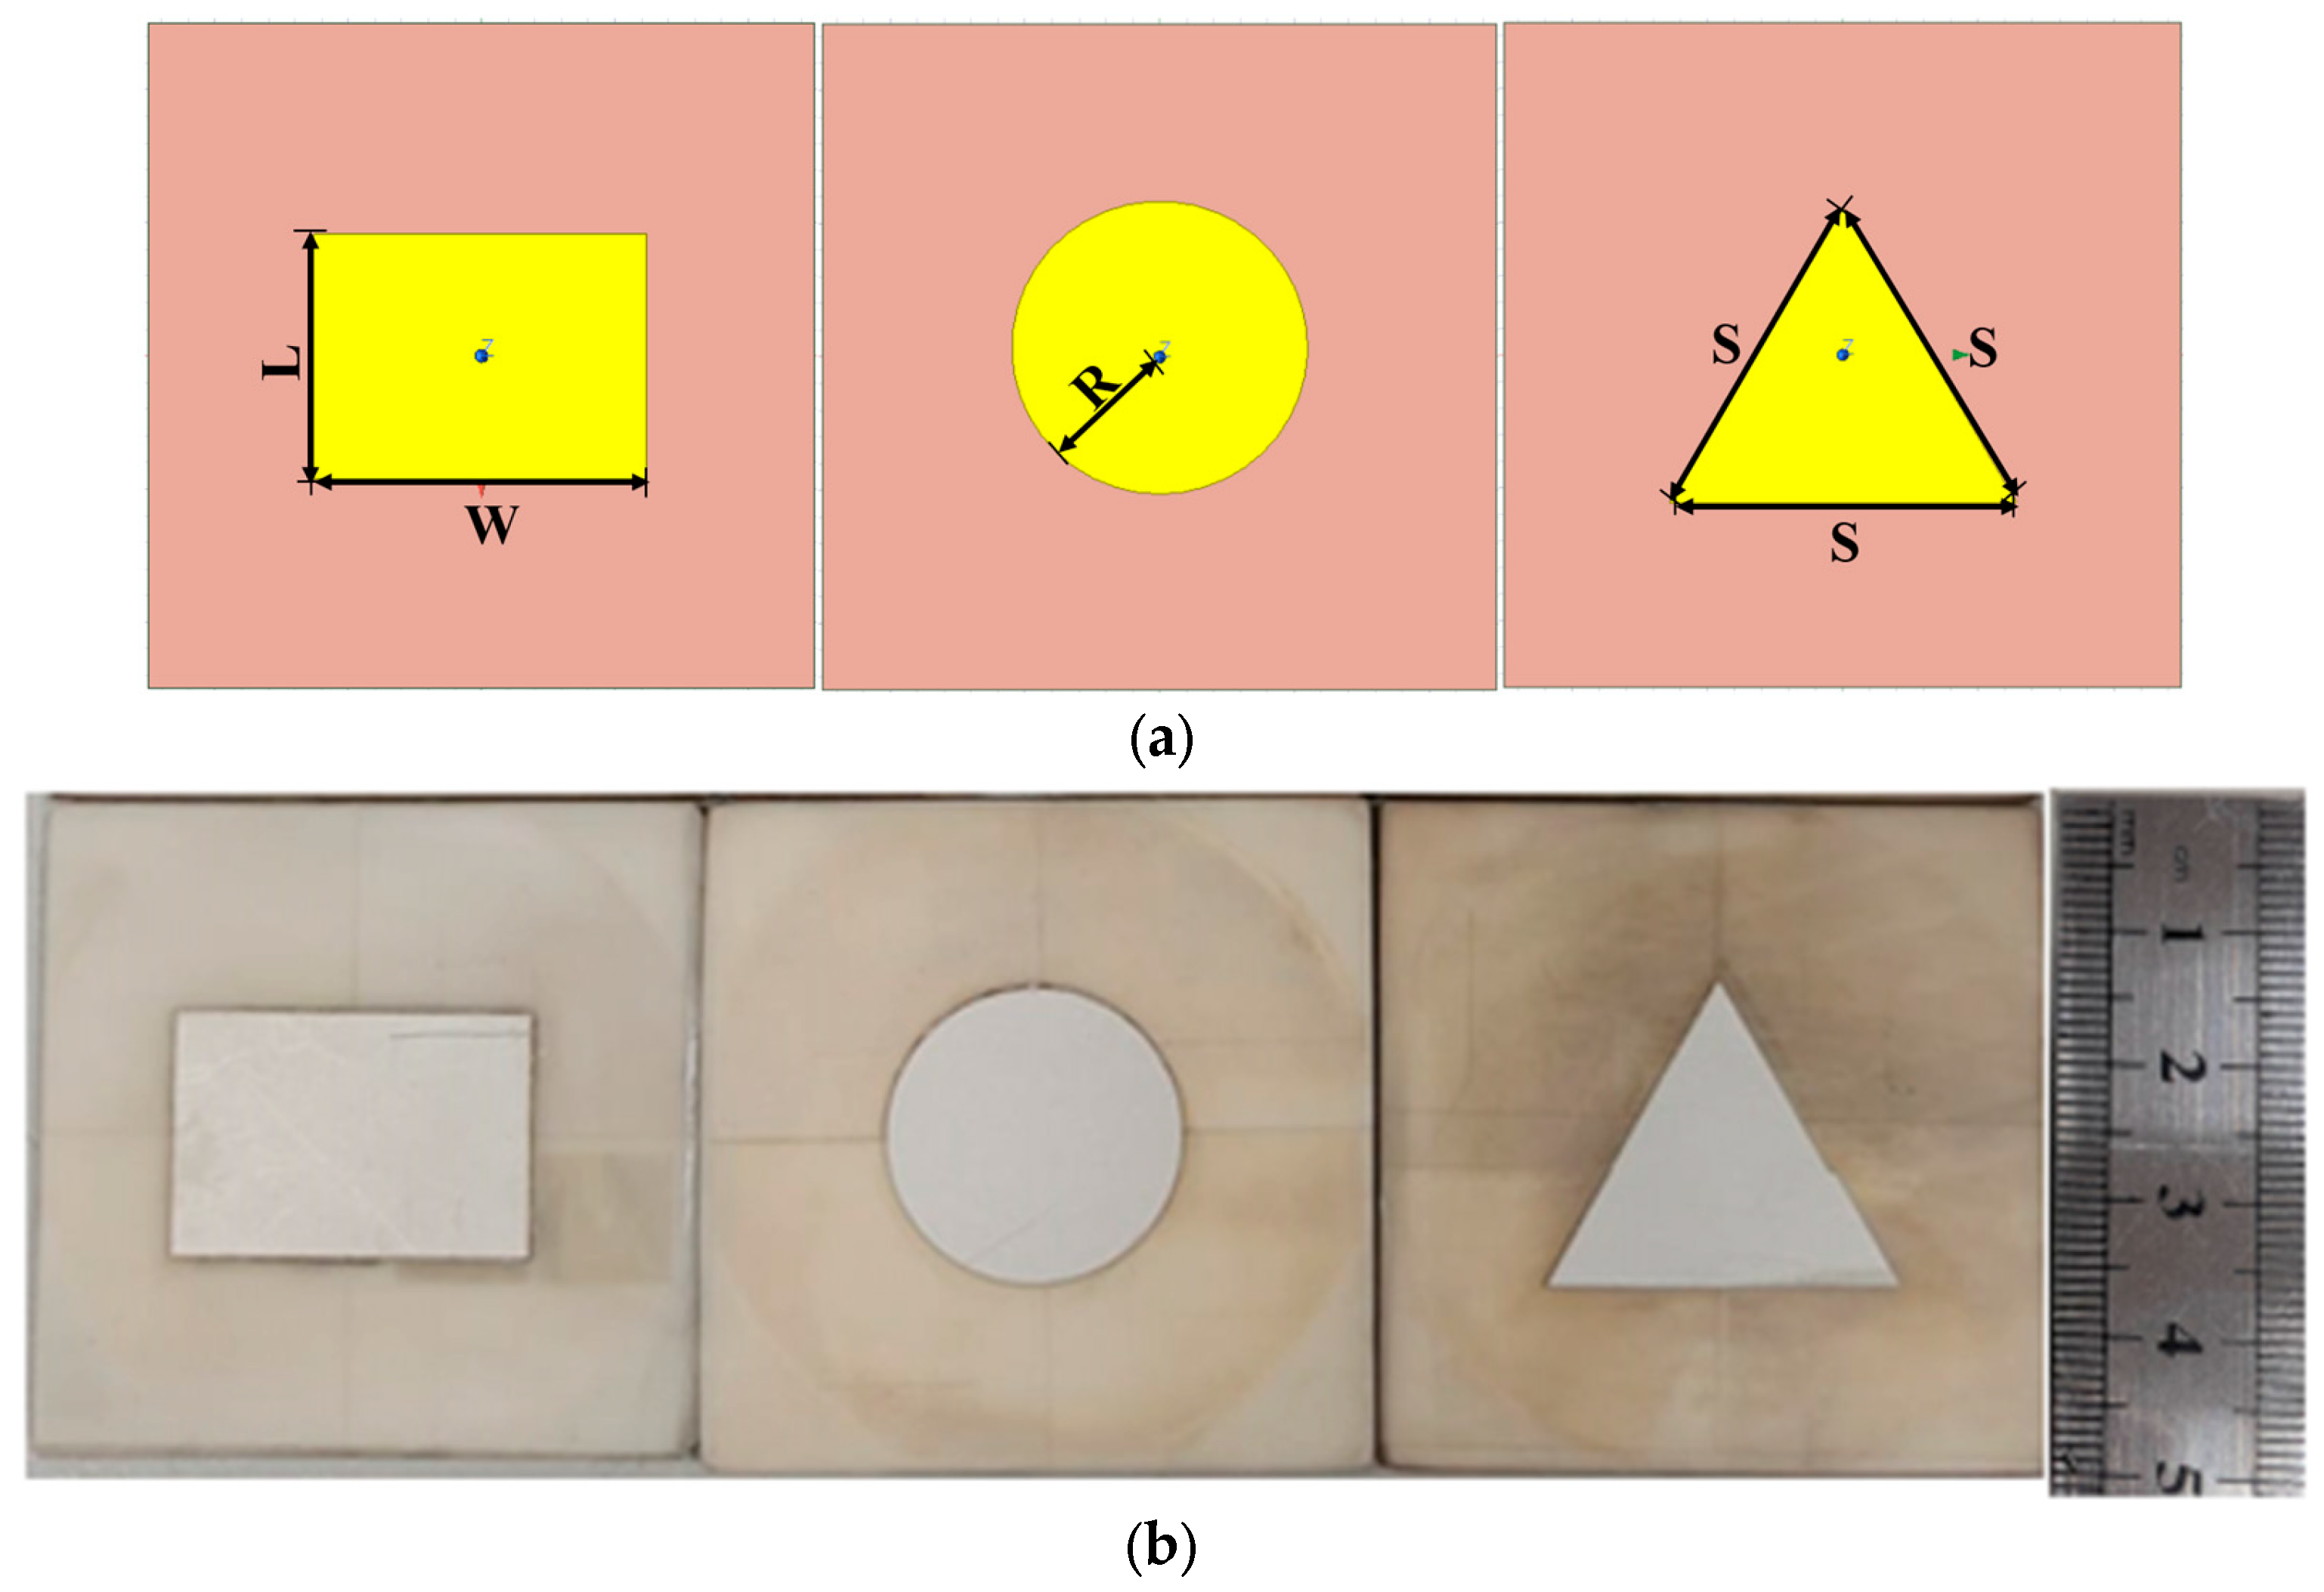
This study investigates and compares the performance of rectangular, circular, and equilateral triangular MPAs for wireless passive temperature sensing, focusing on their impact on backscattered signal strength and stability. These antennas are designed to operate at 2.4 GHz in the fundamental transverse magnetic mode, and the communication established in the far-field region. Sensor antennas are fabricated on alumina substrates, known for their high thermal stability and durability. Comparative analysis is conducted based on key performance metrics, including sensitivity and communication distance, to identify the optimal design for wireless passive temperature sensors in demanding environments.
The remainder of this work is organized as follows.
Section 2 outlines the sensor antenna design process, detailing the theoretical and the optimization of sensor dimensions.
Section 3 explains the antenna backscattering principle and identifies the parameters influencing sensor sensitivity.
Section 4 describes the experimental setup used for communication distance and sensitivity measurements.
Section 5 presents the results and discussion, including an analysis of the S
11 magnitude under various scenarios and a comparative analysis of the findings. Finally,
Section 6 concludes the study by summarizing key findings and suggesting potential future improvements.
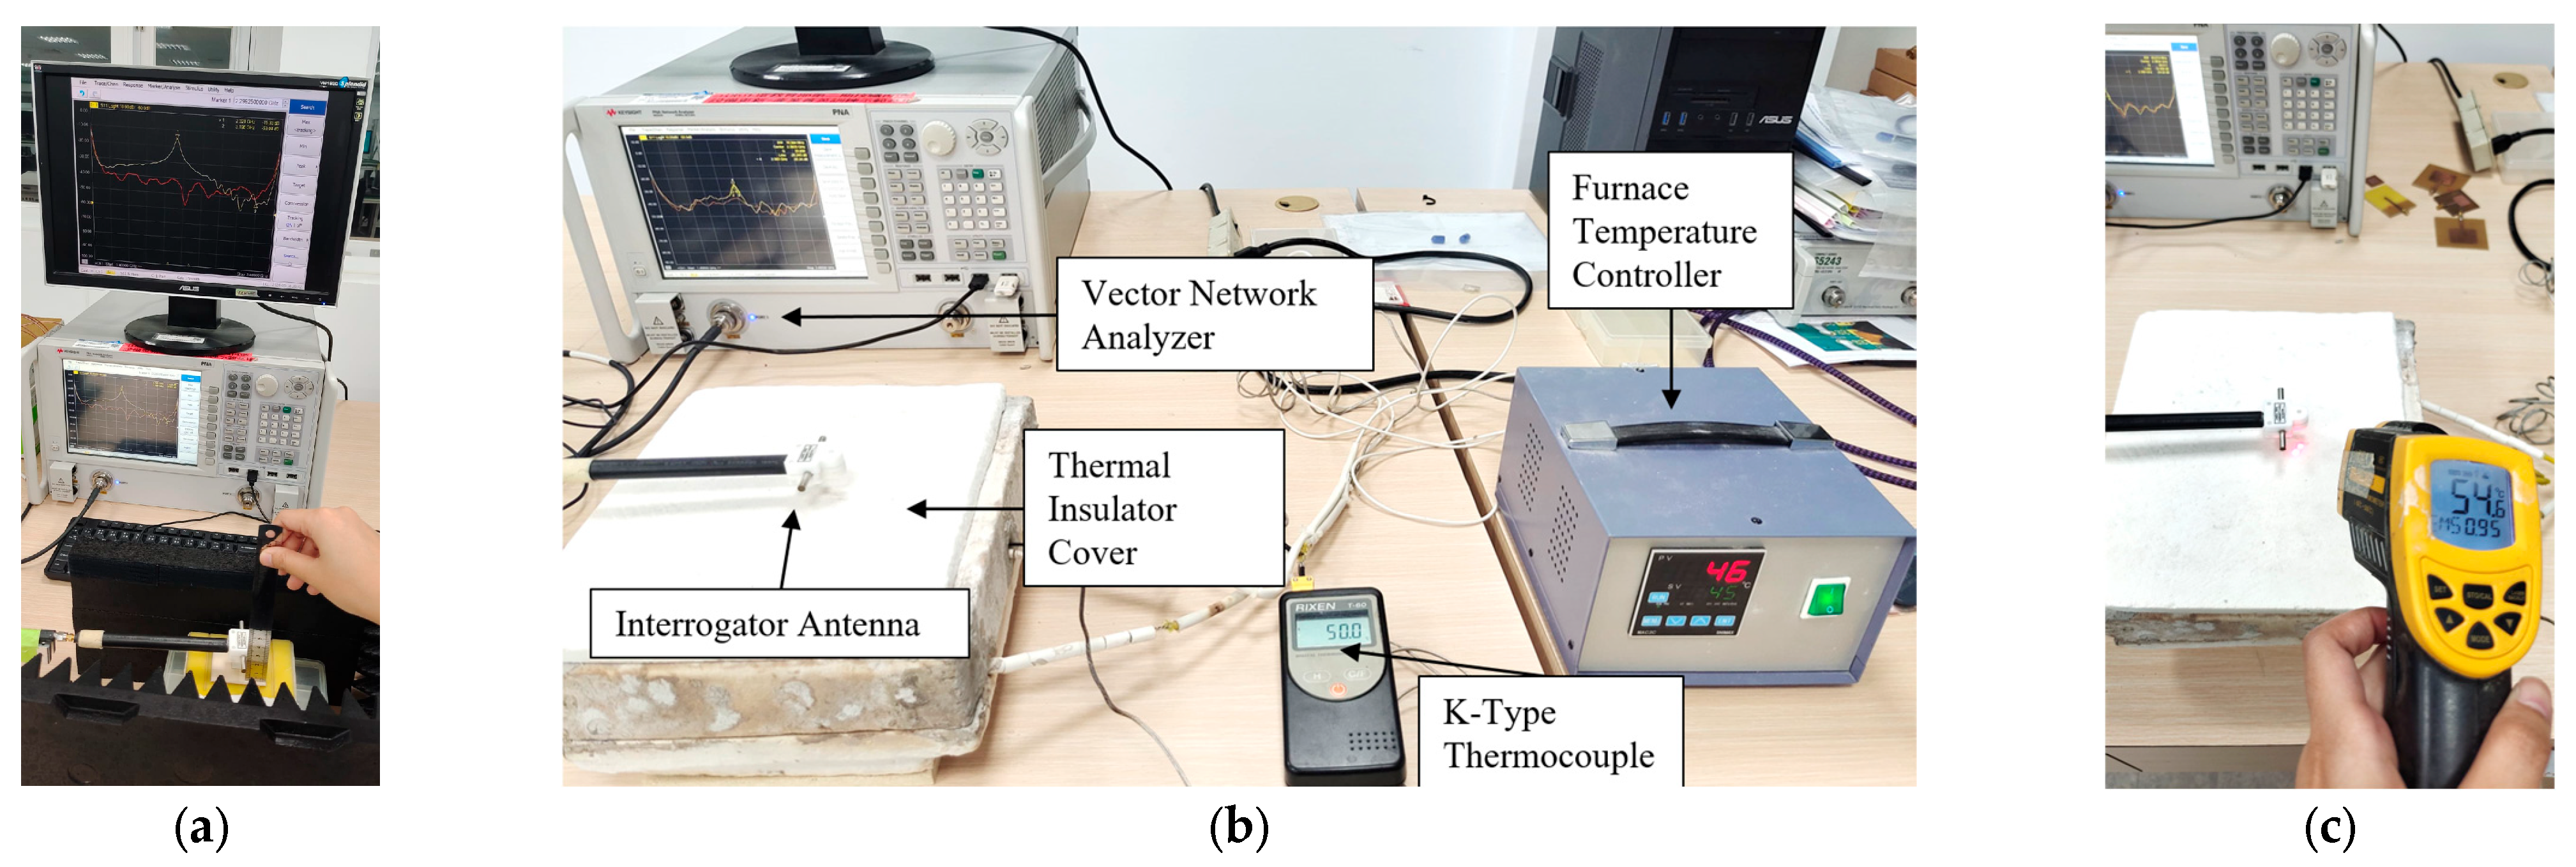
4. Experimental Setup
Performance testing consists of two key measurements: communication distance and sensitivity. A standard commercial dipole with the length of 55 mm operating at 2.3–2.5 GHz is used as the interrogator antenna. For communication distance measurement, the sensor antenna remains fixed while the interrogator antenna is positioned using a fixture pole to alter its height in a vertical direction. A ruler is employed to measure the distance. Besides that, some absorbers are employed to prevent unwanted interference from the surroundings. As the distance between the antennas increases, the backscattered signal is observed until the S
11 peak diminishes to the level of background noise, indicating the communication limit. The experimental setup for communication distance measurement is shown in
Figure 3a.
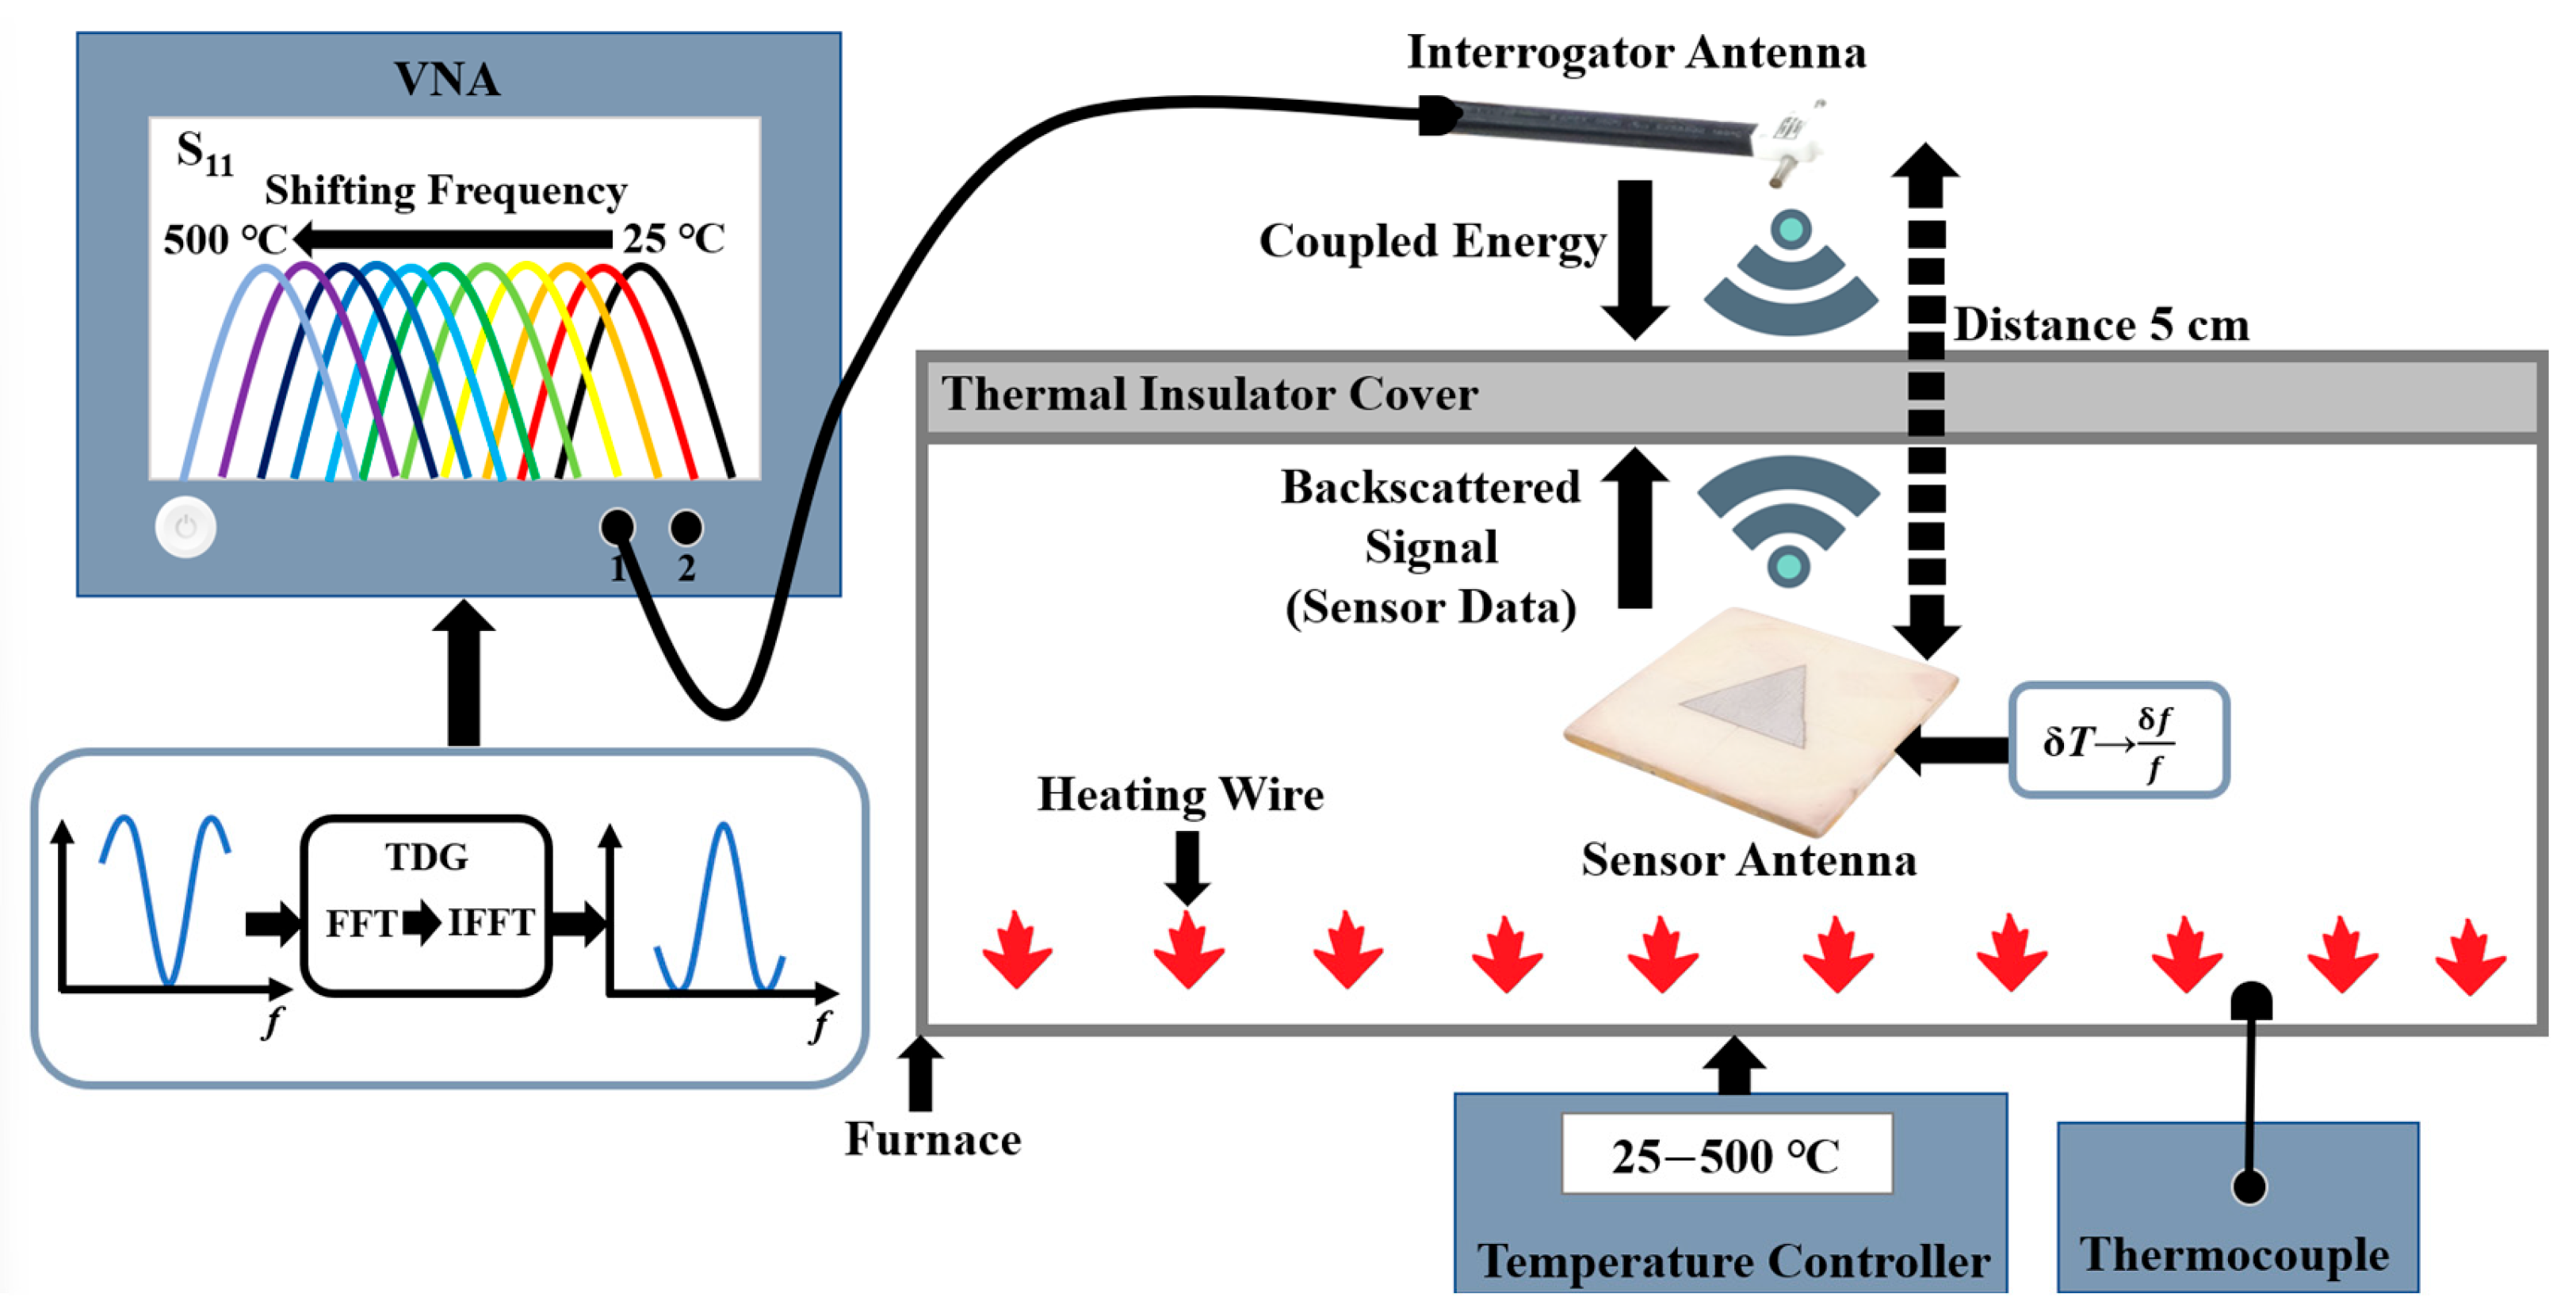
Sensitivity is measured by monitoring the resonant frequency shift as the temperature increases from 25 to 50 °C and then in 50 °C increments up to 500 °C. The antenna distance is fixed at 5 cm, which satisfies the far-field condition for both antennas. The interrogator antenna is connected to port 1 of the VNA and positioned directly in front of the sensor antenna to ensure proper polarization alignment and is located outside the furnace, as illustrated in
Figure 2. A thermal insulator cover made of alumina foam isolates the heating environment inside the furnace. Alumina foam is widely used as a high-temperature thermal insulator in various industries, including industrial manufacturing, aerospace, and power generation applications. A K-type thermocouple measures the actual temperature inside the furnace and verifies the accuracy of the furnace’s temperature controller.
Both measurements utilize the Time-Domain Gating (TDG) method applied in the VNA to eliminate environmental interference and isolate the backscattered signal received by the interrogator antenna [
20]. The inset in
Figure 2 illustrates the Time-Domain Gating (TDG) process, where an S
11 null in the original frequency domain is transformed into a peak after gating. The FFT (Fast Fourier Transform) converts S
11 to the time domain, allowing unwanted reflections to be removed. After applying IFFT (Inverse Fast Fourier Transform), the gated signal is converted back to the frequency domain, isolating the antenna’s resonant response. As a result, the original S
11 null shifts to a peak, representing the dominant resonance frequency of the antenna. The experimental setup for sensitivity measurement is shown in
Figure 3b.
To verify heat containment,
Figure 3c shows the external surface temperature of the thermal insulator cover, measured using a non-contact infrared thermometer, which reads 54.6 °C while the internal furnace temperature exceeds 400 °C. This confirms the alumina foam as a thermal insulator that effectively minimizes heat leakage, ensuring a safe environment for the interrogator antenna and measurement instruments while maintaining measurement accuracy and system stability. To further enhance heat isolation, it is recommended to use a thermal cover made of a low-thermal-conductivity material.
5. Results and Discussion
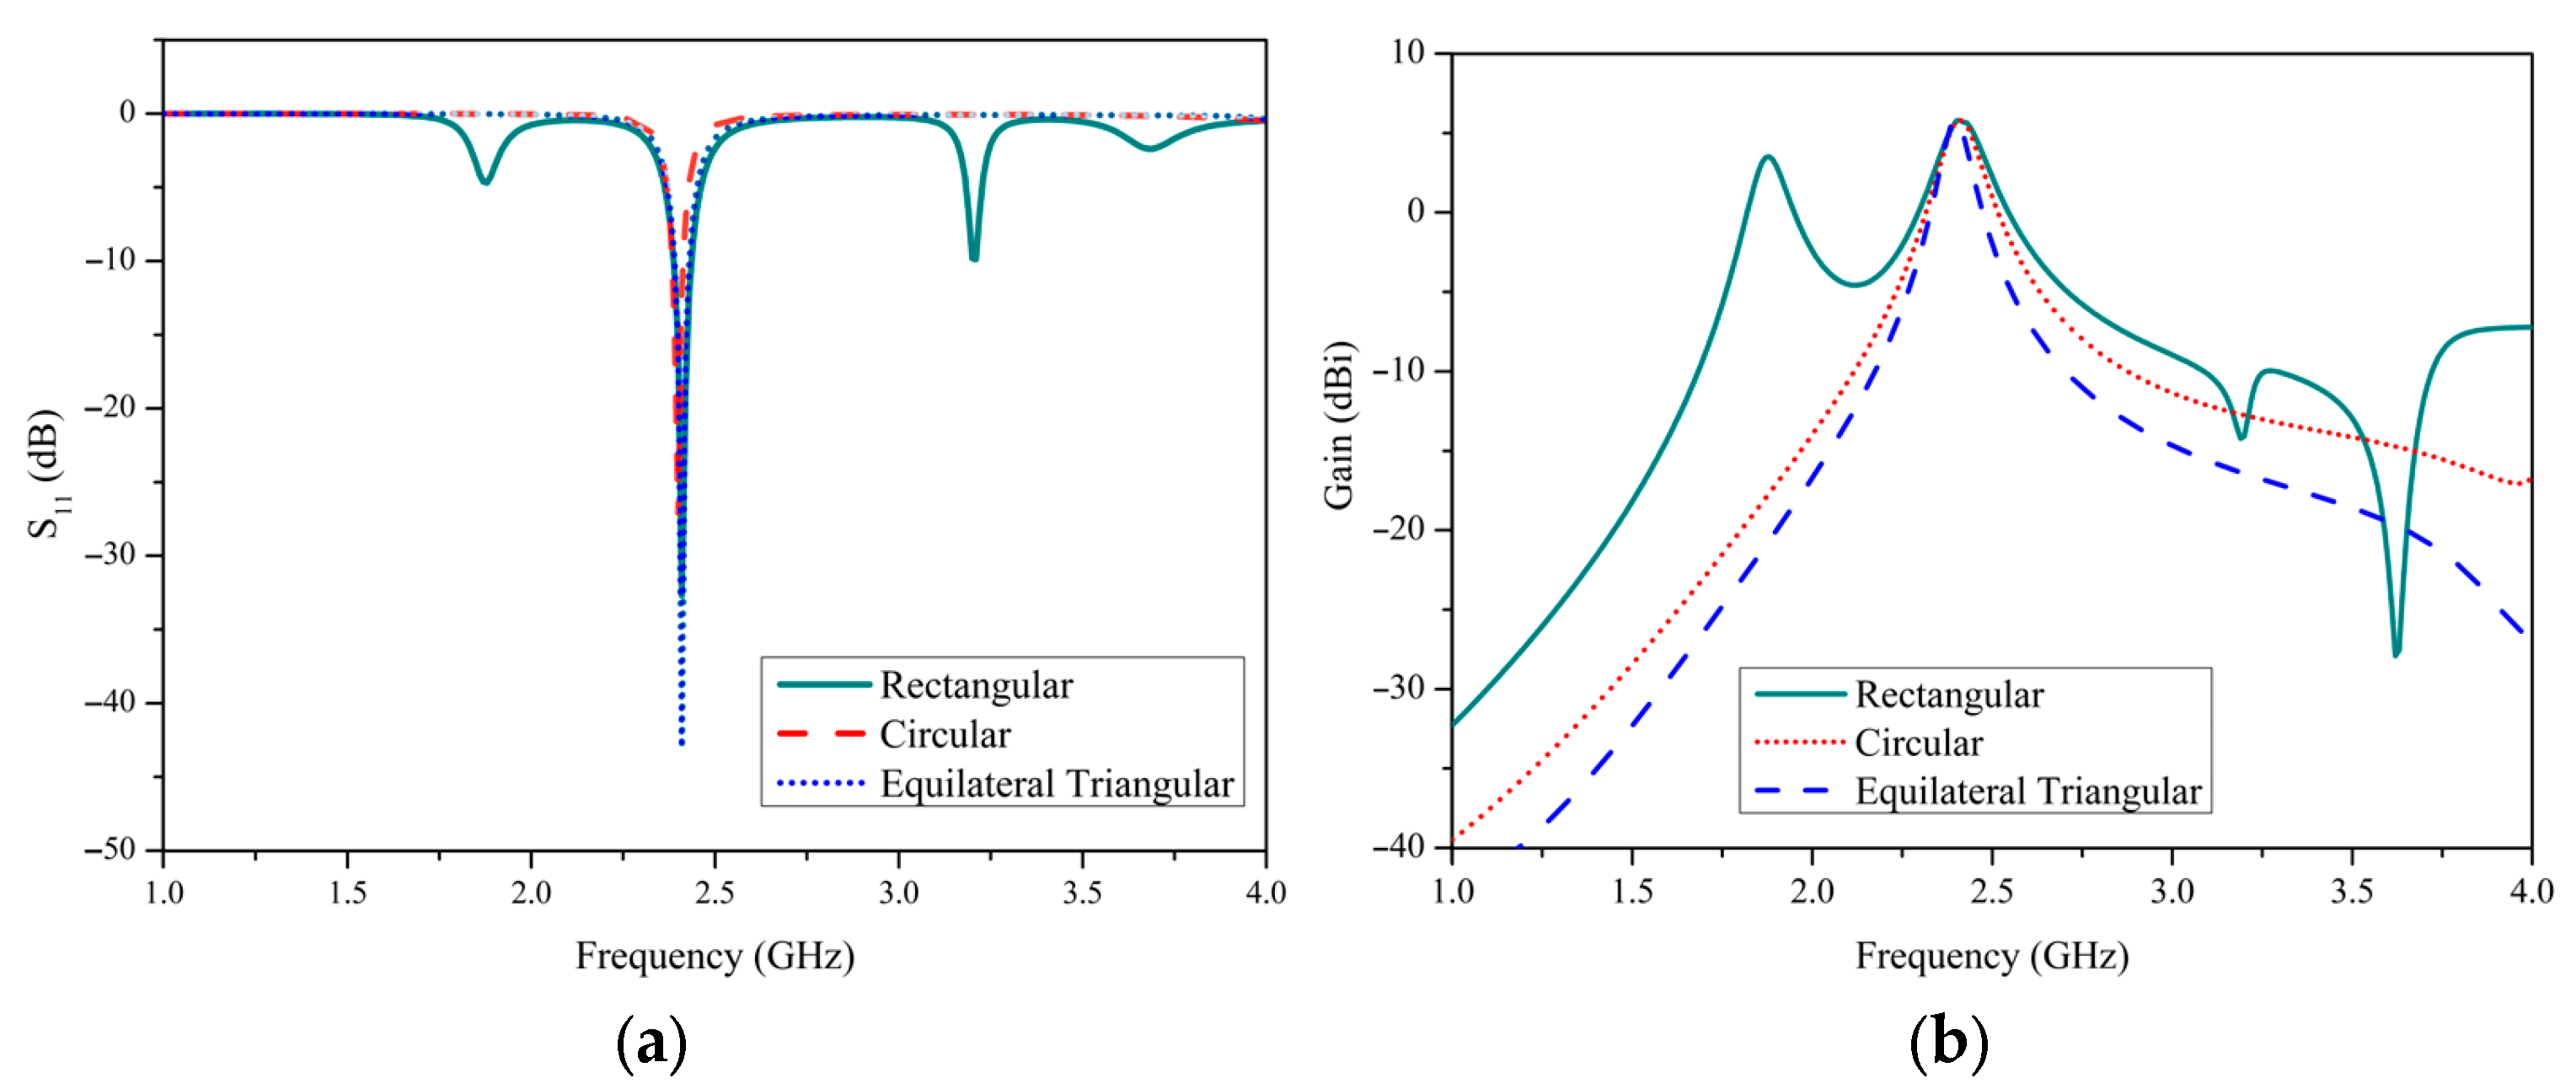
Based on the simulation results, the resonant frequency of the three patch antennas is approximately 2.4 GHz, with a bandwidth range of 31 to 48 MHz. The highest simulated gain also occurs near 2.4 GHz, as shown in
Figure 4.
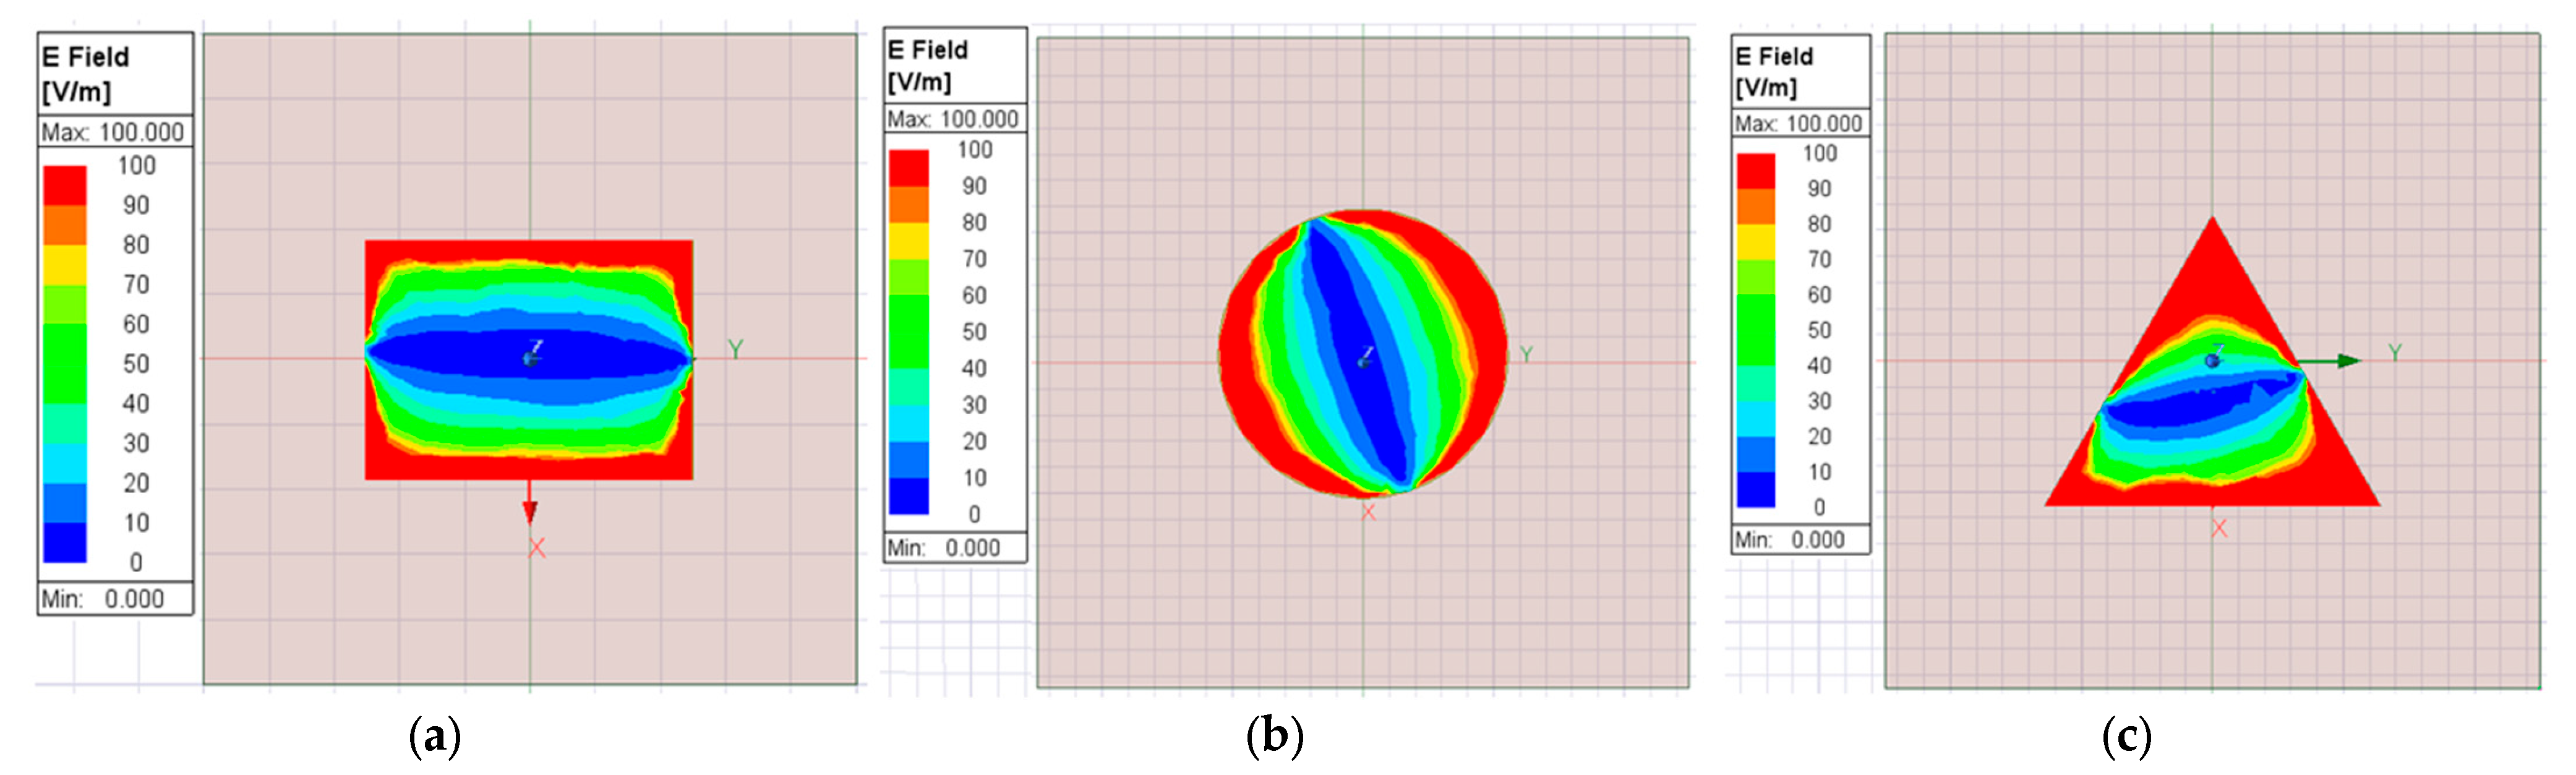
Figure 5 illustrates the simulated electric field distribution for the three sensor antennas, confirming their operation in the fundamental mode, which is transverse magnetic mode (TM mode), as supported by previous studies [
21,
22,
23]. Additionally, the maximum electric field intensity is concentrated along the edges of the equilateral triangular patch, as depicted in
Figure 5c.
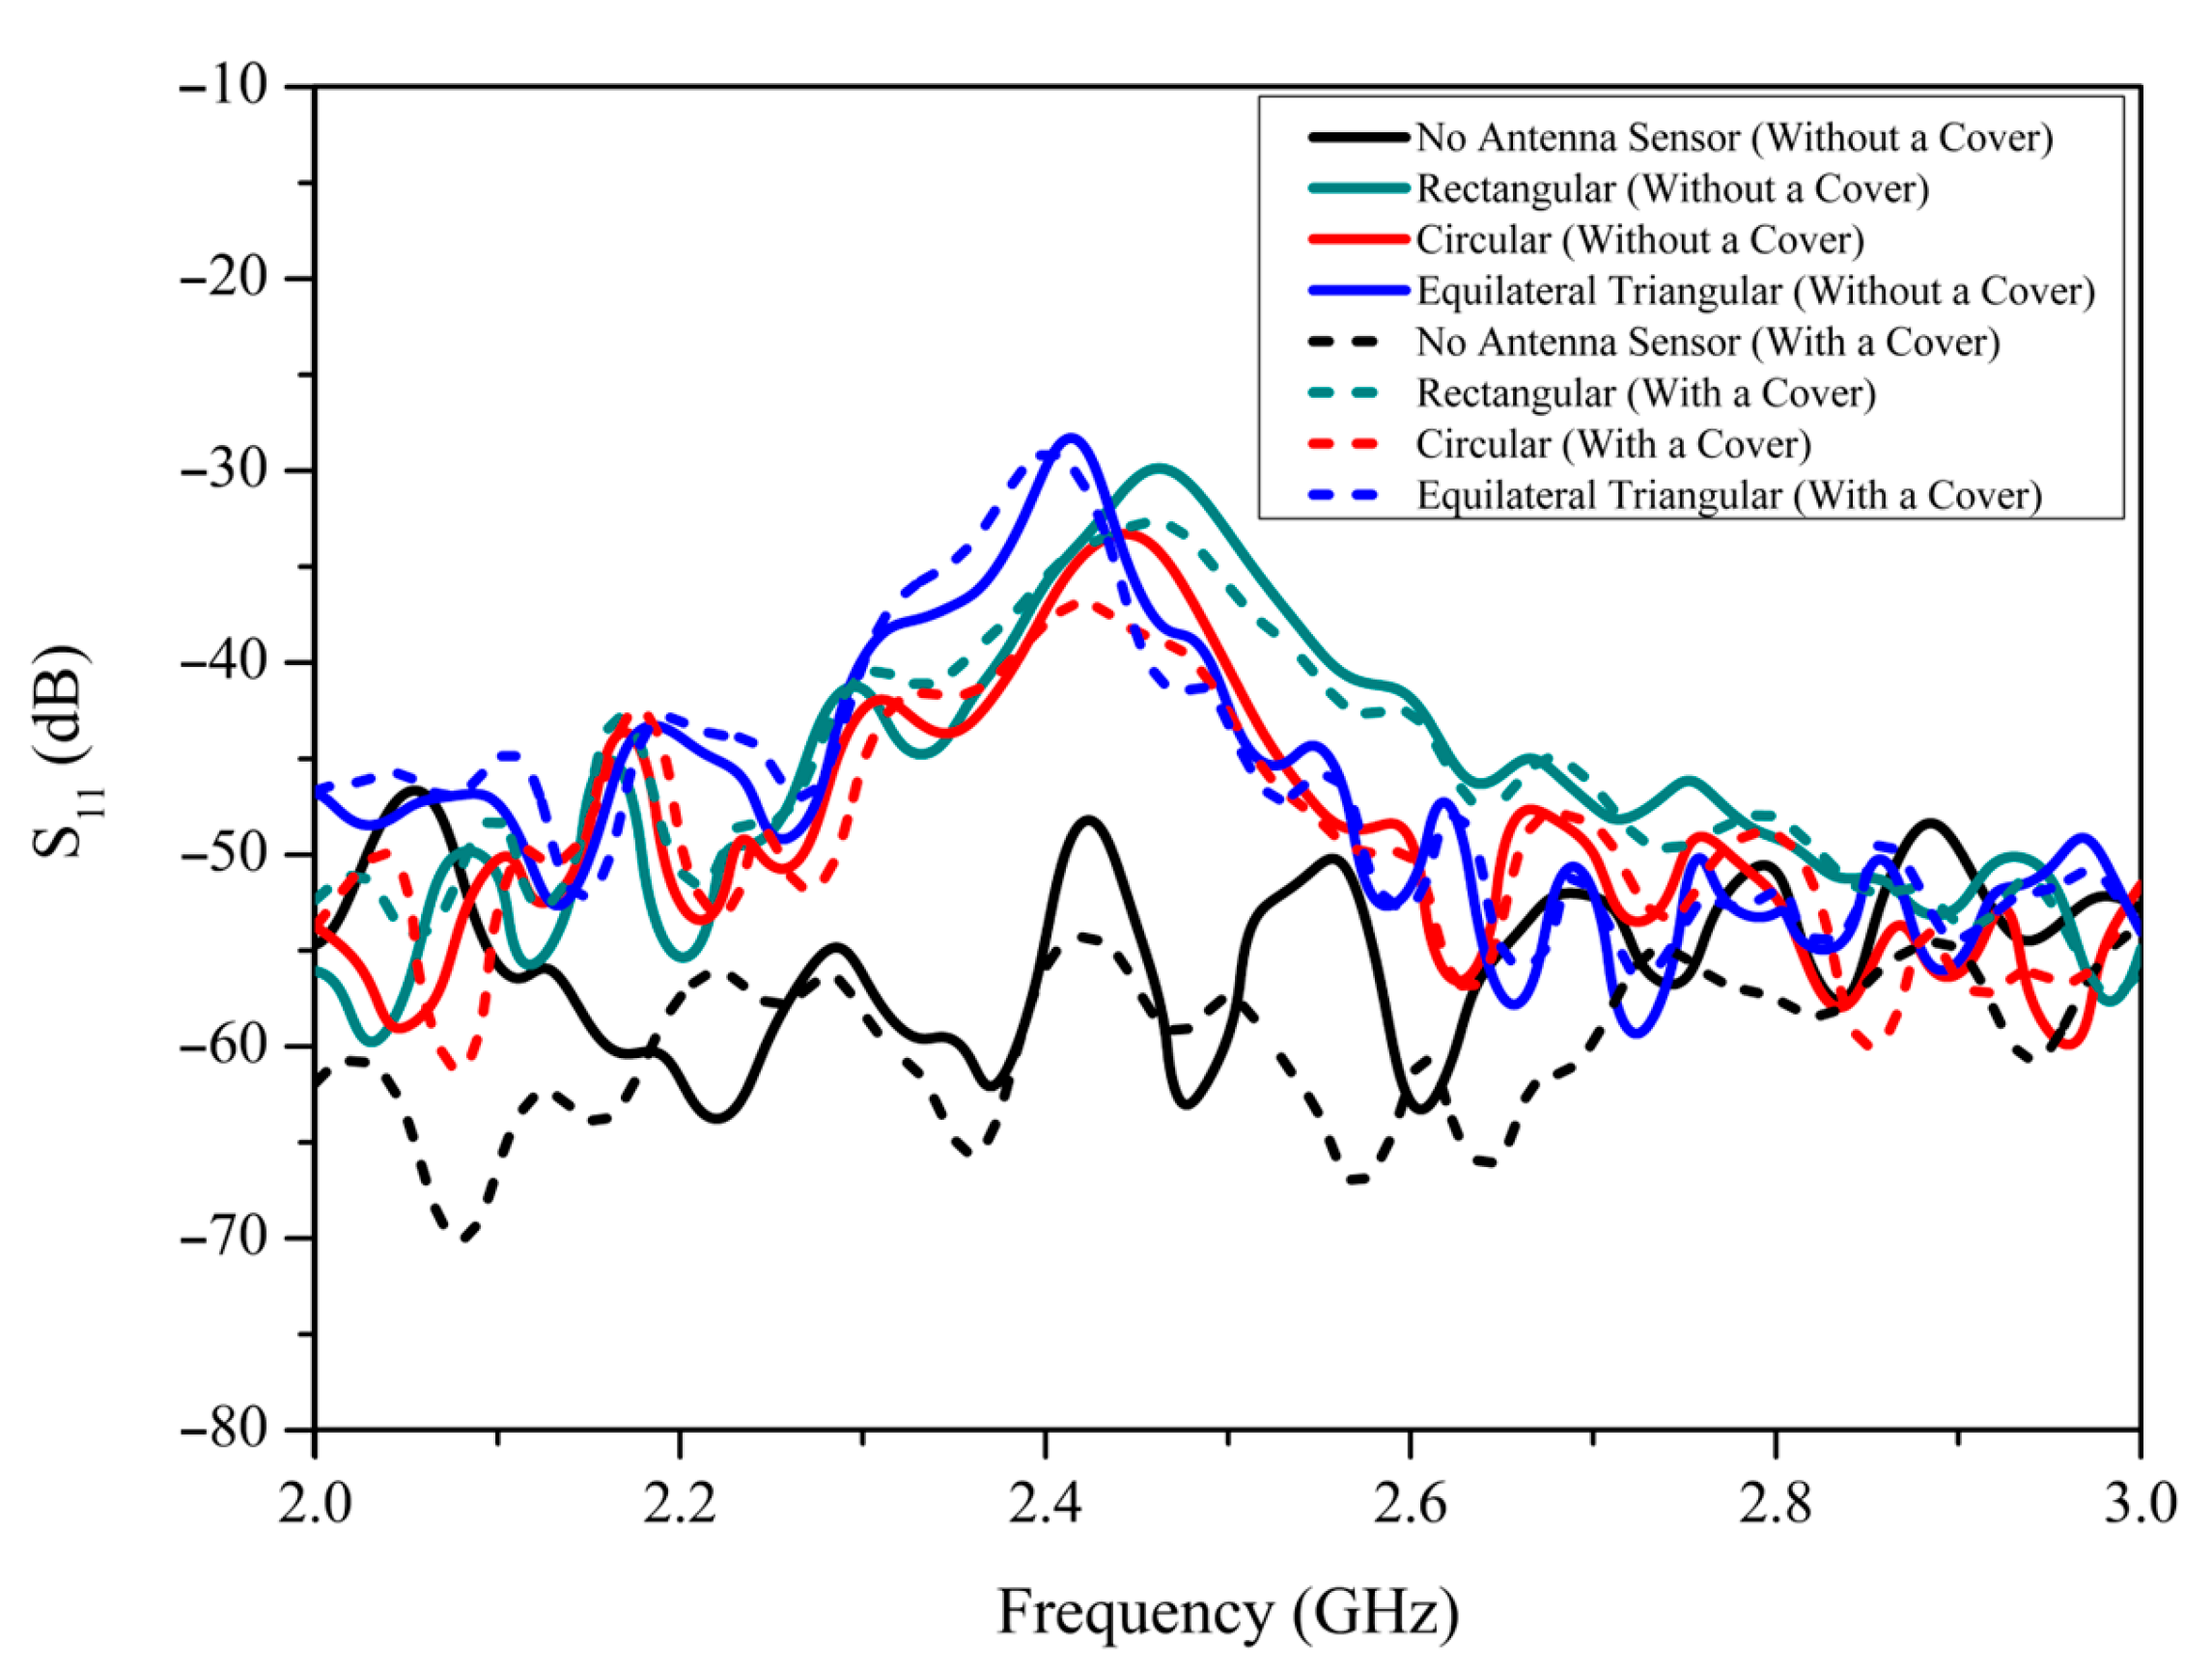
An investigation was conducted to examine the effect of placing an alumina foam thermal insulator cover between the sensor antenna and the interrogator antenna, with a fixed distance of 5 cm.
Figure 6 illustrates the difference in S
11 magnitude with and without the thermal cover. The results show that the S
11 magnitude is higher without the thermal cover compared to when the cover is present. This reduction in magnitude is attributed to the re-radiated wave from the patch antenna experiencing reflections as it passes through the thermal insulator cover. These reflections introduce additional losses, leading to a decrease in the observed S
11 magnitude [
7]. One approach to mitigate these additional losses is to utilize a low-loss dielectric material for the thermal cover, which would enhance electromagnetic wave transmission while minimizing reflection and absorption for future research directions.
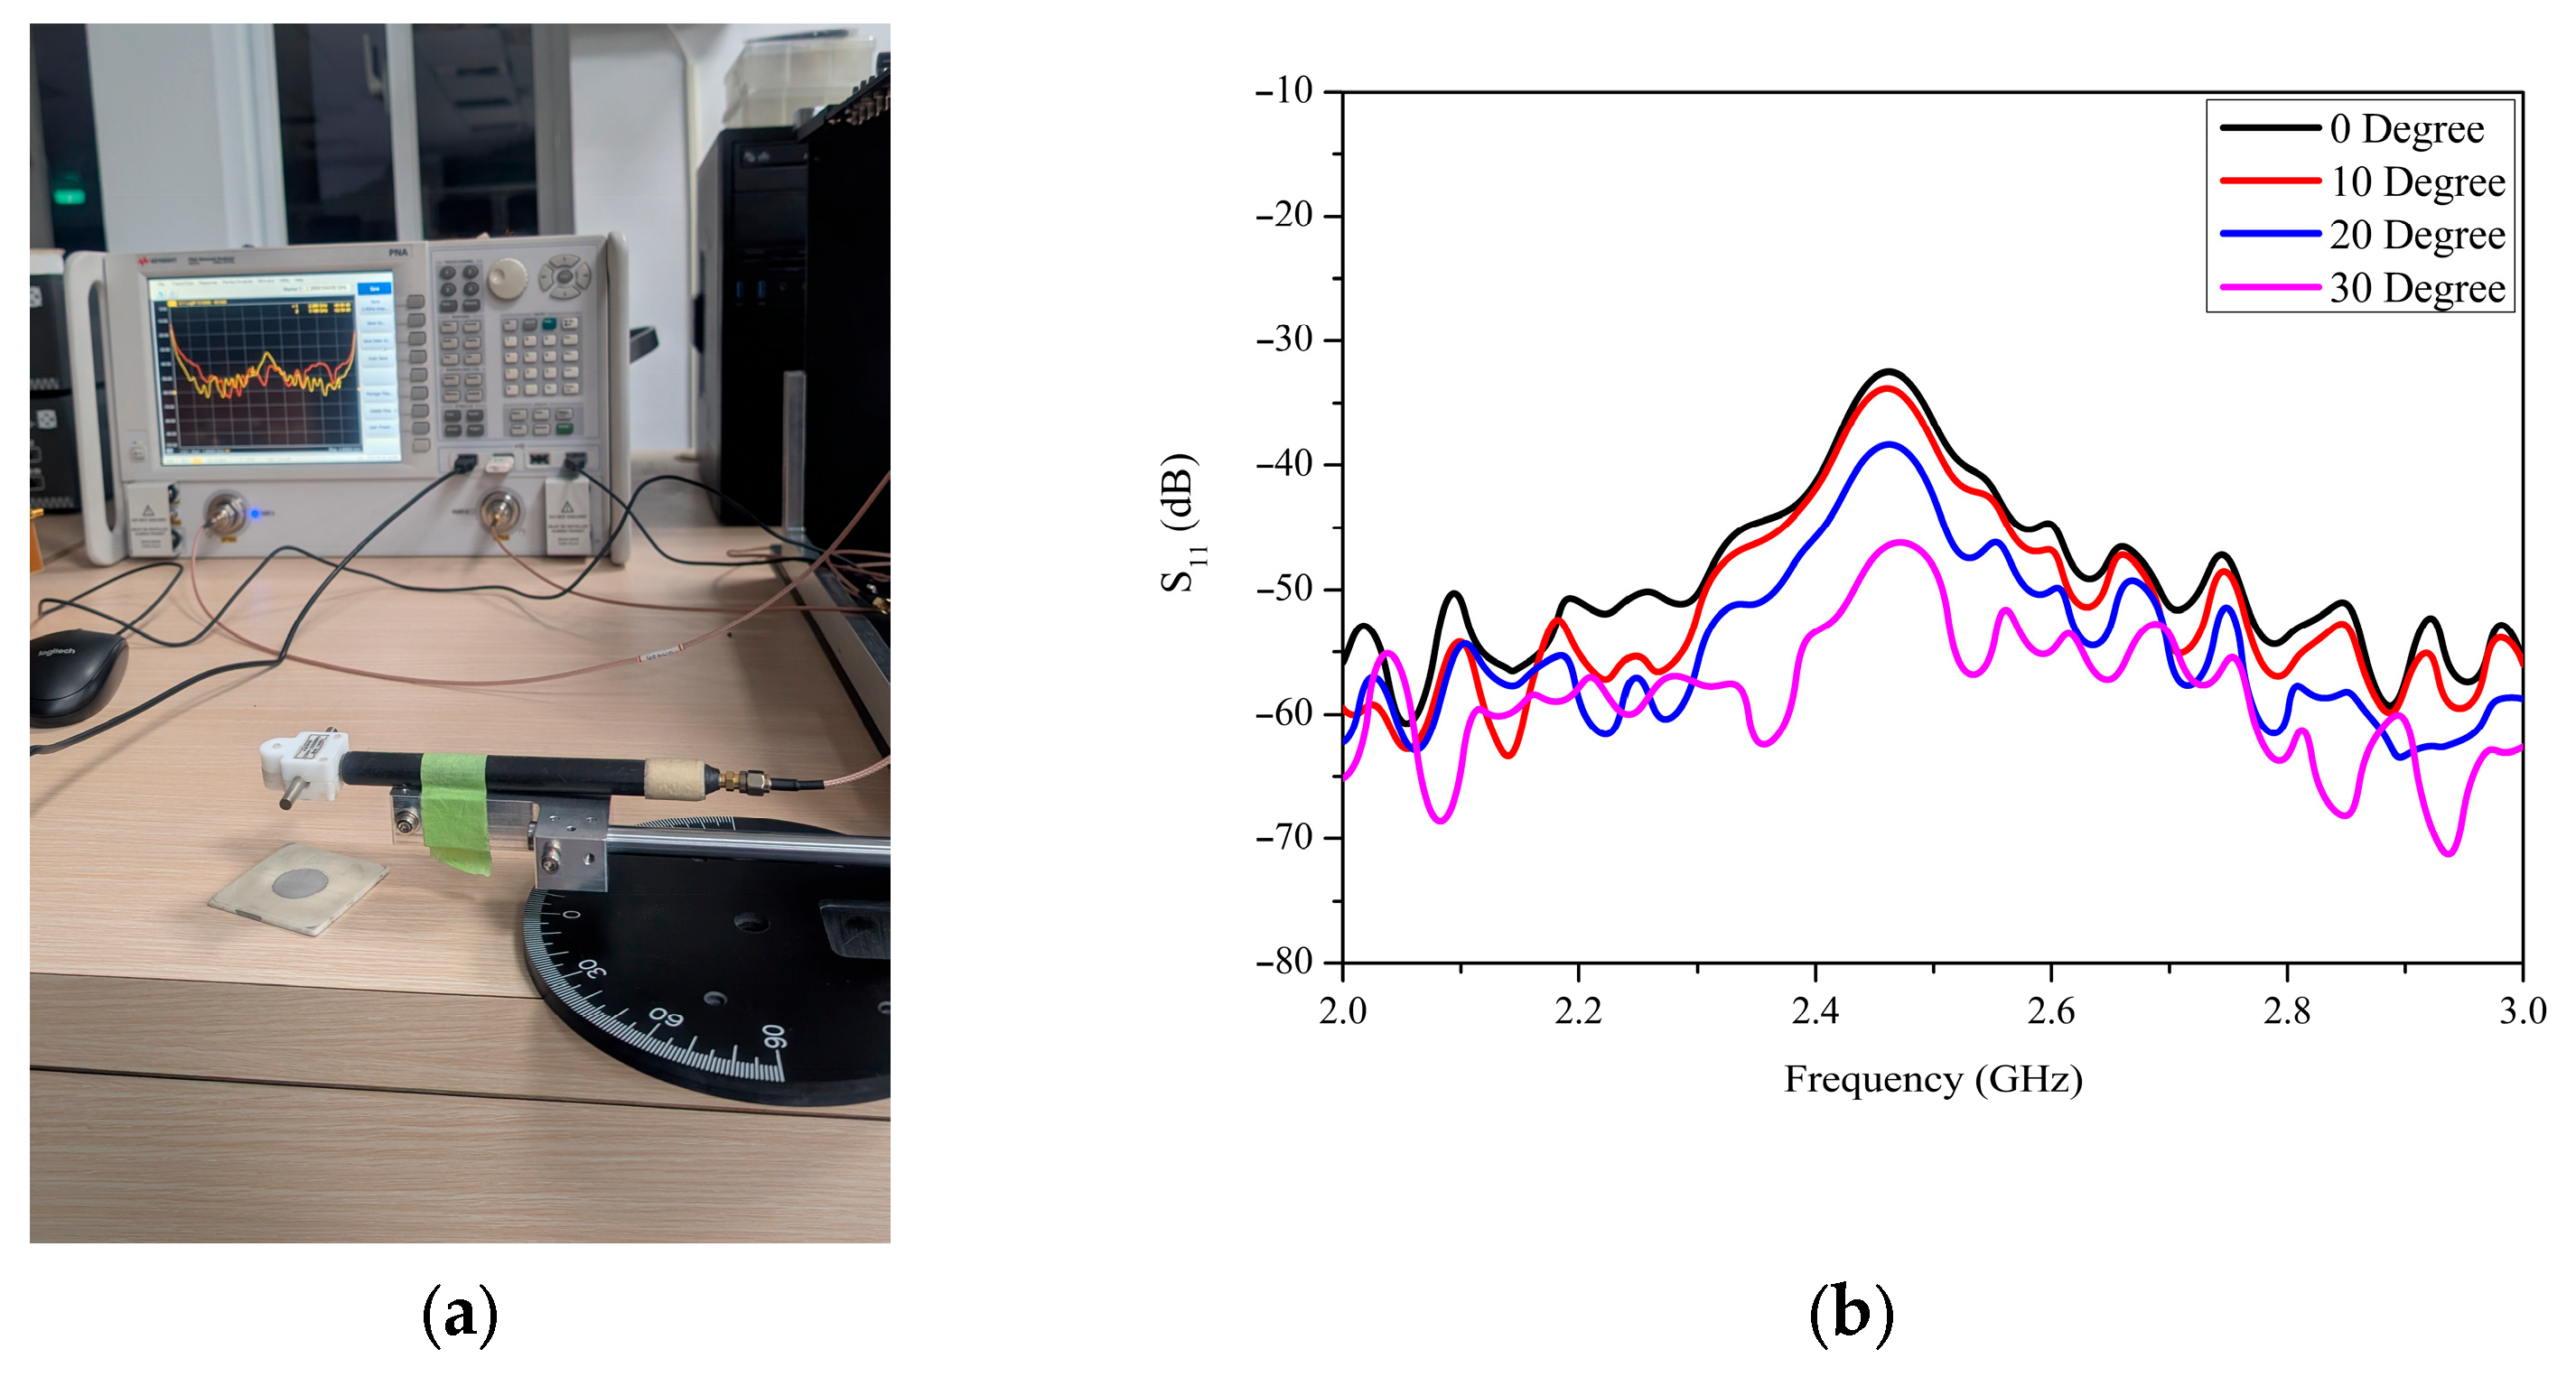
To evaluate the feasibility and reliability of this temperature monitoring system in various practical applications, the S
11 magnitude was investigated under different positioning angles of the interrogator antenna, as shown in
Figure 7a. The distance between the interrogator and sensor antennas was fixed at 5 cm, while the incident angle of the interrogator antenna varied from 0° to 30° in 10° increments.
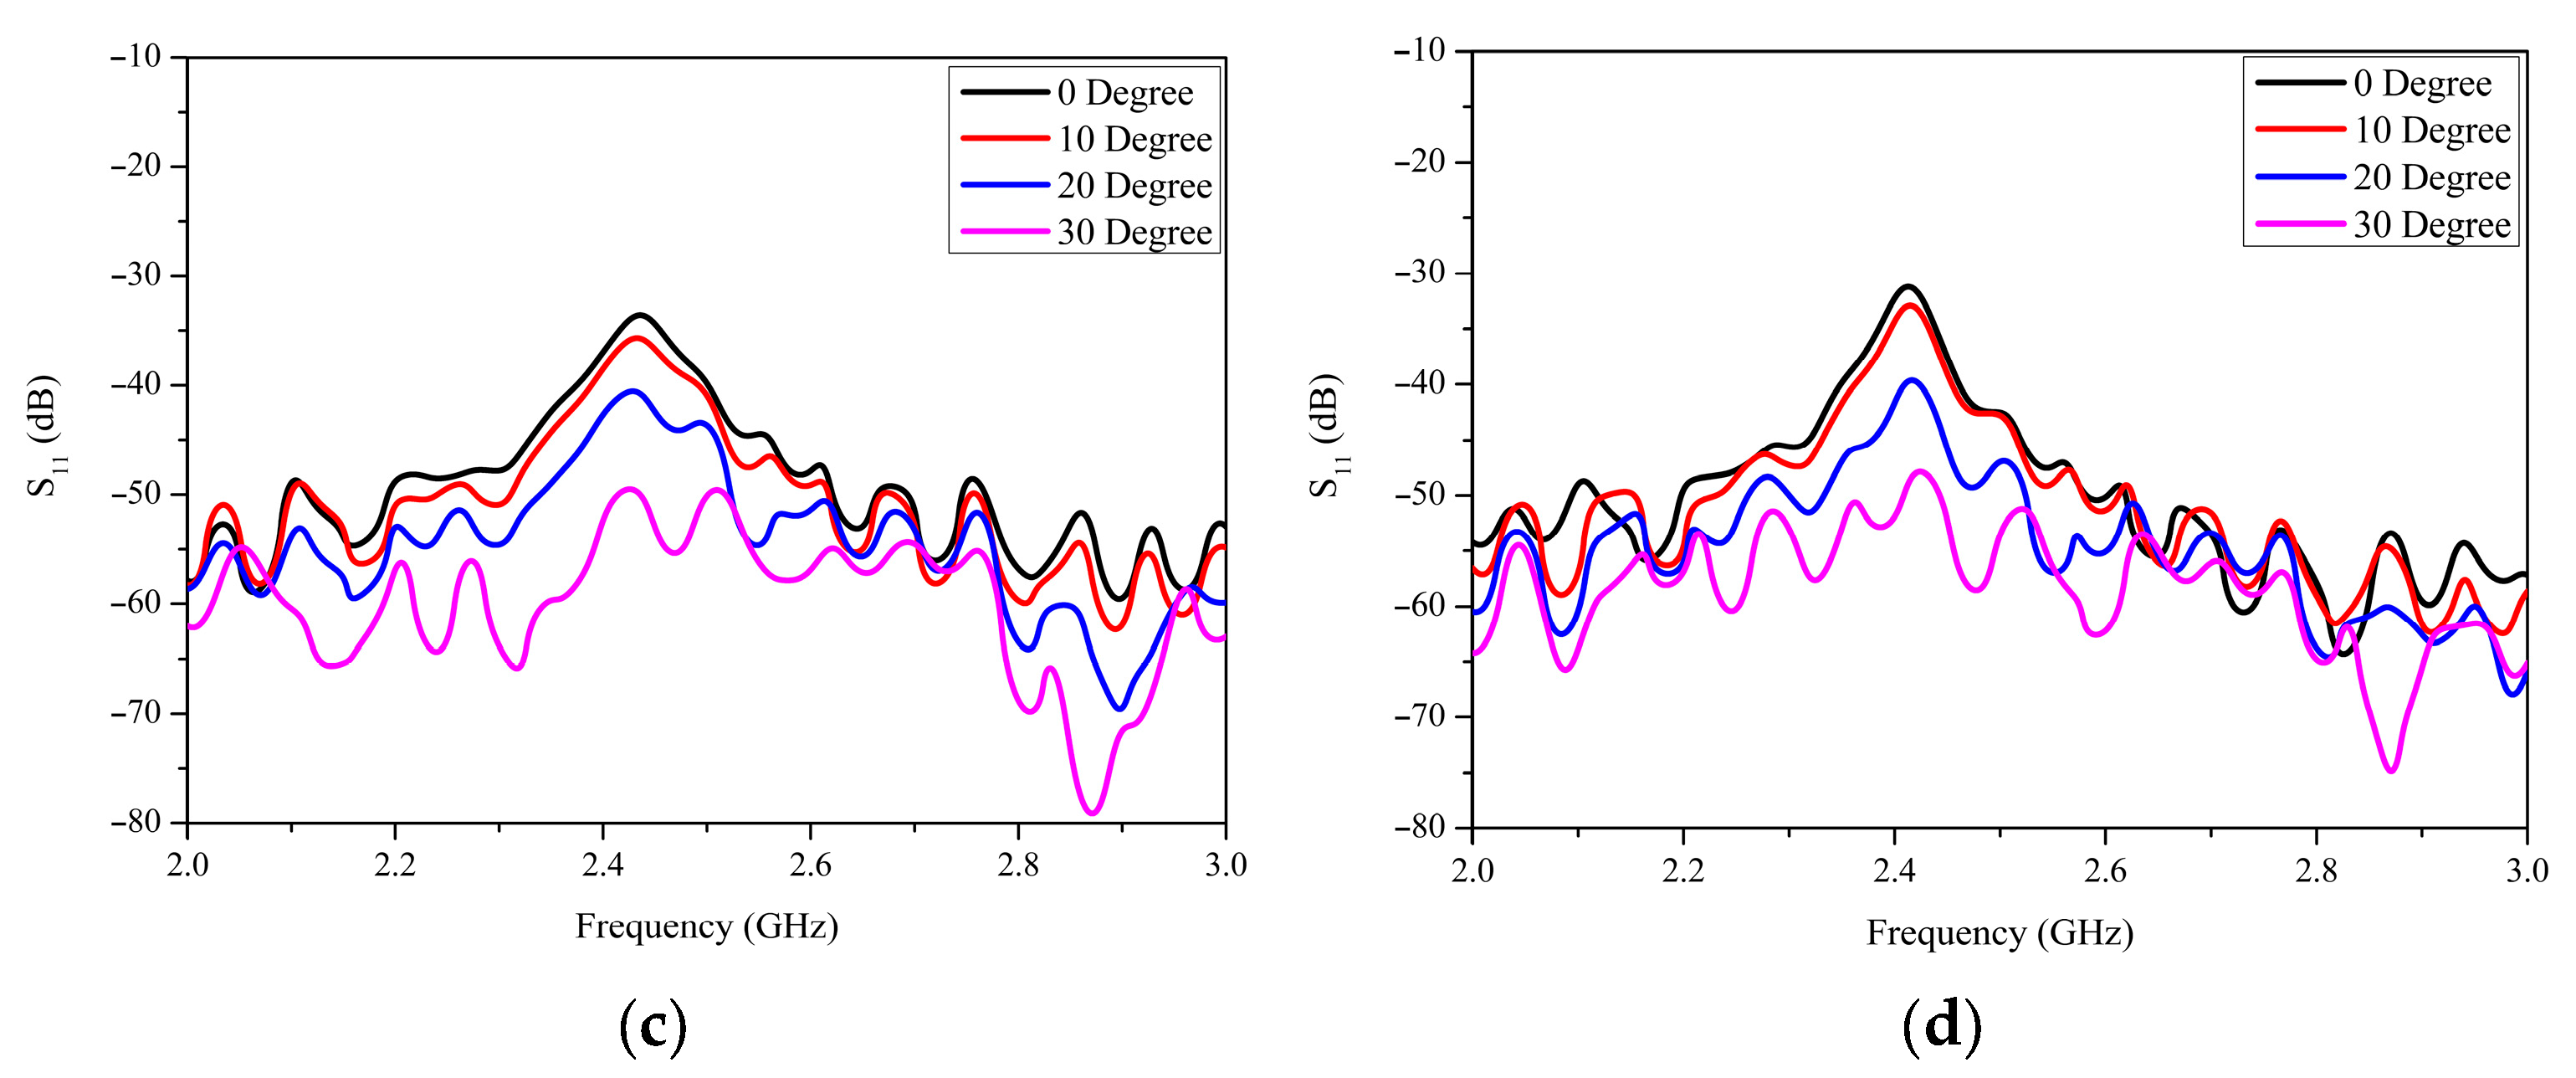
As illustrated in
Figure 7b–d, the maximum S
11 magnitude was observed at the 0° incident angle, where the interrogator antenna is directly facing the sensor antenna, achieving optimal polarization matching. At 10° and 20° incident angles, the S
11 peak was still detectable, indicating acceptable power transfer. However, at 30°, a significant degradation in S
11 magnitude was observed across all three patch shapes, indicating reduced power transfer efficiency and insufficient coupling energy between the interrogator and sensor antennas.
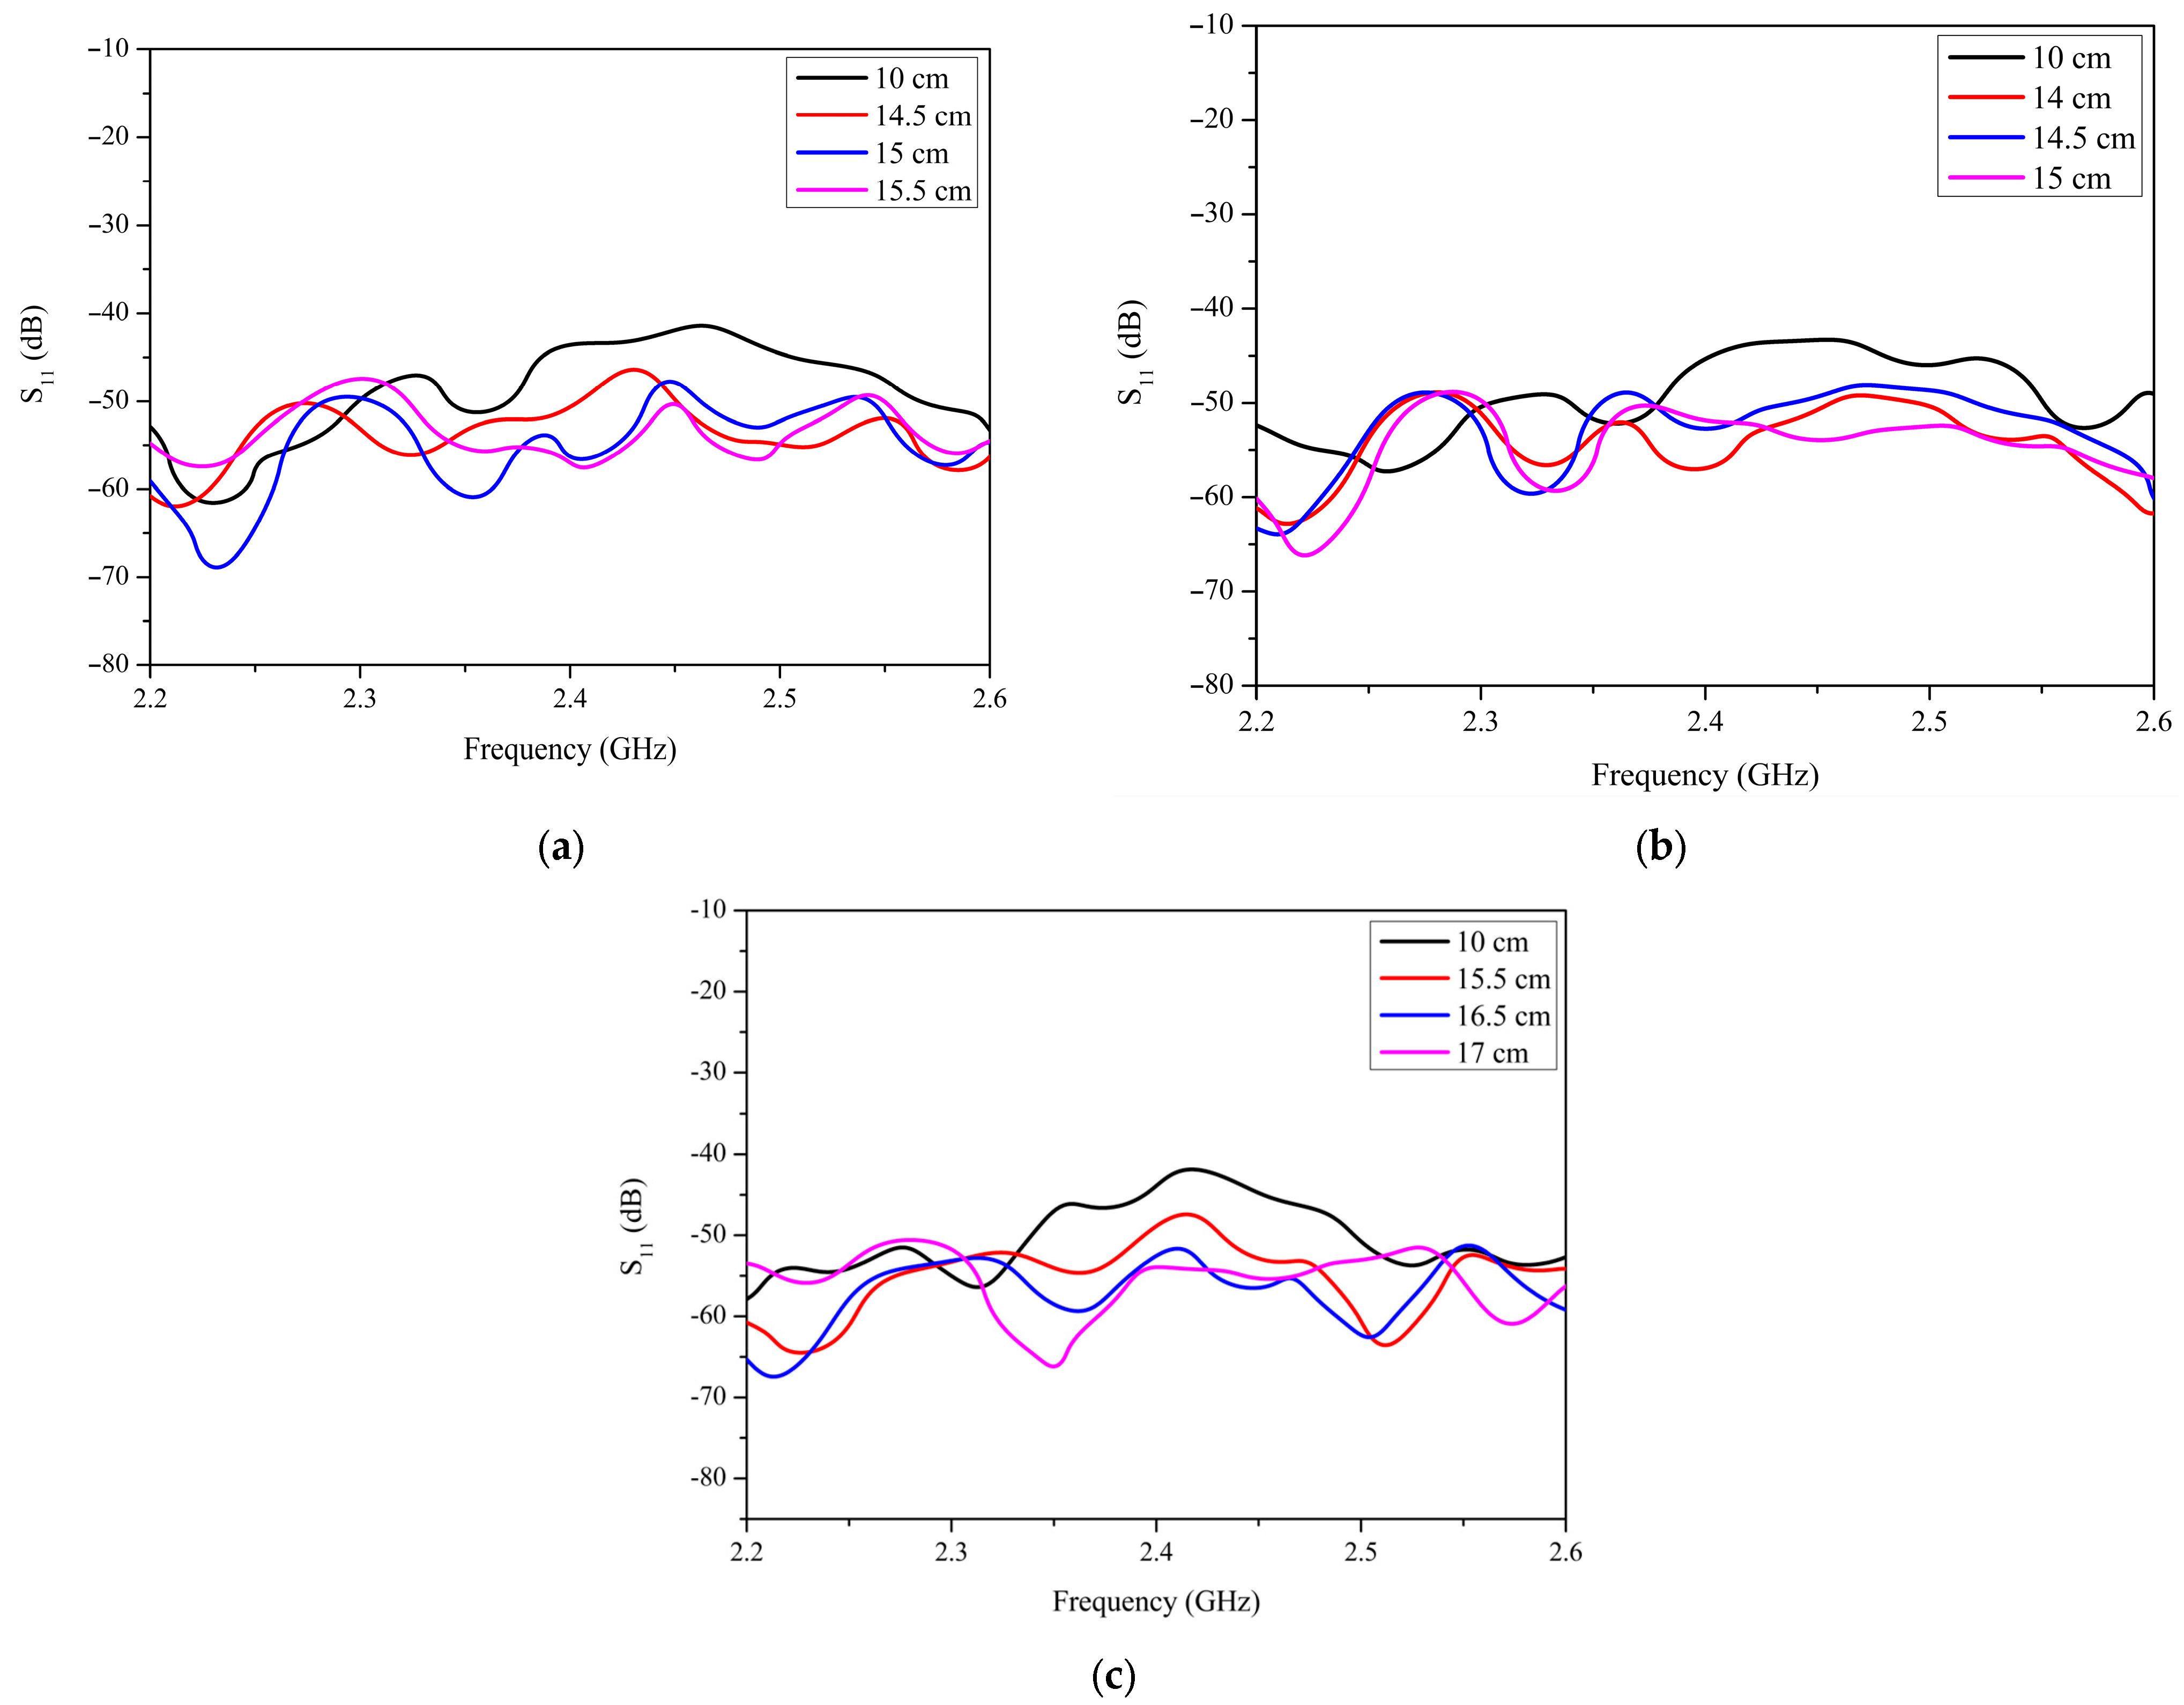
Figure 8 illustrates the maximum communication distance measurements for each sensor antenna. As the distance between the interrogator and sensor antennas increased, the S
11 peak magnitude decreased significantly until it became completely damped, indicating the limit of detectable communication. Based on these observations, the maximum communication distance for the equilateral triangular patch antenna was determined to be 16.5 cm, as its S
11 peak remains detectable at this range but becomes indistinguishable from background noise at 17 cm. In comparison, the rectangular and circular antennas exhibited maximum communication distances of 15 cm and 14.5 cm, respectively.
Another observed phenomenon was the resonant frequency shift caused by the increasing distance between the antennas. The rectangular and circular patch antennas exhibited noticeable frequency shifts, highlighting their sensitivity to positional changes. In contrast, the equilateral triangular patch antenna maintained a relatively stable resonant frequency at approximately 2.42 GHz. This stability is attributed to its unique geometric and electromagnetic properties, which improve impedance matching and reduce susceptibility to distance-related variations.
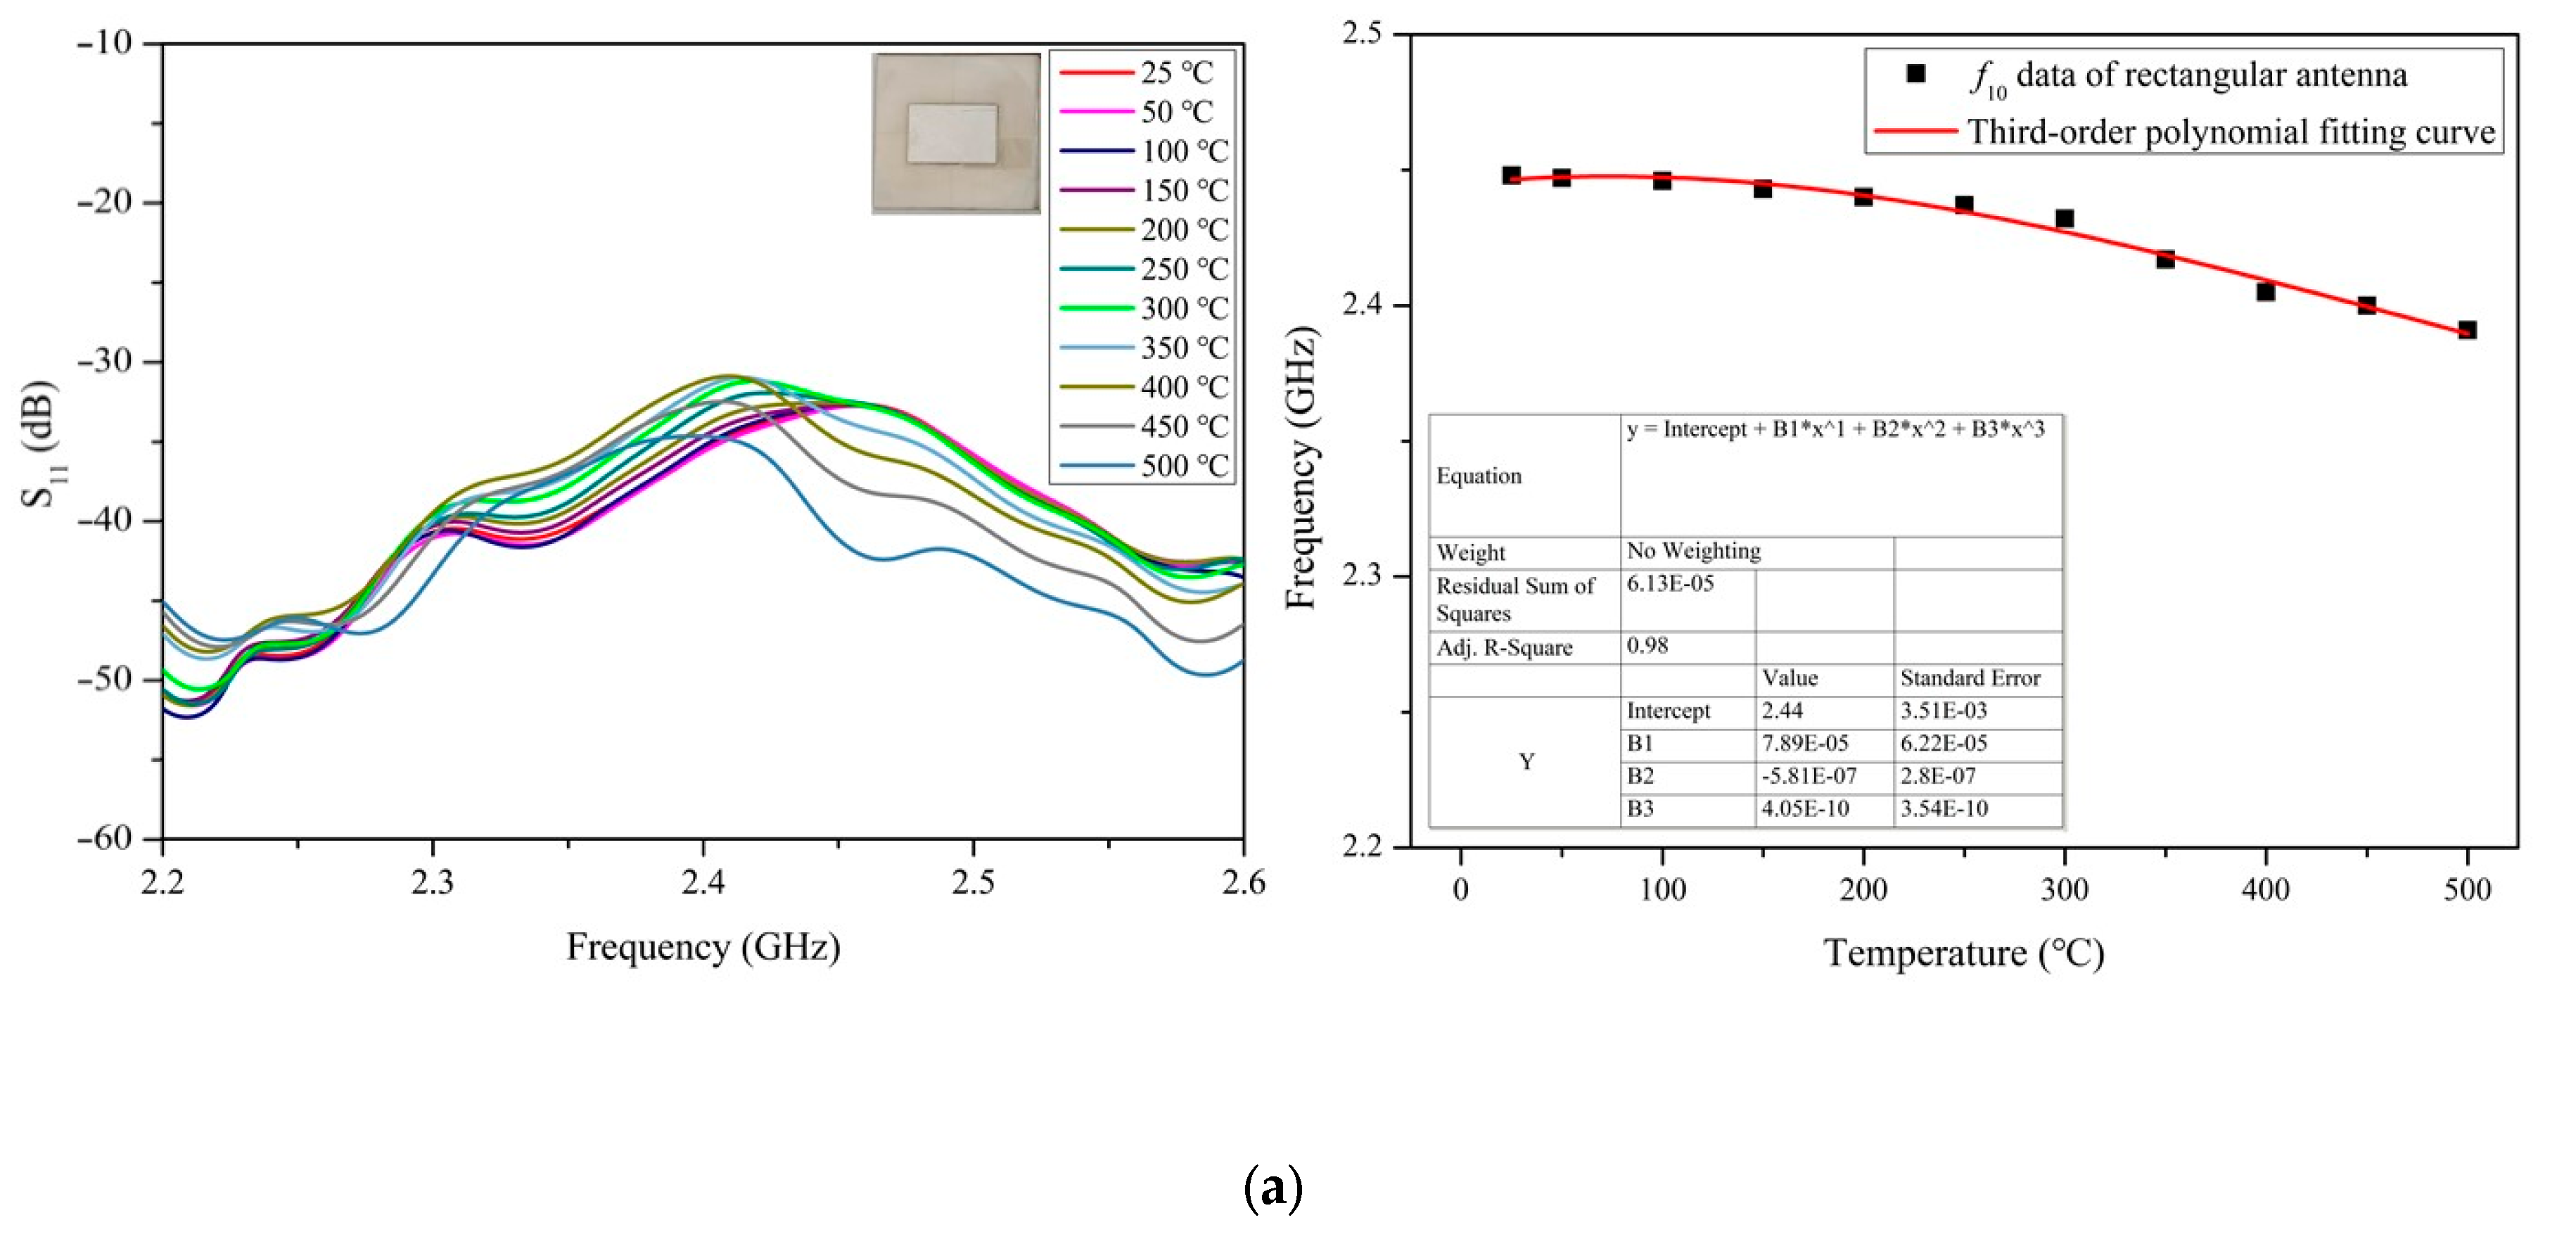
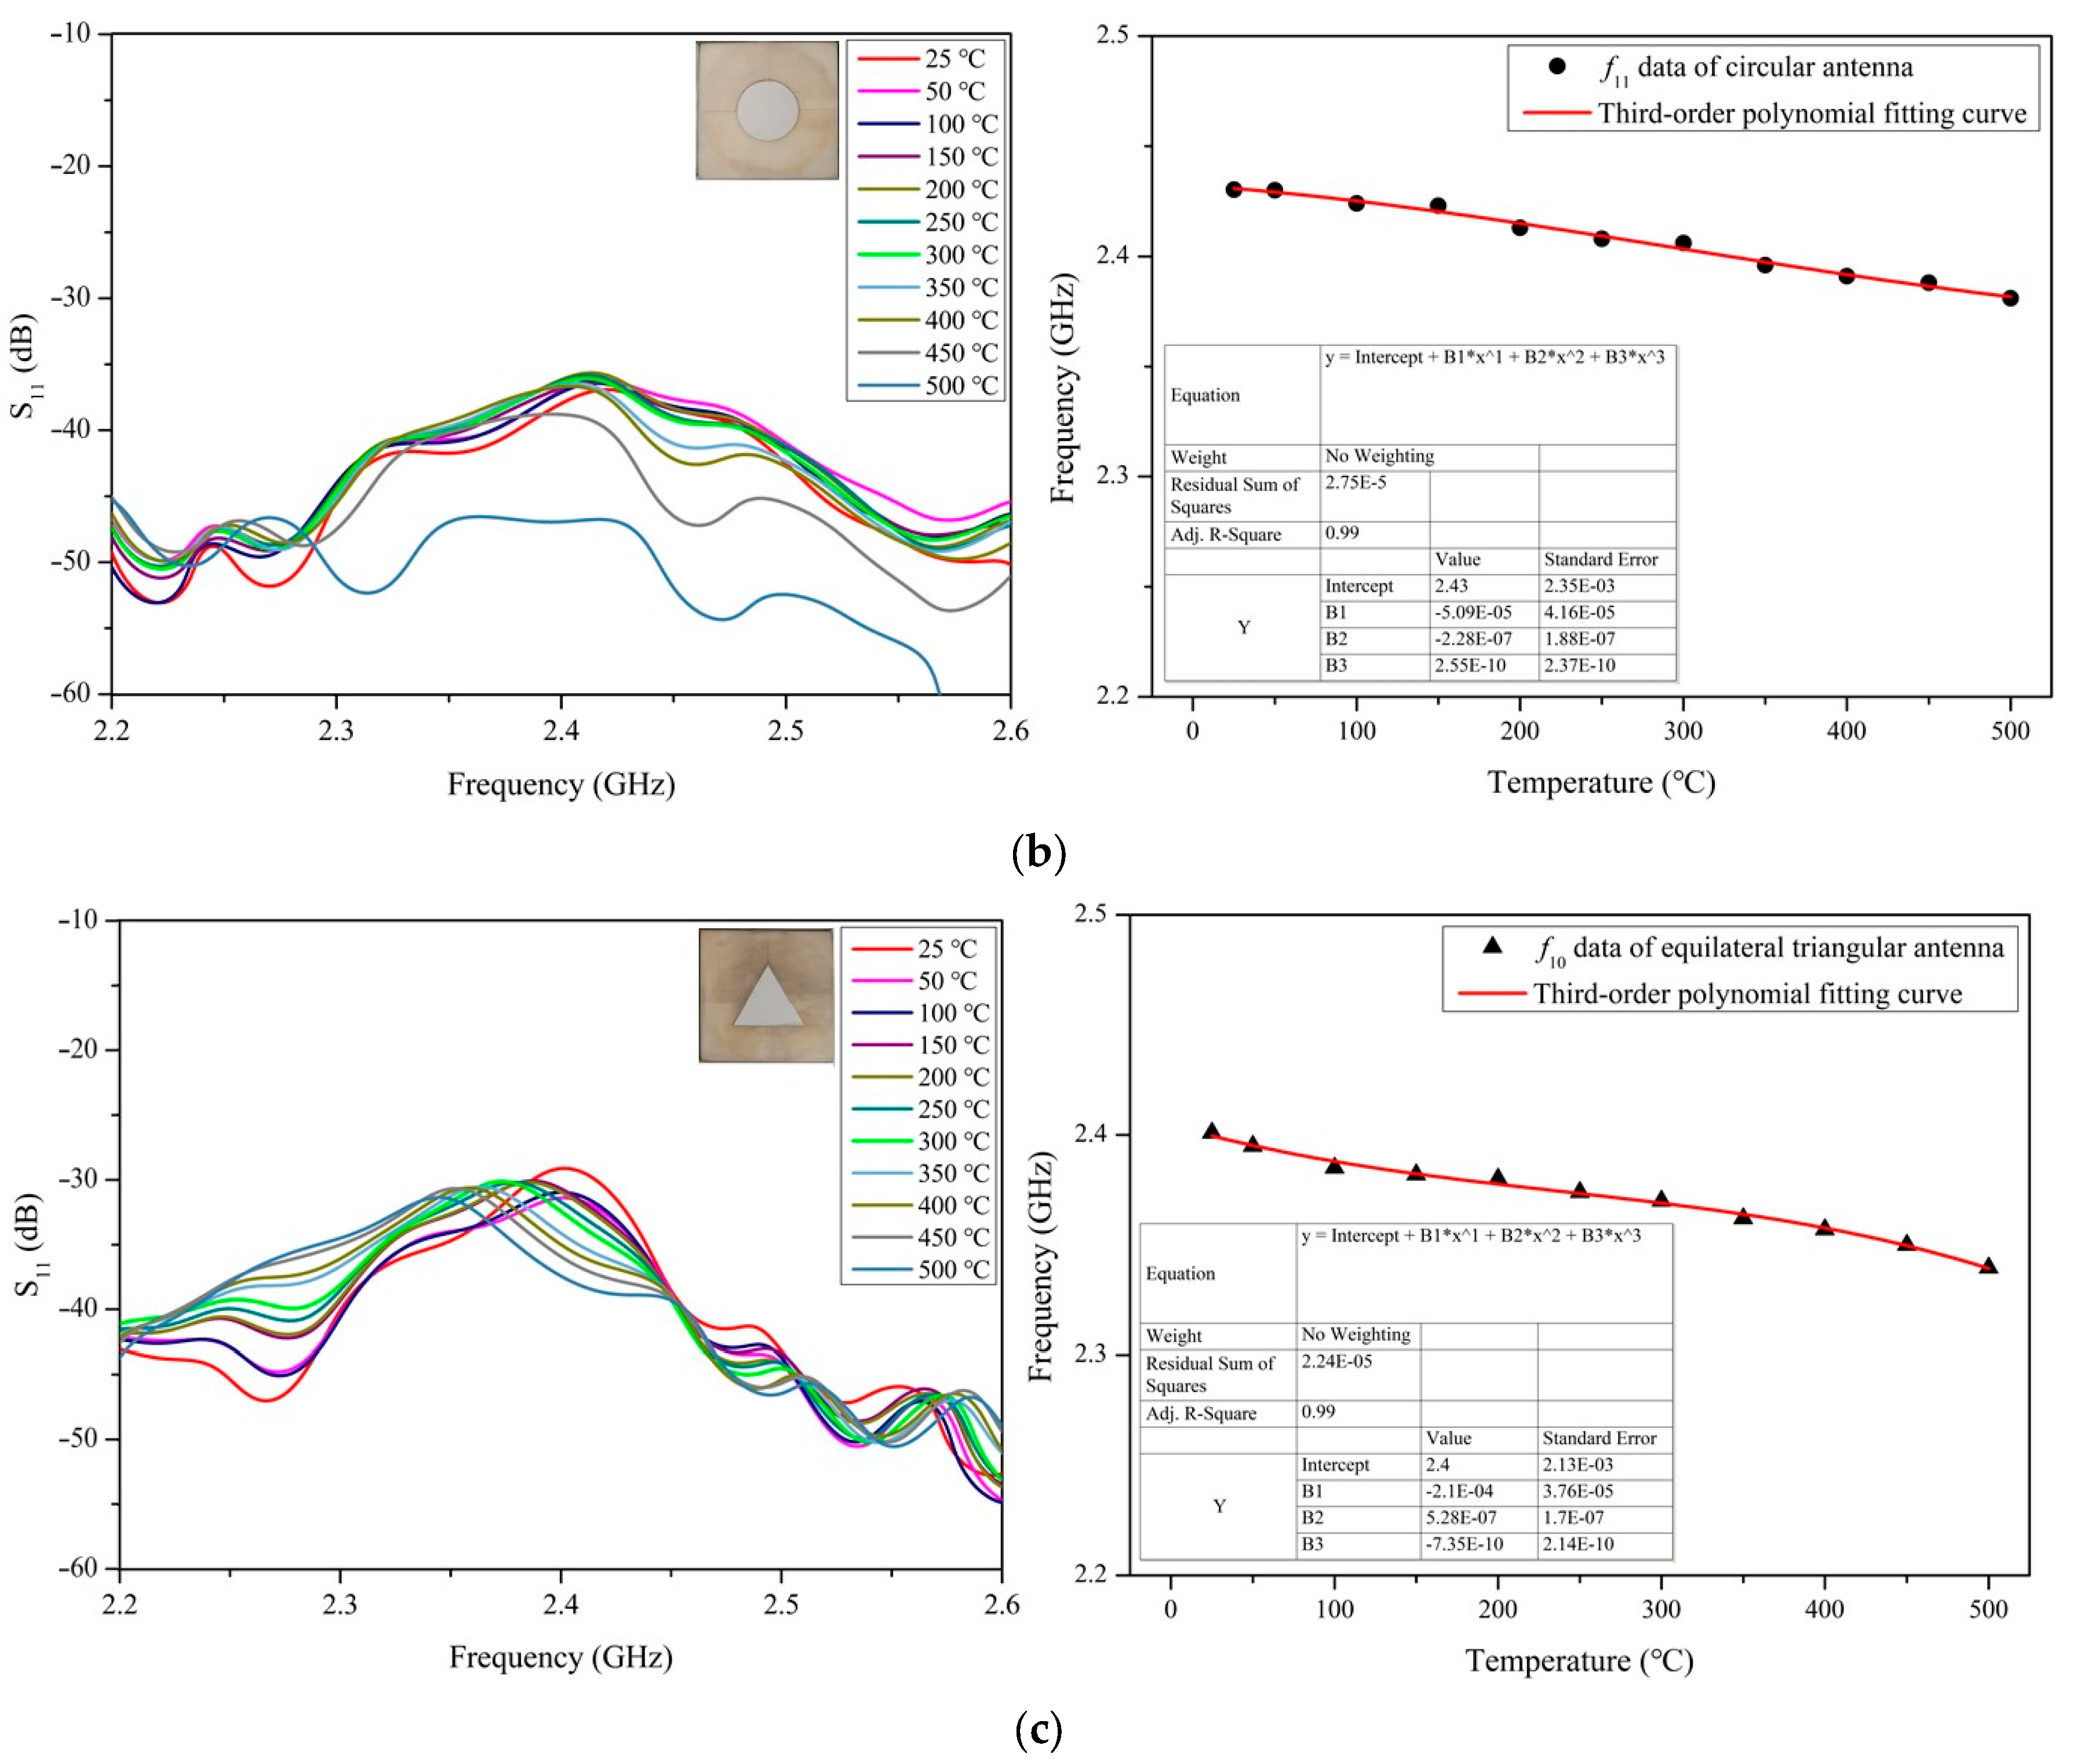
According to the results shown in
Figure 9, the S
11 magnitude for all antenna shapes fluctuated within the initial temperature range of 25 to 150 °C and decreased steadily as the temperature rises from 200 to 500 °C. Among the designs, the circular patch antenna exhibited the lowest S
11 peak, as shown in
Figure 9b. Additionally, its backscattering signal became unstable at elevated temperatures, deteriorating significantly as the temperature reached 500 °C. In contrast, the equilateral triangular patch antenna maintained the most stable S
11 magnitude across all temperatures, with its resonant frequency shifting from 2.4009 GHz (25 °C) to 2.3396 GHz (500 °C), as shown in
Figure 9c. The application of third-order polynomial fitting to the frequency shift data as a function of increasing temperature demonstrates a high degree of accuracy, with an R
2 value ranging from 0.98 to 0.99, indicating a strong correlation between temperature variation and frequency response.
According to the key performance results summarized in
Table 2, the equilateral triangular patch antenna demonstrated superior performance, achieving a maximum communication distance of 16.5 cm and a sensitivity of 0.129 MHz/°C. Among the tested designs, it exhibited the highest simulated gain, resulting in the greatest communication range. Simulation results in
Figure 5 showed that the equilateral triangular shape concentrated the electric field more strongly along its edges compared to the other designs. In contrast, the circular patch antenna, lacking sharp edges, displayed a more uniform but weaker electric field distribution. This behavior aligns with the established principle that electric fields tend to concentrate at sharp edges or regions of high curvature, where increased surface charge density generates a stronger electric field [
24]. A stronger electric field enhances the sensor’s ability to efficiently receive coupling energy from the interrogator antenna at its resonant frequency, leading to a more stable antenna backscattering signal that is reflected back to the interrogator antenna.
While sensitivity variation among the designs was minimal due to the dominant influence of dielectric substrate properties, the choice of substrate material plays a critical role [
12]. However, signal stability under temperature variations was significantly impacted by the antenna shape, with the equilateral triangular design proving to be the most reliable.
6. Conclusions
This study focused on the design and analysis of three patch antenna shapes for wireless passive temperature sensor applications. The process involved theoretical calculations, simulations using HFSS in Ansys Electromagnetic Suite® 2023 R1(Ansys Inc., Canonsburg, PA, USA), and fabrication with an alumina substrate and silver conductive paste. Each sensor dimension was 50 × 50 × 2.45 mm, making it practical for real-world implementation in applications such as industrial furnaces, bearing housings in engines, and nuclear reactors for early safety detection and hardware degradation prevention.
Performance was evaluated through communication distance and sensitivity measurements over a temperature range of 25 to 500 °C, with increments of 50 °C at a fixed distance of 5 cm, which satisfies the far-field condition for both antennas. The equilateral triangular patch antenna demonstrated superior performance, achieving the maximum communication distance of 16.5 cm and a sensitivity of 0.129 MHz/°C. Its sharp edges concentrated the electric field, enabling efficient power transfer from the interrogator antenna, resulting in better stability of the backscattering signal. Additionally, the equilateral triangular antenna achieved the highest simulated gain of 5.84 dBi at 2.4 GHz. In contrast, the circular patch antenna exhibited the weakest performance due to its uniform electric field distribution, leading to reduced backscattering signal strength, particularly in high-temperature environments.
The design of the sensor antenna is critical as it functions as both a sensing and communication component. For sensing, it requires substrate and conductor materials capable of withstanding harsh environments. For communication, the sensor antenna’s frequency must align with the interrogator’s resonant frequency and operate within a narrow bandwidth to lower the uncertainty of measurement, which in turn allows for a wider measurable temperature and maximize gain to ensure reliable wireless communication. A poorly designed antenna can weaken backscattered signals and compromise the sensor’s functionality. Beyond the sensor antenna design, another crucial factor is the selection of the thermal cover material. It is recommended to use a low-loss material to maintain communication efficiency while ensuring low thermal conductivity to provide effective heat isolation. This combination is essential for establishing a safe and reliable temperature monitoring system in harsh environments.
These findings underscore the vital role of antenna design in optimizing wireless passive temperature sensor systems. With its compact size, reliable performance without the need for local power, and simple design and installation, the equilateral triangular sensor antenna is a promising candidate for harsh environment applications. Future improvements could involve manufacturing the interrogator antenna using high-temperature-resistant materials to ensure its reliability in harsh environments, along with a broader bandwidth design to enhance temperature monitoring by capturing a wider range of frequency shifts.


