Article

Verification of the Scots Pine (Pinus sylvestris L.) Crown Length Model

1
Institute of Biology, Faculty of Natural and Technical Sciences, University of Opole, Oleska 22, 45-052 Opole, Poland
2
Institute of Environmental Engineering and Biotechnology, Faculty of Natural and Technical Sciences, University of Opole, Kominka 6A, 45-032 Opole, Poland
3
Department of Technology, Faculty of Natural Sciences, Matej Bel University, 974 01 Banská Bystrica, Slovakia
*
Authors to whom correspondence should be addressed.
Appl. Sci. 2025, 15(6), 3124; https://doi.org/10.3390/app15063124
Submission received: 6 February 2025 / Revised: 4 March 2025 / Accepted: 11 March 2025 / Published: 13 March 2025
(This article belongs to the Special Issue Advances in Wood Processing Technology: 2nd Edition)

Abstract

:
One of the key modeling procedures is model verification, which ensures its reliability and confidence. In many respects, the length of the crown is an interesting biophysical property. Precise determination of crown length can be one of the components used in estimating the mass of needles or leaf area index (LAI), and consequently the amount of transpiration or the amount of carbon dioxide bound, which is crucial in the context of climate change. The objective of this study was to calculate the length of the crown Pinus sylvestris using an allometric model and to compare these results with the actual ones to establish the degree of discrepancy. The model that was tested was based on three predictor variables, i.e., diameter at breast height, tree height, and stand density index. The verification was carried out using empirical data collected for 300 sample trees on 20 experimental plots located in south-western Poland. All the stands were pine monocultures located in the habitats of fresh or mixed fresh forest aged from 28 to 40 years. The studied stands differed in terms of diameter at breast height, height, and density (0.68–1.81). The comparison between empirical ( C L e m p ) and calculated ( C L c a l ) mean crown lengths in the stand using the model was expressed by the correlation coefficient’, which was R = 0.955, with a divergence (±) of 4.57%. The tested model is dedicated to calculating the length of tree crowns at the population level. The model uses a density index, which is a constant value for all trees within the area. Further work is needed to improve the model and allow for precise calculation of the crown length of a single tree, taking into account the space it has at its disposal.

1. Introduction

Modeling the structure and dynamics of tree stands is a fundamental element of ecological research and forest management, especially in terms of monitoring tree growth [1,2], estimating forest resources [3,4], and assessing forest health [5].
Stand simulation models have been intensively developed since the beginning of the 1960s [6]. Forest modeling is constantly evolving through improving equations (models) and their adaptation to changing conditions on the local, regional, or continental scale [4,7,8]. The forestry sector actively encourages the creation and development of comprehensive forestry databases, such as national forest inventories [9]. After all, accurate forecasts are key to obtaining reliable results.
At present, there is a wide range of mathematical models that allow for predictions of the growth or survival of trees and stands, taking into account numerous variables [10,11,12]. In recent decades, many studies in the field of modeling have focused on the determination of the crown size, i.e., its length [13,14], width [15,16,17,18,19], or volume [20].
The size of the crown significantly correlates with the growth and biomass of other tree parts [21], which is why crown dimensions are used as predictors in growth models [22,23], biomass models [24,25], taper and trunk volume models [26], and mortality models [27]. Crown size estimates are often used to infer the increase in the basal area [28], production efficiency [25,29], as well as wood quality and its value [30,31]. Detailed studies of the crown are also useful for assessing the density and stability of the stand [32]. Estimation of basic crown dimensions, i.e., its width and length at a tree or stand level, is of key importance in silviculture [33,34].
Parameters describing the crown size are significant indicators of its health and vitality [28,35]. They also allow for predicting the tree’s ability to carry out photosynthesis [36], allocate resources [21,37], and resist environmental stress [38]. Crown length directly affects the tree’s ability to absorb carbon dioxide, assimilate light energy, release oxygen, and transpire [37,39]. It also affects competition for resources [40] and structural interactions with other trees in the forest ecosystem [41].
Much attention is paid to the development of models that enable precise assessment of the parameters of pine stands growing in different climatic and edaphic conditions [42,43]. Scots pine is an important forest-forming species in the Central Europe vegetation zone [44]. In Poland, it is the dominant species that currently makes up about 58% of the forest species composition [45]. It is characterized by a wide ecological amplitude and high adaptability, which is crucial in changing climatic conditions.
The aim of the study was to verify the effectiveness of the allometric model of the Scots pine (Pinus sylvestris L.) crown length using empirical material. The hypothesis is predicated on the assumption that the mean crown lengths in the pine stand, calculated with the model, are commensurate with the actual ones.

2. Materials and Methods

2.1. Description of the Study Site

The validity of the crown length model was assessed on the basis of empirical data collected from pine stands in south-western Poland. This area was located at 17°66′ E–18°45′ E and 50°28′ N–50°98′ N. The center of the research area was located at 50°55″ N; 17°73′ E (Figure 1).
The biometric data collection sites exhibited the following characteristics:
-
the dominant species (>95%) on each plot was the Scots pine;
-
the stands represented the second age class;
-
selected stands occurred on coniferous habitat types characteristic for this species.
Climatic data for a period of 35 years were collected from the meteorological station in Opole [46]. The annual rainfall averaged at 630 mm·year−1, the average annual temperature amounted to +8.0 °C, and the average relative humidity was 80%. The length of the growing season was ca. 248 days, which translated into 3246 h of daylight.
In the managed forests, 20 experimental plots of 0.25 ha (50 × 50 m) each were designated. The age of the stands ranged from 28 to 40 years. The age determination was conducted on the basis of core borings obtained using a Pressler incremental auger (Haglöf Sweden). The investigated stands were subjected to intermediate cutting of various intensity. The density on individual plots varied and ranged from 1224 to 3132 trees·ha−1. The determination of the habitat type was conducted on the basis of soil excavations and the description of genetic levels, as well as phytosociological relevés. The stands grew on podzols and brunic arenosols in the habitat conditions typical for pine, i.e., of fresh or mixed-fresh forest.

2.2. Biometric Measurements

On the designated 20 plots, the diameter at breast height ( D B H ) was measured for 10,957 trees using a metal caliper Mantax Blue (Haglöf, Långsele, Västernorrland, Sweden) with an accuracy of 1 mm. The measurements were carried out in two directions: N-S and W-E, and the arithmetic mean of both directions was assumed as the final D B H . Based on the measurement of the diameter at breast height of all trees on each plot, 15 sample trees were selected, taking into account the dominant, codominant, intermediate, and suppressed trees. The selection was made using the English method developed by Humme felling every k -th tree based on the formula [47]:
k = N n
where N —total number of trees in a research area; n —assumed number of sample trees.
The selected 300 sample trees (20 plots × 15 sample trees = 300 trees) were cut down during the winter. After cutting, their length was determined with a metal tape measure with an accuracy of 0.01 m, which was adopted as the height of the tree ( H ), and crown length ( C L e m p ) was measured. The method of measuring the crown length based on the number of branches in the crown whorls was described in detail by Sporek and Sporek [14]. In the cases where the whorl was properly formed and had six branches, the crown was considered regular and its length was measured from the top of the tree to the base of the full whorl. In the cases where there had been a loss of branches in the whorl, the length of the crown was corrected. For example, if, in the lowest whorl, one branch (of the size corresponding to the other branches) was dead, the length of the crown was the distance from the treetop to the base of the “in-complete” whorl, minus one-sixth of the distance between this base and the base of the nearest whole whorl. Based on this assumption, it is assumed that the crown length would be reduced one-sixth of the annual growth of the stem. In other words, if there were two dead branches in the last incomplete whorl, the measurement would be shortened by two-sixths of the annual growth (illustrated in graphic abstract).
The data obtained from pine stands and felled sample trees used to verify the crown length model are presented in Table 1. Each plot was described using the following stand parameters: A , age of the stand (years); N , number of trees per ha; B A , stand basal area (m2 ha−1); H , stand height (m); D B H , diameter at breast height (cm).
The diameter at breast height ranged from 9 to 32 cm. The measurements showed that 62% of the trees had D B H below 12 cm. Figure 2 shows the histogram of D B H distribution and a curve representing the density of the normal distribution (for mean, 12.3; SD, 3.2). D B H distribution was asymmetrical. The distribution contour indicated that the diameter at breast height was not normally distributed. To assess the normality of the D B H distribution, the Shapiro–Wilk, Kolmogorov–Smirnov, and Lilliefors tests were used. The calculated p values were lower than the critical p < 0.05. Rejection of the null hypothesis regarding the D B H distribution normality was clear.

2.3. Allometric Model

The study checked the accuracy of the crown length model [14] expressed by Equation (2). The model was derived from a regression equation. The stages of construction of the crown length model are presented in the article Sporek and Sporek [14]. The model includes a power exponent α = 0.25 and a correction factor of 1.33, which was replaced by the value π , since 3.14 to the power of 0.25 equals 1.33. Thus, ( π · D G H · H ) in the power of 0.25 is the volume of the tree. The tree volume raised to the power of 0.25 gives the crown length including the stand density index in the model. The key predictor in this model appeared to be the density index, defined as the actual number of trees per ha (which we know only at the time of measurement) to the expected number of trees of a given age and stand quality class (value read from Tables of Stands Volume and Increment [48]).
C L c a l = π · D G H · H 1 D I 0.25
where
  • C L c a l —calculated crown length (m),
  • D G H —diameter of the tree at ground height (diameter of the base of the tree): D G H = D B H + 1.7   ( cm )
  • H —tree height (m),
  • D I —density index (actual number of trees per ha/normative number of trees (taken from Tables of Stands Volume and Increment [48])
In order to verify the pine crown length, calculated using the allometric model (2), detailed statistical analyses were carried out on a sample of 300 trees selected from a pool of 10,957 measured diameters at breast height. The verification was divided into two stages. The first stage focused on investigating the impact of physical parameters of 300 trees, such as diameter at breast height, height, and density on the crown length. In the second stage of the analysis (Section 3.3), we adopted the average values from 15 selected sample trees for each plot. This was aimed at reducing random errors that may result, for example, from tree competition for limited resources, crown reduction as a result of folivore feeding, or weather conditions such as damage to the crowns caused by strong winds.

2.4. Statistical Analysis

The model was evaluated using statistical criteria, such as root mean squared error (RMSE) and coefficient of determination (R2), because they are simple in terms of computation and interpretation [49]. A paired t-test was applied to evaluate whether the means of the estimated and measured crown length were identical. The ANOVA test was used to compare DBH means. Unless determined otherwise, a significance level of p = 0.05 was used in all analyses. The impact of each predictor ( D B H , H , D I ) on the variability of the crown length is shown graphically. This ensures the biological plausibility of the matched model. All calculations were performed using the Statistica 13.3 package (StatSoft Inc., Tulsa, OK, USA, 2023).

3. Results

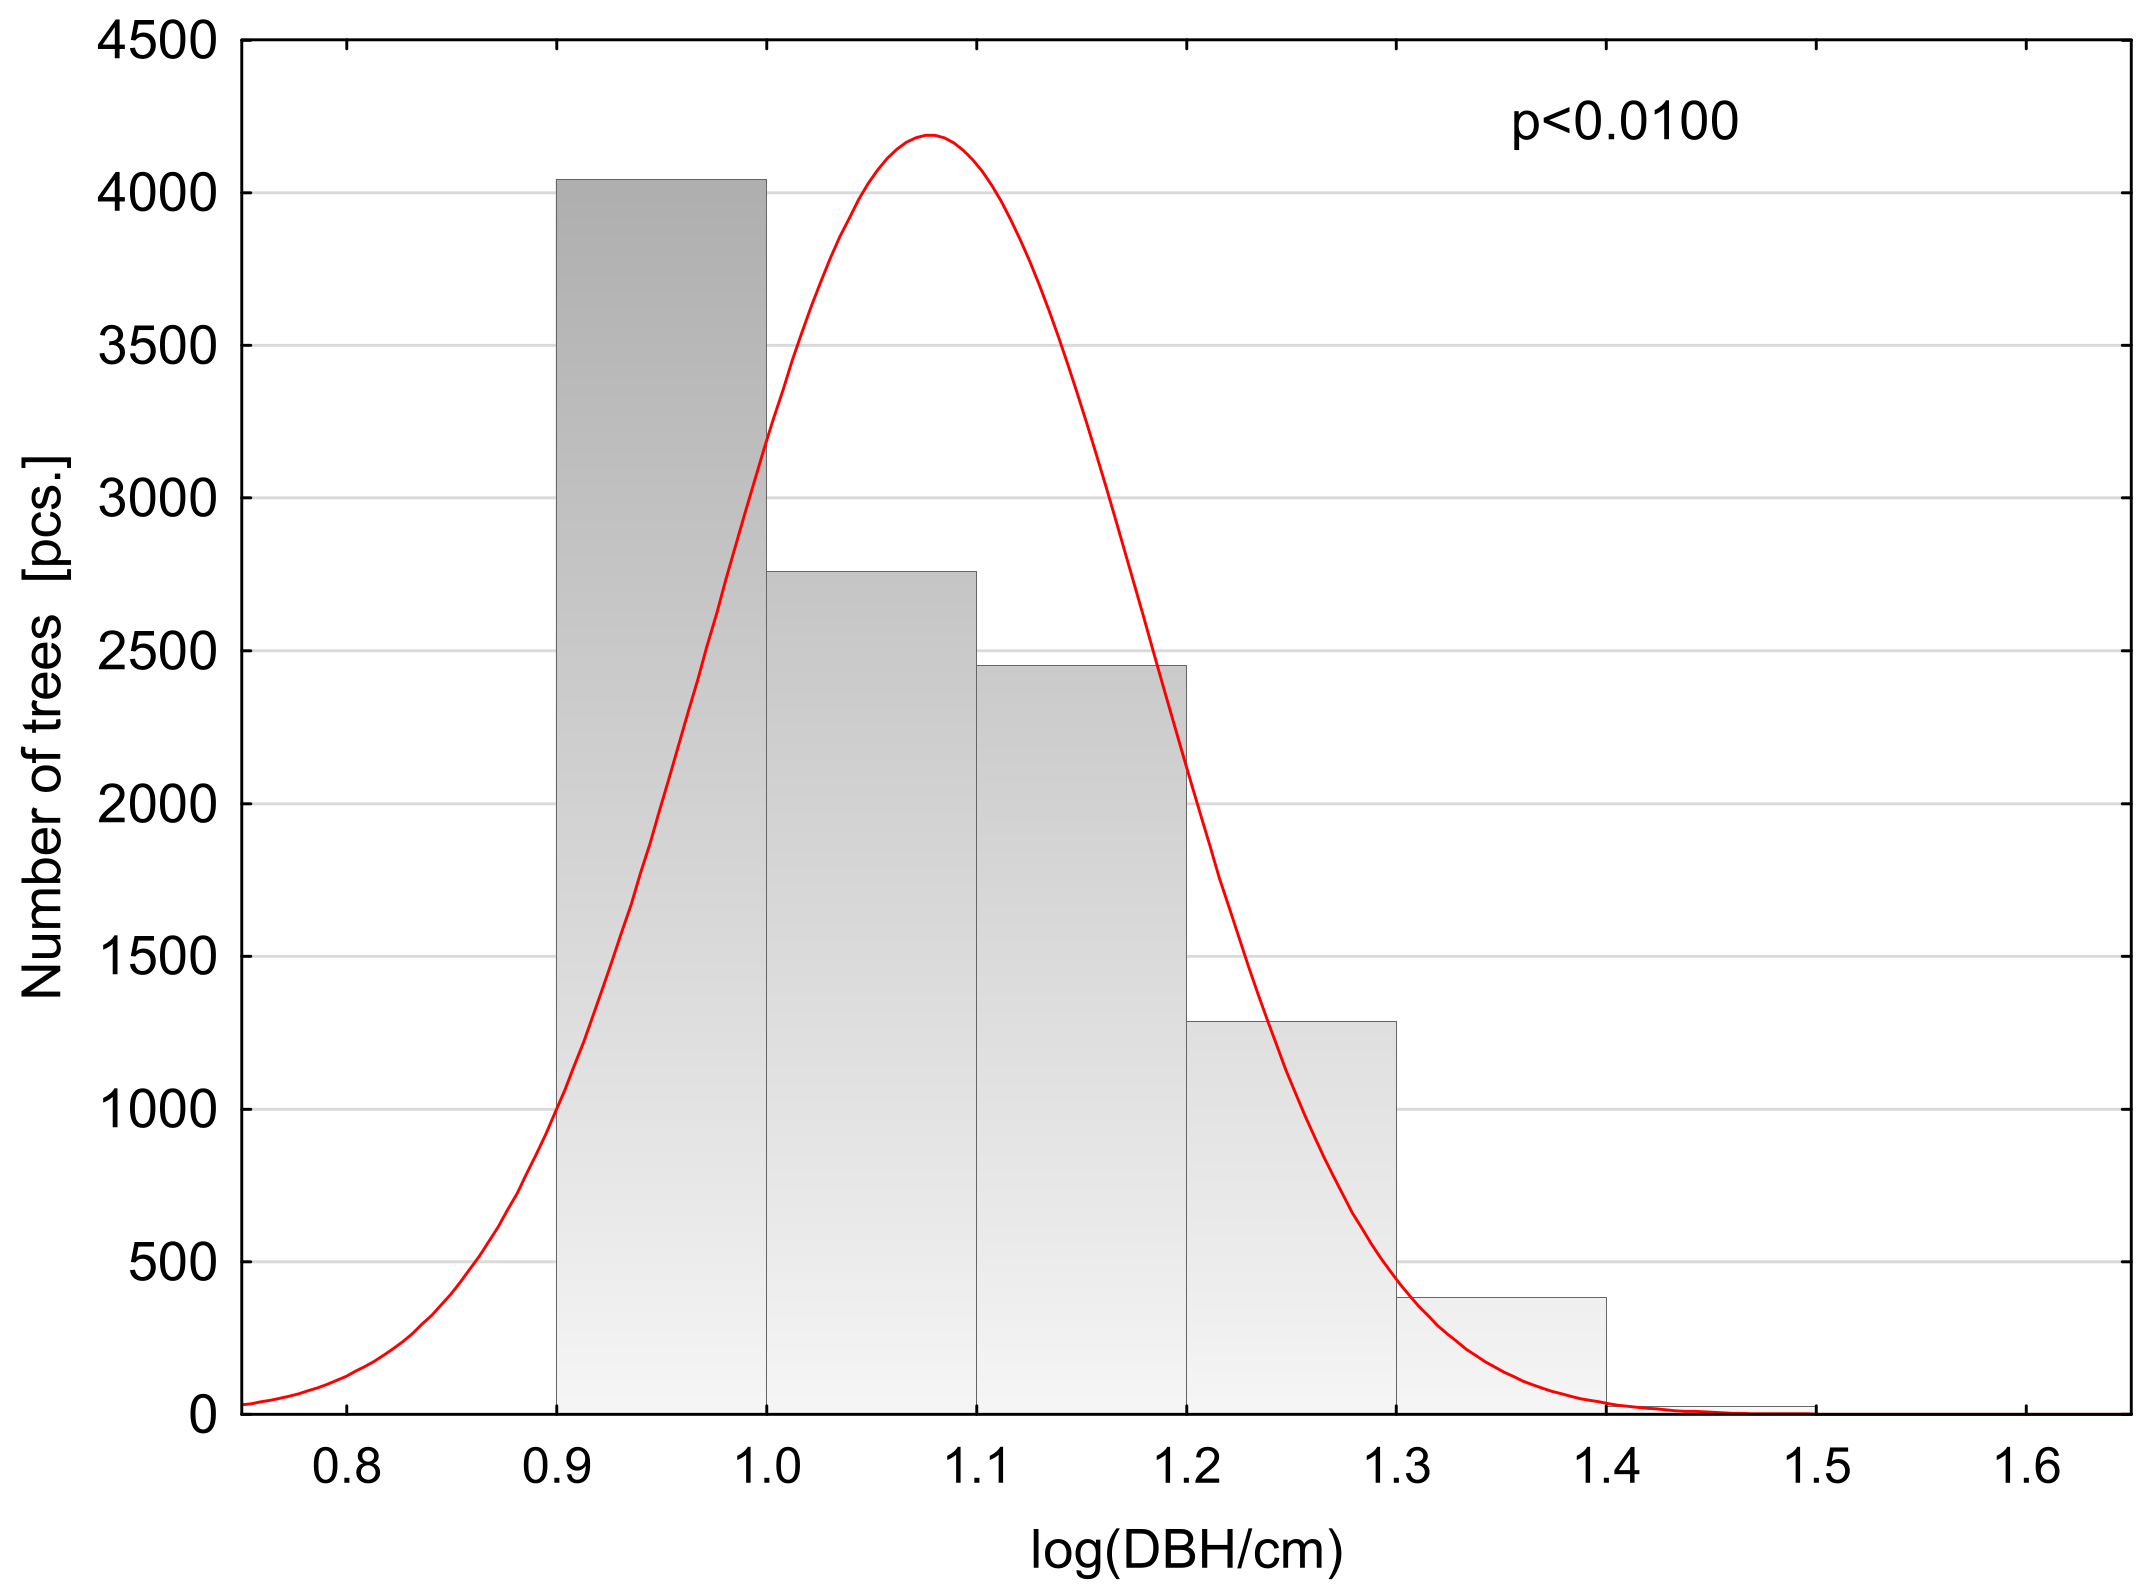
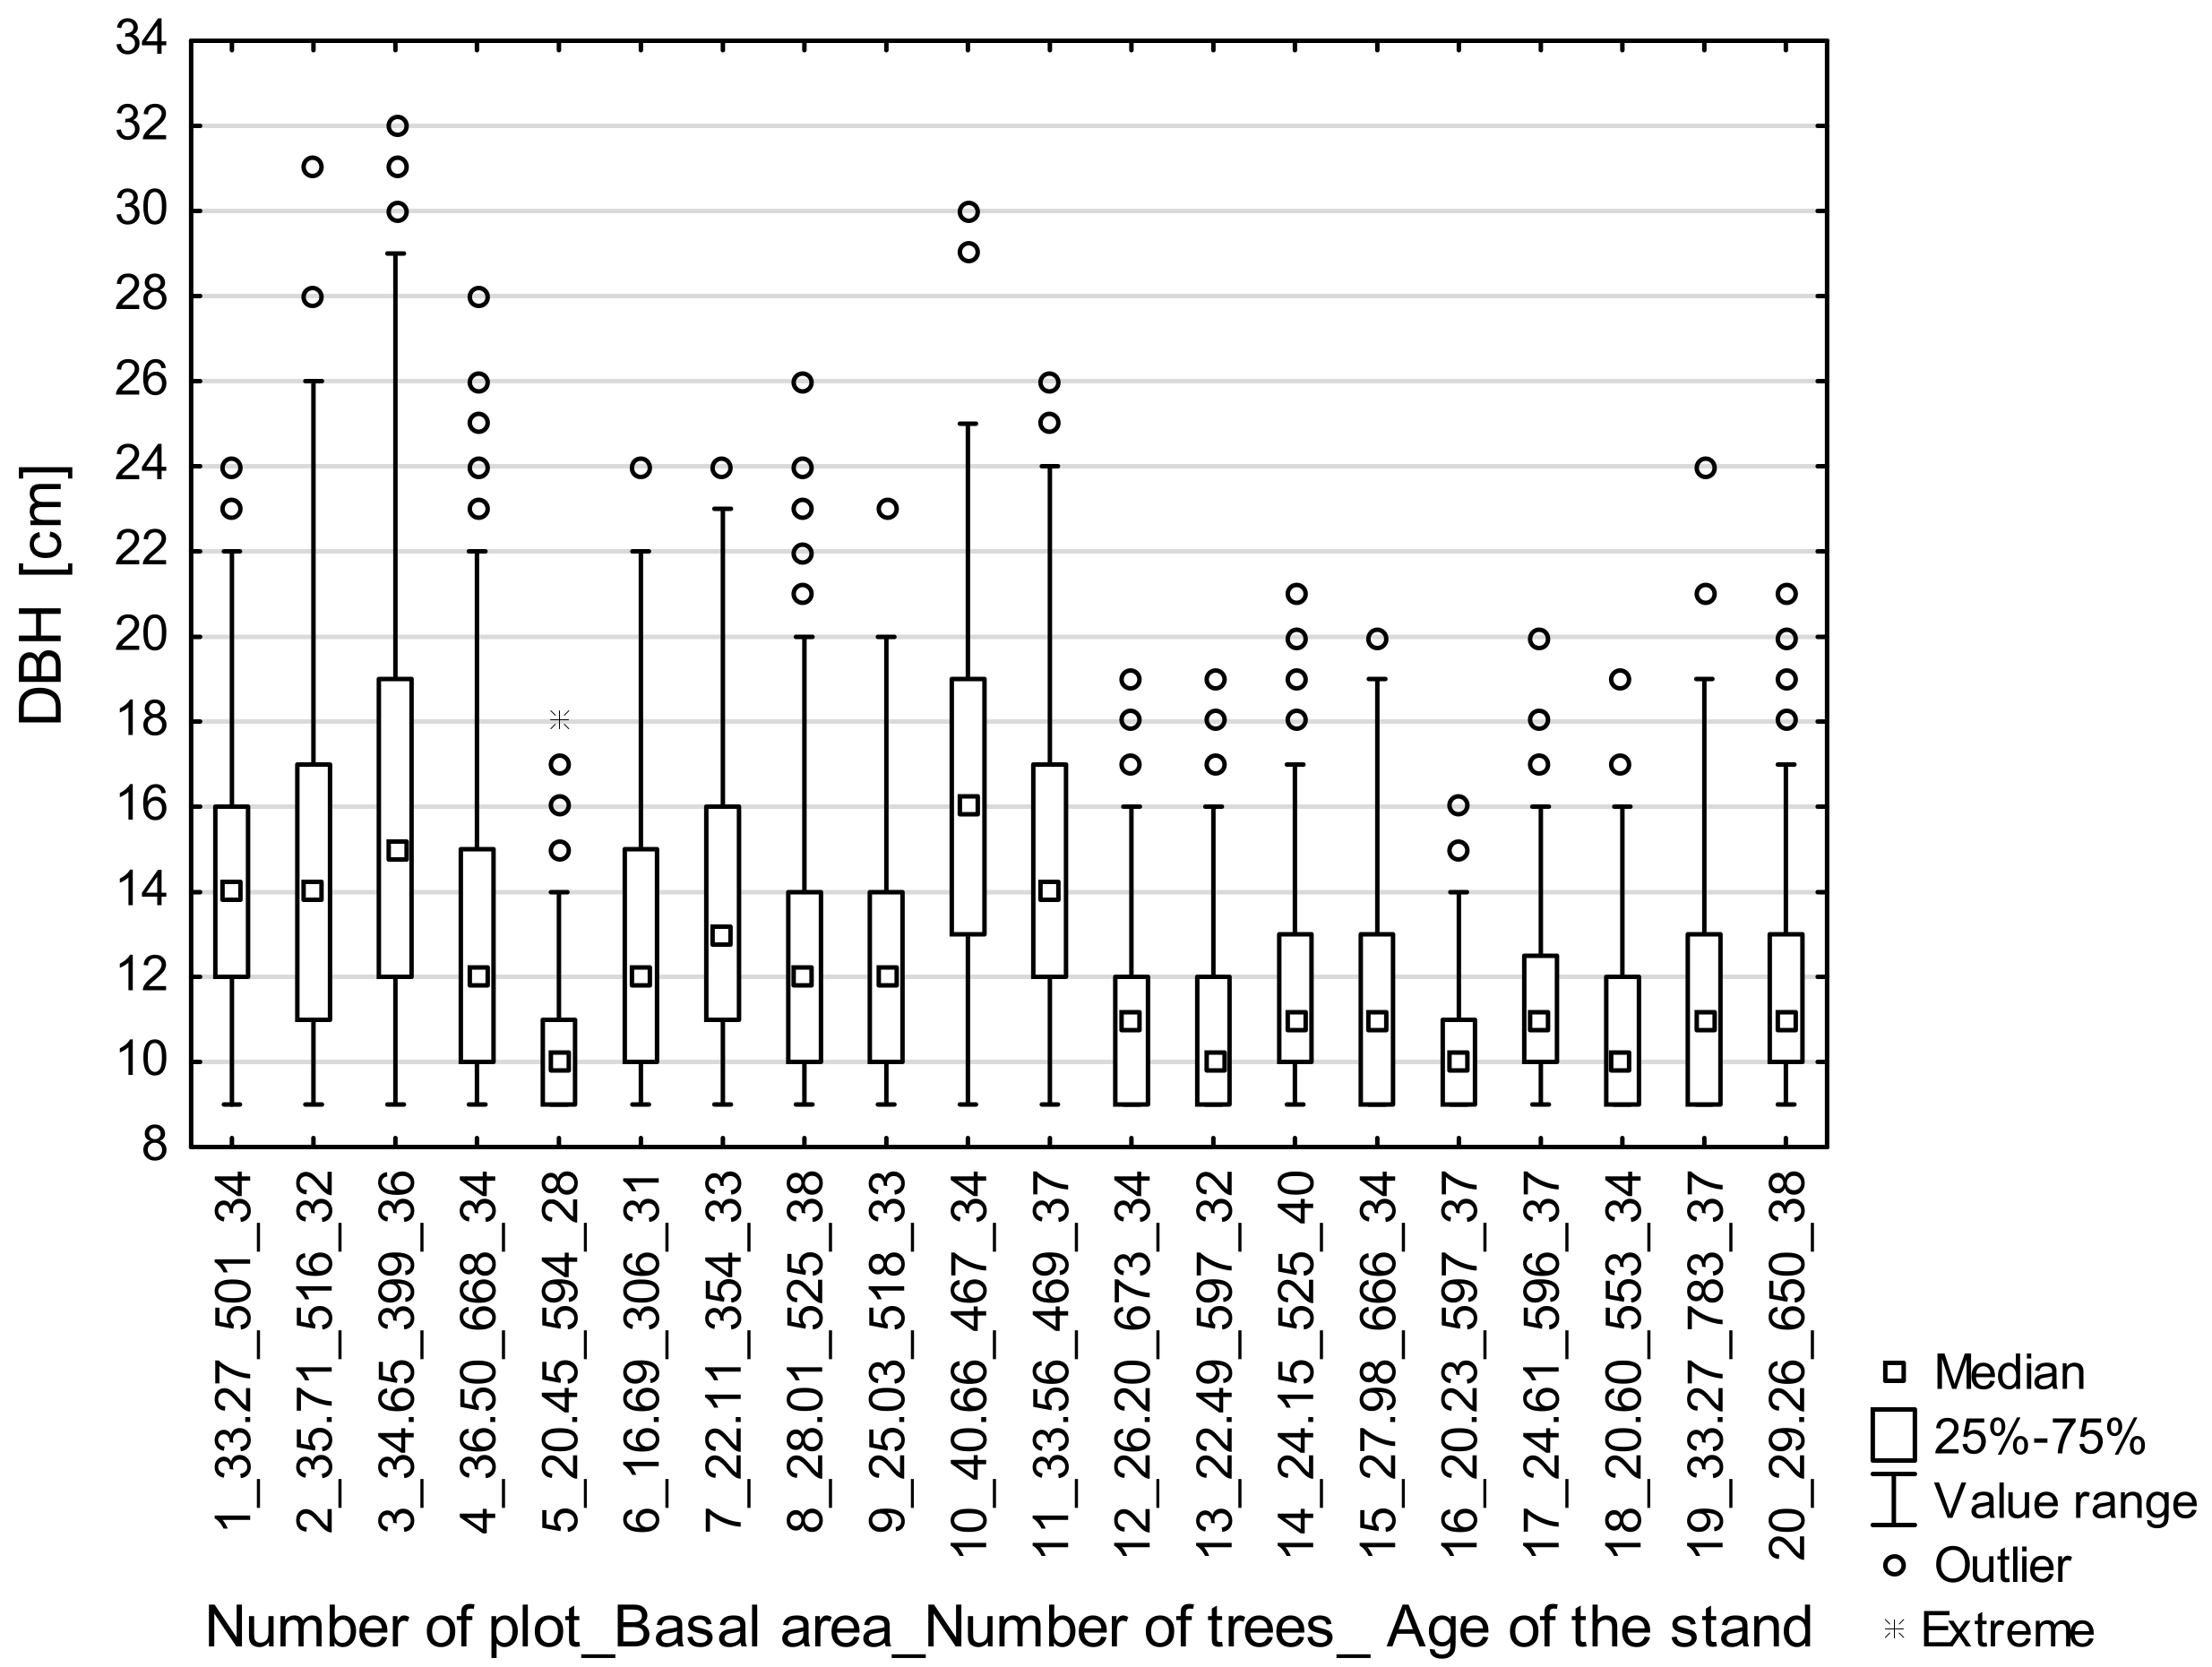
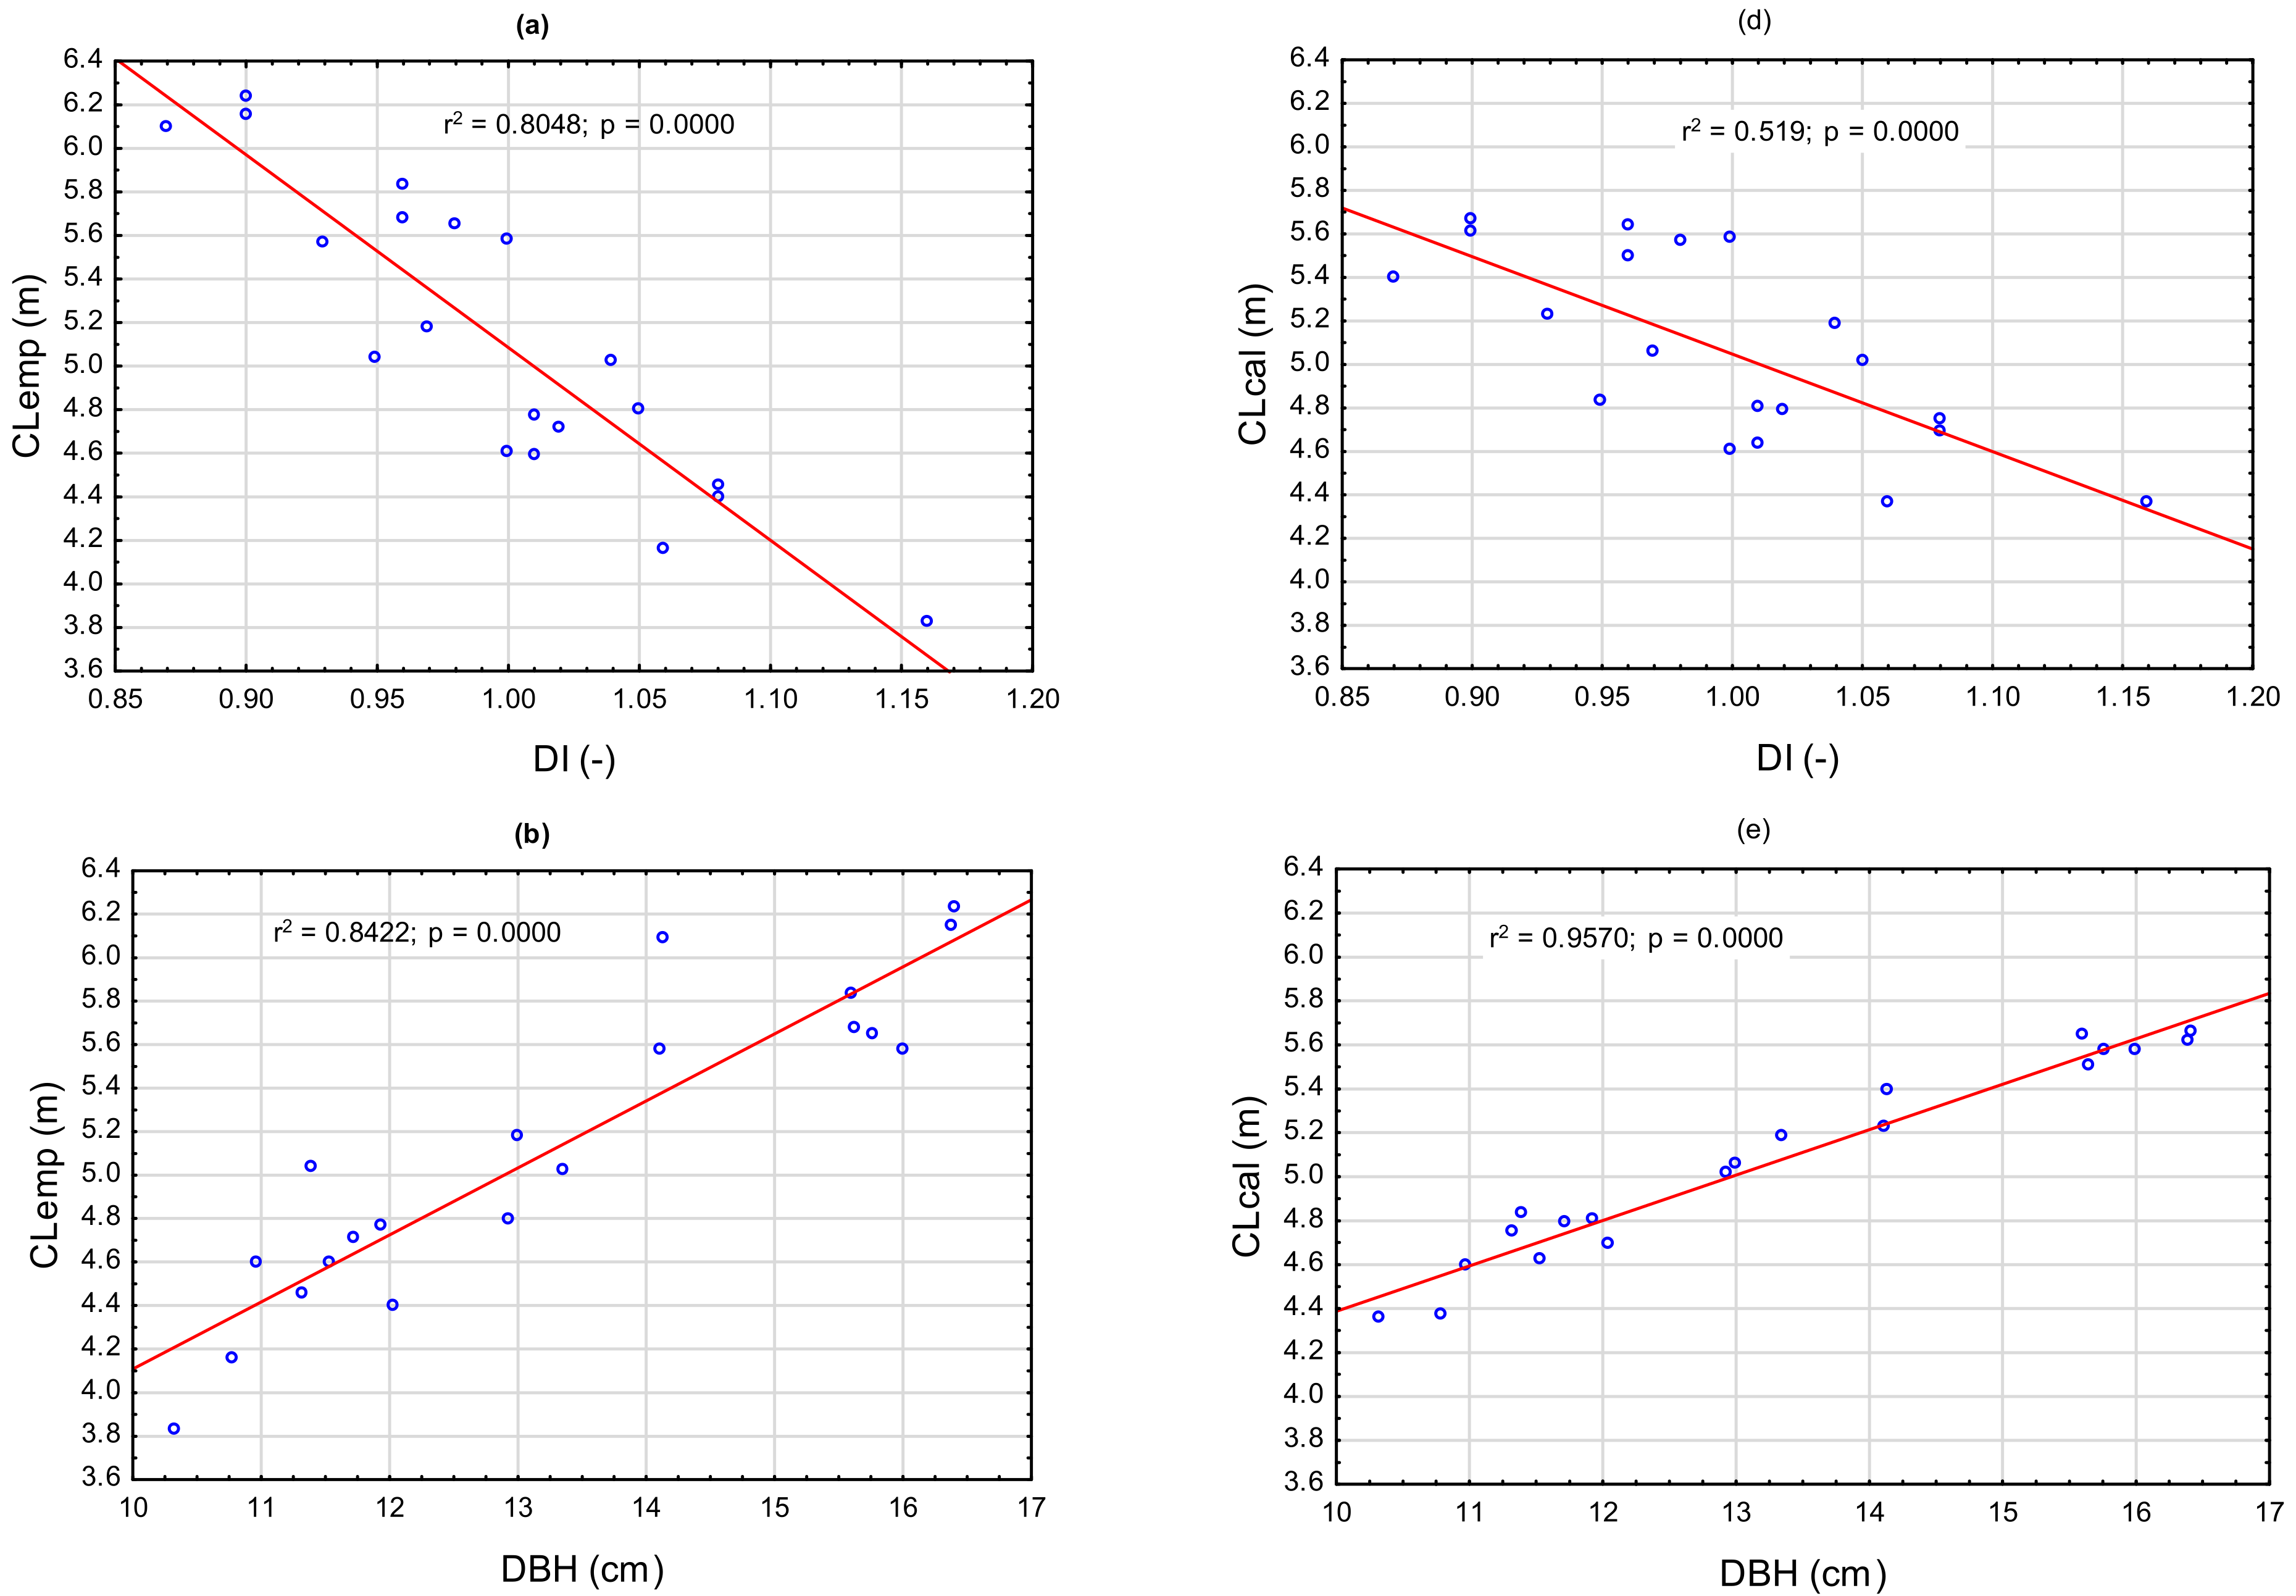
3.1. Model Predictors

The crown length model [14] used three predictive variables, i.e., diameter at breast height, tree height, and density index. The tested model assumed that the length of the tree crowns in a single-species stand (Pinus sylvestris L.) depends mainly on its density. This density is shaped over many years, and pine trees whose space for growth is limited can produce short crowns. On the other hand, the trees that have full access to light while growing have longer crowns. Therefore, the accuracy of the model’s operation was checked on the data obtained from stands differing in terms of density (Table 1), and thus physical parameters, i.e., diameter at breast height and crown length. Reineke’s [50] rule describes the experimental data well. The higher the stand density, the lower the average DBH of the trees. The relationship between the density and diameter at breast height was clearly described by statistical parameters (Figure 3). For example, at a density of 1868 trees·ha−1, the average diameter at breast height was 16.2 cm (plot 10), whereas at a density of 2692 trees·ha−1, it was 10.9 cm (plot 12). On both plots, the pine stand was 34 years old (Figure 3). The ANOVA test indicate rejection of the null hypothesis. The average DBH is different for the same-aged stands.

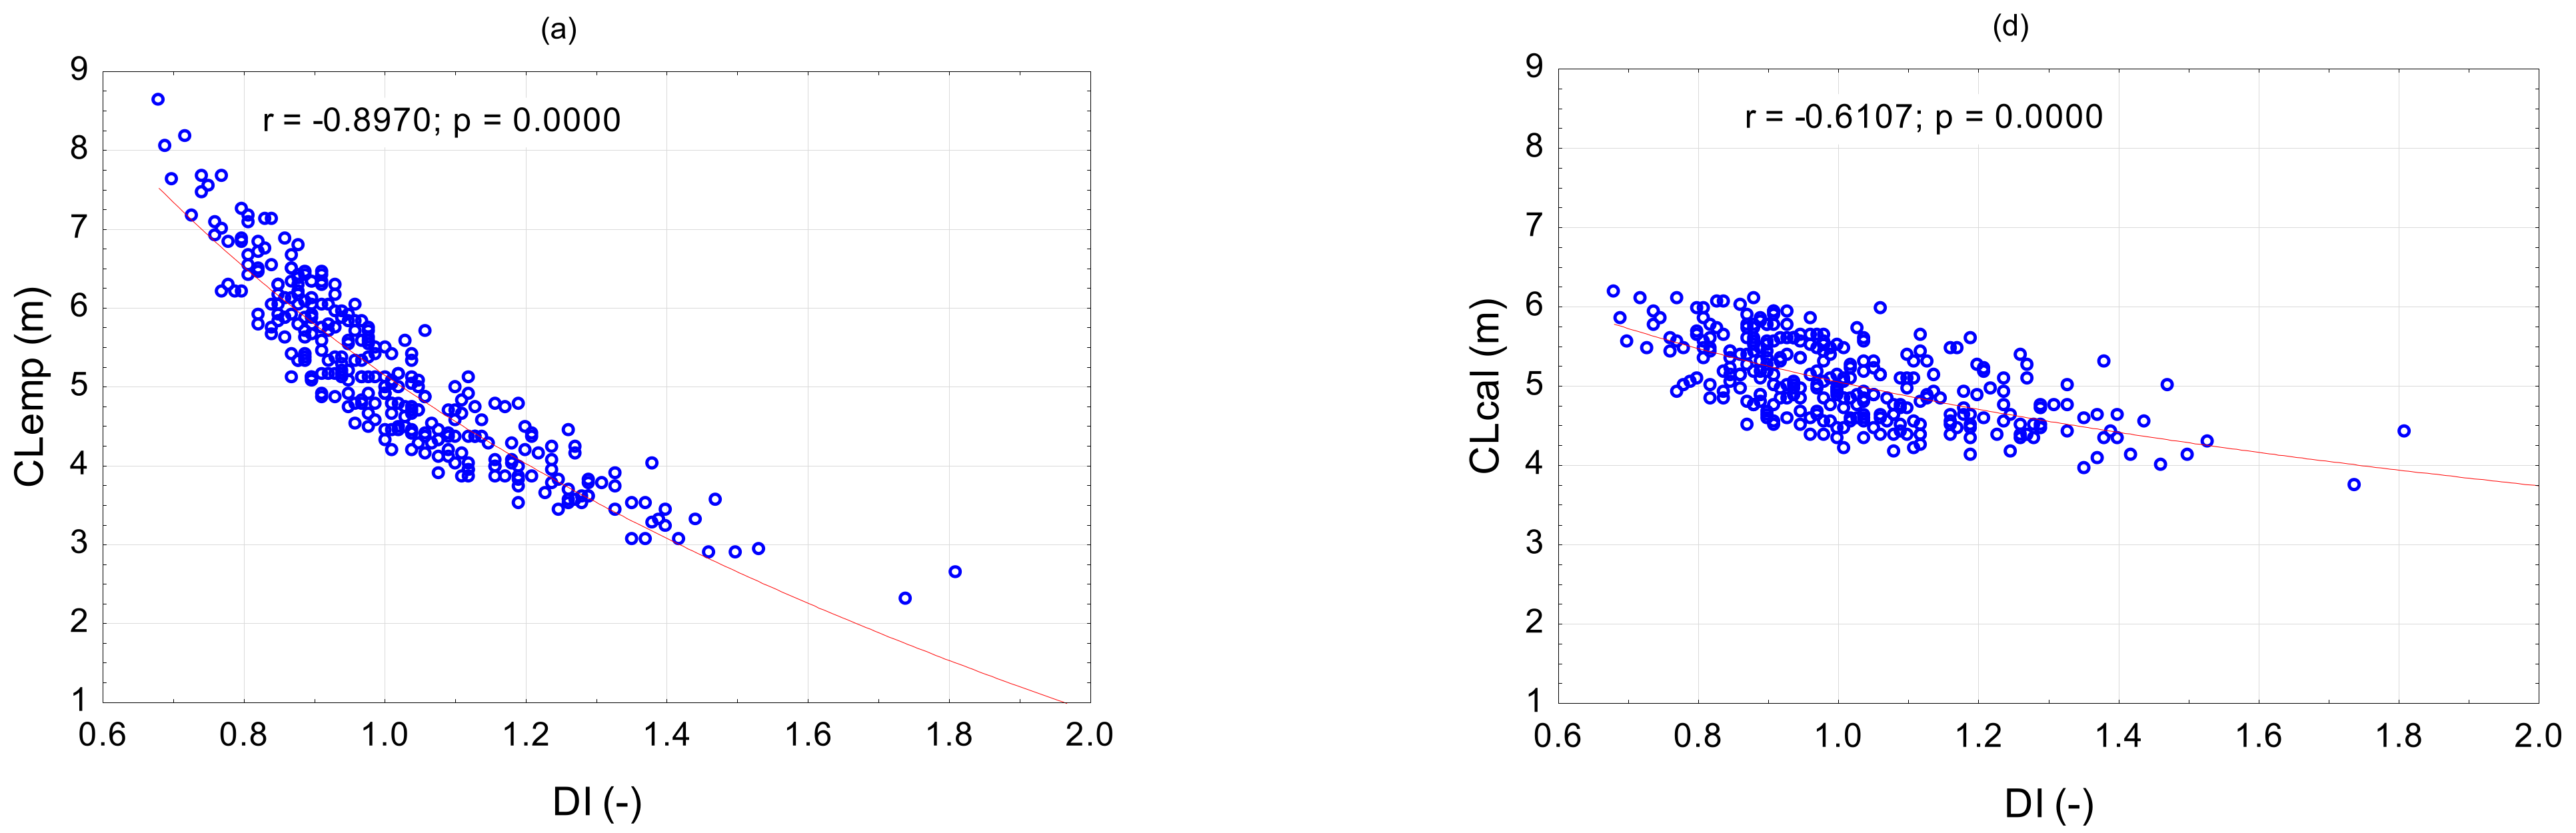
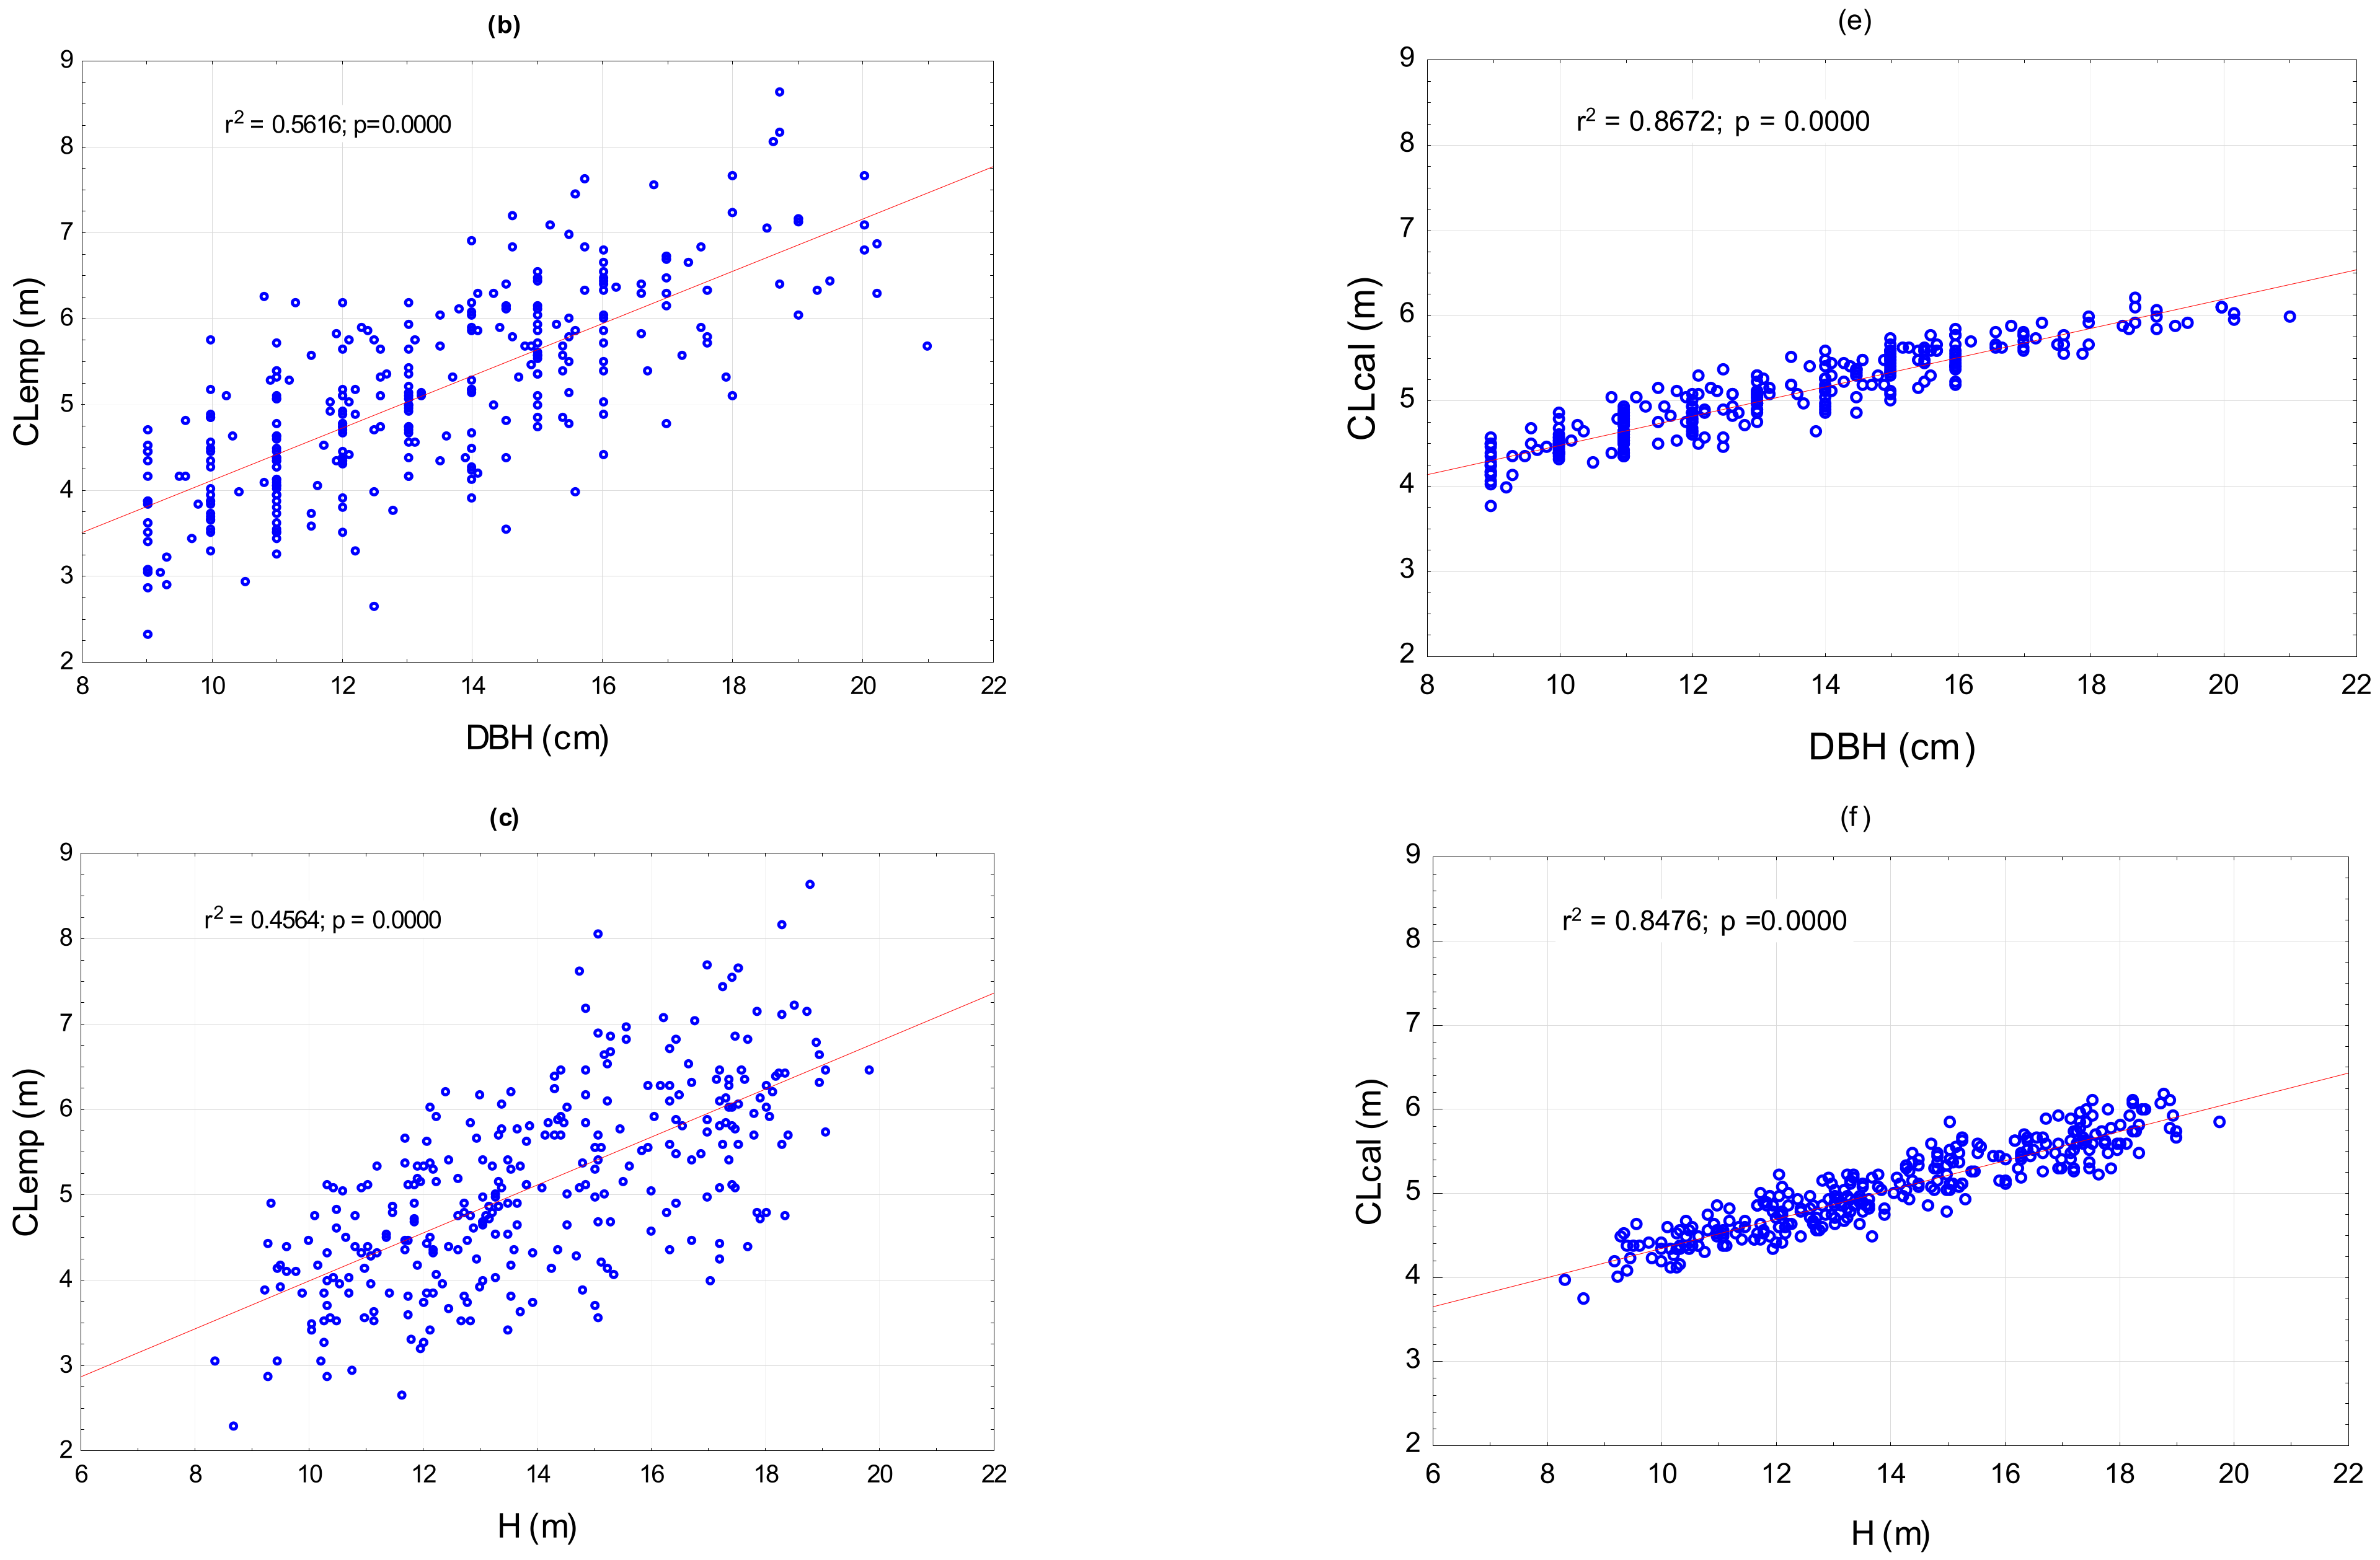
3.2. Model Verification on Sample Trees

The allometric formula for calculating crown length (Equation (2)) allows us to estimate the length based on measurable parameters, such as diameter at breast height ( D B H ) and tree height ( H ). In this equation, the notation: ( π · D G H · H ) denotes the surface of the cylinder with diameter ( D G H ) and height ( H ). This equation is particularly useful for trees growing at optimal density D I = 1. In such circumstances, a simplified equation is employed, with the compaction index ( 1 D I ) being disregarded:
C L c a l = π · D G H · H 0.25
The relationships between D B H , H , D I and C L for the 300 sample trees are demonstrated in both Table 2 and Figure 4. The results indicated significant correlations for the adopted level of p < 0.05, which suggests that the allometric model may be a reliable tool for crown length estimation. For the positive correlation, the highest coefficients of determination occurred between C L c a l and D B H and H (R2 = 0.867 and R2 = 0.848, respectively) (Figure 4e,f). In the case of density, a negative linear correlation was observed. The higher the stand density, the shorter the crowns were (Figure 4a,d). The coefficient of determination between C L e m p and D I was very high (R2 = 0.805). A slightly weaker relationship was noted between C L c a l and D I (Figure 4d).

3.3. Testing the Crowns Length Model on Averaged Samples

The effectiveness of the C L c a l model was analyzed on the data averaged for a given stand. Table 3 presents the actual mean H , D B H , and C L e m p parameters of the sample trees, which were correlated with the density of pine stands.
The model was employed to calculate the average crowns lengths for 20 analyzed stands. Root mean squared error (RMSE) was used as a measure of the difference between the measured and calculated crowns length values. The difference between the actual and model results was 31 cm, which constituted a discrepancy of 4.57%. This difference was influenced by parameters of the trees collected from three plots: 8, 11, and 16 (Table 3). The mean empirical crowns length was 5.12 m, while the mean crowns length calculated using the verified model was 5.06 m (Table 3). The paired t-test also showed no significant difference between the mean values of the measured and model-calculated crown lengths for the 20 studied pine stands (t = 0.76; df = 19; p = 0.45).
The analysis of multivariate data for the mean values of 300 sample trees is shown in Figure 5.
Results for the actual and model-assessed crowns lengths demonstrated that R2 values ranged from 0.519 to 0.972 (p < 0.001). High values of correlation coefficients between various parameters ( C L , D B H , H , D I ) of the stands indicated strong relationships between the features that shape tree growth dynamics. This was also confirmed by Spearman’s rank correlation analysis (Table 4). A very strong correlation was found between crown length and diameter at breast height and tree height. For C L e m p , this relationship was R = 0.904 and R = 0.895, respectively. Even stronger correlations of these relationships were found for C L c a l , where they were R = 0.955 and R = 0.967 (Table 4). The relationship between crown length and stand density is of particular interest. When comparing the correlation for individual 300 sample trees (Table 2) with the correlation for results averaged for 20 separate stands, we observed stronger correlations between the density index and crown length at the population level ( R = −0.887 for C L e m p and R = −0.739 for C L c a l ) (Table 4). This finding is consistent with the assumption that in single-species stands, such as those of Pinus sylvestris, crown length depends mainly on tree density.
The linear relationship showed a very strong correlation between the actual and model-calculated crown lengths at the population level, with a coefficient of R = 0.949. A comparison of the dispersion of the empirical values ( C L e m p ) with the calculated ones ( C L c a l ) for the stands and model trees is presented in Figure 6. High efficiency of the model was confirmed by the coefficient of determination (R2 = 0.901) for the studied tree population (Figure 6b), which proved the validity of the model construction and the accuracy of parameter selection. The discrepancies may come from measurement inaccuracies and incomplete representativeness of the model trees, which may be indicated by the lower coefficients of determination (R2 = 0.743) for the sample trees (Figure 6a). Thus, the model shall work better for a community rather than for a single tree.

4. Discussion

The difficulty in modeling crown sizes is the result of cumulative events and conditions that occurred in previous years [51]. Pine crown length is shaped, among others, by intermediate cutting over many years of the tree’s life cycle. As a result, certain tree parts affecting density and light conditions inside the stands are removed [21,25], which is what mainly determines crown shapes and sizes. The size of the crown significantly correlates with other tree parameters, which is why crown measures are important predictors in the development of tree and biomass growth models [17].
Checking the equation is a crucial modeling procedure as it ensures the model’s reliability and confidence. When the construction of the model and its verification is carried out on the same object, it can be expected that they would significantly correlate with each other, and the assumption of independent errors is compromised when estimating a model with a simple least square regression [52]. This results in a significantly biased parameter estimates that cause invalidation of the hypothesis tests [16,53]. A correct solution to this problem is to verify the model on diverse data coming from various independent objects, not related to those used for its construction. This way, verification takes into account the heterogeneity and randomness caused by various stochastic factors [16,52,54].
The tested C L c a l model can work well in overpopulated and thinned communities. The analysis shows that “the square of the crown length is directly proportional to the geometric mean height and diameter of the tree at the ground level”. Such a relationship is a representation of biological processes occurring for many years in the phytocenose of pine. Themodel [14] requires D B H and H measurements, as well as the determination of D I as input variables. We tested it on a different dataset than the one used in its construction. Empirical data for assessing the accuracy of the model were collected from different areas, which resulted in their diversification even when the age of the stands was the same (Figure 2), which was confirmed by the ANOVA test. This variability was mainly due to the care procedures performed, as well as habitat conditions and biotic factors. Predictive statistics such as R2 = 0.76 and RMSE = 31 cm, calculated for the averaged crown lengths, as well as graphical matching curves, showed that the model worked within the assumed error limits. The analysis showed greater agreement between C L c a l  and C L e m p for a stand than for a single tree (Figure 6), thereby supporting our hypothesis. This is justified because it eliminates not only errors resulting from the measurement, but also random variables affecting the shape of a single tree crown. Furthermore, in the model under scrutiny, we hypothesize a density index for the stand, hypothesizing this to be constant for all trees within the experimental plot. The model can be used to calculate the crown length of a single tree, provided it grows at the same density as the calculated average density for the stand. Such a situation under natural conditions will only apply to a small number of individual trees. The model is, therefore, not dedicated to the calculation of a single crown, as this would generate too much error (in some cases, up to 29%) (Figure 6a).
In principle, the different authors [55,56,57] claim that crown length can be predicted on the basis of standard variables measured in forest management. However, it is believed very difficult to accurately calculate crown length using basic measurements of trees, i.e., diameter at breast height, height, basal area, and stand age, without calibration at the stand level [57]. The tested crown length model showed that the measurements normally performed in forest inventories ( D B H , H ) together with D I are sufficient to calculate crown lengths of pine stands. Spearman’s rank correlation coefficient between D B H and the calculated C L c a l model is high at R = 0.955 (p < 0.05), which underlines the relationship between the trunk size and its crown. A strong correlation can also be observed between H and C L c a l ( R = 0.967; p < 0.05). This confirms that the predictors used to build the model are adequate and the model construction is correct. It should be noted that these two parameters, D B H and H , yield a very strong correlation for both individual trees (Figure 4) and stands (Figure 5).
The third predictor used in the model, D I , showed a negative correlation with the crown length. The inclusion of D I in the crown length model seems crucial. In monospecific stands, crown density is reduced by accelerated self-thinning, crown shyness, and biotic or abiotic damage [58,59]. This predictor plays a key role in younger stands, when there is strong competition among the trees. This results in an initial reduction in size, including of the crown, while the trees separate from the community at a later stage [60]. This is in line with Norris’ conclusion [61]. Spearman’s rank correlation coefficient of R = −0.887 (Table 4) indicates a significant negative correlation: the higher the density, the shorter the crown. This statement is consistent with the assumption that in single-species stands of Pinus sylvestris of the first and second age class (up to 40 years), the length of the crown mainly depends on density. This regularity has been noted by other authors [62,63] and is reflected in the original survival and ingrowth models for Pinus sylvestris and Pinus pinaster [64].
This study revealed several issues that need to be addressed in future works. First of all, the sample size must be larger and include data from forest stands growing in other habitat types and in different climatic conditions. Second, the age of stands should be extended to include younger (up to 20 years old) and older stands (over 40 years old), which should allow one to check and possibly adjust the model to the age of trees. Finally, density can be a useful variable for developing submodels and even better matching.

5. Conclusions

The tested model of the Scots pine (Pinus sylvestris L.) uses easy-to-measure biometric parameters, i.e., diameter, tree height, and density. This model can be safely used to calculate the crown length for a stand. It precisely reflects the actual crown lengths as population averages, as evidenced by the coefficient of determination of R2 = 0.76, between C L e p m and C L c a l . A crucial element in the model construction is the exponent α, which allows representation of actual processes occurring in the natural environment. The proposed model should be used with caution for calculating individual crown lengths. The limitation results from the density index used in the model, which applies to the community (stand density). The model can be used to calculate the crown length of a single tree, provided it grows at the same density as the calculated average density for the stand. Otherwise, an error will be generated for a single crown. The verification of the crown length model confirmed its usefulness for stand, and thus enabled its wider use. Further research and empirical data collection for different tree age classes and habitat conditions are crucial to develop and refine the model.

Author Contributions

Conceptualization, M.S. and K.S.; Methodology, M.S. and K.S.; Formal Analysis M.S. and K.S.; Investigation M.S.; Resources M.S.; Data curation M.S.; Validation M.S. and K.S.; Writing—Original Draft Preparation, M.S.; Writing—Review and Editing, M.S., K.S. and M.K.; Visualization, M.S.; Supervision, M.S. and K.S.; Project Administration, M.S. and K.S.; Funding Acquisition, M.S., K.S. and M.K. All authors have read and agreed to the published version of the manuscript.

Funding

This research was supported by the Scientific grant agency of the Ministry of Education, Science, Research and Sports of the Slovak Republic and the Slovak Academy of Sciences under project No. 1/0323/23 and by the grant agency KEGA 004UMB-4/2024.

Institutional Review Board Statement

Not applicable.

Informed Consent Statement

Not applicable.

Data Availability Statement

The data presented in this study are available in the article.

Conflicts of Interest

The authors declare no conflicts of interest.

References

  1. Vacek, S.; Vacek, Z.; Bílek, L.; Simon, J.; Remeš, J.; Hůnová, I.; Král, J.; Putalová, T.; Mikeska, M. Structure, regeneration and growth of Scots pine (Pinus sylvestris L.) stands with respect to changing climate and environmental pollution. Silva Fenn. 2016, 50, 1564. [Google Scholar] [CrossRef]
  2. Kara, F.; Topaçoğlu, O. Influence of stand density and canopy structure on the germination and growth of Scots pine (Pinus sylvestris L.) seedlings. Environ. Monit. Assess. 2018, 190, 749. [Google Scholar] [CrossRef] [PubMed]
  3. Burger, H. Wood, number of leaves and growth. V. Spruces and pines of different origins at different sites. Mitt. Schweiz. Anst. Forstl. Versuchsw. 1941, 22, 10–60. (In German) [Google Scholar]
  4. Socha, J.; Tymińska-Czabańska, L.; Bronisz, K.; Zięba, S.; Hawryło, P. Regional height growth models for Scots pine in Poland. Sci. Rep. 2021, 11, 10330. [Google Scholar] [CrossRef]
  5. Bose, A.K.; Gessler, A.; Büntgen, U.; Rigling, A. Tamm review: Drought-induced Scots pine mortality–trends, contributing factors and mechanisms. For. Ecol. Manag. 2024, 561, 121873. [Google Scholar] [CrossRef]
  6. Dudek, A.; Ek, A.R. A bibliography of worldwide literature on individual tree based forest stand growth models. Staff Paper Ser. 1980, 12, 33. [Google Scholar]
  7. Cieszewski, C.J.; Zasada, M.; Strub, M. Analysis of different base models and methods of site model derivation for Scots Pine. For. Sci. 2006, 52, 187–197. [Google Scholar] [CrossRef]
  8. Hallingbäck, H.R.; Burton, V.; Vizcaíno-Palomar, N.; Trotter, F.; Liziniewicz, M.; Marchi, M.; Berlin, M.; Ray, D.; Benito-Garzón, M. Managing Uncertainty in Scots Pine Range-Wide Adaptation Under Climate Change. Front. Ecol. Evol. 2021, 9, 724051. [Google Scholar] [CrossRef]
  9. Tomppo, E.; Gschwantner, T.; Lawrence, M.; McRoberts, R.E. (Eds.) National Forest Inventories. Pathways for Common Reporting; Springer: Berlin/Heidelberg, Germany; Dordrecht, The Netherlands; London, UK; New York, NY, USA, 2010; p. 614. ISBN 978-90-481-3232-4. [Google Scholar] [CrossRef]
  10. Condes, S.; Sterba, H. Derivation of compatible crown width equations for some important tree species of Spain. For. Ecol. Manag. 2005, 217, 203–218. [Google Scholar] [CrossRef]
  11. Meng, S.X.; Lieffers, V.J.; Huang, S.M. Modelling crown volume of lodgepole pine based upon the uniform stress theory. For. Ecol. Manag. 2007, 251, 174–181. [Google Scholar] [CrossRef]
  12. Qiu, S.; Gao, P.; Pan, L.; Zhou, L.; Liang, L.; Sun, Y.; Wang, Y. Developing nonlinear additive tree crown width models based on decomposed competition index and tree variables. J. For. Res. 2023, 34, 1407–1422. [Google Scholar] [CrossRef]
  13. Rouvinen, S.; Kuuluvainen, T. Structure and asymmetry of tree crowns in relation to local competition in a natural mature Scots pine forest. Can. J. For. Res. 1997, 27, 890–902. [Google Scholar] [CrossRef]
  14. Sporek, M.; Sporek, K. Allometric Model of Crown Length for Pinus sylvestris L. Stands in South-Western Poland. Forests 2023, 14, 1779. [Google Scholar] [CrossRef]
  15. Gill, S.J.; Biging, G.S.; Murphy, E.C. Modeling conifer tree crown radius and estimating canopy cover. For. Ecol. Manag. 2000, 126, 405–416. [Google Scholar] [CrossRef]
  16. Fu, L.; Sharma, R.P.; Hao, K.; Tang, S. A generalized interregional nonlinear mixed-effects crown width model for Prince Rup precht larch in northern China. For. Ecol. Manag. 2017, 389, 364–373. [Google Scholar] [CrossRef]
  17. Sharma, R.P.; Bílek, L.; Vacek, Z.; Vacek, S. Modelling crown width-diameter relationship for Scots pine in the central Europe. Trees 2017, 31, 1875–1889. [Google Scholar] [CrossRef]
  18. Qiu, S.; Liang, R.; Wang, Y.; Luo, M.; Sun, Y. Comparative analysis of machine learning algorithms and statistical models for predicting crown width of Larix olgensis. Earth Sci. Inform. 2022, 15, 2415–2429. [Google Scholar] [CrossRef]
  19. Raptis, D.; Kazana, V.; Kazaklis, A.; Stamatiou, C.A. Crown Width-Diameter Model for Natural Even-Aged Black Pine Forest Management. Forests 2018, 9, 610. [Google Scholar] [CrossRef]
  20. Di Salvatore, U.; Marchi, M.; Cantiani, P. Single-tree crown shape and crown volume models for Pinus nigra J. F. Arnold in central Italy. Ann. For. Sci. 2021, 78, 76. [Google Scholar] [CrossRef]
  21. Ebiś, M. Structure of the Biomass of the Scots Pine; PWN: Warszawa, Poland, 2001; p. 158. ISBN 83-01-13380-5. (In Polish) [Google Scholar]
  22. Pretzsch, H.; Biber, P.; Dursky, J. The single tree-based stand simulator SILVA: Construction, application and evaluation. For. Ecol. Manag. 2002, 162, 3–21. [Google Scholar] [CrossRef]
  23. Leites, L.P.; Robinson, A.P.; Crookston, N.L. Accuracy and equivalence testing of crown ratio models and assessment of their impact on diameter growth and basal area increment predictions of two variants of the Forest Vegetation Simulator. Can. J. For. Res. 2009, 39, 655–665. [Google Scholar] [CrossRef]
  24. Jucker, T.; Caspersen, J.; Chave, J.; Antin, C.; Barbier, N.; Bongers, F.; Dalponte, M.; van Ewijk, K.Y.; Forrester, D.I.; Haeni, M.; et al. Allometric equations for integrating remote sensing imagery into forest monitoring programmes. Glob. Change Biol. 2016, 23, 177–190. [Google Scholar] [CrossRef] [PubMed]
  25. Sporek, M. The Leaf Area of Scots Pine (Pinus sylvestris L.) as a Function of the Population Structure; PWN: Warszawa, Poland, 2018; p. 208. ISBN 978-83-01-20366-5. (In Polish) [Google Scholar]
  26. Gonzalez-Benecke, C.A.; Gezan, S.A.; Samuelson, L.J.; Cropper, W.P.; Leduc, D.J.; Martin, T.A. Estimating Pinus palustris tree diameter and stem volume from tree height, crown area and stand-level parameters. J. For. Res. 2014, 25, 43–52. [Google Scholar] [CrossRef]
  27. Monserud, R.A.; Sterba, H. Modeling individual tree mortality for Austrian forest species. For. Ecol. Manag. 1999, 113, 109–123. [Google Scholar] [CrossRef]
  28. Hasenauer, H.; Monserud, R.A. A crown ratio model for Austrian forests. For. Ecol. Manag. 1996, 84, 49–60. [Google Scholar] [CrossRef]
  29. Pretzsch, H.; Schutze, G. Crown allometry and growing space efficiency of Norway spruce (Picea abies L. Karst.) and European beech (Fagus sylvatica L.) in pure and mixed stands. Plant. Biol. 2005, 7, 628–639. [Google Scholar] [CrossRef]
  30. Valentine, H.T.; Ludlow, A.R.; Furnival, G.M. Modeling crown rise in even-aged stands of Sitka spruce or loblolly pine. For. Ecol. Manag. 1994, 69, 189–197. [Google Scholar] [CrossRef]
  31. Kuprevicius, A.; Auty, D.; Achim, A.; Caspersen, J.P. Quantifying the influence of live crown ratio on the mechanical properties of clear wood. Forestry 2014, 87, 449–458. [Google Scholar] [CrossRef]
  32. Navratil, S. Wind damage in thinned stands. In Proceedings of the a Commercial Thinning Workshop, Whitecourt, AB, Canada, 17–18 October 1997; pp. 29–36. [Google Scholar]
  33. Monserud, R.A.; Sterba, H. A basal area increment model for individual trees growing in even- and uneven-aged forest stands in Austria. For. Ecol. Manag. 1996, 80, 57–80. [Google Scholar] [CrossRef]
  34. Russell, M.; Weiskittel, A. Maximum and Largest Crown Width Equations for 15 Tree Species in Maine. North. J. Appl. For. 2011, 28, 84–91. [Google Scholar] [CrossRef]
  35. Assmann, E. The Principles of Forest Yield Study; Pergamon Press: Oxford, UK, 1970; p. 506. [Google Scholar]
  36. Baldocchi, D.; Penuelas, J. The physics and ecology of mining carbon dioxide from the atmosphere by ecosystems. Glob. Change Biol. 2019, 25, 1191–1197. [Google Scholar] [CrossRef]
  37. Sporek, M.; Sporek, K.; Stebila, J.; Kučerka, M.; Kminiak, R.; Lubis, M.A.R. Assessment of the mass and surface area of the Scots pine (Pinus sylvestris L.) needles. Appl. Sci. 2022, 12, 8204. [Google Scholar] [CrossRef]
  38. Gardiner, B.A.; Peltola, H.; Kellomaki, S. Comparison of two models for predicting the critical wind speed required to damage coniferous trees. Ecol. Mod. 2000, 129, 1–23. [Google Scholar] [CrossRef]
  39. Pallardy, S.G. Physiology of Woody Plants, 3rd ed.; Academic Press: Cambridge, MA, USA, 2010; p. 453. [Google Scholar]
  40. Mátyás, C.; Varga, G. Effect of intra-specific competition on tree architecture and aboveground dry matter allocation in Scots pine. For. Syst. 2000, 9, 111–119. [Google Scholar] [CrossRef]
  41. Stenberg, P.; Kuuluvainen, T.; Kellomäki, S.; Grace, J.C.; Jokela, E.J.; Gholz, H.L. Crown Structure, Light Interception and Productivity of Pine Trees and Stands. Ecol. Bull. 1994, 43, 20–34. [Google Scholar]
  42. Starr, M.; Saarsalmi, A.; Hokkanen, T.; Merila, P.; Helmisaari, H.S. Models of litterfall production for scots pine (Pinus sylvestris L.) in Finland using stand, site and climate factors. For. Ecol. Manag. 2005, 205, 215–225. [Google Scholar] [CrossRef]
  43. Palahí, M.; Pukkala, T.; Trasobares, A. Modelling the diameter distribution of Pinus sylvestris, Pinus nigra and Pinus halepensis forest stands in Catalonia using the truncated Weibull function. Forestry 2006, 79, 553–562. [Google Scholar] [CrossRef]
  44. Chytrý, M.; Danihelka, J.; Horsák, M.; Kočí, M.; Kubešová, S.; Lososová, Z.; Otýpková, Z.; Tichý, L.; Martynenko, V.; Baisheva, E. Modern analogues from the Southern Urals provide insights into biodiversity change in the early Holocene forests of Central Europe. J. Biogeogr. 2010, 37, 767–780. [Google Scholar] [CrossRef]
  45. Statistical Yearbook of Forestry; Statistics Poland: Warszawa, Poland, 2022. Available online: https://stat.gov.pl (accessed on 3 August 2024).
  46. Institute of Meteorology and Water Management, National Research Institute. Index of Meteorological Data. Available online: https://www.google.pl/url?sa=t&rct=j&q=&esrc=s&source=web&cd=&cad=rja&uact=8&ved=2ahUKEwiU_ofV_ISMAxUjBxAIHRVIBQkQFnoECBQQAQ&url=https%3A%2F%2Fdanepubliczne.imgw.pl%2Fdata%2Fdane_pomiarowo_obserwacyjne%2Fdane_meteorologiczne%2Fmiesieczne%2F&usg=AOvVaw0-j79ccaceKNa6kggpa9Qx&opi=89978449 (accessed on 1 July 2024).
  47. Czarnowski, M.S. Investigation of the potential productive capacity of forest sites as a function of soil, climate and ecological properties of tree species. (A proposal of standardized method for the world-wide gathering action). Acta Univ. Wratisl. Pr. Bot. 1971, 134, 127–151. [Google Scholar]
  48. Szymkiewicz, B. Volume and Increment Stands Tables; PWRiL: Warszawa, Poland, 1961. (In Polish) [Google Scholar]
  49. Montgomery, D.C.; Peck, E.A.; Vining, G.G. Introduction to Linear Regression Analysis; Wiley: New York, NY, USA, 2001; p. 641. [Google Scholar]
  50. Reineke, L.H. Perfecting a stand-density index for even-aged forests. J. Agric. Res. 1933, 46, 627–638. [Google Scholar]
  51. Yang, Y.; Huang, S. Two-stage ingrowth models for four major tree species in Alberta. Eur. J. For. Res. 2015, 134, 991–1004. [Google Scholar] [CrossRef]
  52. Pinheiro, J.C.; Bates, D.M. Mixed-Effects Models in S and S-PLUS; Springer: New York, NY, USA, 2000. [Google Scholar]
  53. Gregoire, T.G.; Schabenberger, O.; Barrett, J.P. Linear modelling of irregularly spaced, unbalanced, longitudinal data from permanent-plot measurements. Can. J. For. Res. 1995, 25, 137–156. [Google Scholar] [CrossRef]
  54. Fu, L.; Sun, H.; Sharma, R.P.; Lei, Y.; Zhang, H.; Tang, S. Nonlinear mixed-effects crown width models for individual trees of Chinese fir (Cunninghamia lanceolata) in south-central China. For. Ecol. Manag. 2013, 302, 210–220. [Google Scholar] [CrossRef]
  55. Ojansuu, R.; Maltamo, M. Sapwood and heartwood taper in Scots pine stems. Can. J. For. Res. 1995, 25, 1928–1943. [Google Scholar] [CrossRef]
  56. Uusitalo, J.; Kivinen, V.P. Constructing bivariate dbh/dead-branch distribution of pines for use in sawing production planning. Scand. J. For. Res. 1998, 3, 509–514. [Google Scholar] [CrossRef]
  57. Maltamo, M.; Bollandsås, O.M.; Vauhkonen, J.; Breidenbach, J.; Gobakken, T.; Næsset, E. Comparing different methods for prediction of mean crown height in Norway spruce stands using airborne laser scanner data. Forestry 2010, 83, 257–268. [Google Scholar] [CrossRef]
  58. Pretzsch, H. The Effect of Tree Crown Allometry on Community Dynamics in Mixed-Species Stands versus Monocultures. A Review and Perspectives for Modeling and Silvicultural Regulation. Forests 2019, 10, 810. [Google Scholar] [CrossRef]
  59. del Río, M.; Bravo-Oviedo, A.; Ruiz-Peinado, R.; Condés, S. Tree allometry variation in response to intra- and inter-specific competitions. Trees 2019, 33, 121–138. [Google Scholar] [CrossRef]
  60. Zhu, W.; Liu, Z.; Jia, W.; Li, D. Modelling the Tree Height, Crown base height, and effective crown height of Pinus koraiensis plantations based on knot analysis. Forests 2021, 12, 1778. [Google Scholar] [CrossRef]
  61. Czarnowski, M.S. Outline of Terrestrial Plant Ecology; PWN: Warsaw, Poland, 1989; p. 555. (In Polish) [Google Scholar]
  62. Sporek, K. Length of Trees-Crown as Function of Structure of Scots Pine Even-Aged Forest Stands; PWN: Warszawa, Poland, 1990; p. 31. ISBN 83-01-10228-4. (In Polish) [Google Scholar]
  63. Rodríguez de Prado, D.; San Martín, R.; Bravo, F.; Herrero, C. Potential climatic influence on maximum stand carrying capacity for 15 Mediterranean coniferous and broadleaf species. For. Ecol. Manag. 2020, 460, 117824. [Google Scholar] [CrossRef]
  64. Vázquez-Veloso, A.; Pando, V.; Ordóñez, C.; Bravo, F. Evaluation and validation of forest models: Insight from Mediterranean and Scots pine models in Spain. Ecol. Inform. 2023, 77, 102246. [Google Scholar] [CrossRef]
Figure 1. Location of the experimental plots (number 1–20) in (a) the regional and (b) the European context. The maps were projected using the QGIS v 3.34.
Applsci 15 03124 g001
Figure 2. Distribution of all the tree diameters at breast height (N = 10,957) across 20 plots. The red line indicates probability density of normal distribution function with expected value estimated by arithmetic mean and standard deviation in population estimated by standard deviation in sample.
Applsci 15 03124 g002
Figure 3. Variability of breast height diameter of pine stands on 20 plots (n = 10957). On the X-axis: experimental plot number (1–20); basal area (BA, m2·ha−1); number of trees in the plot [trees 0.25 ha−1] and stand age [years].
Applsci 15 03124 g003
Figure 4. The relationship between: (a) density index and empirical crowns length (b) diameter at breast height and empirical crowns length; (c) height and empirical crowns length; (d) density index and calculated crowns length (e) diameter at breast height and calculated crowns length; (f) height and calculated crowns length. The red line represent the logarithmic regression (a,d) and linear regression (b,c,e,f) describing the relationship between the respective explanatory variable and the response. Biometrics for 300 sample trees.
Applsci 15 03124 g004aApplsci 15 03124 g004b
Figure 5. The relationship between: (a) density index and mean empirical crowns length (b) mean diameter at breast height and mean empirical crowns length; (c) mean height and mean empirical crowns length; (d) density index and mean calculated crowns length (e) mean diameter at breast height and mean calculated crown length; (f) mean height and mean calculated crowns length. The red line represent the linear regression describing the relationship between the respective explanatory variable and the response.
Applsci 15 03124 g005aApplsci 15 03124 g005b
Figure 6. The relationship between: (a) empirical crowns length ( C L e m p ) and calculated ( C L c a l ) (for 300 Pinus sylvestris L. model trees); (b) empirical crowns length ( C L e m p ) a calculated ( C L c a l ) (for 20 stands of Pinus sylvestris L.). The red line represent the linear regression describing the relationship between the respective explanatory variable and the response.
Applsci 15 03124 g006
Table 1. Stands and sample trees data used to verify the crown length model.
VariablesModel Validation Data
Mean ± SD (Range Min–Max)
Stands
Total number of the sample plots20
Total number of trees per sample plots10 957
Age of stands (years)34.65 ± 2.78 (28–40)
Number of trees per ha ( N , ha)2191± 452 (1224–3132)
Number of trees per sample plot ( N , 0.25 ha)547.85 ± 112.96 (306–783)
Stand basal area ( B A , m2 ha−1)27.77 ± 6.43 (16.69–40.66)
Diameter at breast height ( D B H , cm)12.29 ± 3.24 (9–32)
Sample trees
Number of trees cut down ( N , pcs.)300
Height of cut trees ( H , m)13.99 ± 2.67 (8.33–19.79)
Diameter at breast height ( cut   trees )   ( D B H , cm)13.27 ± 2.75 (9.0–21.0)
Diameter of the trees at ground height ( D G H = D B H + 1.7 ; cm)14.97 ± 2.75 (10.7–22.7)
Crowns length ( C L , m)5.12 ± 1.11 (2.31–8.63)
Table 2. The Spearman rang correlation between empirical crowns length, calculated crowns length, diameter at breast height, height and density index of 300 sample trees. Statistically significant results for p < 0.05.
C L e m p C L c a l D B H H D I
(m)(m)(cm)(m)(-)
C L c a l (m)0.8567
D B H (cm)0.75030.9352
H (m)0.67890,92270.7868
D I (–)−0.9273−0.6129−0.4942−0.3975
C L e m p , empirical crowns length; C L c a l , calculated crowns length; D B H , diameter at breast height (1.3 m above ground level); H , trees height; D I , density index (actual number of trees per ha/normative number of trees (taken from Tables of Stands Volume and Increment [48]).
Table 3. Summary statistics and determination of the performance of the allometric crowns length ( C L c a l ) model ( N = 300 trees measured on 20 plots).
Number of Plots Mean   D G H Mean   H DIMean
C L e m p
Mean
C L c a l
RMSEDivergenceR2 N
(cm)(m)(-)(m)(m)(m)(%)(-)(Trees ha−1)
117.4717.410.985.655.570.011.420.812004
217.7017.401.005.585.580.000.000.722064
317.3018.230,965.835.640.043.260.771596
417.3416.460.965.685.500.033.170.792672
512.499.611.064.164.370.045.150.812376
613.7411.631.084.404.690.086.530.791224
715.8214.480.935.575.230.126.100.661416
815.8315.790.876.095.390.4911.490.852100
915.0515.581.045.025.180.033.270.772072
1018.0916.570.906.155.610.295.530.641868
1118.1117.180.906.235.660.3211.240.791876
1213.0312.951.084.454.750.096.780.692692
1312.6711.231.004.604.600.000.000.722388
1413.6312.361.014.774.800.000.550.762100
1513.4312.591.024.714.790.011.670.742664
1612.0310.301.163.834.360.2813.760.812388
1713.0912.930.955.034.830.043.980.722384
1813.2311.141.014.594.630.000.810.832212
1914.6313.941.054,805.010.044.300.713132
2014.7014.060.975.185.060.012.320.882600
Mean14.9714.091.005.125.060.314.570.762191
D G H , average diameter of the trees at the ground level; H , average trees height; D I , density index C L e m p , average empirical crowns length; C L c a l , average calculated crowns length; R2, the determination factor relates to: C L e m p - C L c a l .
Table 4. The Spearman rank correlation between averaged values of biometric parameters ( C L e m p , C L c a l , D B H , H , D I ) on 20 plots. Statistically significant results for p < 0.05.
C L e m p C L c a l D B H H D I
(m)(m)(cm)(m)(−)
C L c a l (m)0.9549
D B H (cm)0.90380.9549
H (m)0.89470.96690.9128
D I (−)−0.8874−0.7390−0.6719−0.6350
C L e m p , empirical crowns length; C L c a l , calculated crowns length; D B H , diameter at breast height (1.3 m above ground level); H , trees height; D I , density index (actual number of trees per ha/normative number of trees (taken from Tables of Stands Volume and Increment [48]).
Disclaimer/Publisher’s Note: The statements, opinions and data contained in all publications are solely those of the individual author(s) and contributor(s) and not of MDPI and/or the editor(s). MDPI and/or the editor(s) disclaim responsibility for any injury to people or property resulting from any ideas, methods, instructions or products referred to in the content.

