1. Introduction
During winter, when freshly cut wood is stored outdoors at sub-zero temperatures, the free water inside it freezes, which directly influences its physical properties. The freezing of water in the wood causes significant changes, such as the contraction of cell walls and increased rigidity due to ice expansion in the cell lumen. In addition, the movement of extractives during freezing can contribute to strengthening the cell structure [
1]. As the water solidifies into ice and expands (increasing in volume between 4 °C and 0 °C) within the lumen, it creates compressive stress on the cell wall. This, along with moisture loss, leads to a higher cell stiffness [
2,
3]. Previous studies have investigated the effects of freezing and heating cycles on different wood species, such as
Eucalyptus grandis and
Hovenia dulcis, highlighting changes in weight, density and dimensional stability [
4,
5]. However, the impact of wood thickness on these processes is still poorly understood, especially concerning the dynamics of thawing and heating of free water. Another article that was published was concerned with the analysis of the physical properties of wood of two species, pink rubber tree (
Eucalyptus grandis) and
Gympie mesquite (Eucalyptus Cloeziana), where samples were exposed to freezing at −22 °C for 72 h, followed by heating at 180 to 200 °C for 3.5 h. Measurements of mass loss, density, and equilibrium moisture content were taken to assess the behaviour, with results showing that the freezing phase reduced mass loss and increased moisture content. In contrast, the heating phase had the opposite effect. Another study put forward the impact of freeze–heat treatments [
5,
6] was also explored on Japanese Raisintree (
Hovenia dulcis Thunb.) wood, where freezing at −22 °C for 24 h and heating at 180 °C for 3.5 h led to improved dimensional stability and water repellence, increasing by up to 14%. Due to very little information on the effect of thickness on the thawing process, we have found articles that analyse the effect of the potential of freeze–heat treatments to improve the even physical properties of different wood species and also fast-growing wood species [
4,
5,
7]. Based on the cited work that dealt with the thawing process, it was carried out on wood teak wood (
Tectona grandis where the authors, in addition to the analysis of the thawing process, also evaluated colour changes and contact angle through the colourimetric space (L, a, b)) with the wettability at −16 °C for 24 and 48 h. The results showed that pre-freezing reduced brightness and decreased the L* value, with colour changes (ΔE) of 5.65 after 24 h and 7.16 after 48 h. Additionally, longer pre-freezing times reduced the wood’s wettability, as indicated by a lower k-value and an increased contact angle. This suggests that additional treatment may be needed to improve wettability when using wood as a raw material. Other research [
8] focused on assessing certain mechanical properties of spruce wood (
Picea abies L.) after freezing green timber boards under various conditions. The study investigated the effects of freezing rates and the duration of exposure to low temperatures by simulating three distinct freezing scenarios that might occur during winter when green timber is stored outside. Results indicated that a rapid freezing rate of −10 °C/h did not affect the wood’s strength. In contrast, slow freezing at −1 °C/h significantly compromised all mechanical properties, notably reducing the modulus of rupture (MOR) and modulus of elasticity (MOE) by 20–30%, Janka hardness by 18%, and tensile strength by 10%. Additionally, longer exposure times involving freezing and thawing cycles due to natural temperature changes led to further decreases in MOR, MOE, and compressive strength (up to 37%). In contrast, tensile strength, shear strength, and hardness remained largely unaffected. The authors of [
9] put forward relevant information about the effects of freezing temperatures (−20, −40, −78.5, and −196 °C) on the impact bending strength and Shore-D hardness of beech, Scotch pine, fir, and spruce wood, compared to non-frozen wood (+20 °C). Freezing increased the impact bending strength in softwoods but reduced it in hardwoods, with beech showing a 30.6% decrease at −196 °C. Softwoods, however, maintained good strength under freezing, making them suitable for low-temperature environments. Shore-D hardness increased for all species as temperatures dropped, with hardwood showing the highest gains. Both wood species and temperature significantly affected impact bending strength and hardness (
p < 0.05). Only a few studies address the freezing rate used, which is an essential factor to consider because it influences the size of the ice crystals that form during the freezing process. A gradual decrease in temperature results in the formation of fewer but larger crystals, whereas rapid freezing produces smaller crystals [
10,
11].
The present article focuses on the influence of pine wood thickness on the freezing and heating processes, especially on the thawing and non-stationary heating phases in humid air. The objective is to calculate the thawing and heating times, comparing them with experimental data and values used in hot air drying. The relevance of these factors is directly linked to the optimisation of the drying process and the final quality of the wood
2. Materials and Methods
This research was carried out on pine wood (
Pinus sylvestris L.), which was taken from the forest of the University Forestry Enterprise of the Technical University of Zvolen. Two groups of test specimens were prepared with different thicknesses. One group had a thickness of 30 mm and the other 50 mm. The width of the specimens was 120 mm, and the length was 500 mm. The samples were from the sapwood zone, and the angle of the growth rings was from 60 to 90° (radial samples). Moisture content was measured on each sample using the weighting method according to STN EN 49 0103 [
12] and absolute dry density according to STN EN 49 0108 [
13]. The samples were not conditioned, but samples that had an initial moisture content in the range of 80 ± 1% were selected for experimental measurements. Wood density was measured, and samples whose density was ±1.5 kg·m
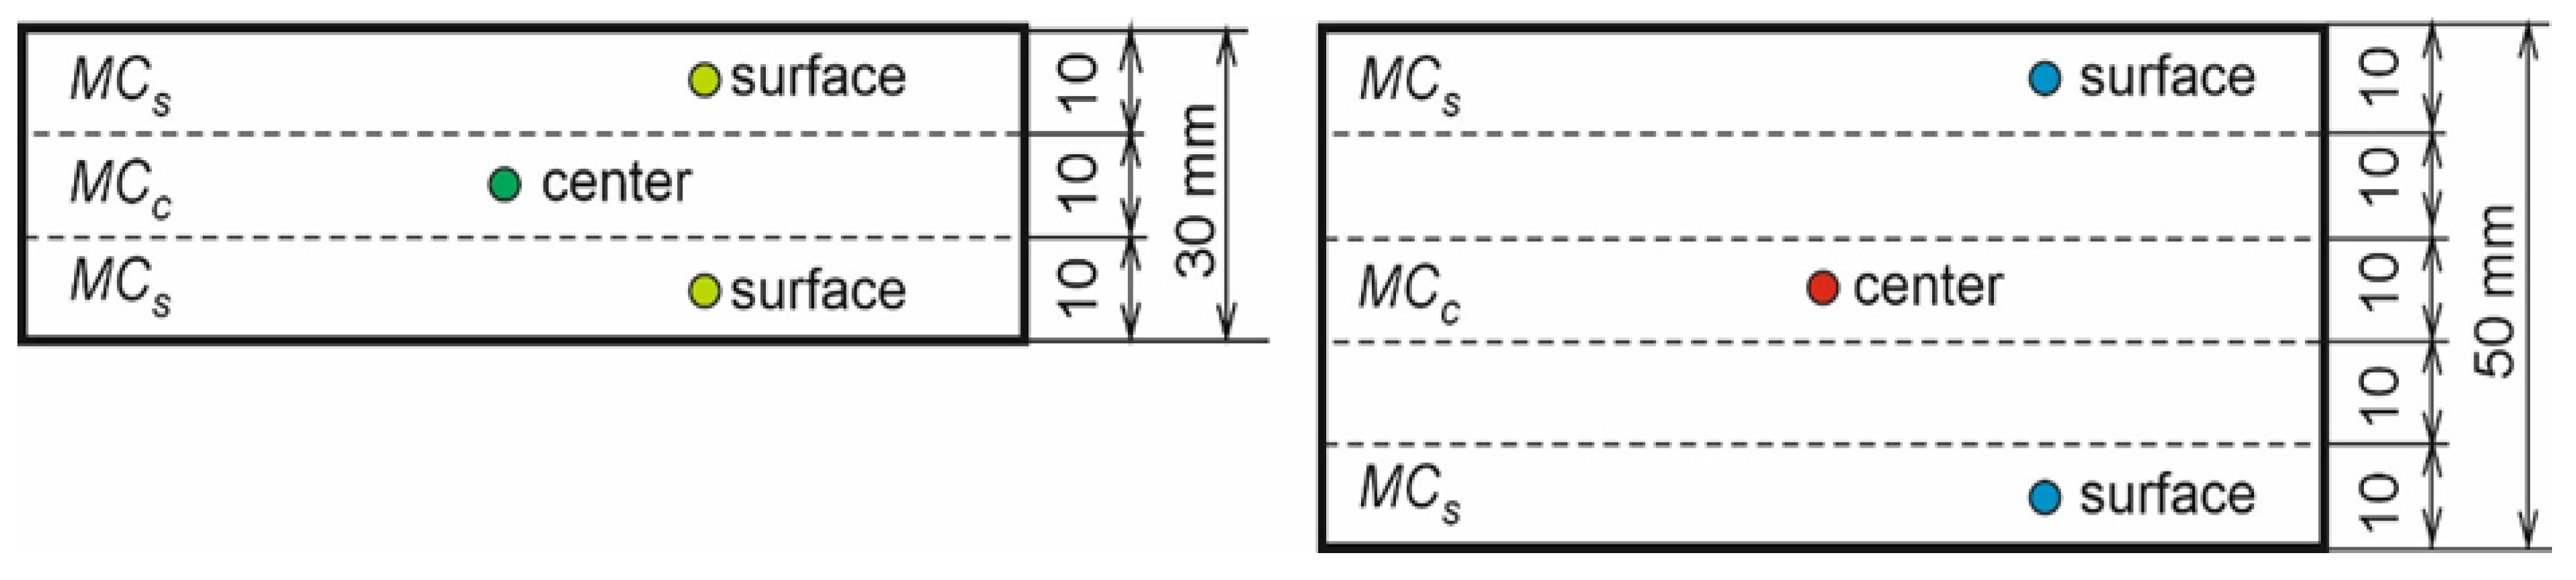
−3 from the median value of all samples were used for experimental measurements. The moisture distribution over the thickness of the samples (moisture gradient) was measured before the freezing process and before and after heating the samples. For 30 mm sample thickness, the sample was divided into three parts for moisture gradient determination and into five parts for 50 mm thickness (
Figure 1). The moisture content of the slices was determined according to STN EN 49 0103 [
12], and the moisture gradient (Δ
MC) was calculated according to Equation (1):
where
MCc is the moisture content of the centre layer (%), and
MCS is the moisture content of the surface layer (%).
The wood temperature was measured in selected samples. The temperature was measured with T-type (Cu-CuNi) thermocouples connected to a Comet MS6R measuring unit from COMET SYSTEM, Ltd., Rožnov pod Radhoštěm, Czech Republic.
The placement of thermocouples in the samples was performed in a zone corresponding to half of the thickness of the slice to measure the moisture gradient on the surface of the samples and in half of the thickness of the samples (
Figure 1). Thermocouples were placed from the lateral side of the samples and at mid-length.
2.1. Freezing Process
The samples were placed in a modified Whirlpool AFG6 freezer (Benton Harbor, MI, USA) where the ambient temperature was constant at −25 ± 0.3 °C. Such temperature is usually in the winter months in central and northern parts of Slovakia. It is a low temperature that does not occur today for a long time during the winter season. That is why the freezing time of 24 h was chosen. Such conditions are not unique and represent a trend of cold but short periods. The aim was also to have both sample thicknesses at approximately the same temperature after freezing. Future monitoring under conditions of higher ambient temperatures and longer exposure times would be of interest. The temperature in the box and the samples was measured at an interval of 1 min. The samples were stored in the box until the measured temperature in the wood had stabilised. Then, the average moisture content and the moisture gradient of the samples were measured and stabilised.
2.2. Heating Process
After the freezing process, moisture content and moisture gradient were measured in the samples, and then samples were transferred to a Memmert HCP 240 humidity chamber (Eagle, WI, USA) where heating processes were carried out. The time between removing the samples from the freezer box and starting the heating process was within 15 min. Thermocouples were not removed from the samples. The environmental parameters were the same for both sample thicknesses. Temperature t = 70 ± 0.1 °C, relative humidity φ = 87 ± 1% and air velocity v = 1.5 m·s−1. The heating parameters were determined according to ON 49 0651 for pine tree species and wood moisture content greater than 60%. These are the standard parameters in practical use, where the psychrometric difference during heating is 3 °C. The heating time was also set according to this standard. For the 30 mm thick specimens, it was 6 h, and for the 50 mm thick specimens, it was 10 h. The times were calculated for frozen lumber.
2.3. Calculation of Time to Heat Frozen Samples
Convective heating of wood in a humid air environment can be considered as a non-stationary heat flow mode with boundary conditions of type III. The non-stationary regime is characterised by a variable temperature field in space and time, in the heated or cooled medium.
The mathematical analysis and experimental investigation of the heat transfer process in the calculated equations were applied to the similarity theory. The similarity theory proves that the determined dimensionless complexes of physical quantities (the so-called similarity criteria) have the same numerical values for similar phenomena. For convective heat transfer, the following similarity criteria are the most important:
Fourier criterion (
Fo) characterises the correlations between the rate of change of the temperature field in solids, physical characteristics, and dimensions [
14]. The field of application of this criterion is in the investigation of non-stationary temperature fields during the heating and cooling of a solid.
where
α is the thermal conductivity coefficient (m
2·s
−1),
τ is the heating time (s), and
h is the sample thickness (
m).
The theoretical calculation of the defrosting and heating time to the desired temperature at the centre of the samples was formed for boundary conditions of type III because we assume that Fo ≥ 4.
Biot’s criterion (
Bi) characterises the correlation between the heat transfer on the surface of the surface of the object and the thermal conductivity. When wood is heated in a gaseous environment, the heat transfer coefficient is relatively small, and the surface temperature is always lower than the ambient temperature [
14]. Biot’s criterion was calculated according to the relations:
where
λ is the coefficient of thermal conductivity (W·m
−1·K
−1),
α is the heat transfer coefficient, and
h is the sample thickness (m).
where
ρ is the air density (kg·m
−3),
v is the air velocity (m·s
−1), and ϑ is the dimensionless temperature.
where
ts is the ambient temperature (°C),
tx is the temperature of a given point (°C), and
t0 is the initial temperature of wood (°C).
3. Results and Discussion
The average moisture contents of the samples at each stage of the research and the average dry density values are given in
Table 1.
The average initial moisture contents of the samples were similar. The difference of 2.34% between the 30 and 50 mm samples was insignificant, and similar results were obtained for the average wood density as well. Therefore, the groups of samples could be compared.
The average moisture loss of the samples due to the freezing process was greater for the thicker samples (50 mm), but the difference between the thicknesses compared was only 2.4%. The freezing time was the same for both sample thicknesses, which was 24 h. Moisture loss after defrosting and heating was greater by an average of 7.3% for the thinner samples (30 mm) compared to the 50 mm thick samples.
This occurred because the thinner specimens overheated more quickly throughout their cross-section than the thicker specimens, leading to faster moisture evaporation. These findings are consistent with the research conducted by Szmutku [
8] and Steinhagen [
15], who studied the effects of prolonged exposure to repeated cycles of freezing and thawing due to natural, gradual temperature changes. Their results demonstrated that under slow freezing conditions, the rate of freezing is the key factor that influences the extent of damage caused by the freezing process. Based on the Missio studies [
4,
5], the freezing rate plays a critical role in altering the physical properties of wood, impacting its durability and structural integrity.
Other researchers, Khattabi and Steinhagen [
16], explored the use of pre-freezing as a method to reduce shrinkage-related degradation in collapse-prone wood. Their findings revealed that the formation of ice from free water in the lumen creates significant pressure on the cell walls when moisture levels are high. This pressure drives moisture from the cell walls toward the frozen water in the lumen, effectively mitigating the risk of shrinkage and collapse during the drying process. This process helps maintain the structural integrity of the wood by managing moisture distribution more effectively.
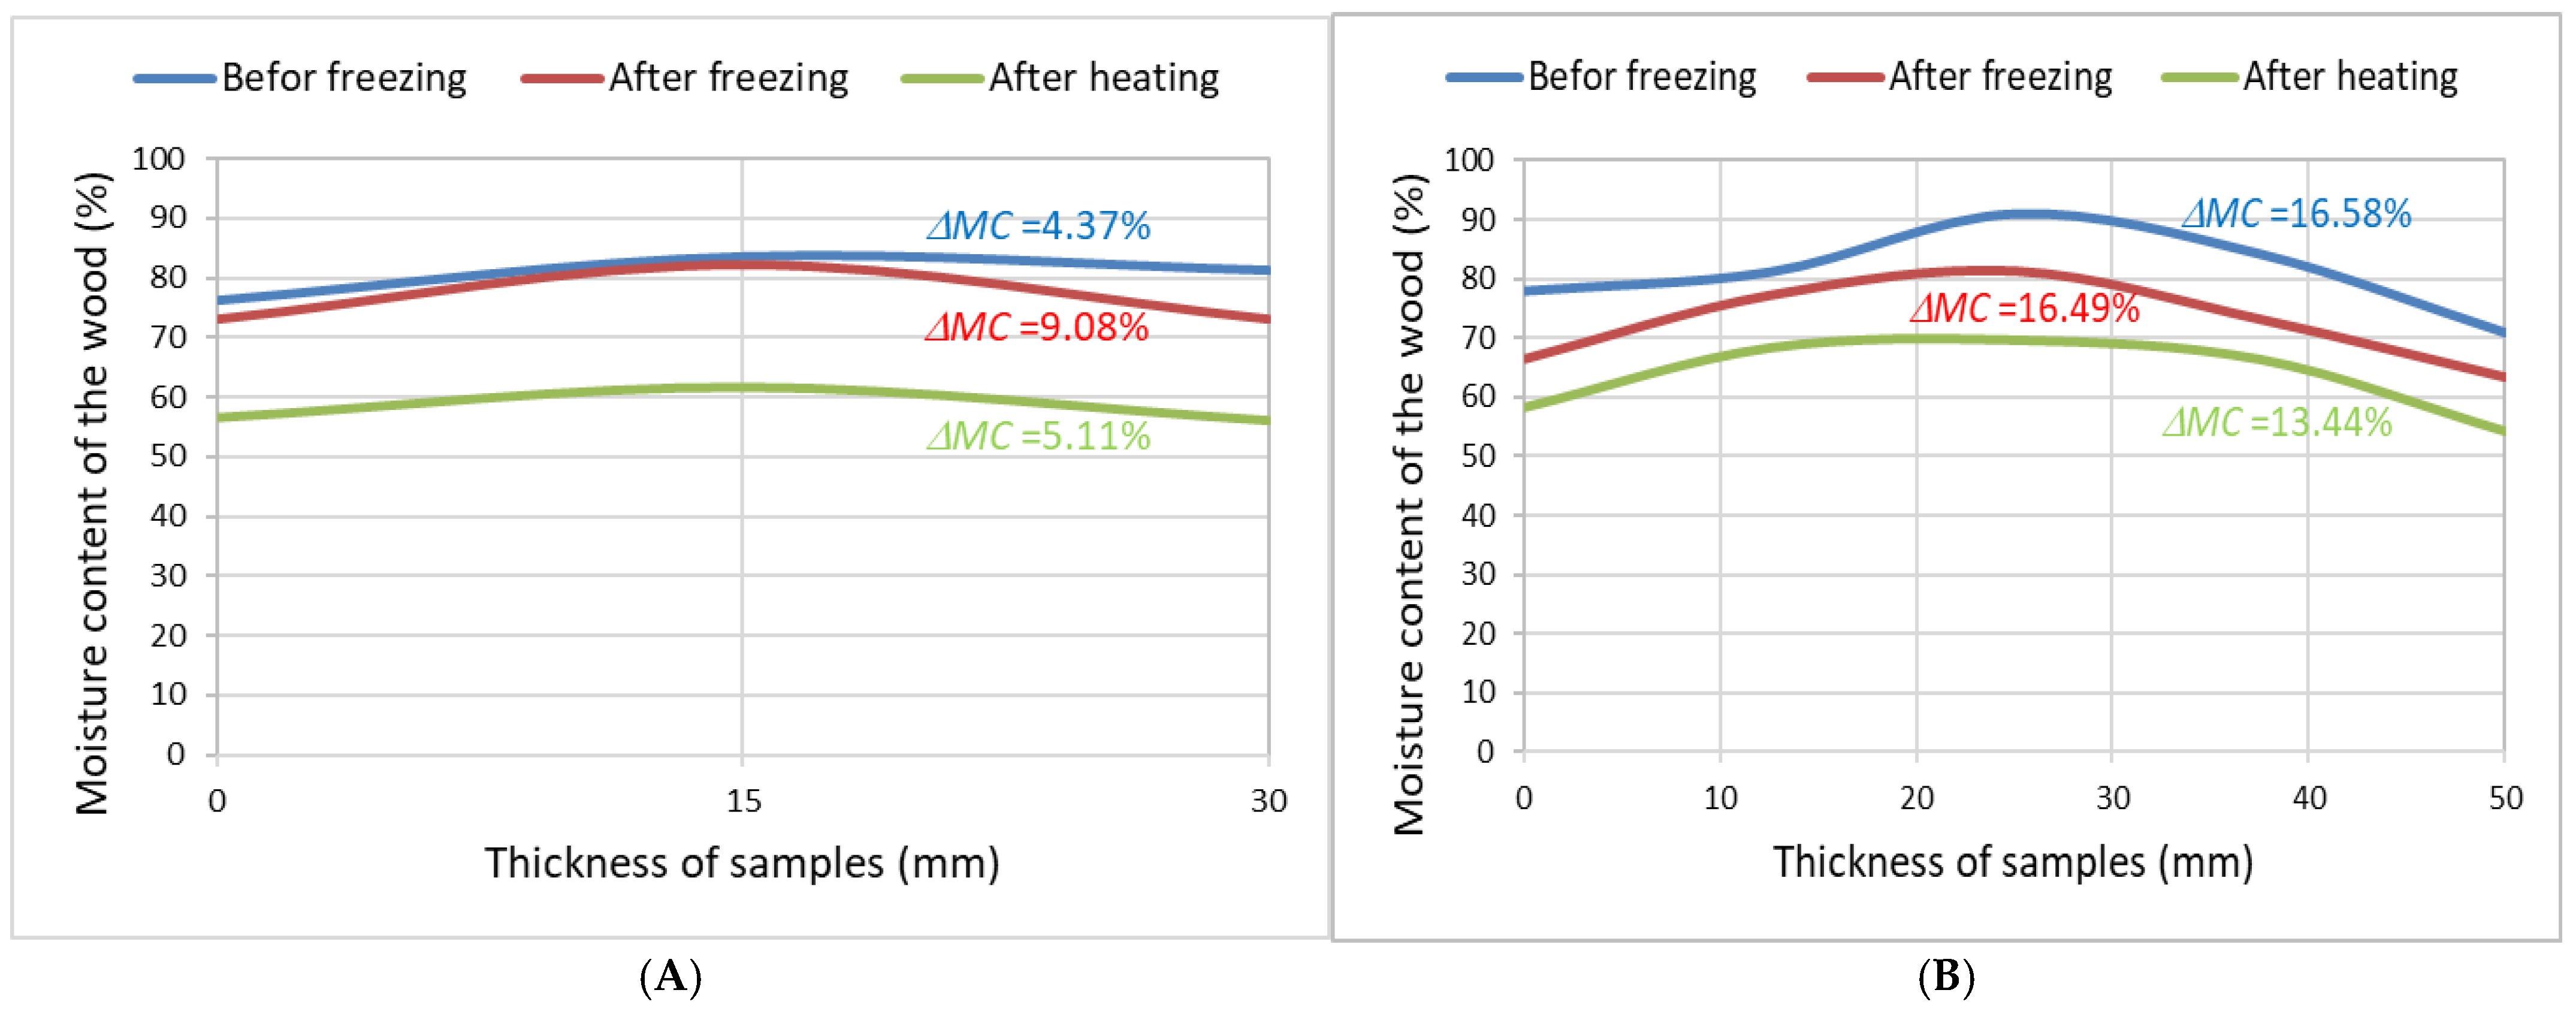
The values of moisture gradients and moisture distribution over the thickness of the samples were measured before and after the freezing process and after the heating of the samples, as shown in
Figure 2.
Higher moisture gradient values were observed for the 50 mm thick samples. The freezing process did not affect the magnitude of the moisture gradient, and the heating process reduced its value by approximately 3%.
The 30 mm thick samples had moisture gradient values that were, on average, 12% smaller than those of the 50 mm thick samples. For the thickness of 30 mm, the freezing process increased the moisture gradient, and the heating process again reduced the differences between the moisture content at the centre and at the surface.
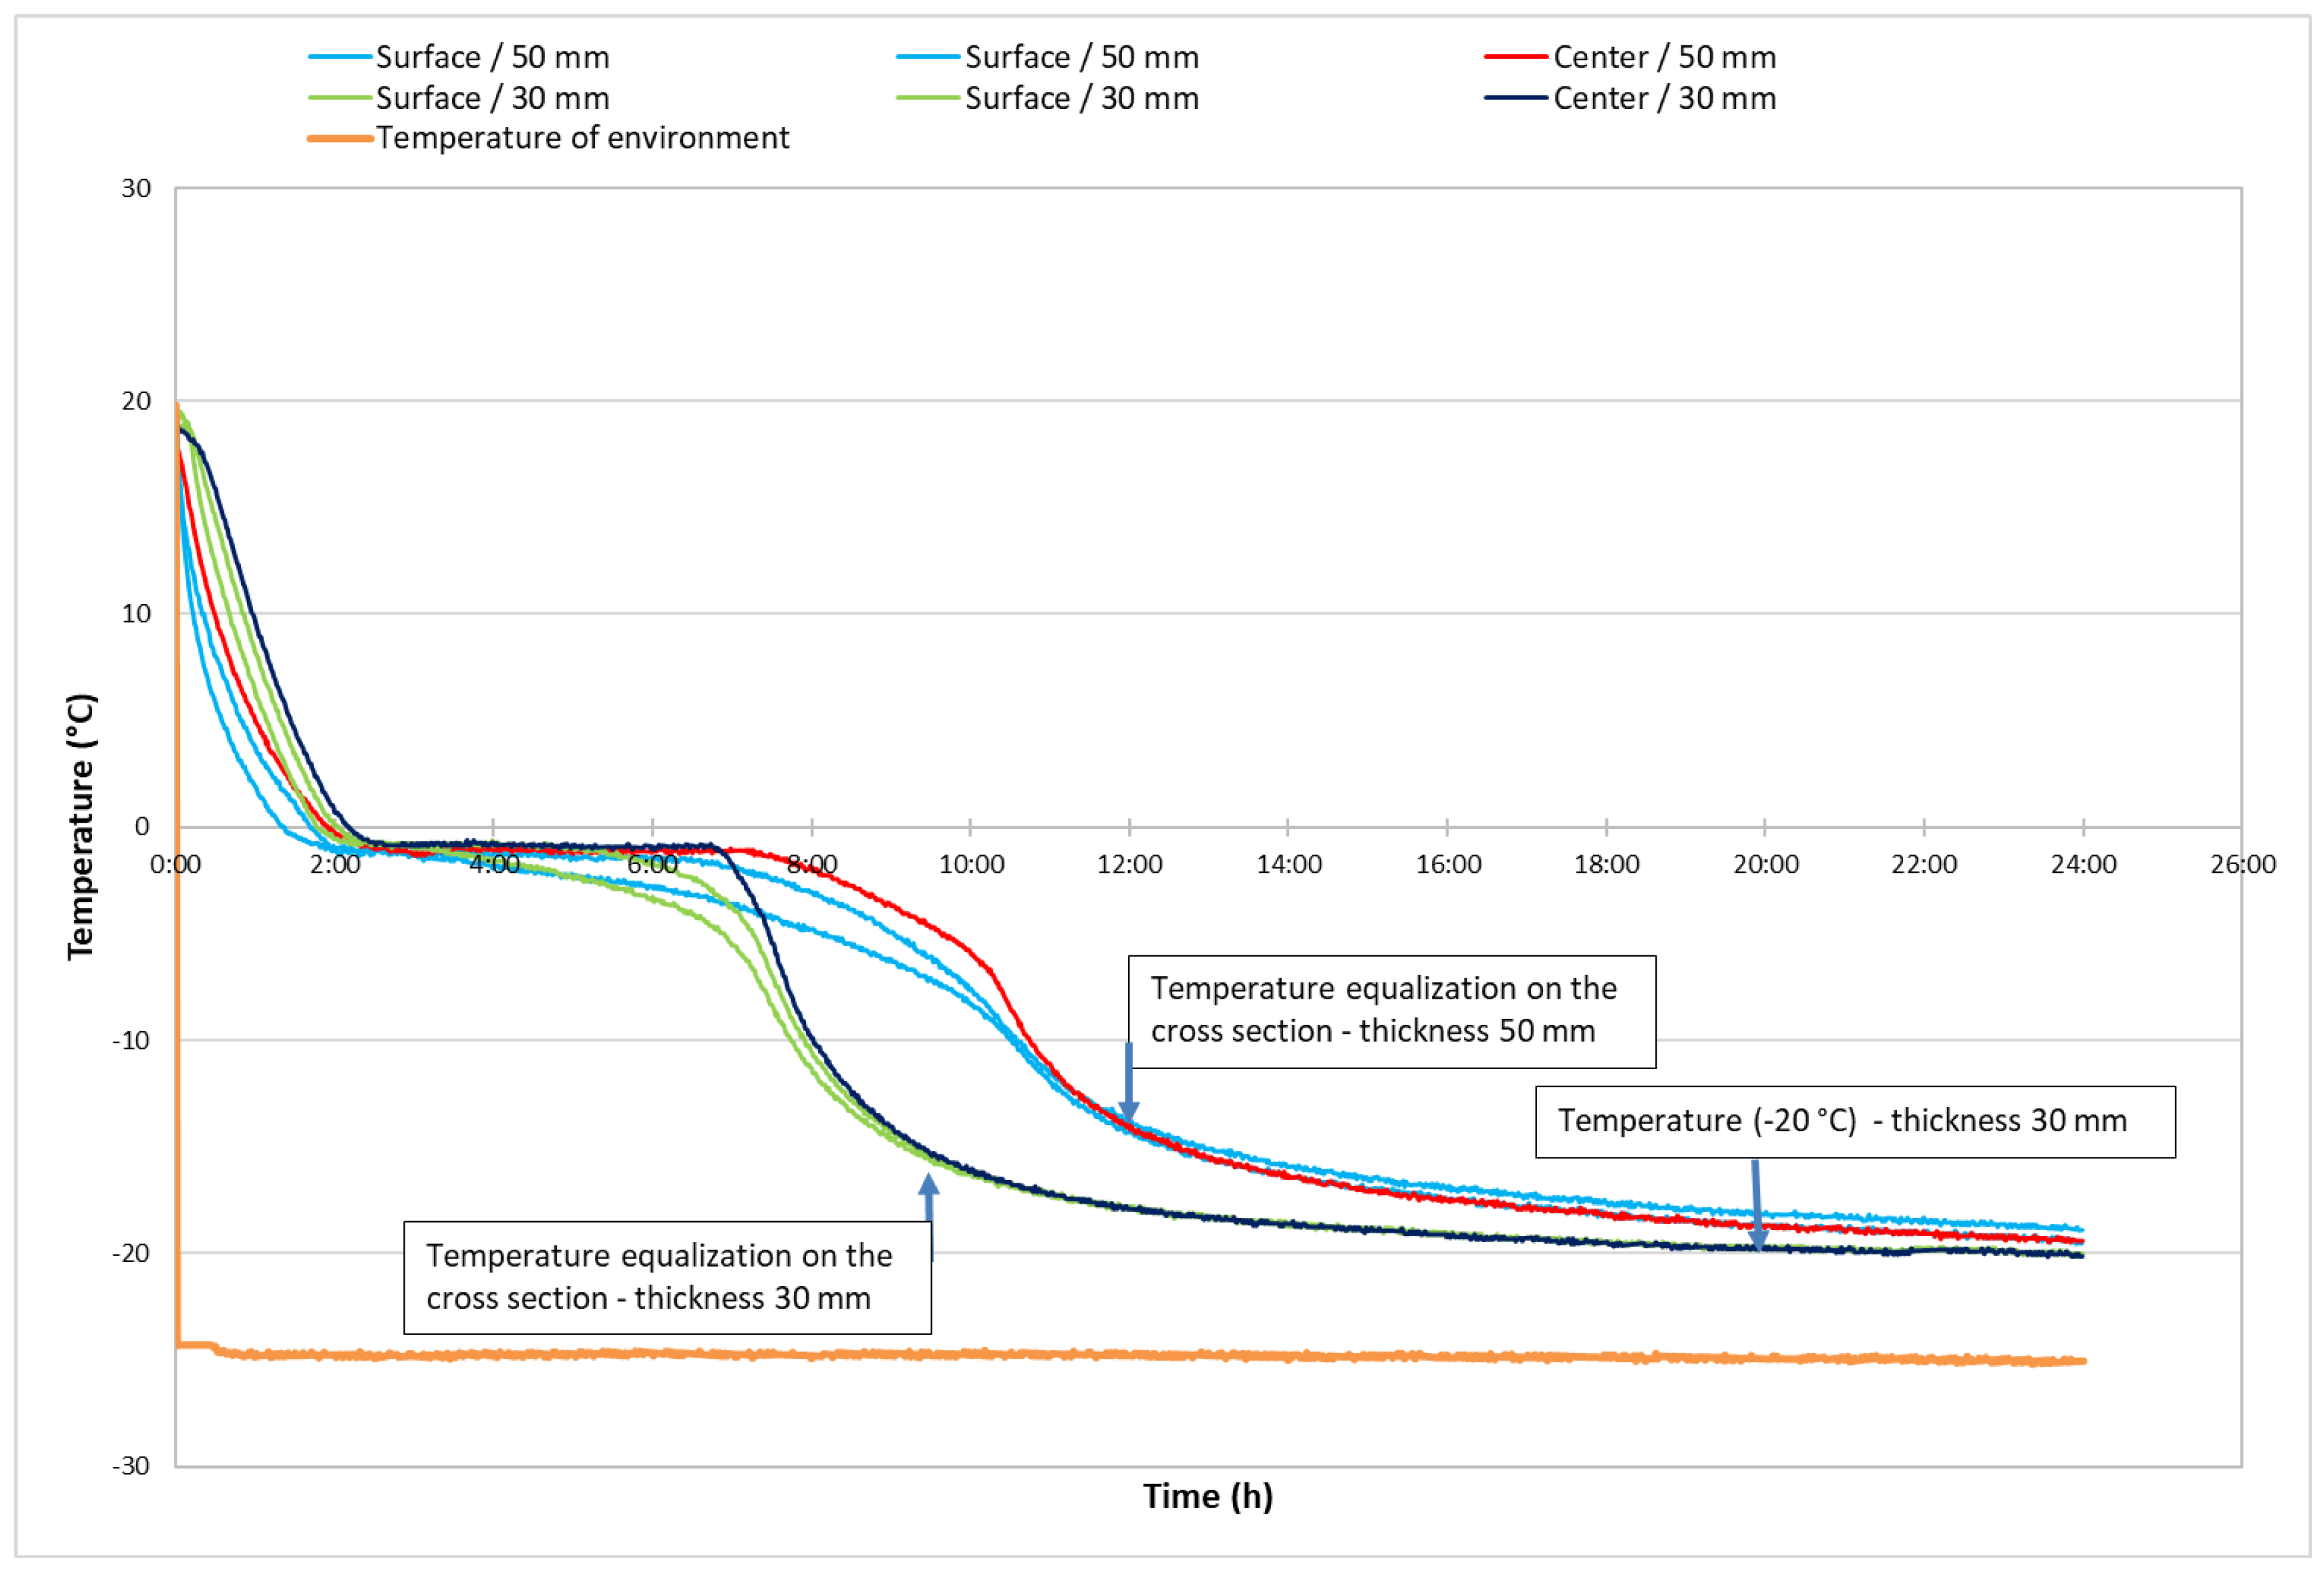
The moisture gradient confirmed a remarkable (directly proportional) effect of sample thickness on the magnitude of the moisture gradient. The time profile of the temperatures measured on the cross-section of the samples during the freezing process is shown in
Figure 3.
The temperature profiles measured in the samples can indicate the impact of the thickness of the samples on the freezing process of the water in the samples. Both groups of samples, after being placed in an environment with a temperature of −25 °C, experienced a rapid decrease in temperature to just below 0 °C. This temperature was reached within 2.5 h.
Figure 3 also shows the temperature distribution across the cross-section of the samples, where the temperature decrease was faster at the surface than in the middle. The temperature distribution is consistent with the moisture distribution on the cross-section of the samples. The temperature difference was greater for the 50 mm thick samples.
In the second section of the temperature curves, the temperature of the samples hardly changed, with a smaller measured temperature gradient for the thinner samples. At this stage, the free water state changes from liquid to solid. The change of state matter was faster for the thinner samples, where temperatures in the centre started to decrease after about 7 h, and for the thicker samples (50 mm) after 7.5 h.
The last section of freezing is also different, where the effect of sample thickness was significant. The 30 mm thick samples had a faster temperature decrease with a gradual equilibration of temperatures between the centre and surfaces of the samples. After 10 h, the temperatures at the centre were identical to those at the surface of the samples. The temperature drop stopped at −20 °C after 19 h.
The process was slower for the 50 mm thick samples, and the temperatures at the cross-section of the samples were equal after 12 h. The temperature of −20 °C was reached only at the end of the measurement, after 24 h. Also, the temperature profile and moisture gradient were larger for the thicker samples. The 30 mm thick samples reached −20 °C slightly earlier, so it was necessary to wait for the 50 mm thick samples to reach −20 °C as well. In the freezing process, we would like both samples to reach the freezing temperature of −20 °C in order to have the same starting point.
The study by Missio [
4] investigated the effects of combining freezing and heating treatments on tropical wood. According to the findings, the two-stage freeze–heat treatment was more effective than heat treatment alone in enhancing properties such as water absorption, hydrophobicity, and impact strength. This improvement was attributed to the selective degradation of hemicelluloses, which influences the wood’s physical and mechanical properties. The combined treatments helped reduce the adverse effects of high temperatures while promoting water loss by increasing the wood’s porosity through freezing.
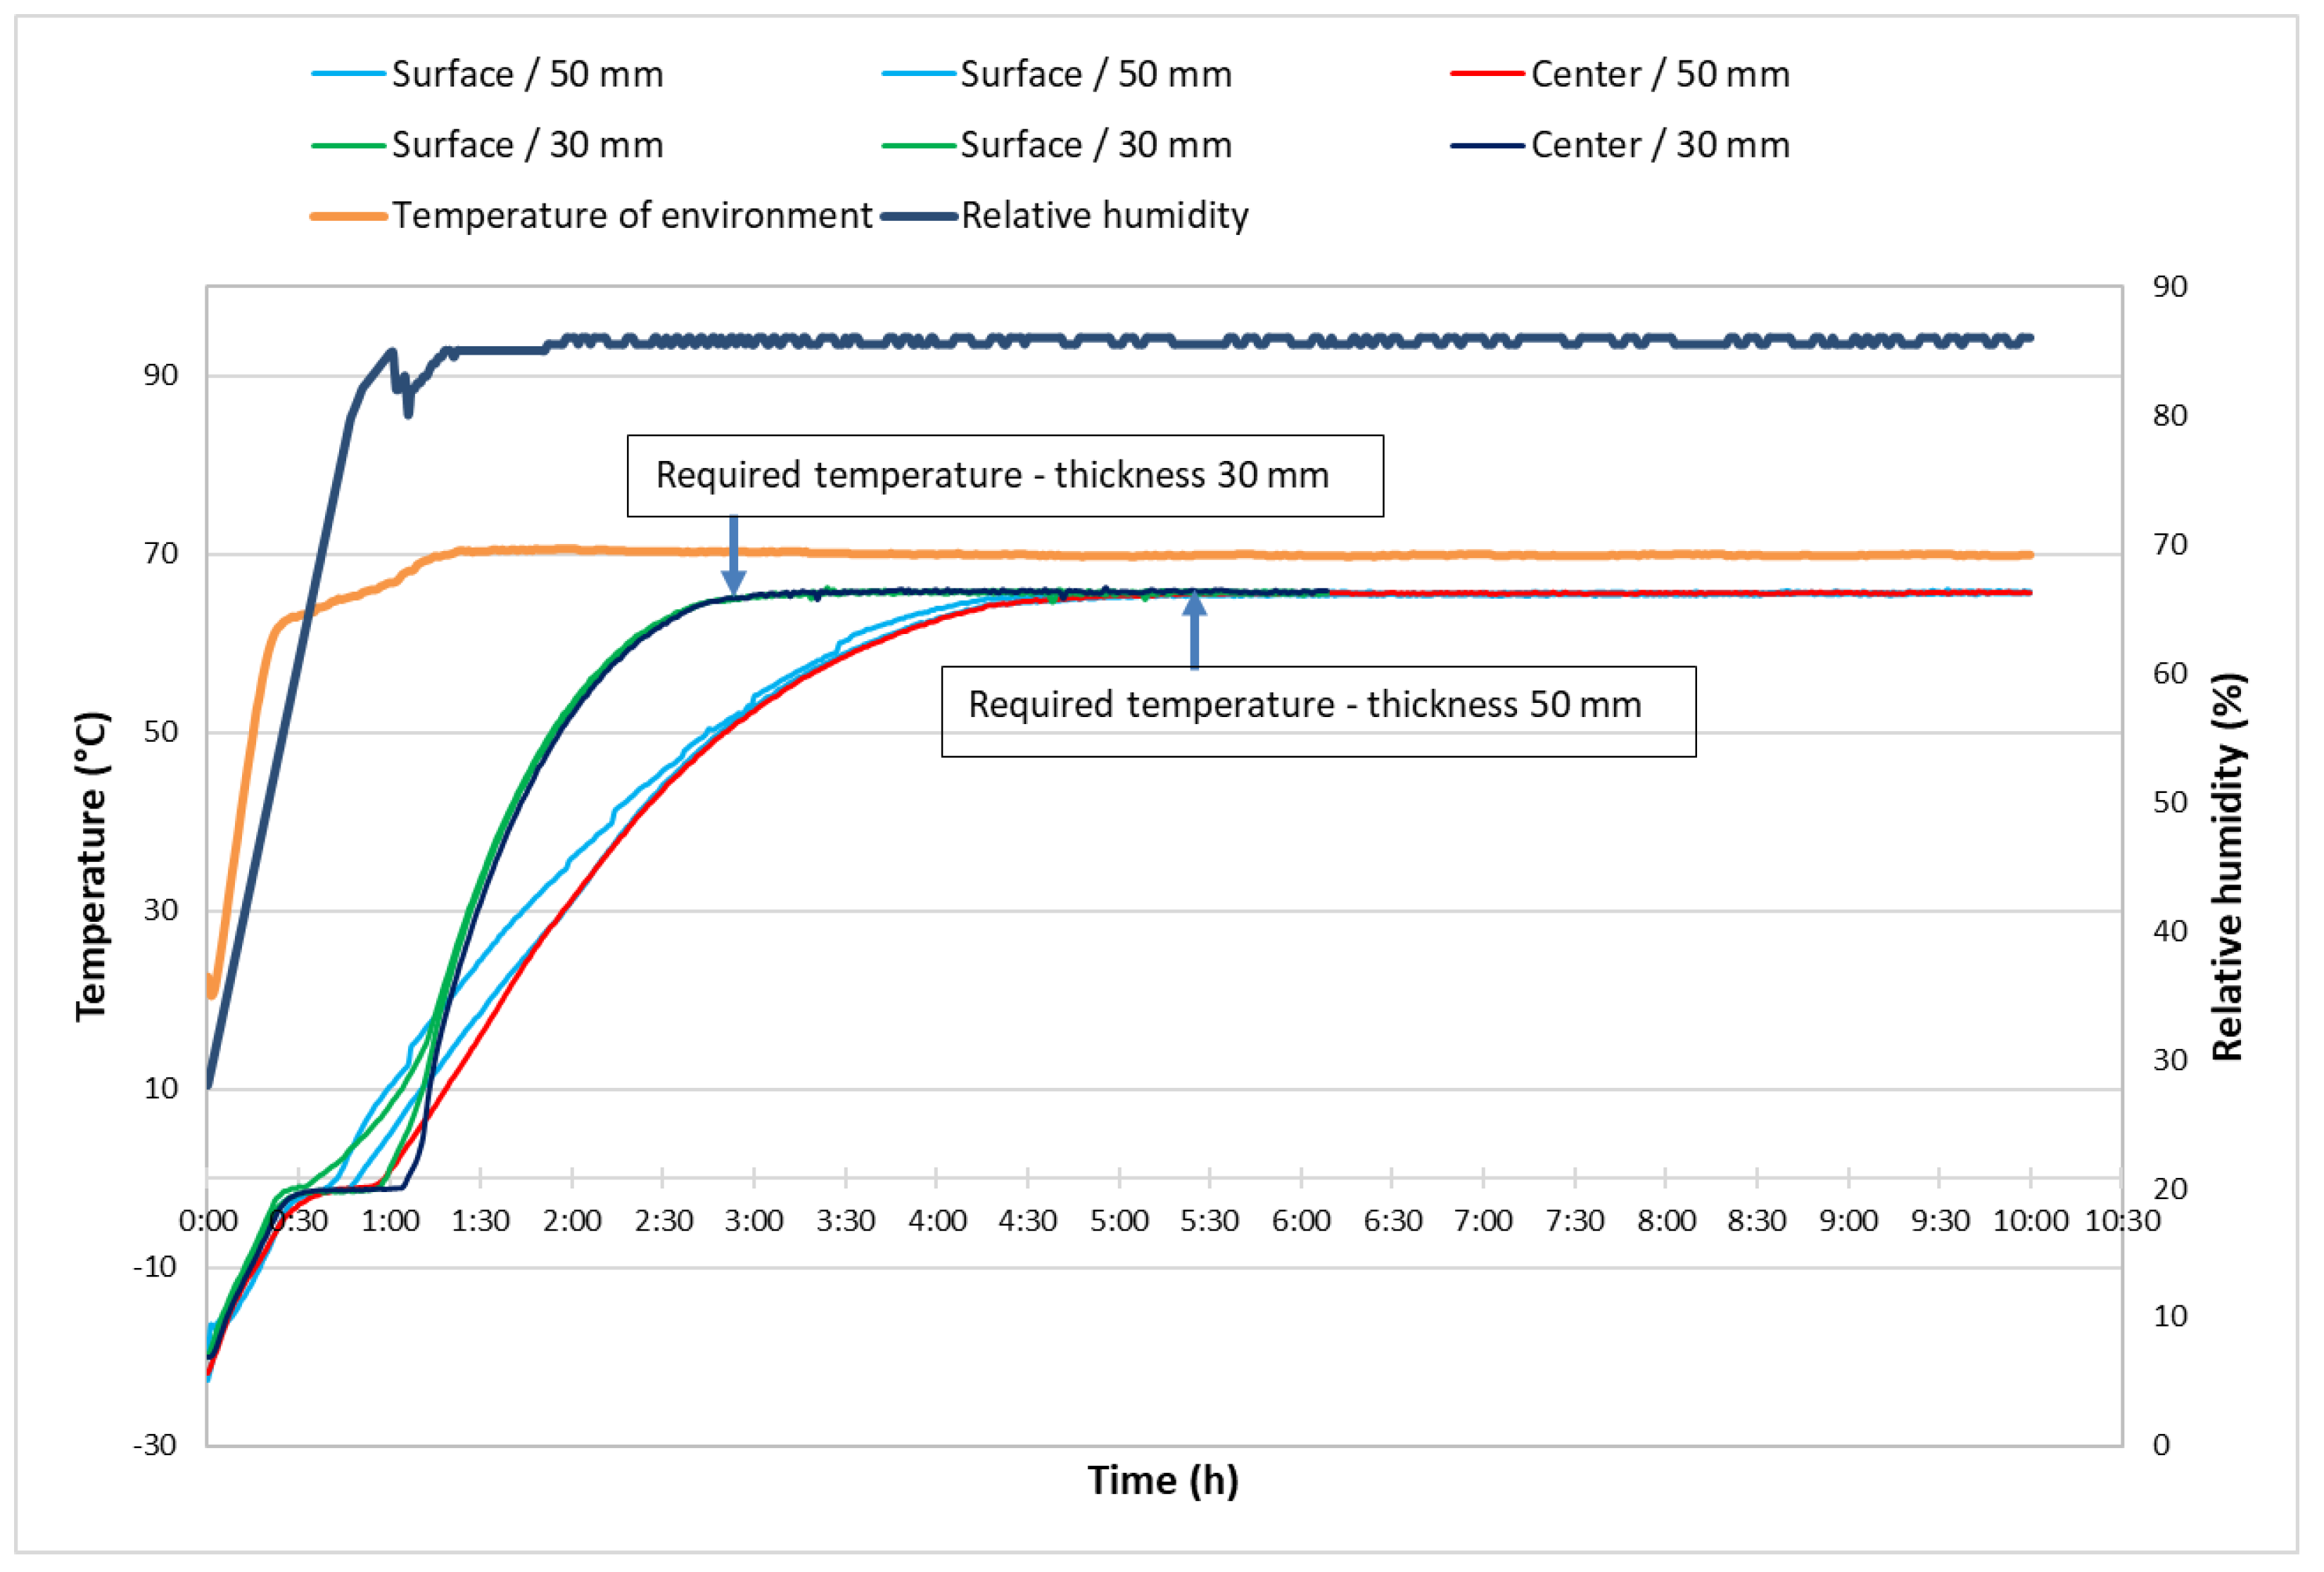
After the freezing process, the samples were transferred to a humidity chamber, where they were heated in a humid air environment.
Figure 4 shows the temperature profile of the samples and the environmental parameters in the chamber.
During the heating of the frozen samples, there was a visible difference in the measured temperatures and their profiles between the 30 and 50 mm thick samples. The defrosting and heating process was faster and with less temperature difference for the thinner samples. The temperature curves can identify three zones. The first zone was an increase in temperature from a negative value (−20 °C) to 0 °C; the second zone was almost no temperature change, where the supplied heat was consumed to change the state of water in the wood. The third zone was a zone of temperature increase until the required temperature of 65 °C was reached. The first two zones were minimally affected by the thickness of the samples. There was a notable difference in the third zone, where thicker samples had a noticeable temperature differential between the surface and the centre, and the temperature increase was slower.
The 30 mm thick samples reached the required temperature after approximately 2:45 h, and the 50 mm thick samples after 5:30 h. Different heating times were not affected by different freezing times but only by the thickness of the samples.
Other research [
8] also found that a rapid freezing rate of −10 °C/h did not negatively impact the wood’s strength. In contrast, slow freezing at a rate of −1 °C/h significantly compromised its mechanical properties. Specifically, the study observed reductions in the modulus of rupture (MOR) and modulus of elasticity (MOE) by 20–30%, a decrease in Janka hardness by 18%, and a reduction in tensile strength by 10%. These findings highlight the critical role of the freezing rate in preserving or diminishing the structural integrity of wood during freezing treatments.
During the heating process, the temperature differential across the cross-section of the samples was more significant for the 50 mm thickness, which corresponded to the larger measured values of the moisture gradient (
Figure 2). Based on the measured temperature data in the samples and the ambient temperature, the time required for defrosting and heating of the 30 and 50 mm thick samples was calculated. The calculated values measured and the heating times determined according to STN EN 49 0651 [
17] are given in
Table 2.
The times required for defrosting and heating were theoretically calculated and were longer than the experimentally measured times. The difference was less for a sample thickness of 50 mm. The prescribed times for heating frozen wood during drying according to ON 49 0651 [
17] for 50 mm thick samples were almost identical to the calculated times (difference of 0:38 h). For a thickness of 30 mm, the difference was greater by 1:23 h. The larger difference for the thinner thickness may be since the thicker the timber is, the smaller the effect of the heat transfer coefficient on the heating time. The heating time increases faster with increasing sample thickness than the line of proportionality with thickness. Several studies [
4,
7,
8] that focused on heating samples of different thicknesses back up this claim.
Another reason is that with a thinner sample thickness, there is more moisture evaporation from the wood than with the theoretical predictions. The theoretical models for calculating the heating time are based on assumptions and simplifications that do not accurately describe the heating process. For example, they assume that the wood is orthotropic, that the thermal conductivity is constant during heating, etc. Therefore, there are deviations between the calculated and measured values of the heating time. The experimentally measured times for both thicknesses were considerably shorter than both the theoretically calculated and the times prescribed by the standard (
Table 2). The measurements were performed under laboratory conditions, where the environmental increase is faster than under operating conditions. It is likely that under operating conditions, the differences between calculated and measured heating times will be slightly smaller. Under operating conditions, the temperature increase in the kiln is much slower. The heating intensity varies depending on the kiln manufacturer and the heating stage. On average, the temperature increase of the drying environment is 5 °C per hour. The heat output ratio to the wood heated volume is also different under operating conditions. The studies focusing on the heating of dried wood do not directly compare laboratory and operating conditions. The differences may be due to the performance of the heat source for drying itself, in addition to the size of the kiln. Therefore, the best solution is to derive the heating time not from the thickness of the wood but from the actual measured temperature at the centre of the dried wood. Other studies [
1,
2,
14] confirm that temperature, processing time, system type (open or closed; dry or wet), and sample dimensions could significantly affect the drying process.
The implementation of such a method of heating control in practical conditions is not technically complicated. The newest timber drying kilns, which have a program for the biological treatment of wood, are equipped with bimetallic sensors for measuring the temperature of the wood. These sensors are not used in the drying process, and the heating time is derived from the thickness of the dried wood. In the proposed solution, the operator would place the temperature sensors in the centre of the dried wood, and the heating process would be controlled by the wood temperature after the modification of the software. No additional installation of measuring devices is required, but only modification of the control software.
Implementing this method in the timber industry could save a significant quantity of energy, especially in areas with cold climates where freezing of wood is frequent.
Although the research results are based on Pinus sylvestris, the results are also expected to be applicable to spruce and fir. Application to deciduous species requires further research due to their different heating properties.


