1. Introduction
The principle of student activity (SA) is rooted in educational theories such as constructivism, which posits that learners actively construct knowledge rather than passively absorb it [
1,
2]. Effective student activity also depends on the design of learning environments that facilitate participation [
3]. This includes incorporating interactive technologies, fostering an inclusive classroom culture, and employing teaching strategies that prioritize student-centered learning. Examples include project-based learning, flipped classrooms, and inquiry-based approaches, which place students at the core of the educational process [
4].
In the specific case of frontal-teaching lectures, discomfort conditions may lead to fatigue and subsequent disengagement from the primary task. Consequently, increased interactions among students and movements can occur. This collective noise, due to students during lectures, constitutes what Hodgson measured as student activity in acoustic terms [
5]. Additionally, the dynamic behavior of students interferes with teaching effectiveness. In a vicious cycle, high levels of this type of background noise increase students’ listening effort and elevate teachers’ vocal effort, altering their teaching style [
6].
In university classrooms, SA is often the primary source of background noise due to the large number of listeners. SA is measured by recording ambient noise and separating the teacher’s voice from background noise, which comprises various sources (HVAC noise, external noise, SA, etc.). The process of separating these contributions relies on the temporal characteristics of speech signals. Speech is characterized by a quasi-continuous signal with short breaks during pauses between words or sentences and longer breaks when the teacher writes on the blackboard [
7]. During these pauses, the primary sound source is background noise. The background noise, in turn, consists of various contributions: HVAC noise, traffic noise from outdoors, and, in active classrooms, student activity. Leveraging these pauses, various methods have been proposed in the literature to differentiate noise sources during lectures.
Early approaches involved manual analysis of short-term sound level recordings [
8,
9]. Recording time histories facilitated the measurement of SA and other sound sources during lessons [
10]. Assuming a Gaussian distribution for the statistical occurrences of short-term levels for all the sound sources within the classroom environment, Hodgson used a peak-detection algorithm to extract values of speech level and SA from 15 min long time history recordings [
11]. This method has been applied in contexts such as evaluating audience noise during musical performances and speaker recognition [
12]. More recently, blind techniques have been developed, eliminating the need for operators and making them suitable for permanent data acquisition setups [
13]. A comparison between the techniques for measuring SA, ranging from more basic to more advanced statistical methods, is presented in D’Orazio et al. [
14].
The use of public address (PA) systems can also influence SA levels. While these systems are a practical solution, they do not necessarily enhance students’ listening environments [
15]. Some studies have found a minimal correlation between PA system use and the teacher’s Lombard effect, compared to cases without PA [
16]. Many investigations instead rely on direct observation of sound phenomena during lecture recordings, enabling each speech signal peak to be associated with its source [
17]. Previous works by two of the authors of the present work showed how a proper PA system might stabilize the relationship between SL and SA, making verbal communication within the classroom more efficient [
18].
1.1. Thermal Comfort in Active Classrooms
Thermal comfort in classrooms is a critical factor influencing not only the health and well-being of students but also their academic performance and cognitive abilities. As students spend a significant portion of their day in educational settings, the indoor thermal environment plays a pivotal role in shaping their learning experiences. The concept of thermal comfort encompasses various environmental parameters, including temperature, humidity, air velocity, and overall indoor air quality. Research has highlighted that students in Mediterranean zones [
19,
20] may have different thermal comfort preferences compared to those in continental climates, necessitating tailored approaches to classroom design and ventilation strategies [
21,
22,
23].
Academic performance significantly declines when indoor temperatures deviate from the thermal comfort zone, generally between 20 and 24 °C [
24]. Elevated temperatures may lead to fatigue and reduced concentration, while overly cold environments can cause distractions and discomfort. Additionally, high levels of carbon dioxide (
), resulting from insufficient ventilation, represent a recurring issue in schools worldwide [
25,
26].
An integrated design approach that simultaneously considers acoustic and thermal requirements is, therefore, essential. Some authors have proposed a “global comfort” model that accounts for interactions between multiple environmental parameters, emphasizing that optimizing a single factor in isolation may lead to undesirable trade-offs affecting other aspects of occupants’ well-being. This type of approach not only enhances the quality of learning and students’ well-being and promotes greater energy sustainability in university buildings. Thus, global comfort in classrooms falls within the broader context of Indoor Environmental Quality (IEQ) [
27].
Emerging technologies, such as IoT-based environmental monitoring systems, represent promising tools for collecting real-time data and supporting evidence-based decision-making [
28].
1.2. Room Criteria in Active Classrooms
Since the 2000s, an increasing number of standards in classroom acoustics set the requirements of reverberation time (RT) in an occupied state. In occupied conditions, the reverberation time may be expressed in its classical and predictive form with the Sabine formula:
where
- -
the subscript k corresponds to the k-th octave band, usually in the range 125–4000 Hz;
- -
V is the volume of the hall, in ;
- -
is the equivalent absorption area of the hall in furnished and unoccupied state, in Sabine ( is the absorption coefficient of the i-th surface, is the area of the i-th surface, in );
- -
is the equivalent absorption area due to the occupancy, in Sabine (where d is the percentage of occupancy considered, N is the maximum seating capacity, is the equivalent absorption area of a single person, in Sabine);
- -
is the equivalent absorption area of the air.
depends on the temperature and the relative humidity according to ISO 9613-1 [
29].
The speech transmission index (STI) quantifies the deterioration of a speech signal through a transmission channel, i.e., the room. Its range spans from 0 (signal fully degraded) to 1 (signal fully preserved). It is derived from the modulation transfer function
, expressed in a simplified form as follows:
where
- -
is the modulation frequency, in Hz, and the subscript k corresponds to the k-th octave band (from 125 Hz to 8 Hz);
- -
is the reverberation time, in s;
- -
is the signal-to-noise ratio, in dB.
Therefore, two factors affect the intelligibility: the reverberation time
of the room and the signal-to-noise ratio (
) at the student’s position. The latter is the difference between the sound pressure level received at the listener position (SL) and the background noise, which, in the case of the occupied state, is mostly the student activity (SA) due to higher sound pressure levels compared to the HVAC systems. The speech signal is deteriorated by high reverberation time values and by low SNR values at the receiver location. Equation (
1) shows that the sound absorption due to the students
decreases the reverberation time, increasing the communication between teacher and student. On the other hand, Equation (
2) shows that the SA, when the activity is not useful communication but becomes background noise, increases the overall background noise, leading to lower SNR values and thus worse teaching conditions.
1.3. Research Aim
In the previous section, it was shown how, in an active classroom, students influence the reverberation time (RT) through their acoustic absorption and, via student activity (SA), the Signal-to-Noise Ratio (SNR). Furthermore, both RT and the SNR affect the Speech Transmission Index. University classrooms can serve as a relevant case study due to their high occupancy and the frequent presence of suboptimal acoustic and thermal conditions.
The present study aims to monitor changes in SA levels in university classrooms where occupancy and thermo-hygrometric conditions vary, largely driven by the effects of occupancy itself. The study is looking for potential correlations between thermo-hygrometric variations between lectures, amplified by the lack of ventilation, and the differences in SA levels.
A preliminary version of this study was presented at the 17th International Conference of the International Building Performance Simulation Association [
30].
2. Method
The present study investigated possible relationships between SA and thermal conditions in active classrooms by conducting in-field monitoring of two large university classrooms.
The two lecture halls assessed in this study belong to the University of Bologna (Italy). The two halls differ significantly in terms of materials: Hall A features extensive wooden linings, while Hall B predominantly consists of smooth plaster surfaces. Throughout the day, both halls accommodate up to 200 students. Different groups of students attend the lectures, and all the recorded lectures are essentially frontal.
Ambient noise levels, temperature, and relative humidity were recorded throughout an entire day of university lessons, alongside any variations in occupancy.
2.1. The Lecture Halls
Significant differences exist between small and large classrooms, both in terms of acoustics and the required evaluation metrics, making it essential to account for these variations.
In the present work, we focus on relatively large spaces used for university lectures. The lecture halls analyzed in this study are part of the University of Bologna (Italy), located within historical buildings, which, as is common in such environments, exhibit excessively reverberant sound fields, resulting in poor speech intelligibility. Halls A and B have a volume of 1000 and 900 and features an amphitheater-shaped seating area for students. In contrast, Hall C has a volume of 850 and a traditional shoe-box layout.
The main data concerning the geometry, volume, occupancy, and primary measured acoustic criteria of Halls A and B are provided in
Table 1.
2.2. Halls’ Acoustic Qualification
ISO 3382 [
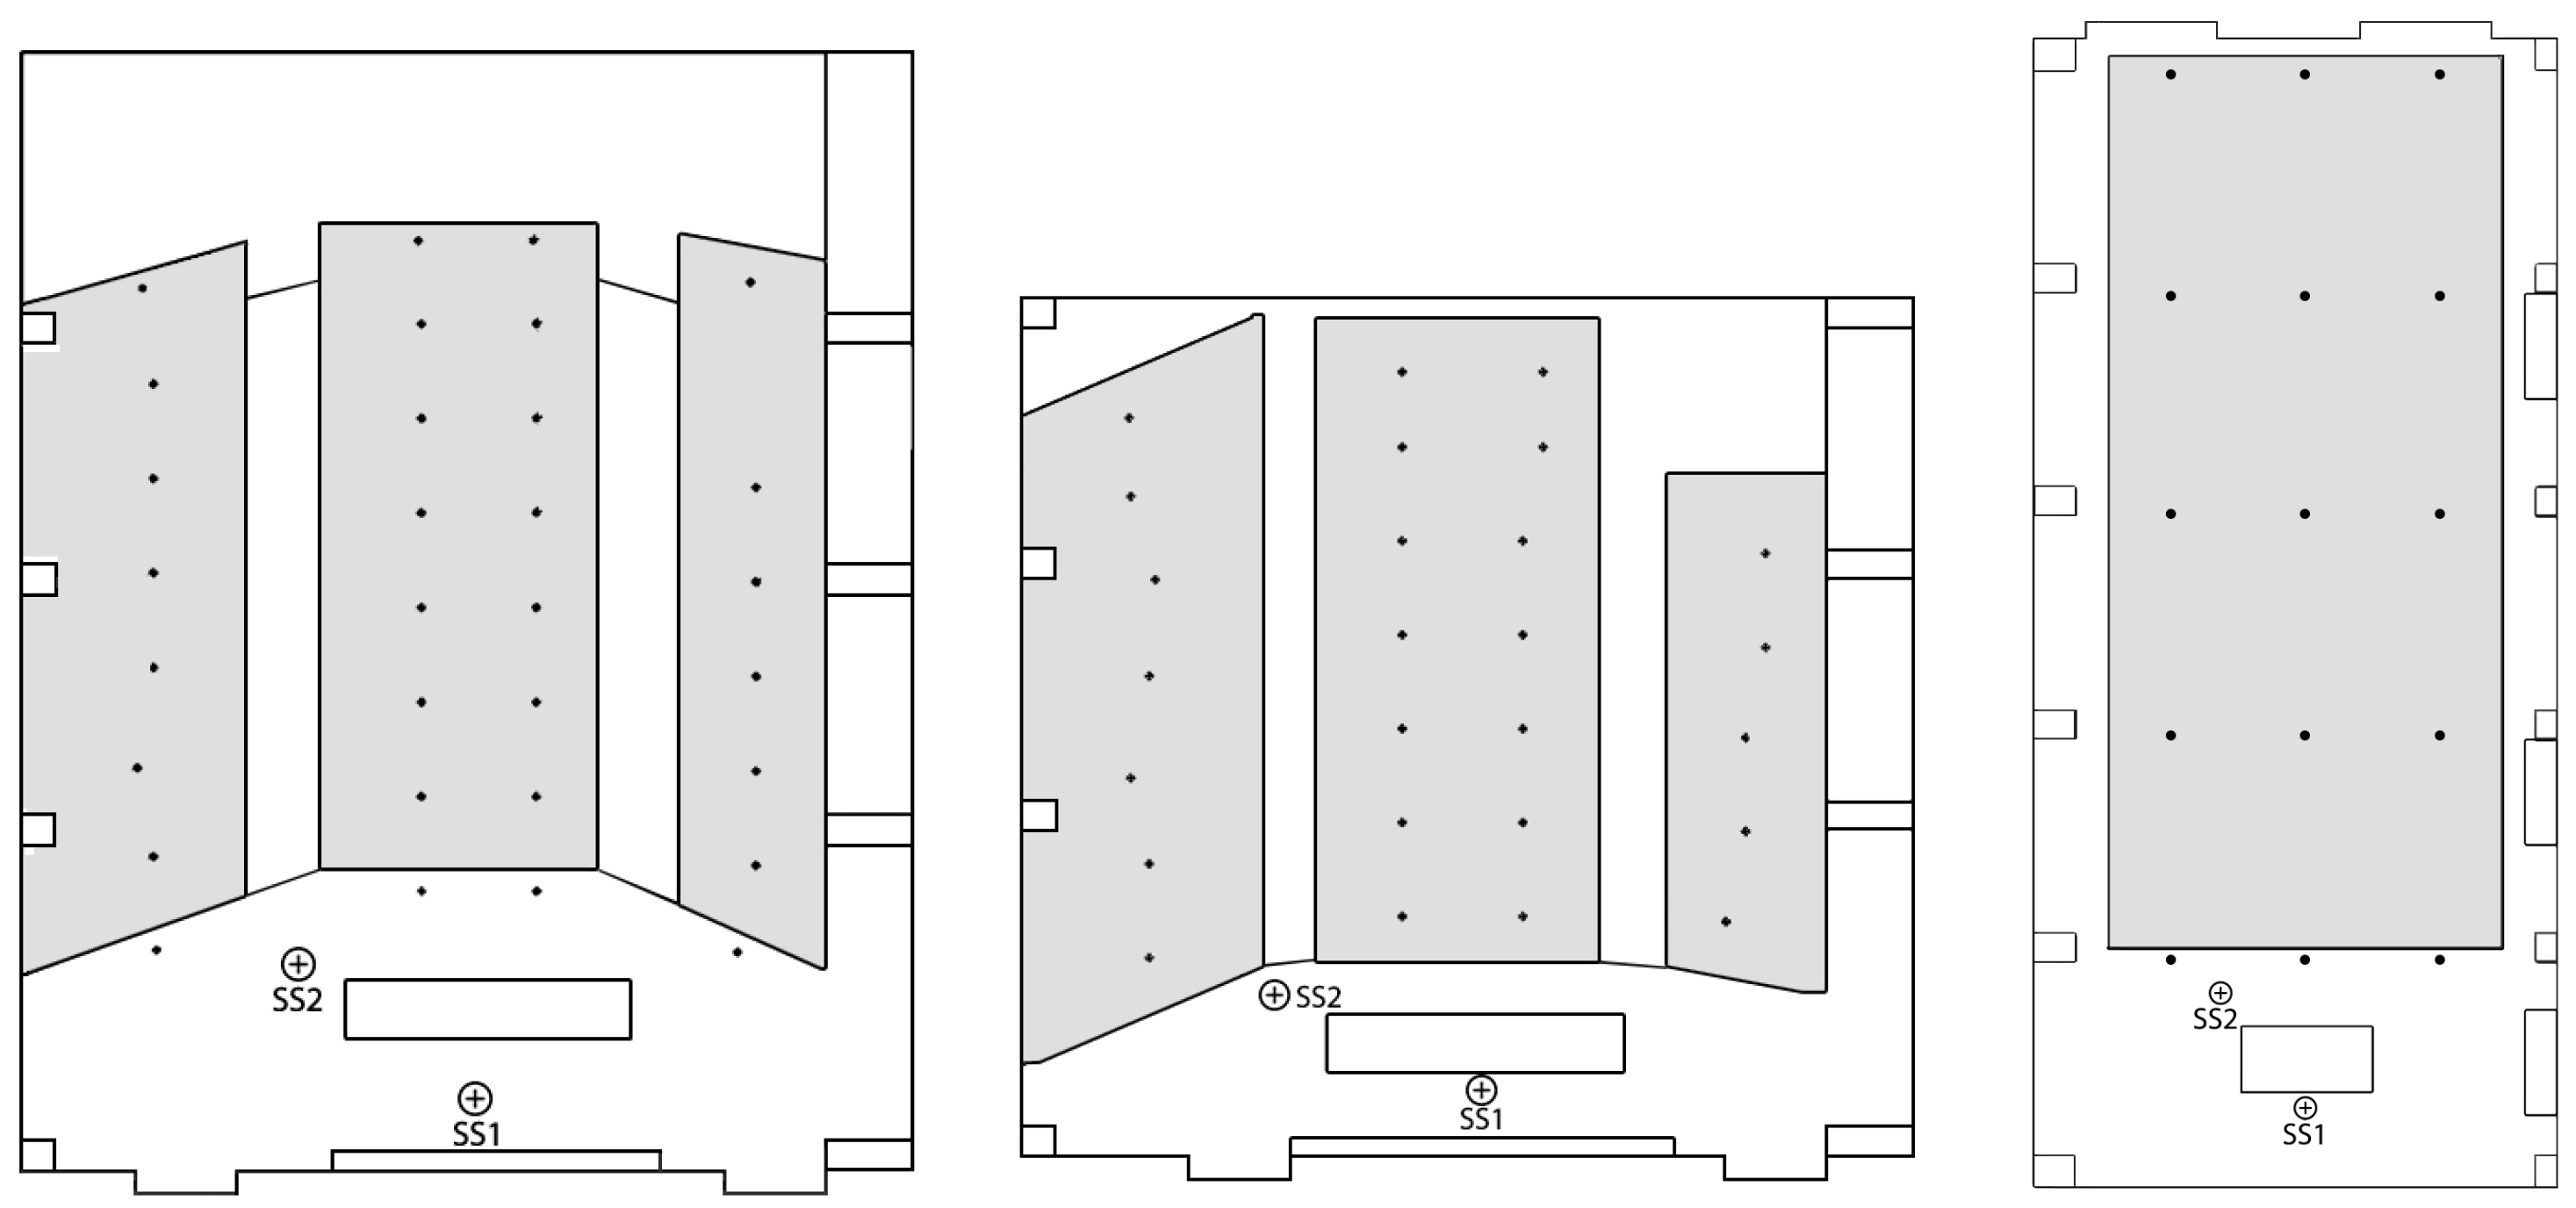
31] measurements were performed under furnished and unoccupied conditions to characterize the two lecture halls. Impulse responses were acquired using a dodecahedron loudspeaker and an exponential sine sweep signal. The measurement path consisted of a BSWA SM4000 series microphone (BSWA Technology Co., Ltd., Beijing, China), powered by 48 V phantom power through a MOTU Ultralite (MOTU, Cambridge, MA, USA), which functioned as a preamplifier and an A/D converter. The gain of the acquisition system and the sound power level of the dodecahedron allowed for the acquisition of impulse responses with a signal-to-noise ratio greater than 40 dB across all octave bands under analysis (125–4000 Hz). The exponential sine-sweep excitation signals were generated and deconvolved using Dirac v6.0, which was also employed in the post-processing phase to extract the room criteria.
Measurements involved two sound-source positions and a grid of receiver locations, as illustrated in
Figure 1. The key quantities are presented in
Table 1, including average STI values measured through the PA system.
2.3. Lessons and Thermal Monitoring
In this study, thirteen lessons were monitored. These were traditional frontal lectures with limited interaction with students. In all sessions, the lecturer used a microphone and an amplification system.
Each lecture corresponds to a complete change of students, suggesting that a considerable portion of the students are well rested at the beginning of each session. Each lecture lasted 2 h, with the actual teaching time being approximately 1 h and 30 min.
The recorded lectures all pertain to humanities subjects. There is no statistical control of the gender distribution of teachers or students; however, a heterogeneous mix is assumed. The lectures were conducted in Italian, and it is assumed that all teachers and students are native speakers.
The occupancy of the classrooms ranges from 50% (i.e., one seat occupied for every two) to 125% (i.e., all seats occupied with additional students standing or sitting on the stairs). The classrooms and the monitoring period were specifically selected to capture this wide variation in occupancy.
Table 2 provides the details, including occupancy.
The measurements were recorded in three days, one for each room, on the 27th, 30th, and 31st of October. The external values of External Temperature (T), recorded during the days of monitoring, are shown in
Table 3. Students inside the classroom were dressed in light clothing.
It should be noted that the present study did not take into account individual differences in the student population, such as gender, cultural background, and teaching style.
The classrooms were not equipped with mechanical ventilation, and the air conditioning systems were turned off during the measurements. The only air exchange effects were, therefore, due to the opening of windows and/or doors between classes. Indoor values of indoor temperature (T) and indoor relative humidity (RH) inside the classroom were recorded using a data logger Omega OM-EL-USB-2-LCD-PLUS Omega Engineering, Norwalk, CT, USA placed in the center of each lecture hall. The values were recorded with a sampling interval of 1 min, which is appropriate for capturing variations during lessons.
2.4. SA Monitoring
Ambient noise in active conditions was recorded over a day of lessons for each hall. The equipment used for these measurements consisted of two sound level meters positioned in the student seating areas.
Short-term A-weighted equivalent noise levels were recorded every 100 milliseconds to capture background noise during speech pauses. The sound level meters were placed at the center of the lecture halls, maintaining a minimum distance of 1 m from nearby surfaces to avoid strong reflections. The height was set to 1.2 m above the floor, corresponding to the approximate ear level of a seated person.
The lessons were supervised by an operator positioned among the students. Background noise primarily originated from students’ whispering, movement, and conversations. No behavioral observation methods, such as video recordings or questionnaires, were employed as supplementary data to assess the explanatory power of acoustic measurements regarding student behavior and psychological states. The operator recorded the start and end times of the lessons, details on teaching style, and any unusual student behaviors. Pauses between and within lessons, as well as unforeseen noise peaks, were excluded during the post-processing phase.
Short-term A-weighted equivalent levels
were extracted from the recordings, and their occurrences were analyzed using the Gaussian Mixture Model (GMM) method [
32]. The probability density functions of
occurrences were examined for each lesson observed. Since the occurrence curves exhibited two distinct peaks, they were modeled as a mixture of two Gaussian distributions, representing two separate contributions [
33]. At each listener position, the Gaussian distribution with higher sound pressure level values was attributed to the teacher’s speech level. Conversely, the Gaussian distribution with lower sound pressure level values was linked to student activity.
2.5. Data Analysis
The statistical analyses were conducted using the RStudio programming environment (version 2024.12.0) along with the Psych package [
34]. To assess the linear relationships between variables, Pearson’s correlation coefficient
R was employed, as it quantifies the strength and direction of the association between two continuous variables. The statistical significance of the correlations was determined using a threshold of
, meaning that correlations with
p-values below this threshold were considered statistically significant.
3. Results
3.1. Reverberation Time in Occupied Condition
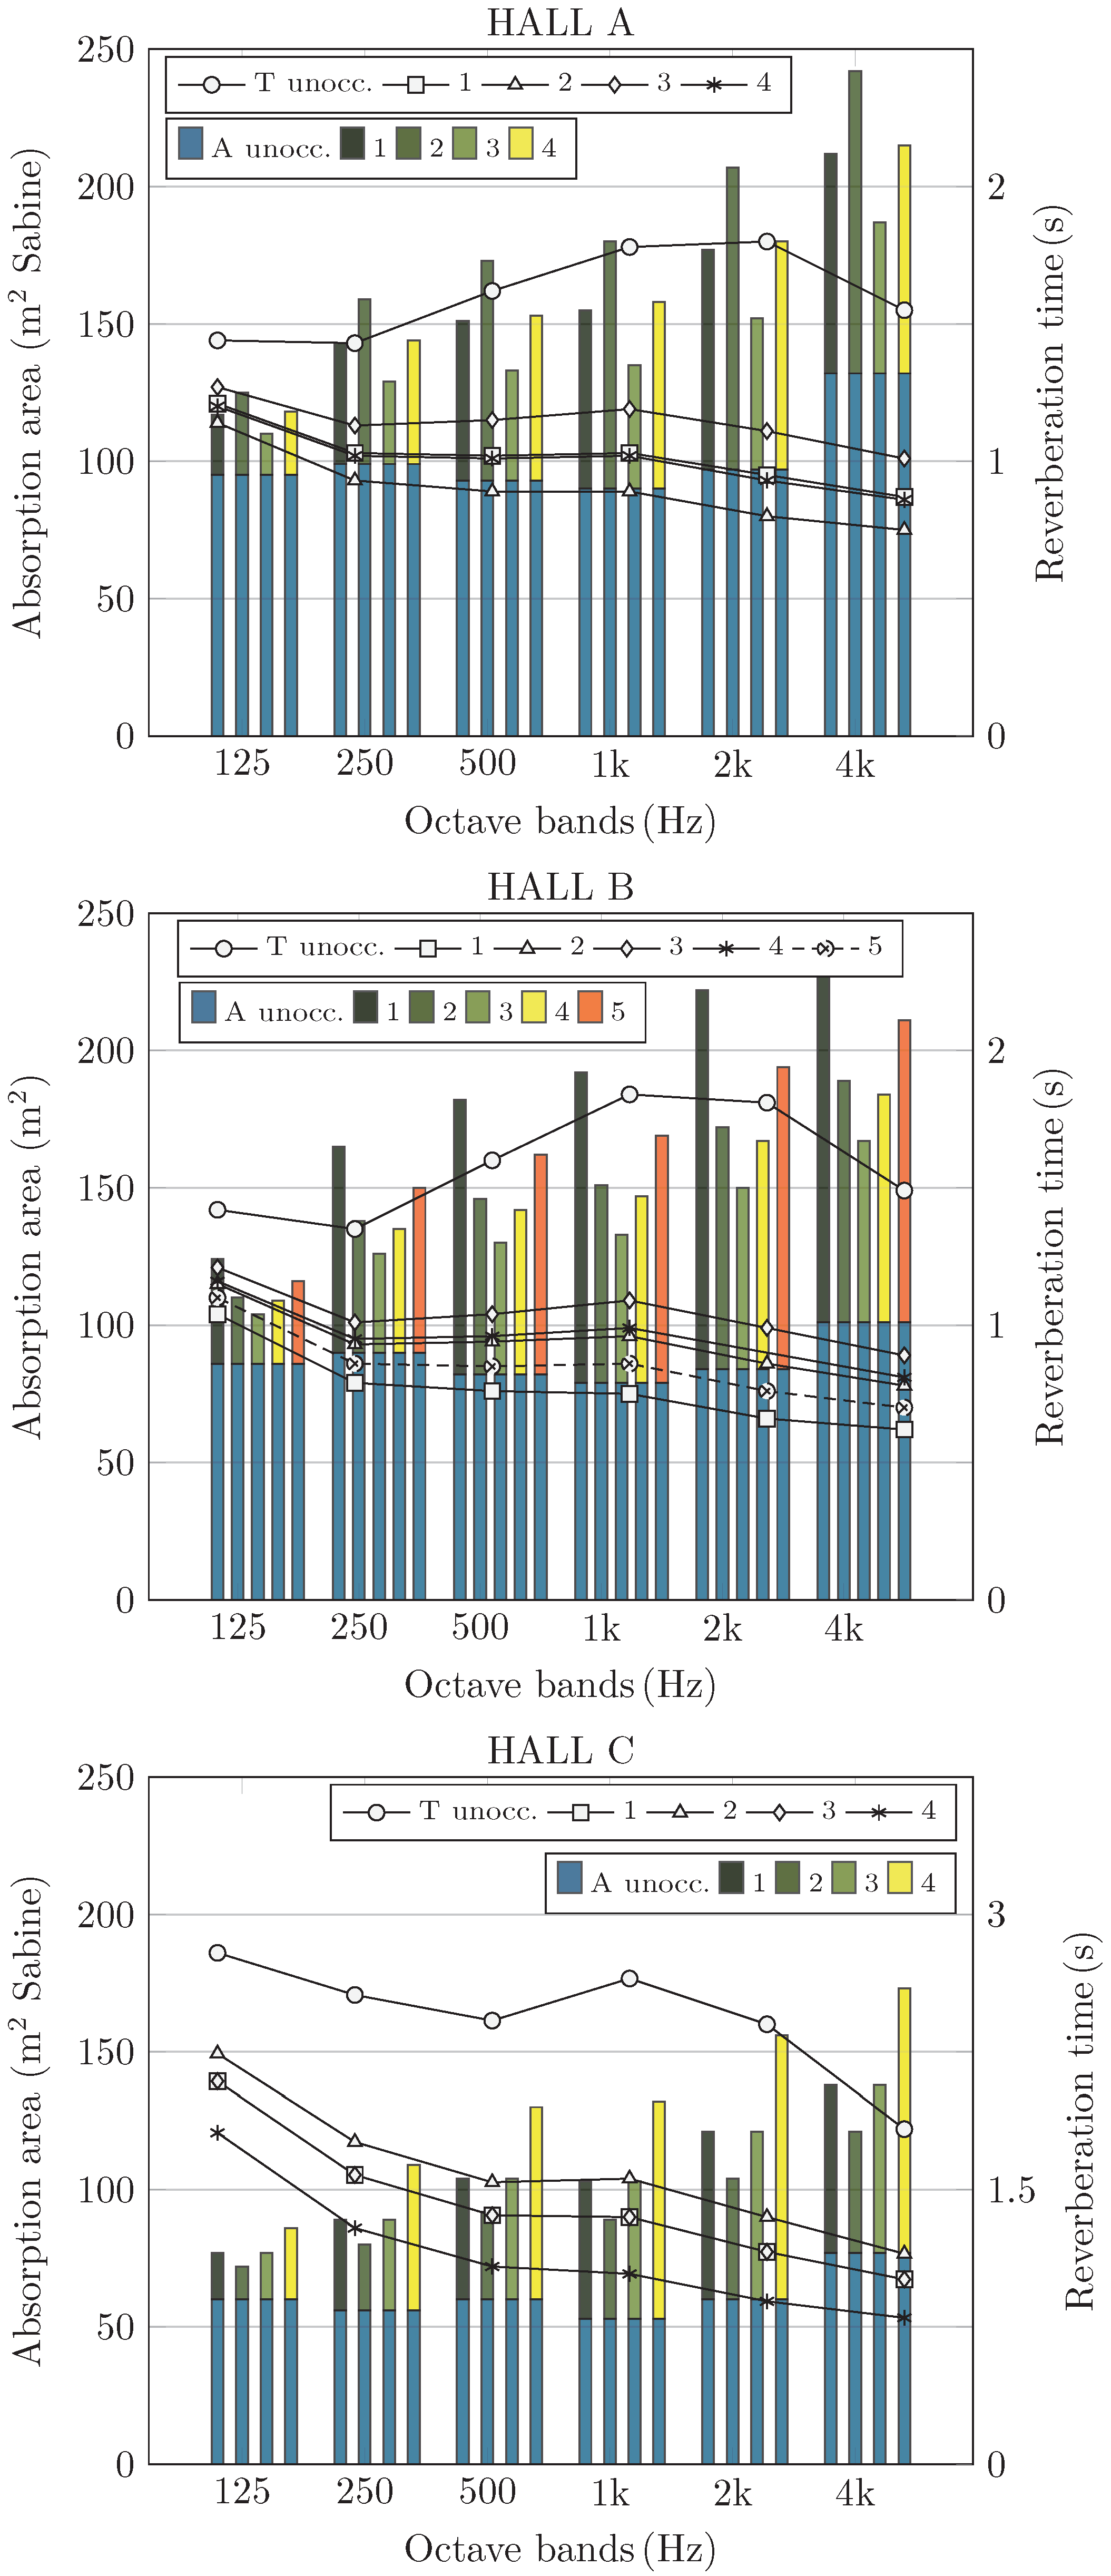
The reverberation time measurements in unoccupied conditions are reported in
Figure 2. In the same figure, a projection for the occupied environment is provided using the absorption coefficients of seated adult students on wooden chairs, as tabulated in the standards DIN 18041 and UNI 11532-2 [
35]. The values in unoccupied conditions at mid frequencies (1.8–2.5 s) are significantly higher than the requirements specified by the standards in classroom acoustics (whose range may be assumed between 0.7 and 1.2 s). These requirements vary locally but generally settle around values below 1 s for rooms of dimensions comparable to the classrooms under study.
In occupied conditions, it can be observed that the frequency response curve of the reverberation time differs significantly between the two cases: in halls A and B, the curve stabilizes at relatively uniform values across frequencies, around 1 s; in hall C, the acoustic absorption is concentrated in the mid-to-high frequencies and stabilizes around 1.5 s. This difference is due to the varying characteristics of materials in the environment and the different occupancy densities of the two spaces.
The frequency spectrum of the reverberation time under occupied conditions is relatively flat in halls A and B. This aligns with recommendations from standards in classroom acoustics, such as DIN 18041 and UNI 11532-2. Indeed, a flat spectrum is beneficial for speech intelligibility. In contrast, hall C shows a decreasing trend in reverberation time values at high frequencies.
3.2. Student Activity
SA levels were averaged over the SA extracted from the two datasets of sound levels, one from each sound level meter.
All the recorded sessions are frontal lessons with limited student engagement in lessons. It can, therefore, be hypothesized that all the recorded sound activity is attributable to background noise, whispering, and increasing inattention among students. In some cases, the recorded values are significantly higher than the previous literature, but it is necessary to consider the type of students, the consistent occupancy density, and the duration of university lectures. The analysis of the interactions between all these factors is beyond the scope of this study, and it should be remarked that there is no sufficiently extensive literature on SA values in university settings [
36], and the local factor can have a significant impact. Given these premises, we can preliminarily consider activity to be intense in the context of this study if SA
dBA.
3.3. Temperature and Relative Humidity
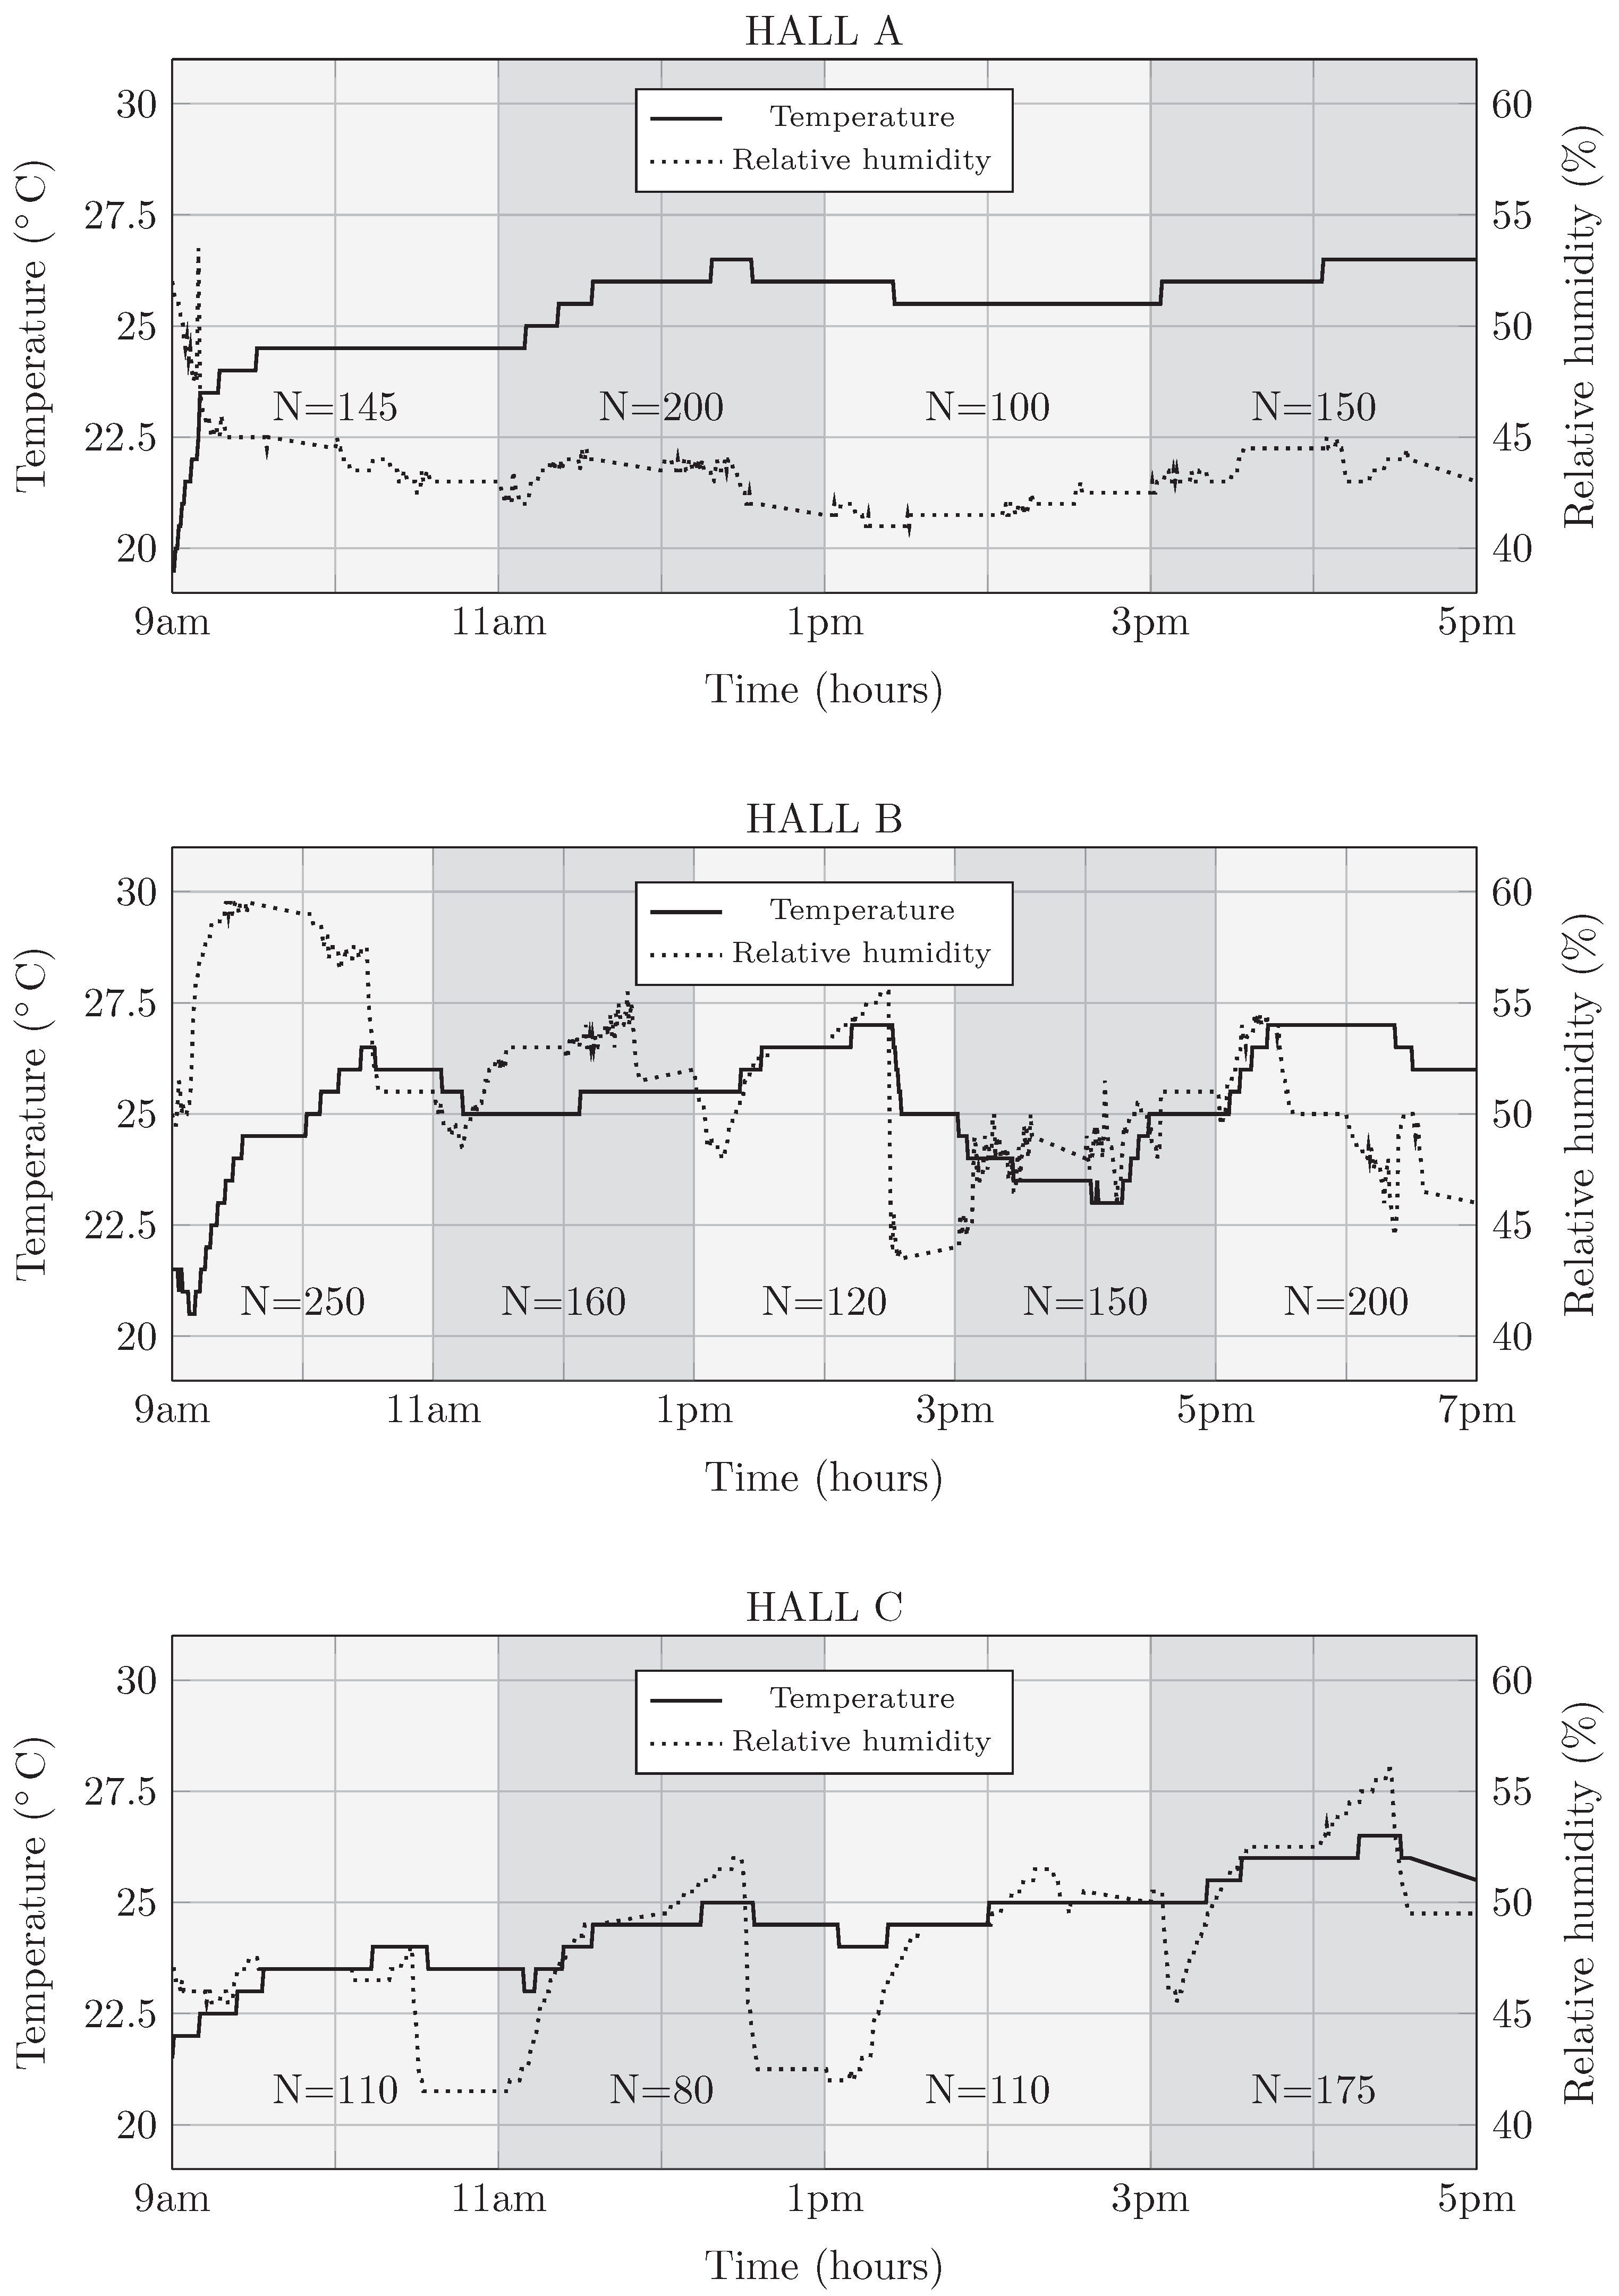
The temperatures recorded in the classroom during the monitoring period are reported in
Figure 3. The two lecture halls exhibit distinct behaviors.
In Hall B, the temperature oscillates around a mean value of approximately 25 °C. Within approximately 30 min from the beginning of the first lecture, the temperature approaches its steady-state threshold. In Halls A and C, the temperature increases steadily throughout the day, with a rise of approximately 1 °C every two hours of lectures. The trend is very similar: Hall A shows values approximately half a degree higher. This is consistent with the context: the absence of mechanical ventilation and reliance on air exchange through windows.
Relative humidity allows the documentation of the presence of students within the lecture hall. Variations are more pronounced during the intervals at the end of lectures when the hall empties and then refills. However, a general trend is observed: In Hall A, the relative humidity values tend to remain around 40%, with no significant variations throughout the day; Hall B progressively tends to dehumidify, with significant variations caused by the opening of doors and windows at the end of each lesson; and Hall C progressively tends to humidify while still maintaining similar variations at the end of each lesson.
In all the monitored cases, the recorded values exceed the comfort thresholds reported in the literature [
22] for the winter scenario. As a reference, British standards BB101 [
37] prescribes a maximum value of 25 °C for standard educational spaces. It was not possible to measure air velocity, and more generally, this study does not allow for the context to be described using the Fanger model [
38]. This limitation represents the primary constraint of the present work from the perspective of thermal measurements.
3.4. Correlations
Table 4 collects the correlation value between the measured quantities (SA level, T, RH) and the variables related to the functional characteristics of the room: occupancy N, V/N ratio, total acoustic absorption under occupied conditions, and this latter criterion normalized by the volume V. The presence of a significant relationship between variables was evaluated using Pearson correlation coefficient
R.
The correlations are not significant except for the relationship between SA and N, which deserves further investigation.
4. Discussions
4.1. Thermal Behavior vs. Occupancy
In primary and secondary schools, the number of students attending classes is typically stable, with few variations over time. This factor allows the effects of occupancy on acoustics to be considered relatively constant. As a result, the acoustic impacts resulting from the presence of students can be evaluated in a fairly predictable manner, without the need to account for significant changes in the number of people present in the room. This factor allows the effects of occupancy on acoustics to be considered relatively constant.
Instead, in university lecture halls, occupancy levels can vary significantly over the course of the day, posing a unique challenge. Additionally, other parameters, such as temperature and relative humidity, may fluctuate with occupancy. To minimize these influences, two lecture the acoustics and thermal conditions of halls without ventilation systems were monitored.
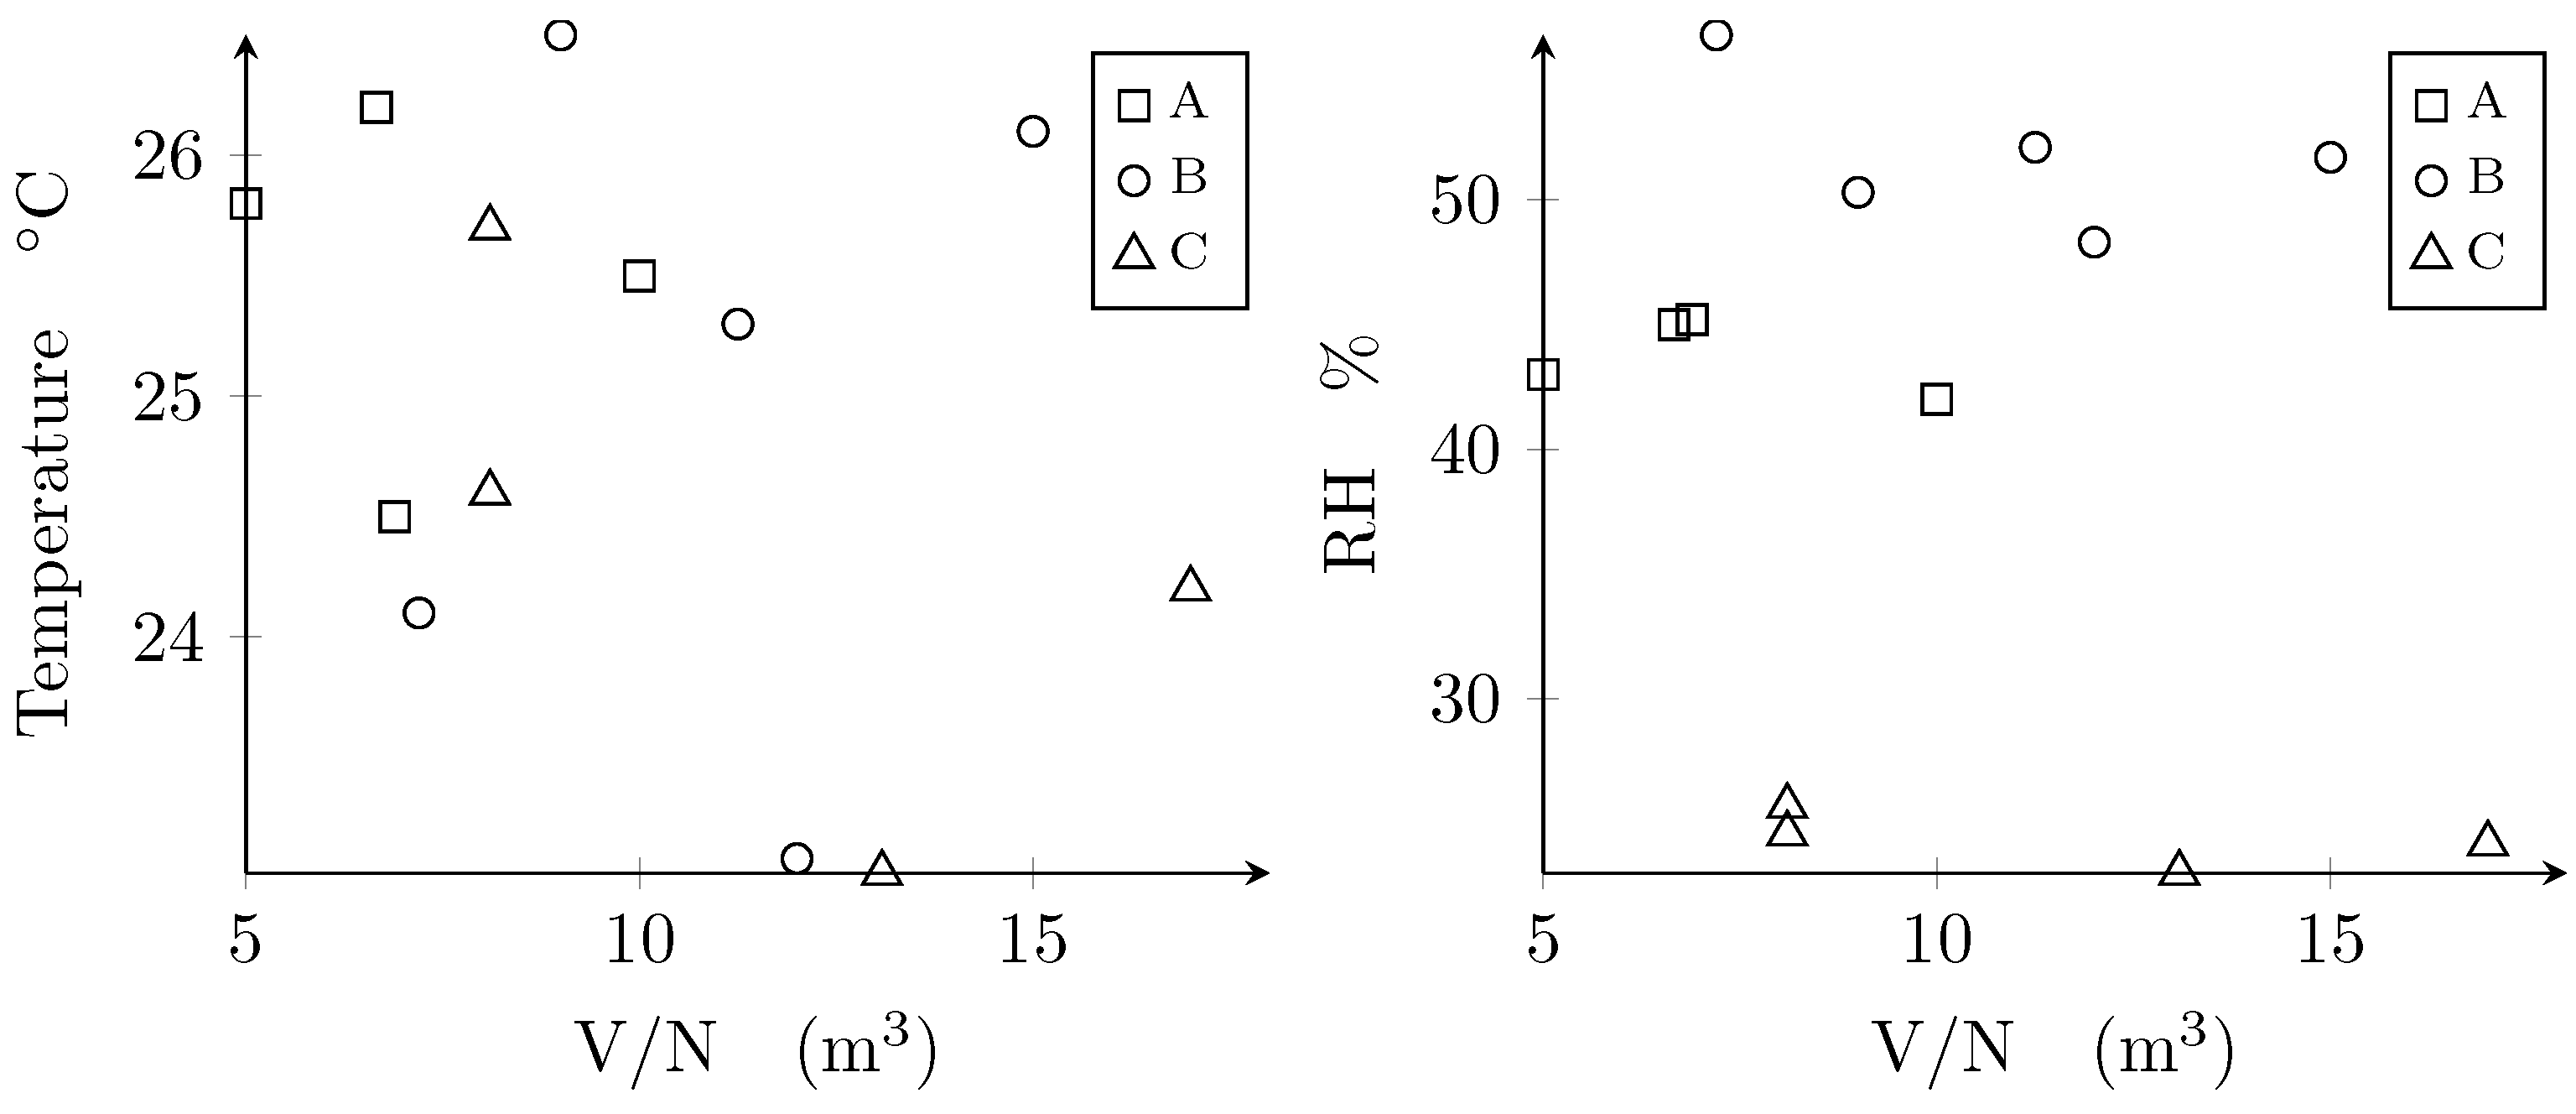
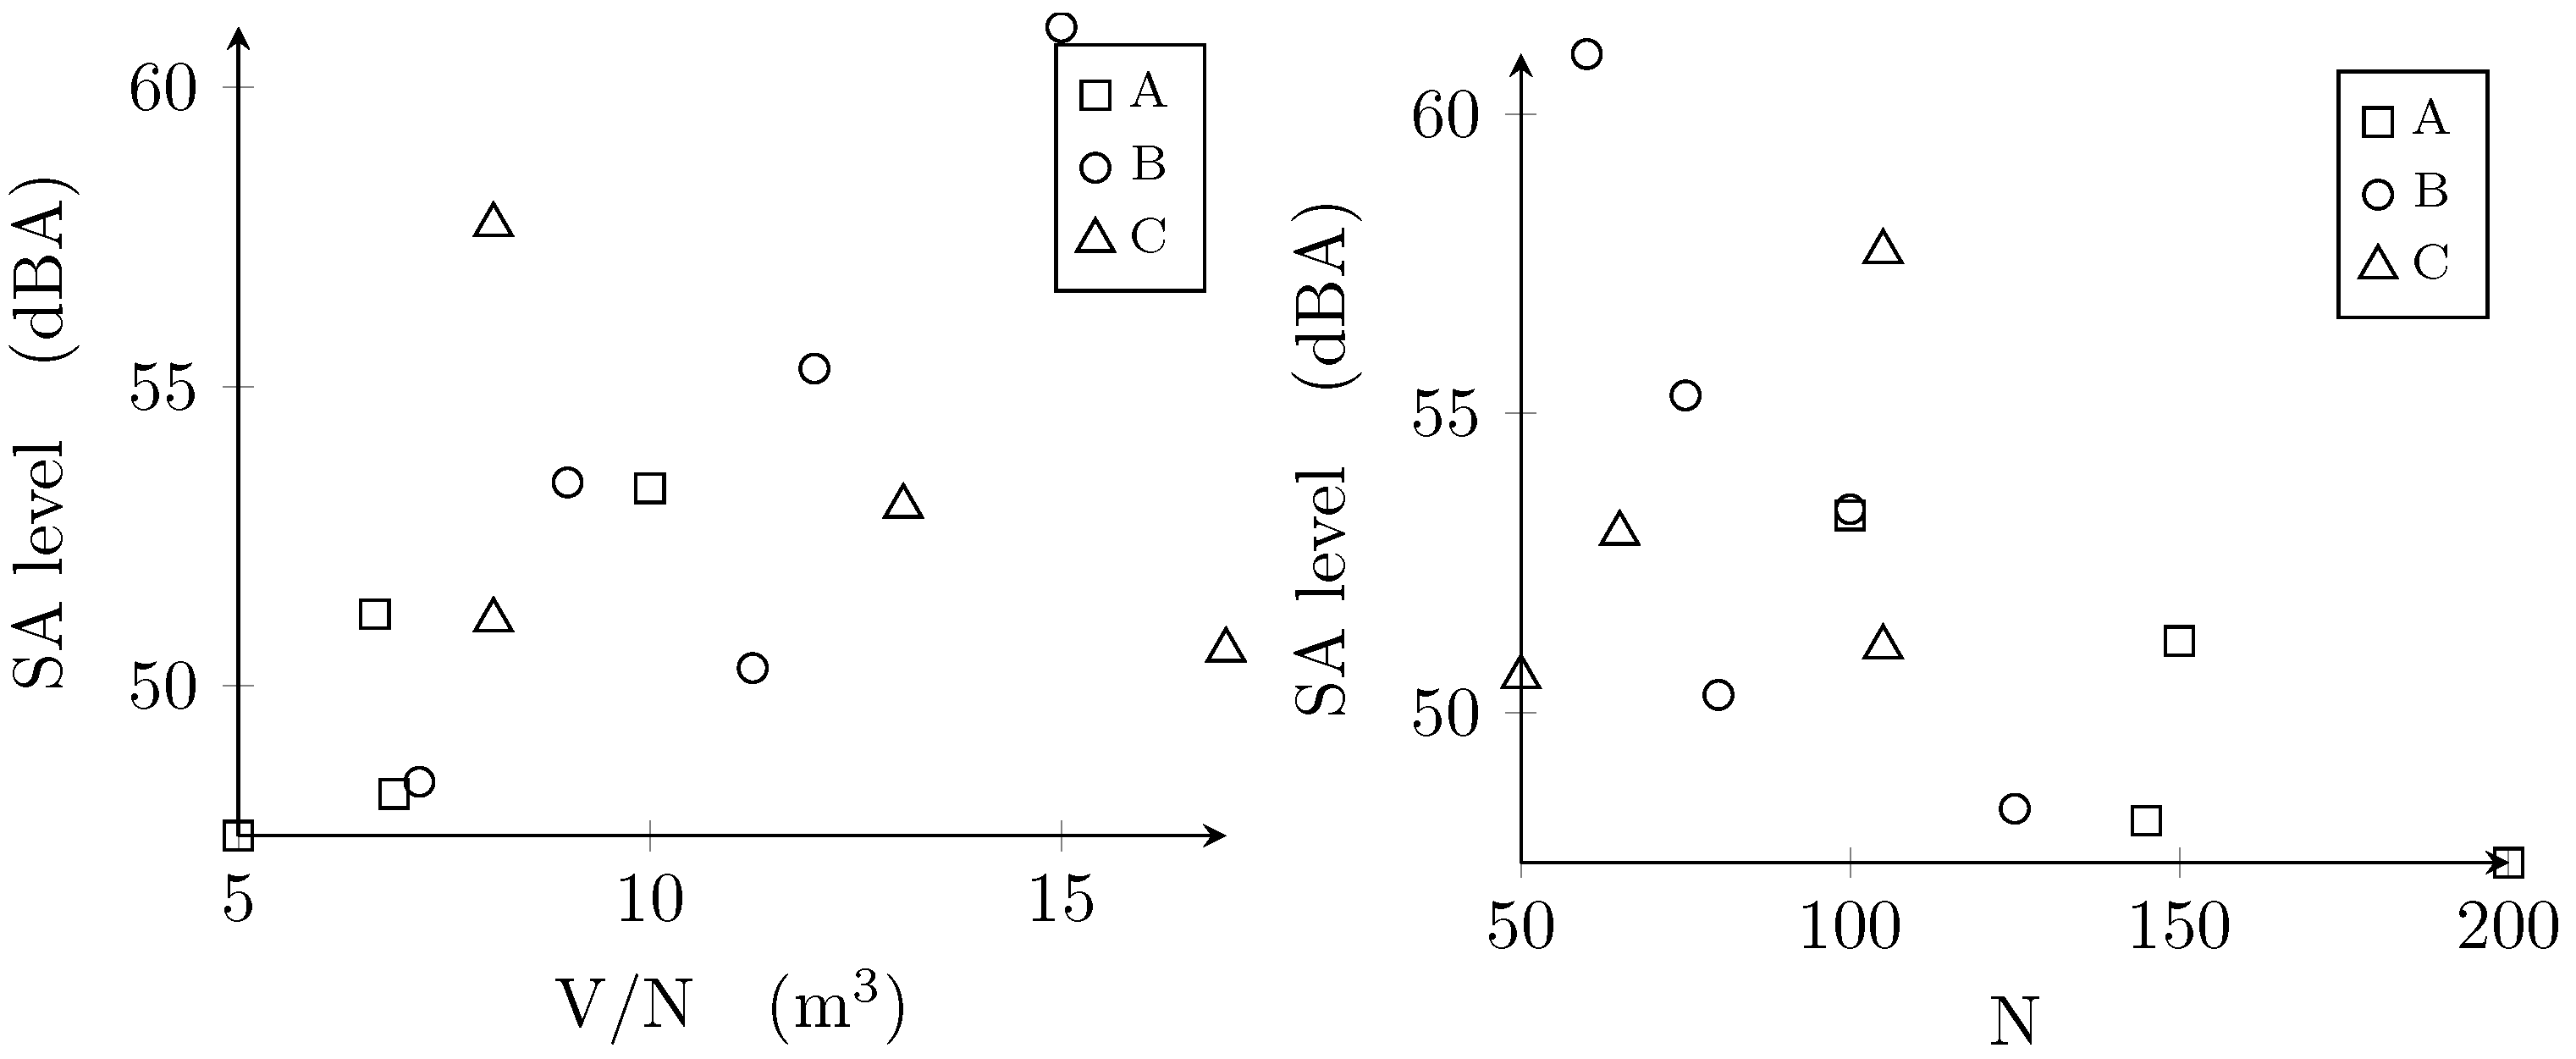
The measurements highlight a partially uncorrelated behavior between the average temperature recorded inside the lecture hall during each session and the corresponding occupancy level, quantified by the V/N ratio; see
Figure 4. It is worth noting that the V/N range is quite wide (from 8 to 18 cubic meters per person) and can be considered significant for large lecture halls or auditoriums. On the other hand, the range of measured average values shows limited variation, which is insufficient to indicate a presumably noticeable change in comfort.
Relative humidity shows a much more dynamic trend over time, which cannot be fully described by the average value alone. Despite the absence of ventilation during the lecture, RH values remain within the 40–60% range. The change of group of students and the opening of doors during the break between lectures are clearly observable in
Figure 3.
4.2. Student Activity vs. Thermal Behavior
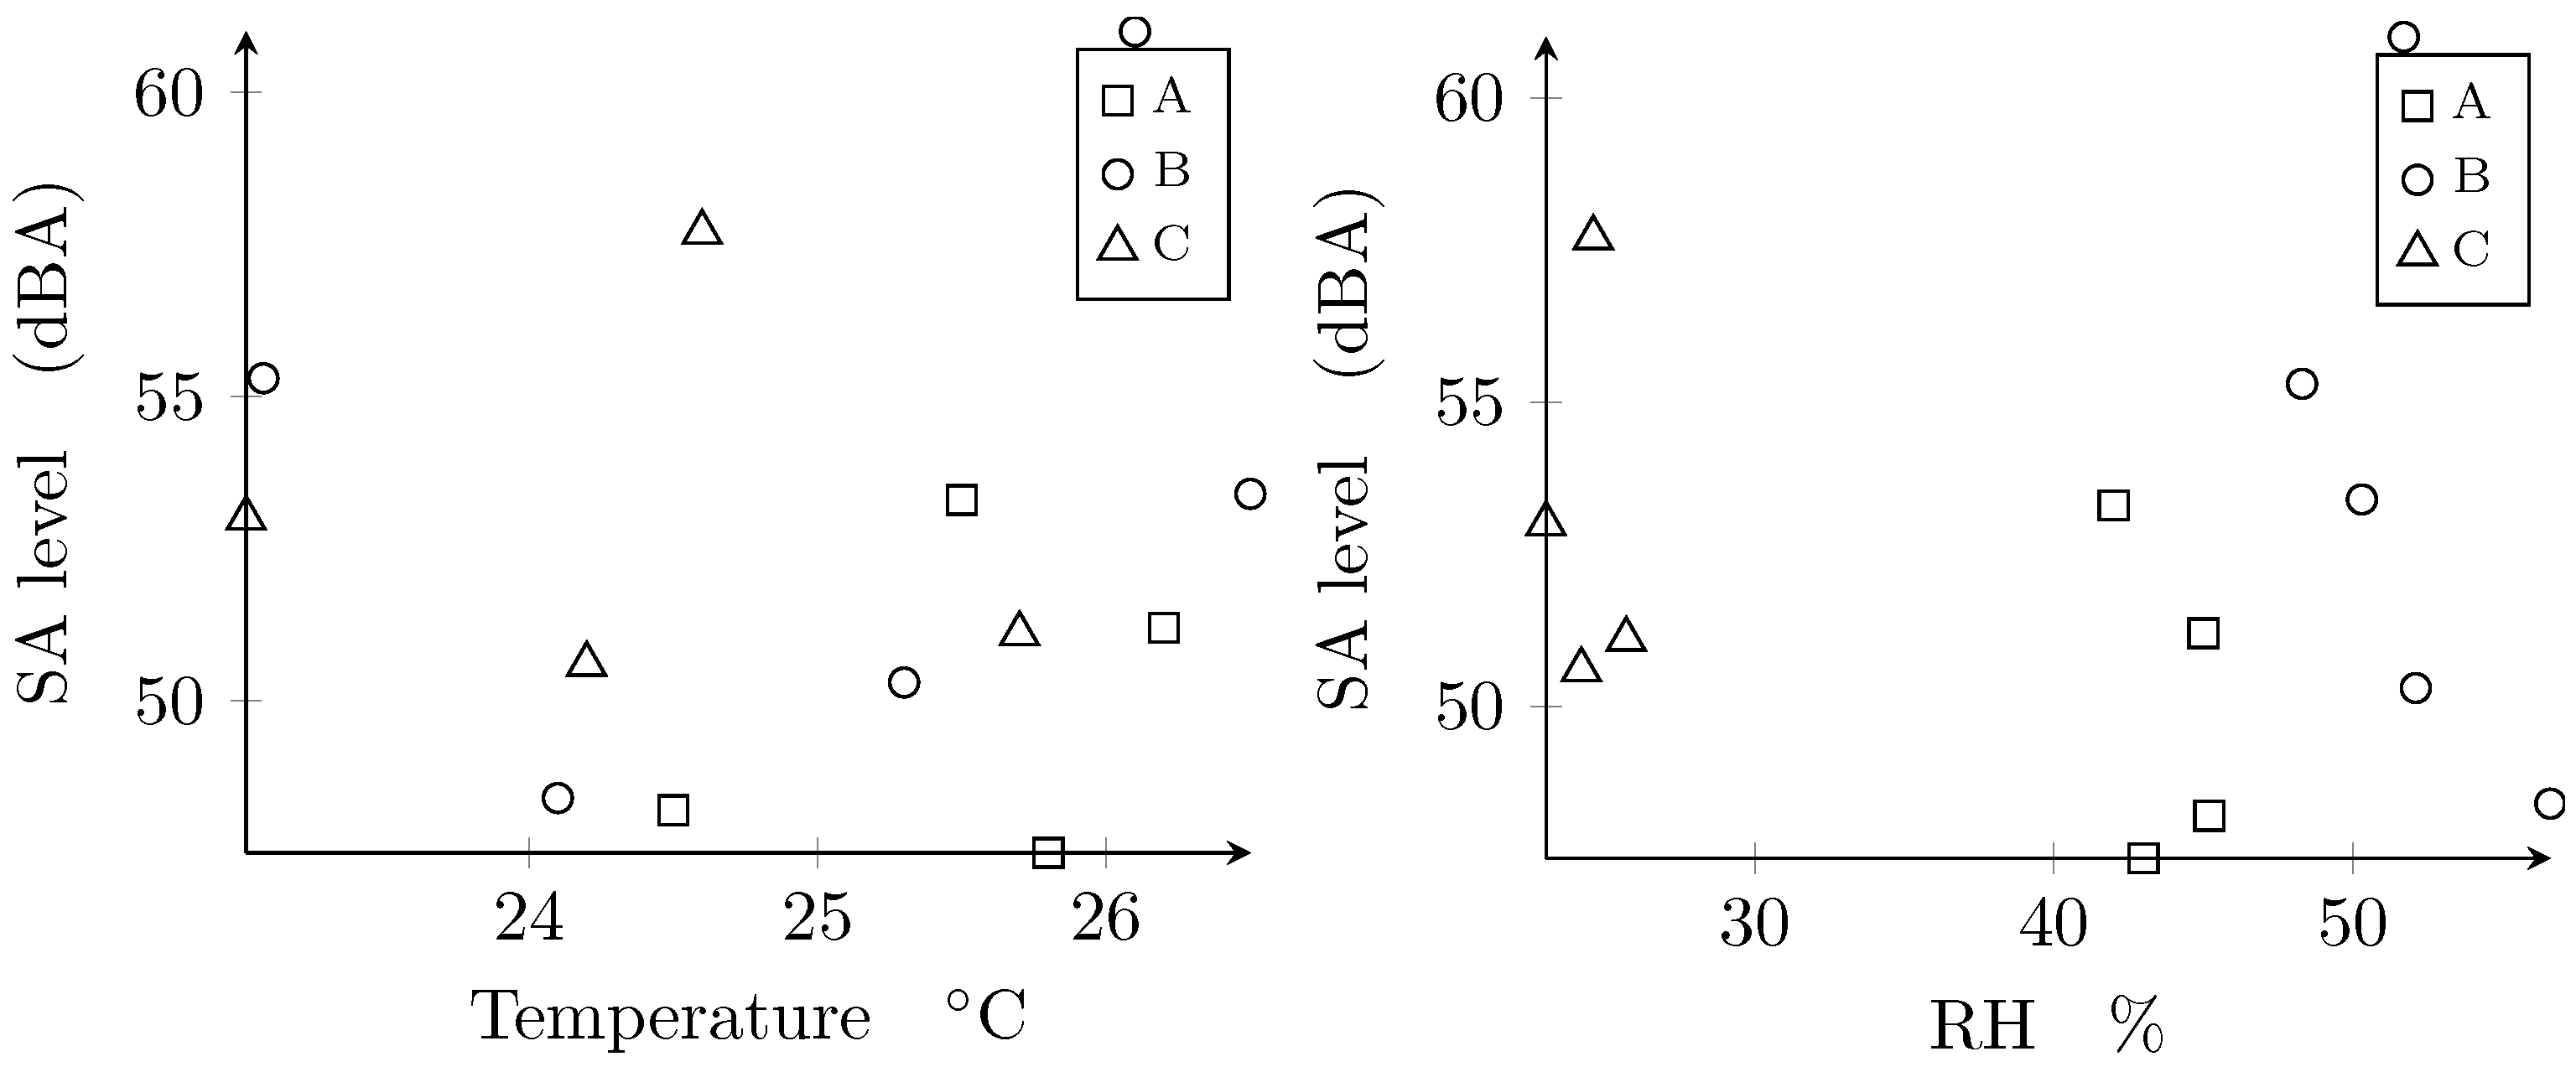
The research aim of the present work concerns the correlation between SA and thermal coordinates measured in the environment.
Figure 5 presents the SA values as a function of T and RH. The values appear uncorrelated in both cases.
It has been observed that the SA level tends to follow the teacher’s level in some cases [
18], while in other cases it is negligible [
36] or not distinguishable from other noise sources and, therefore, cannot be quantified. In this context, in the absence of ventilation noise and with negligible noise from other sources, it can be assumed that the sound source identified through the GMM technique corresponds to student activity, making the data relevant. Moreover, one of the mechanisms driving the SA level is the Lombard effect, and, to the author’s knowledge, no literature exists on the influence of thermal factors on the Lombard effect [
39].
One could argue, even in this case, that the variation in the temperature range is too limited to significantly influence SA levels. Indeed, the range of measured average values exhibits limited variation, which is insufficient to demonstrate a significant change in comfort. However, it can still be observed that thermally uncomfortable conditions correspond to a high absolute level of SA.
4.3. Student Activity vs. Occupancy
As a final point of discussion, the relationship between SA and occupancy density is worth considering. Based on the concept of group size, typical of cocktail party effects, one would expect that the proportion of “active” students remains constant relative to the total number of students in the environment. Consequently, one could say the higher the occupancy, the higher the SA level.
The results shown in
Table 4 and
Figure 6 reveal a correlation (−0.57) between the SA level and N, with a
p-value
.
It should be remarked that the audience of students present in each lecture varies, and the lecture topics differ, even though the teaching style remains consistent. This suggests that the triggering mechanism for SA is not analogous to a cocktail party effect.
This can be understood through a behavioral analysis. In high-density populations, group norms of “quiet listening” may be reinforced, leading to a suppression of individual vocal behavior. In suboptimal conditions, students might reduce their overall willingness to participate due to discomfort, rather than simply becoming more active due to the larger group size.
Furthermore, this finding partially contradicts Hodgson’s assumption, which, in a preliminary predictive formula for SA level, included occupancy as a contributing factor. The same limitations previously mentioned regarding the restricted dataset also apply here. This point will be further discussed in the following section.
4.4. Predicted vs. Measured Student Activity Level
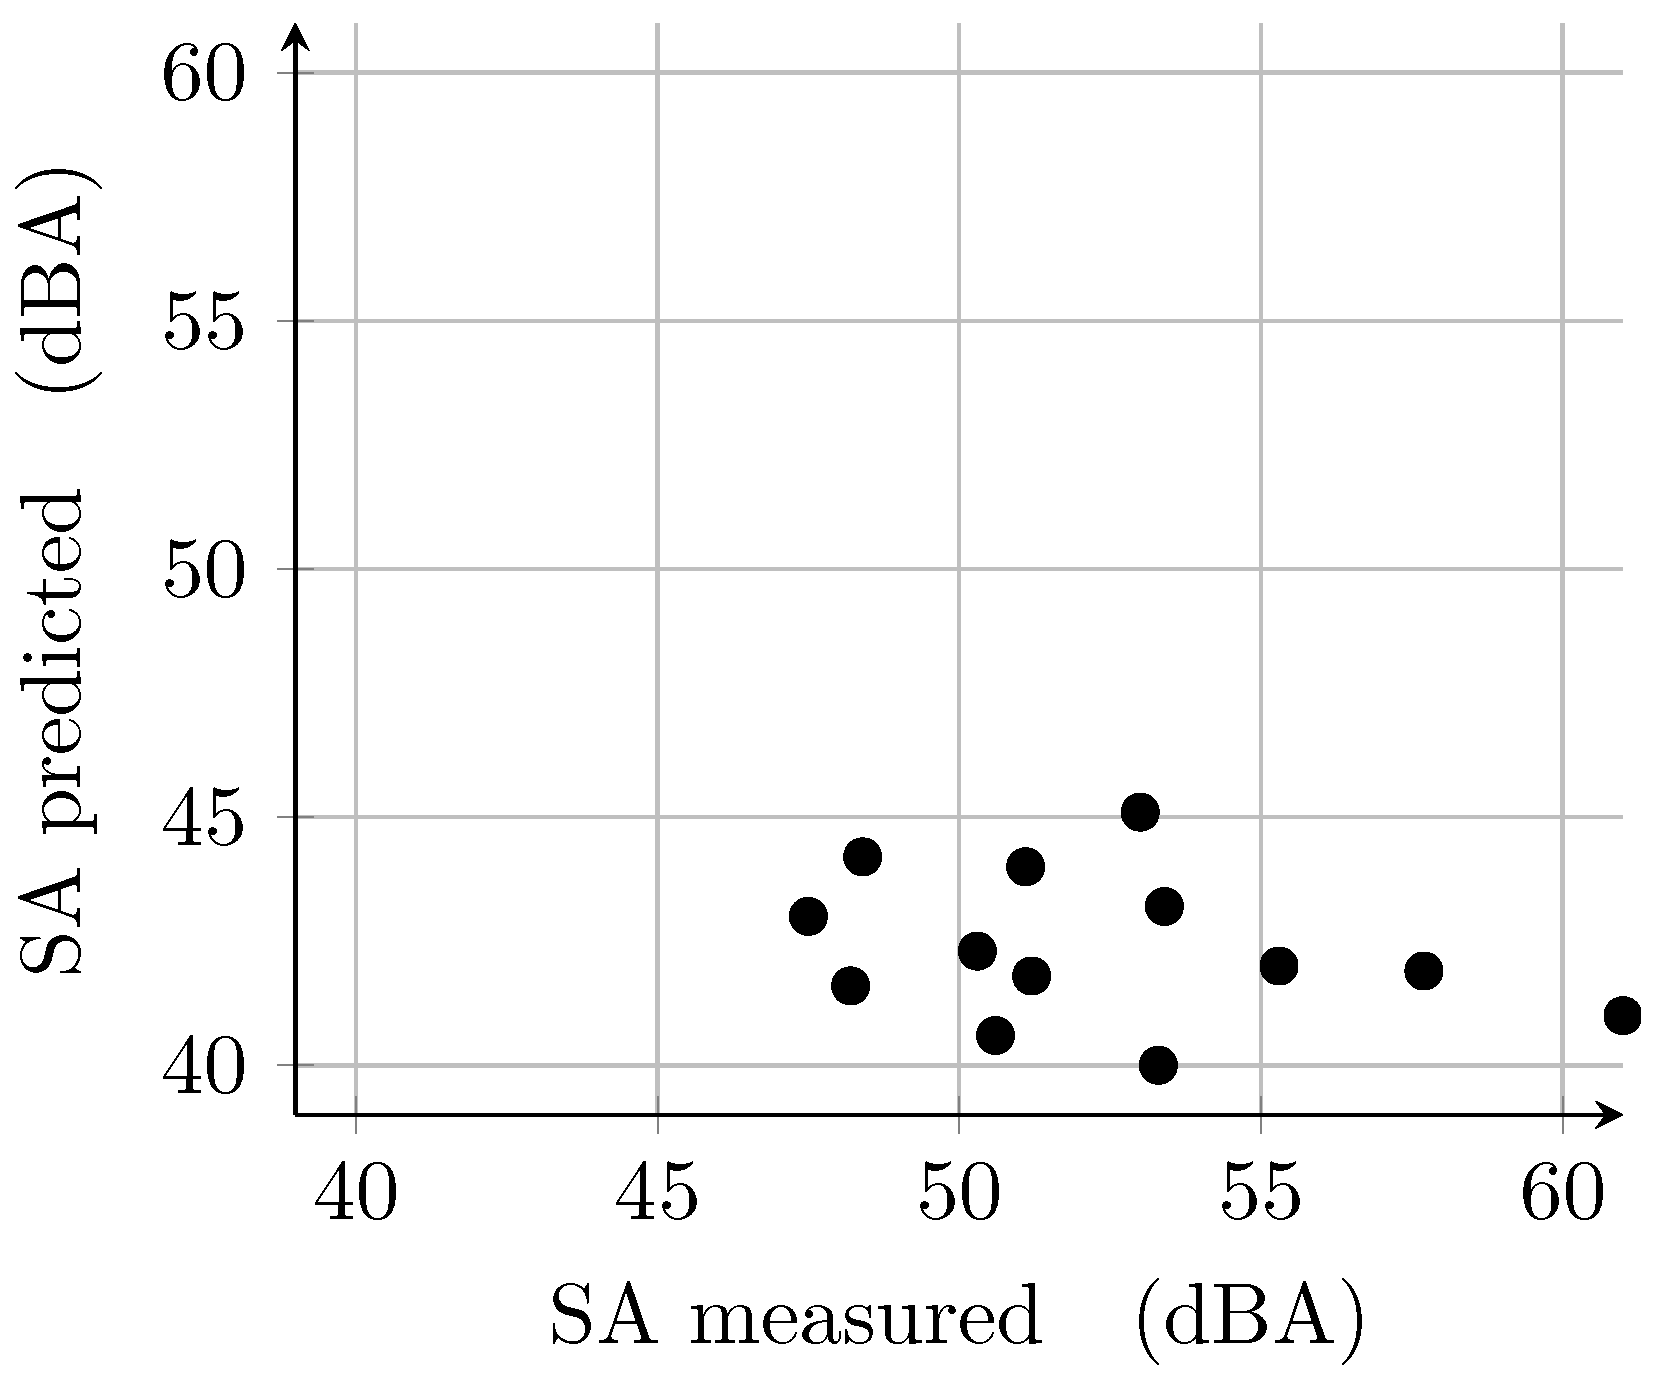
A prediction model for SA level was proposed by Hodgson [
5] as follows:
where
- -
N is the occupancy;
- -
A is the absorption area of the classroom in occupied conditions, in .
Based on
N, and
A values in occupied data for each lesson (see
Figure 2), it is possible to compare predictive data from Equation (
3) with measured data; see
Figure 7.
There are several observations to be made. The values derived from Hodgson’s formula appear to “saturate” around a range of 40–45 dB, whereas the measured values exhibit a wider range. This discrepancy could be attributed to the fact that Hodgson’s empirical formula is based on measurements conducted in a context where the Lombard effect does not manifest. Specifically, in the formula in Equation (
3), the Lombard effect is implicitly ignored: the factor multiplying logN is 10, while in the case of the Lombard effect, the factor becomes
, where
c is the Lombard slope (see ISO 9921 [
40]). When considering the Lombard slope, the SA values undergo an expansion.
Moreover, Hodgson’s formula seems to imply a certain mechanism of the cocktail party effect. The cocktail party effect is a cognitive phenomenon that enables individuals to focus on a single stream of auditory information, such as a conversation, while ignoring other surrounding sounds in a crowded and noisy environment. This effect demonstrates the brain’s selective processing ability [
41]. As a consequence, people (i.e., students) tend to converse in groups, and a tendency has been observed for groups to have similar sizes depending on the type of individuals, the environment, and the spatial geometry [
42]. This implies the definition of a group size
g, which represents the ratio between talking students and silent students.This can be inferred from the fact that Equation (
3) accounts for all N students and incorporates the value
(
g is the group size) as part of the first constant 83.0.
Furthermore, if we assume the starting point of the Lombard effect to be at 45 dBA of ambient noise, it becomes evident that even around 45 dBA, the measured level is higher than predicted by several dB. This bias could be due to local factors and/or the educational context. For example, Italian university students might tend to speak more due to factors such as longer lecture fragmentation, or local cultural aspects causing Italian students to use a different sound power level compared to U.S. [
5] or Korean [
36] students.
5. Conclusions
This study employed state-of-the-art techniques to measure the student activity (SA) level based on audio monitoring. Simultaneously, variations in temperature and relative humidity were recorded in school environments that experienced significant fluctuations in student presence between lectures.
The results showed a partially uncorrelated behavior between the average temperature recorded inside the lecture hall during each session and the corresponding occupancy level.
A result of particular interest contextualized within the specific scenario of environments in sub-optimal conditions was that the SA level appeared to negatively correlate with occupancy. In other words, in highly attended lecture halls, the higher the occupancy, the lower the SA level. A somewhat consistent behavior emerged: above a certain SA level threshold, students tended to speak less. In other words, the relationship between SA level and occupancy density did not correlate as one might have expected based on the concept of group size typical of cocktail party effects.


 ,
, 


