Article

Seasonal Pollution Levels and Heavy Metal Contamination in the Jukskei River, South Africa

1
Analytical Chemistry Division, Mintek, Private Bag X3015, Randburg, Johannesburg 2125, South Africa
2
School of Chemistry, University of the Witwatersrand, Private Bag 3, WITS, Johannesburg 2050, South Africa
*
Author to whom correspondence should be addressed.
Appl. Sci. 2025, 15(6), 3117; https://doi.org/10.3390/app15063117
Submission received: 9 February 2025 / Revised: 9 March 2025 / Accepted: 10 March 2025 / Published: 13 March 2025
(This article belongs to the Special Issue Exposure Pathways and Health Implications of Environmental Chemicals)

Abstract

:
Monitoring river systems is crucial for understanding and managing water resources, predicting natural disasters, and maintaining ecological balance. Assessment of heavy metal pollution derived valuable data which are critical for the environmental management and regulatory compliance of the Jukskei River. Heavy elements were evaluated in the Jukskei River for seasonal impact, potential health risks, and contamination level with concentration levels ranging from 6900 mg/kg iron (Fe) to 0.85 mg/kg cadmium (Cd) in the dry sampling season and 6900 mg/kg Fe to 0.26 mg/kg Cd in the wet season. Enrichment factor analysis indicated high contamination levels of Fe and Pb in both dry and wet seasons. Moreover, pollution indicators revealed extremely high contamination of geo-accumulation and enrichment factors in the downstream to upstream in both seasons with a mild contamination factor for mercury (Hg). Principal Component Analysis revealed anthropogenic sources of arsenic (As), Cd, and Pb due to wastewater and agricultural pesticide application while Thorium (Th), uranium (U) and Hg were attributed as a results of gold mining activities. ANOVA and Pearson correlation analysis showed a high and moderate link between As–Pb, Cd–Pd, and As–Hg, which are significantly correlated. The potential ecological risk index assessment revealed a significant impact of heavy metals on the freshwater ecosystem.

1. Introduction

River pollution is a significant environmental issue that affects water quality, aquatic life, and human health, particularly in perennial rivers exposed to toxic substances from agricultural activities, industrial effluents, and stormwater runoff. The lack of stringent regulatory adherence exacerbates this issue, leading to the accumulation of harmful pollutants such as heavy metals, pharmaceuticals, and organic waste in river systems. These pollutants pose serious health risks to humans and aquatic organisms, necessitating urgent intervention and policy implementation to mitigate their impact [1]. Freshwater ecosystems, including streams, reservoirs, rivers, lakes, and wetlands, provide around 33% of the world’s potable water; yet, humanity is facing a lack of drinkable water [2,3,4]. Urban rivers serve as the primary freshwater resource while also acting as major catchment sites for storm runoff and urban sewage. The impact of river pollution is extensive, affecting not only the aquatic ecosystem and water resources, but also the health of communities, biodiversity, and economic activities [4,5]. Cumulative effects may arise as the aquatic biotic assemblages face continuous habitat loss, degrading water quality, and intensive competition for limited resources. Depending on their life cycle and habitat needs, organisms may react differently under extreme aquatic environmental conditions, as the consequence of the changes, diversity, abundance, and community structure of aquatic inhabitants including fish and macroinvertebrate species could significantly be affected by pollution and water stress. The low quality of urban rivers and aquatic mortality prompts a pressing need to implement the proper enforcement of control measures [6,7].
It is challenging to comprehend the physicochemical properties of river sediment, which are dependent on environmental factors including climate, geology, and human activity. Studies on the chemical and mineralogical composition of the rivers and dams showed the linkage to the spatial distribution of sediments [8,9]. Three distinct types of sediments such as coarse, silt, and clay exhibit resistance to erosion due to their cohesive granules, which are bound together by chemical forces that promote agglomeration, hence driving the colloidal suspension and affecting water quality in river systems [8,10]. Seasonal variations influence colloidal resuspension and sedimentation, intensifying river pollution. Sediments can be used to provide crucial insights into the source of pollution and the significance of anthropogenic impact on river contamination. Sediments can absorb contaminants, particularly heavy metals, and act as both a repository and a secondary source of toxic substances in urban rivers [11,12]. Heavy metals constitute a category of pollutants recognized for their detrimental effects on humans and aquatic organisms, even at minimal concentrations, and are among the most prevalent contaminants detected in water [13,14,15]. The toxicity and environmental persistence of heavy metals is exacerbated by their tendency to bioaccumulate and biomagnify in aquatic organisms, leading to significant ecological and health risks [16,17,18]. The detrimental effects of river pollution are well documented; however, it is critical to consider the role of river network topology in managing pollution risks and devising effective management strategies are essential to mitigate the effect of pollution sources to ensure sustainable water resources [19,20]. Rapid urbanization and industrialization have exposed the Jukskei River with large volumes of runoff flooding from different areas from Johannesburg City in South Africa, containing a broad range of toxic substances including heavy metals. A variety of transport channels, such as vadose zone leaching, storm water runoff, seepage atmospheric deposition, and discharge from dams and creeks have been reported to be entering the Jukskei River through the Modderfontein, Klein Jukskei, and Braamfontein Streams [21]. The primary contributors to pollution of the Juskei River have been identified as the chronic decay of waste removal infrastructures, industrial effluents, and agricultural and urban runoff which produce high levels of chemical pollutants, organic wastes and hazardous substances [21,22]. The pollution assessment of heavy metals in the Juskei River is critical for water quality sustainability, protection of the ecosystems, and to ensure public health. Understanding the dynamics of pollutants and identification of pollution sources is essential to implement systematic approaches for river management and pollution mitigation. Seasonal pollution assessment in the river stream is greatly important since determining the extent and impact of contamination influenced by a variety of anthropogenic factors can vary significantly, requiring development of effective pollution management strategies. A variety of complex monitoring techniques are typically implemented to drive water quality monitoring, pollution impact assessment, and source identification to ascertain trends and potential health risks, thereby facilitating targeted interventions and sustainable management practices. A factor analysis, which reduces the number of associated variables in complex data sets, is employed to achieve dimensionality reduction when identifying potential sources of contaminants through principal component analysis (PCA) and other multivariate statistical methods. The multivariate analysis is important to identify patterns and relationships among multiple variables simultaneously, particularly when examining complex relationships and concepts, as it enables understanding of the data and their relevance to real-world cases [19,23]. In this study, multivariate analysis is implemented to identify potential sources of contamination of Jukskei River pollution as it is frequently employed in studies on dams, groundwater, and other river water classification to attribute sources of pollution, decipher trends of water quality, and classify regions with comparable contamination levels [24]. Monitoring of heavy metals such as thorium (Th), metalloid arsenic (As), uranium (U), cadmium (Cd), lead (Pb), and mercury (Hg) and source identification in the Jukskei River is critical knowledge dissemination which is significant to environmental monitoring stakeholders to determine the best ways to address the nation’s pollution issues, evaluate the extent of contamination, and improve strategies for water pollution reduction. This study aimed to quantify selected heavy metals in different seasons of Jukskei River in South Africa and assess their potential sources using multivariate statistical technique.

2. Methodology

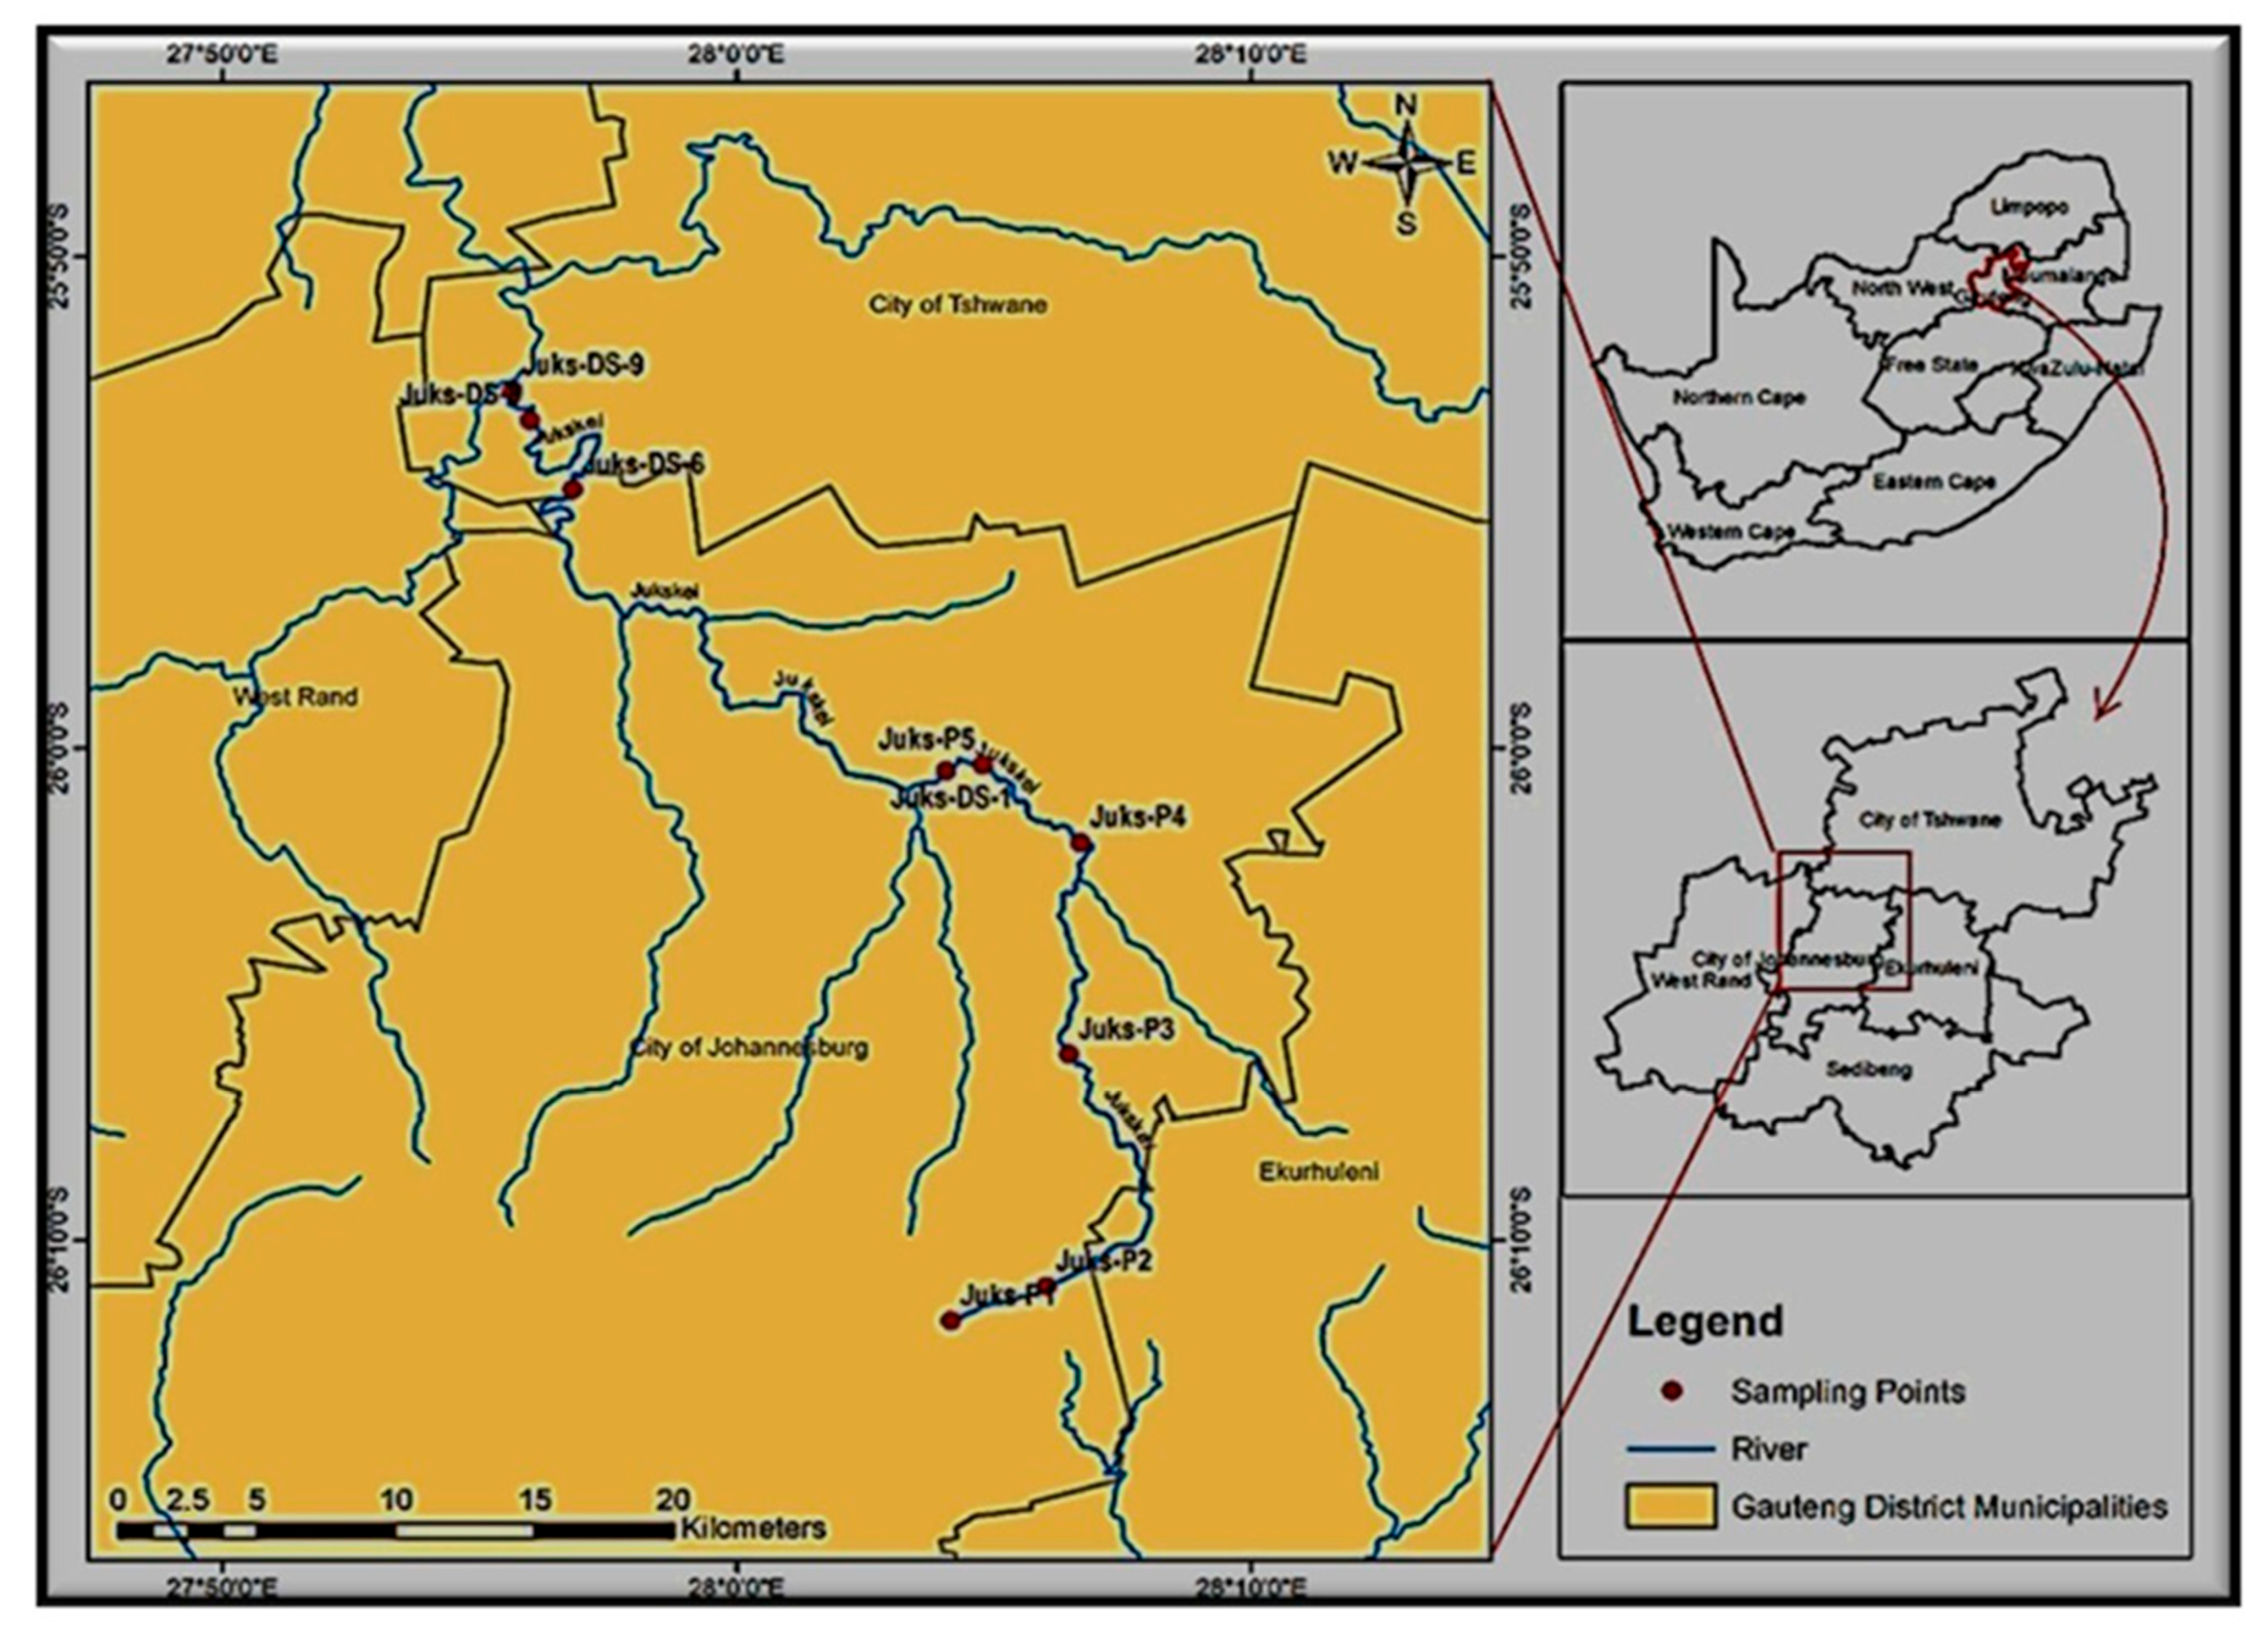
2.1. Study Area and Sampling Campaign

The Jukskei River, located in Johannesburg, South Africa, is a significant watercourse that has garnered attention due to its environmental, social, and economic importance. This river, part of the larger Crocodile River (West) basin, flows through highly urbanized areas, including the Alexandra Township, and supports a population of approximately 400,000 people [25]. The Jukskei River catchment covers an area of 800 km2 and is one of the fastest-growing catchments in terms of population and land use changes. It provides a habitat to a variety of fauna and flora, including indigenous trees, invasive plants, and other species, while under pressure from rapid urbanization, which exacerbates flooding and water scarcity issues. The catchment’s groundwater resources are also highly vulnerable to contamination due to hydrological characteristics and land use practices. Despite its importance, the river faces numerous challenges, including pollution, land use changes, and inadequate management practices, which threaten its water quality and the surrounding ecosystem [26]. These challenges necessitate comprehensive management strategies to ensure sustainable water resource use and environmental protection. Continuous monitoring, surveillance, and source identification are necessary to mitigate the effects of heavy elements in the river. Sediment samples were collected from the Jukskei River during wet (September 2024) and dry (March 2024) seasons and the GPS coordinates collected at each sampling point were used to plot the sampling points presented Figure 1. During the sampling campaign, the upstream sampling points Juks-P1 to Juks-P5 were in proximity with mining dumps, industrial activities, and high-density population. The downstream (Juks-DS 1 to Juks-DS9) farms and water treatment facilities were the major activities in this part of the study area. Convenience sampling was adopted because of efficiency, cost-effectiveness, and the effortless nature of the method since it allows sample collection based on river accessibility and pollution hotspots. Despite advantages offered by the convenience sampling method, it faces challenges related to biasness and limited spatial representation. Convenience sampling may introduce bias if the selected locations or times do not represent the broader river system. For instance, sampling only during low-flow conditions may miss pollution events that occur during high-flow periods [27]. Focusing on convenient locations may result in incomplete coverage of the river basin. This can lead to gaps in understanding the spatial distribution of water quality parameters [24]. The convenience sampling method and conventional pre-treatment approach were adopted from several researchers [21,28].

2.2. Reagents and Instrumentation

High-purity chemicals were used for sample digestion, including 40% HF (Herenba, Chennai, India), 37% suprapur HCl, 65% HNO3, 70% HClO4 (Merck, Darmstadt, Germany), 99% suprapur Sc (DLD scientific, Durban, South Africa), and 30% H2O2 (ACE chemicals, Johannesburg, South Africa). Standards for calibration curves and control standards were prepared from 1000 mg/L sourced from De Bruyn Spectroscopic Solutions (Johannesburg, South Africa). Certified reference materials (CRMs) Oreas 121, Oreas 750, and Oreas 751 (Oreas, Melbourne, Australia) were employed to verify the analytical procedure’s quality control. Heavy metals were quantitatively determined using the 7800X inductively coupled plasma–mass spectrometry (ICP–MS) and 5110 inductively coupled plasma–optical emission spectroscopy (ICP–OES) (Agilent Technologies, Santa Clara, CA, USA). Water used for preparation of standards solutions and sample dilutions was purified by Milli-Q Direct 16 purifi-cation system (Merck, France). To prepare standards and dilutions, ultra-pure de-ionized water measuring 18 mΩcm was employed.

2.3. Sediments and Water Samples Preparation

Approximately 0.500 g of sediment samples were added into Teflon digesting vessels followed by HNO3, HClO4, and HF for acid digestion processes and transferred to the required volume [29]. For Hg sample preparation, 0.500 g of samples were weighed and transferred into a 100 mL volumetric flask. HNO3 and HCl were then added and heated to 60 °C in the water bath. After digestion, the samples were allowed to cool and subsequently diluted to the required volume using Millipore water. Approximately 0.200 g of sediment samples mixed Na2O2 and Na2CO3 and fused using automated fusion. Water samples were prepared by the procedure reported Mukwevho et al. [26] for analysis using ICP–MS. The method’s quality was evaluated using relevant references as reported in the ISO 17025 certification for testing and calibration laboratories [30].

2.4. Sediment Quality Assessment

The amounts of heavy metals were used to assess pollution levels, source identification, and ecological risk in the river system. Pollution indicators, including enrichment factor (EF), contamination factor (CF), and geo-accumulation index (Igeo), have been employed to evaluate the level of contamination, with Fe serving as the reference element [21,31]. The reference values used for calculation of selected pollution indices were as described by several researchers as As (12.7 mg/kg), Cd (mg/kg), Hg (0.02 mg/kg), Pb (10 mg/kg), Th (10 mg/kg), U (10 mg/kg), and Fe (10,000 mg/kg) [4,31,32]. The contamination level to assess severity of water pollution followed similar pollution indices as sediment quality, however, differing by reference values for each parameter as described by Mukwevho et al. [21]. The range of contamination levels were evaluated for the effect of human activities on accumulation of hazardous components. The EF value determined from Equation (1) in the range of 10 to 50 indicates severe to extremely high enrichment for both water and sediments quality assessment. Equation (2) was used to determine the values that determined the CF, where a CF > 6.0 indicated extreme contamination. The Igeo was calculated using Equation (3) and was used to quantify the accumulation of heavy metals only in sediments to explain the variations brought on by the lithogenic factors taken into consideration by using a background matrix factor of 1.5.
Enrichment   factor   ( EF ) = C x C r e f s e d i m e n t C x C r e f b a c k g r o u n d
Contamination   factor   ( CF ) = C x   s e d i m e n t C x   r e f e r e n c e
Geo - accumulation   index   ( Igeo ) = l o g C n 1.5 B n
The relationship between the concentration of element x and that of the sediment’s reference element is represented by the (Cx/Cref) sample while the background value denotes the ratio of element x’s concentration to that of the reference element for Equation (1). The CF values were determined using Equation (2), where (Cx)reference represents the amount of the reference element and (Cx)sediment indicates the concentration of element x in the sample. In Equation (4), Cn represents the concentration of the sediment element x, whereas Bn denotes the background value of the reference [26].
Potential ecological risk index is a calculated statistic that indicates the possible ecological risk of heavy metals and metalloids in sediments in a certain aquatic system (ERI) [33]. The RI was calculated using Equation (4). The potential ecological risk of sediments is be divided into five grades shown in Table 1.
RI = ∑Ei = ∑Ti(Cis/Cin)
where RI represents the potential ecological risk index, Cis represents the heavy metal i level in the sediment, Cin represents the background value of heavy metal I, and Ti represents the toxicity coefficient of the ith heavy metal that reflects the toxicity level of the heavy metal.

2.5. Principal Component Analysis

To evaluate pollution sources that affect water quality, PCA determines the degree of dispersion in water quality measures. Strong, moderate, and light loadings are defined as absolute factor loadings greater than 0.75, between 0.50 and 0.75, and between 0.30 and 0.50, respectively, using XLSTAT Basic software to calculate the PCA and correlation coefficient [34].

3. Results and Discussion

3.1. Dry and Wet Season Concentrations of the Heavy Metals

Quantitative determinations of As, Cd, Fe, Hg, Pb, Th, and U in sediment collected during the wet and dry seasons of the Jukskei River are presented in Table 2. The levels of heavy metals in sediments decreased in the following order: Fe > Pb > As > Th > U > Cd > Hg in the wet season and Fe > Pb > Hg > As > Th > U > Cd for the dry season. Compared to the wet season, the dry season has a greater concentration of Hg, attributed to sediment dilution because of the addition of run-off flooding during the rainy wet season [35]. The maximum concentration of Pb of 475 mg/kg was detected at sampling point Juks-P2 and the lowest concentration of 12.6 mg/kg at point Juk-P3. For the dry season, the maximum concentration for Pb was determined at the point Juk-P1 with a concentration of 267 mg/kg and the lowest 14.8 mg/kg concentration at Juk-DS-6. The concentration levels were high for both dry and wet seasons and they were higher than the 10 mg/kg Pb reference that was used for pollution indices determination in this study. The Pb pollution activities in sampling points Juks-P1 and Juks-P2 are indicative of concerning pollution and continual Pb input in the Jukskei River. Previous studies in the Jukskei River reported Pb concentration in the sediments ranging from 123 mg/kg to 1921 mg/kg [36]. The significance of measured Pb contamination was compared to the values obtained by other studies around the world. Pb concentration of an average of 14.2 mg/kg was detected at Afon Ystwyth River [37]; the study on the river sediments of Nakdong River, South Korea found a 78.5 ± 25 mg/kg Pb concentration [38]; in the Pearl River Delta, China, the Pb concentration in the sediments was 73.0 mg/kg [39]. These Pb concentrations mentioned above recommended 5 mg/kg in the sediment by the Food and Agriculture Organization of the United Nations [40]. The highest concentration of 77.5 μg/kg and lowest of 8.45 μg/kg for Hg at respective Juks-P1 and Juks-DS-6 points during the wet season were at trace levels. The concentration for Hg in the dry season shows a considerable increase with the highest concentration of 12,100 μg/kg at point Juks-DS-6 and lowest of 3650 μg/kg at Juks-P1.
The primary sources of Hg in river systems include industrial discharges, legacy contamination from historical gold and coal-fired power station activities, atmospheric deposition, and natural geological processes with each of these sources contributing differently to the Hg load in river systems. The considerable Hg contamination during the dry season in river systems could be attributed to a variety of sources that are mostly anthropogenic rather than natural inputs. These sources can instigate the complex cycling and distribution of Hg in aquatic environments, thus leading to detrimental impacts to the ecosystems and human health [21,36,41]. The dry-season Hg concentrations are higher than the background concentration, but they are lower than the sediment Hg concentration found in Kimbi River DRC [42,43]. These rivers drain artisanal gold mining sites in a manner similar to the Jukskei River, which drains the site that is infamous for its mine dumps and illicit mining activities like in the Tambopata and Malinowski Rivers, Peru [44,45,46]. The abundance of radionuclides and heavy metals in river systems are diverse, encompassing both natural and anthropogenic origins. The detected levels of Th, U, and Cd showed no significance differences in both the dry and wet seasons. As was at the highest (8.14 mg/kg) at point Juks-P2 and lowest (3.55 mg/kg) at Juks-DS-8 in the dry season whereas the concentration levels of 8.6 mg/kg and 1.3 mg/kg at Juks-P2 and Juks-DS-9 were determined during the wet season. The potential sources contributing to the presence of Th and U in the river sediment and waters may affect the ecological and radiological characteristics of these environments [47]. The toxicity and bioaccumulation nature of As is influenced by biotic factors, such as biofilms and aquatic organisms, and abiotic factors, including sediment composition and water chemistry, which may result in significant ecological and health implications [11]. During dry seasons, finer sediment particles settle out, concentrating the heavy metals in a smaller area, while during wet seasons, increased water flow can suspend the sediment, distributing the metals more widely throughout the river system, but still largely contained within the sediment matrix [48]. This is because most heavy metals bind to sediment particles and are primarily transported and deposited with the sediment itself [49,50]. Depending on the predominant sediment type, the composition of the sediment can affect how metals bind and are released, perhaps causing minor seasonal fluctuations [51,52,53].
The accumulation of anthropogenic-induced heavy metals dispersed throughout the water requires a feasible safety precaution and management strategies for river water systems [54]. The As, Cd, and Pb determinations in water samples were undetected in both wet and dry seasons, as presented in Table 3. The concentrations of Hg were notable, ranging from 0.01 to 0.07 μg/L in both sampling seasons. The highest U concentrations of 0.34 and 0.95 μg/L were detected at Juks-P5 in both wet and dry seasons whereas a Th concentration of 62 µg/L at Juks-P1 was notable in the dry season. The variation of Hg, Th, and U in both sampling seasons indicated continuous introduction of these pollutants through either anthropogenic or natural input in the river water system. The presence of these elements in river water can lead to various health risks and ecological disturbances. For instance, heavy metals can bioaccumulate in aquatic organisms, such as fish, which are then consumed by humans, leading to potential health risks. This bioaccumulation is particularly concerning for elements like Pb and Cd [55].
South Africa has established water quality regulations to ensure the protection of aquatic ecosystems and human health by setting permissible limits for various contaminants in water. The assessment of Jukskei River water quality is crucial for ensuring compliance with national water quality regulations and safeguarding public health. For instance, the high concentration level of Th in the dry sampling season highlights that contamination levels of heavy metals in South African rivers often exceeds permissible limits set by local and international guidelines [28,56]. With regards to ecological impacts, heavy metals can adversely affect the physiological health of fish, leading to changes in oxidative stress markers and energy reserves. This can result in reduced fish populations and biodiversity in affected rivers. These findings underscore the need for stringent monitoring and management practices to protect water resources and public health.

3.2. Sediment and Water Quality Assessment Using Pollution Indices

Geo-accumulation indexes serve as a numerical indicator to determine the degree of pollution [57]. This can act as a reference point for approximating the degree of heavy metals contamination in aquatic ecosystems. The Igeo values in Table 4 displayed some differences for Pb pollution in sediments for both dry and wet seasons. In the dry season, the Igeo Pb falls under class 5, heavily due to extreme contamination at Juk-P1. This might be due to human activities taking place around this sampling point. Several studies have reported crumbling and non-existent drainage infrastructure in and around the Jukskei River [58], and some settlements do not have drainage and sewage infrastructure, which may increase pollution [59]. Some sources of Pb pollution include Pb-based paints and batteries; due to poor infrastructure, they easily end up in water streams. Geo-accumulation indexes for the wet season indicated class 5 extreme contamination at Juk-P2. Geo-accumulation indexes for Hg in the dry season shows high contamination in all sampling sites. For the wet season, geo-accumulation indexes show no pollution. The Igeo of As, Cd, Th, and U showed unchanged status for both the wet and dry season, which is similar to studies at Setiu River, Malaysia [60]. The Igeo for Pb and Hg in the dry season is higher than in the wet season; this might due the concentration of lead in the sediment being much higher than the reference concentration. This is probably because there is less water flow during drier periods, which allows more Pb and Hg to settle and accumulate in the sediment, which implies that the pollutants in the riverbed are concentrated because there is no dilution from rainwater [49,61]. The upstream Igeo for Pb in Juks-P1 (dry season) and Juks-P2 (wet season) showed high pollution, which is indicative of high Pb discharge to the driver. Juks-P1 is located close to several motor workshops where oil discharge cannot be avoided. Juks-P2 is located in the very densely populated settlements which suffer from pollution and sewage spillages.
The calculated results for the CF are given in Table 5. This investigation showed that CF values of elements analyzed for the dry season ranged from 0.28 to 1.76, 0 to 0.36, 183 to 602, 1.43, 0.31 to 0.82, and 0.14 to 1.73 for As, Cd, Hg, Pb, Th, and U respectively. The CF for the wet season ranged from 0 to 0.79, 0 to 0.6, 0.42 to 3.88, 1.26 to 47.5, 0.35 to 0.58, and 0.13 to 0.29 for As, Cd, Hg, Pb, Th, and U, respectively. The contamination factor in the dry and wet seasons showed a low degree of contamination of Cd. The CFfor As showed a moderate degree of contamination in Juk-P1 and a low degree of contamination in the wet season. The CFfor Hg in the dry season showed a very high degree of contamination in all sampling points, and in the wet season the CF showed considerable contamination at Juk-P1 while other sampling points showed a low degree of contamination. The CFfor Pb in the wet season showed considerable contamination in Juk-P1 and a very high degree of contamination in Juks-P2. Juks-P3, Juks-P4, Juks-P5, Juks-DS-1, Juks-DS-6, Juks-DS-8, and Juks-DS-9 showed moderate contamination. The CF for Pb in the dry season showed very high contamination for Juks-P1 and considerable contamination at Juks-P2 and Juks-DS-1. The CF for Juks-P3, Juks-P4, Juks-P5, Juks-DS-6, Juks-DS-8, and Juks-P9 showed moderate contamination [62].
Enrichment factor results displayed in Table 6 for As, Cd, Th, and U for both the dry and wet season have enrichment factors of less than 2, which indicate minimal enrichment. Enrichment factors for the Hg wet season showed minimal enrichment and for the dry season the results indicate extremely high enrichment for Hg with an enrichment factor higher than 40. Enrichment factor for Pb for the wet season at Juks-P1, Juks-P3, Juks-P3, Juks-P4, Juks-P5, Juks-DS-1, Juks-DS-2, Juks-DS-6, Juks-DS-8, and Juks-DS-9 showed moderate enrichment. Enrichment factor for Pb for the dry season at Juks-P2, Juks-P3, Juks-P3, Juks-P4, Juks-P5, Juks-DS-1, Juks-DS-2, Juks-DS-6, Juks-DS-8, and Juks-DS-9 showed moderate enrichment. The eEF for Pb showed high enrichment in sample Juks-P2 (wet season). The EF for Pb showed high enrichment in sample Juks-P2 (dry season). Enrichment factor values between 0.5 and 1.5 show that the element is entirely geogenic and EF values over 1.5 indicate that the sources are more likely to be anthropogenic [63]. Enrichment factor analysis indicated that the study area has a high level of sediment contamination and source apportionment is necessary.
Hg concentrations reported for the dry season in the sediment of the Jukskei River were higher than the background concentration and exceeded the severe effect level (SEL) of 2000 µg/kg adopted by the Ontario Ministry of the Environment [29]. The results are not surprising because recently newspapers have reported the discovery of dead fish and the absence of frogs in the Jukskei River ecosystems, prompting the municipal investigation of pollution on the Jukskei River. The phenomenon of high pollution of Hg is not new in South Africa; high concentrations were reported in the Mngceweni River [64]. The presence of industries and other activities close to the environmental water is proving to be a source of pollution of the Jukskei River. The Jukskei River’s tributary, the Modderfontein Stream, was identified as the source of heavy metal contamination in earlier chemical pollution investigations [65]. The Modderfontein Stream is situated close to a power station, an explosives company, and other industries. Even though it is proven that industries prosper when they are closer to water bodies, the vast pollution that rivers like the Jukskei River experience is a concern and is a consequence of discharge of untreated waste from the industrial activities [66].

3.3. Pearson Correlation Matrix

A crucial tool for assessing the strength of a linear relationship between two elements and linking similar pollution sources and distribution routes is the Pearson correlation matrix [67]. In Pearson correlation analysis (Table 7 and Table 8), a coefficient value of 1 for each pair indicates a perfect correlation, while a value of zero may deviate from the correlation [68]. The result of 0.558 in the correlation analysis of the wet season indicates a high link between As–Pb. Additionally, there is a high correlation between As–Hg and a moderate correlation between Hg–Cd during the wet season. Furthermore, there is a high correlation between Pb–Cd but it is not significant, with p = 0.143, according to the p-values for Pb–Cd derived from ANOVA calculations. A p > 0.005 suggests that there is no substantial link between Pb–Cd, according to the literature [69]. In the wet season, Fe, which is used as a reference metal, has a significant correlation with Pb–As with the p-values of 1.40 × 10⁻⁷ and 1.32 × 10⁻⁷, respectively, which means they probably have the same source. The ANOVA calculations for the dry season reveal the significant correlations of Th and U with p-values of 1.01 × 10⁻⁶, which shows that the two heavy metals might have similar sources. It is observed in the wet season that the correlation of heavy metals is moderate, and this can be due to increased runoff from rain, which carries higher concentrations of metals from land sources like agricultural fields, industrial waste, and urban areas [70]. As the water flow slows down during the wet season, the metals accumulate in the sediment and the mechanism of sedimentation is dependent on the grain type [71].
In the dry season, for the reference metal Fe, its p-values show a significant correlation with As, Cd, Pb, Th, and U with p-values of 0.001, 0.001, 0.001, 0.001, and 0.001, respectively. In the dry season there is a perfect correlation between As–Cd, Pb–Cd, and Pb–As. The As–Pb correlation finding is comparable to the finding in Korotoa River, Bangladesh [72] and the plain river network region, southern China [73]. The strong correlation between Cd and Pb may be associated due to a similar source as they are wastes from industries like mining, battery recycling, and smelting [74,75]. The strong correlation between Cd and Pb followed other trends from other studies [76,77,78]. Strong correlation between heavy metals indicates that they most likely come from comparable human anthropogenic sources such as mining operations or agricultural activities and industrial wastewater discharge. There is a high correlation between U and As in the dry season. As was shown to have a high concentration in the dry season, probably due to less impact of runoff water and the aerobic environment [79,80]. As is a poisonous element and can be elevated in water bodies by pH and redox potential [29]. Fe pollution in the river was significant and the results showed that Fe is higher than the background concentration and likely a result of anthropogenic sources. East of Johannesburg, where the river starts and traverses around informal, formal, and industrial areas, is the site of major economic activities where waste management by-laws are not fully followed and enforced. The positive correlation between Th and U indicates similar sources and is probably the impact of previous gold mining activities. Abandoned mines and mine dumps are the source of the acid mine drainage that is menacing environmental waters in Johannesburg [81,82]. Among the things that have made it easier for metals to be mobilized from host rocks into the water supply system through acid mine drainage are intricate geochemical processes that include oxidation–reduction [83]. The results for both water and sediment in the dry season indicate pollution in the Jukskei River. The negative correlation in the dry season for As–Hg was in agreement with a study in Mara River, Tanzania [84]. This might be due to the fact that in river sediments, there is a negative association between Hg and As, meaning they might have been different sources, particularly during the dry season where undisturbed Hg can settle in the bottom sediments [85]. In the wet season there is a moderate positive correlation between As–Hg, where in the wet season the rains can cause As–Hg to be resuspended, or they are similarly affected by the urban pollutant runoff from the same sources [86].
The complete potential ecological risk index (RI) values were computed following Hakanson’s potential ecological risk index assessment [33]. The potential ecological risk grading standard is used to evaluate the results presented in Table 9. The comprehensive potential ecological RI across the nine sampling points shows values exceeding 600, indicating a serious overall level of potential ecological risk during the dry season. For wet season sampling points, Juk-P1 and Juk-P2 show moderate risks, with the other sampling points showing low-grade ecological risks. In recent times, the Jukskei River has received considerable coverage of the pollution that is taking place, and there were startling conclusions that have been reached recently. It has been reported that two thirds of the inflow to the Jukskei catchment is wastewater; some of it is from treatment plants and the rest is raw sewage from the sewer systems [62,87]. The conclusion that can be made is that the flow of the Jukskei is coming from the wastewater rather than the groundwater. The result of this pollution has a significant impact on the ecology. This concern is increased because of the recent discovery of 100 dead fish in the Jukskei River because of toxins that are discarded in the river [63]. The dry season ecological factor in China’s Chishui River Basin suggests that Hg’s high toxicity considerably contributes to the ERI values and a significant impact of Hg on the ecology was also discovered in other studies [33,55].

3.4. Source Apportionment Using of PCA

PCA was used to identify the origins of heavy metals in water samples [88]. The goal of PCA was to decrease the dimensionality of a multivariate dataset to a smaller number of components that best characterize and explain the majority of the data’s content. With absolute loading levels of >0.75, 0.75–0.50, and 0.50–0.30, respectively, the factor loadings are classified as “strong”, “moderate”, and “weak”, since most hydrochemical factors, particularly heavy metals, exhibited comparable behavior [89]. For the wet season (Table 10) factor 1 having an eigenvalue 2.638, it explained 46.571 of the variation, and it obtains strong loading for As with 0.873, moderate for Pb with 0.749, and strong loading for Cd with 0.837. Hg shows moderate loading with 0.500. Strong loading for As, Cd, and Pb suggests an anthropogenic source due to wastewater and agricultural pesticide application. The critical important cause of As pollution is agricultural activities which are dominating the downstream of the study area. There are a number of agricultural operations in the downstream area. Compounds based on As are most likely utilized as pesticides, fungicides, herbicides, and insecticides in agricultural and livestock production [90]. Underground water used for irrigation is often linked to As contamination of crops [91]. The study area includes areas with high population density with poor hygiene and infestation with rats and cockroaches [34]. Unregulated pesticides are flooding the market with deadly consequences rising to the level of national disaster [34,35]. Some reports of pesticides that contain Cd and Pb are applied to deal with pests and the random usage of pesticides results in sediment contamination [92]. Cd and Pb in the study area might be coming from diverse sources like fertilizer application in the farms and golf courses, battery production, and burning of coal from the nearby coal-fired power station. Industrial wastewater and sewage discharge is another major pathway for As, Cd, and Pb to enter the studied area. This is due to the mushrooming of informal settlements and failing wastewater infrastructure, which results in uncontrolled waste spillages through frequent bursts [58]. The presence of Hg in the river water system has long been associated with legacy mining activities and rampant informal and unregulated mining activities [32]. Hg is used in gold processing and with the rampart informal gold mining activities, Hg is a health hazard of concern in the mining communities [93,94]. Factor 2 has an eigenvalue of 1.779, explaining 25.408 of the variation, and obtains 0.825 for Th and 0.819 for U, displaying strong loading, indicating similar distribution channels and anthropogenic origin and pollution can be attributed to the gold mining activities.
For the dry season (Table 11), factor 1 is responsible for 70.897% of the variance and an eigenvalue value of 4. Factor 1 indicates anthropogenic sources, and it showed that there is no correlation between Hg and Pb, As, Cd, Th, and U. The lack of correlation of Hg and other heavy metals can be explained by the fact that the fate of metallic mercury that is manually added to sediments during gold extraction processes does not always follow that of the heavy metals that are already present in geological matrices and that are mobilized with sediment dredging and digging activities; this can be observed by the factor loadings in the dry season and also the correlation factor in the dry season [95]. From the factor loading and correlation data it can be seen that Hg follows its own unique distribution channels which indicate a different source from other heavy metals. As mentioned above, Hg has long been associated with the processing of gold. The pollution of the sediment indicated in the dry season might be revealing the continuous pollution from the wastewater into the water bodies in the dry season [95]. The pollution of the Jukskei as a result of waste disposal was reported in previous studies as well as the risks it poses to the community [58,65,95]. Factor 2, having an eigenvalue of 1.246, explained 17.806 variance and holds moderate loading for Th. Factor 2 suggests some features of geogenic and anthropogenic activities. The concentrations of Th and U in the dry season are relatively similar to the concentrations in the wet season, which might indicate a constant supply of the heavy metals. It has been reported that there is a significant impact of dust from the mine dumps that are scattered in the study area [96]. Different pathways for river sediment pollution exist including wastewater discharge in the river systems and leaching of these dumps during rainfall.

4. Recommendations

4.1. Proposed Regulations to Stem River Pollution

  • Agricultural best management practices;
Permits for farming and botanical practices must include requirements for using buffer strips to stop water runoff and lessen erosion. Proper fertilization should also be adhered to avoid topsoil contamination.
  • Effluent discharge permits and inspection;
Industries and water treatment plants must obtain permits to commit to adhering to discharging effluent into the river. The permit must specify the role of the pollution control inspectorate to enforce compliance.
  • Stormwater runoff regulations.
Households and the municipalities should keep the environment clean by removing litter from the streets; this way, during stormwater events there will be minimal pollution from stormwater runoff.

4.2. Recommendation for Pollution Control Strategies

  • Pollution control education and awareness;
  • Educating people on environmental issues and ways to lessen their effects. This may result in better-informed choices and environmental protection measures;
  • Monitoring river pollution;
  • Continuous river quality monitoring is crucial for identifying pollution hotspots and pollution origin;
  • Compliance monitoring and legal responsibility;
  • Government must enforce compliance and impose strict fines and imprisonment.

5. Conclusions

The quality index assessment for heavy metal contamination indicates that the Jukskei River is polluted in both wet and dry seasons. The potential ecological risk index suggests that pollution during the dry season presents significant ecological concerns which need attention. Despite the disparity in Hg concentration, the results of the dry and wet seasons were comparable, signifying a continual influx of pollutants into the river. Multivariate analysis and water quality indices are effective tools for comprehending river quality and attributing pollution factors. PCA statistical analysis determined that the pollution originated from anthropogenic sources, likely due to wastewater discharge and agricultural practices, whereas the sources of Th and U during the dry season indicate a combination of anthropogenic and geogenic origins.
The overall assessment of heavy metals in the Jukskei River has significance for public health and environmental policy, given the potential risks these metals pose to ecosystems and human health. Understanding heavy metal pollution could provide insights into pollution sources, levels, and trends, thus facilitating policymakers in designing remediation actions. The findings of this research underscore the necessity for a rigorous methodology and rigorous frameworks, effective policies, focused mitigation strategies, and regular systematic monitoring programs to track temporal and spatial variations of heavy metal concentrations to address their contamination. This study recommends the implementation of improved monitoring, pollution control methods, public education initiatives, and river restoration projects that policymakers may employ to achieve water quality goals and ensure a sustainable future for water resources. These mitigation techniques are crucial for maintaining water quality and providing safe water consumption, consequently enhancing public health and environmental sustainability.

Author Contributions

Conceptualization, L.C. and M.R.L.; Methodology, N.M.; Validation, M.R.L.; Formal analysis, N.M. and N.N.; Investigation, N.M. and A.M.; Resources, M.H.M. and J.T.; Data curation, M.H.M., A.M. and M.R.L.; Writing—original draft, N.M.; Writing—review & editing, N.N., A.M. and M.R.L.; Visualization, M.H.M.; Supervision, M.H.M., L.C. and M.R.L.; Project administration, N.N.; Funding acquisition, J.T. and M.R.L. All authors have read and agreed to the published version of the manuscript.

Funding

This research was funded by the Water Research Commission (C2023-2024-01320), Mintek internal Science Vote (ASR-002517).

Institutional Review Board Statement

Not applicable.

Informed Consent Statement

Not applicable.

Data Availability Statement

The original contributions presented in the study are included in the article, further inquiries can be directed to the corresponding author.

Conflicts of Interest

The authors declare no conflict of interest.

References

  1. Campos, C.J.A.; Alves, M.T.; Walker, D.I. Long term reductions of faecal indicator organisms in Chichester Harbour (England) following sewerage infrastructure improvements in the catchment. Sci. Total Environ. 2020, 733, 139061. [Google Scholar] [CrossRef] [PubMed]
  2. Karaouzas, I.; Smeti, E.; Vourka, A.; Vardakas, L.; Mentzafou, A.; Tornés, E.; Sabater, S.; Muñoz, I.; Skoulikidis, N.T.; Kalogianni, E. Assessing the ecological effects of water stress and pollution in a temporary river—Implications for water management. Sci. Total Environ. 2018, 618, 1591–1604. [Google Scholar] [CrossRef] [PubMed]
  3. Mishra, R.K. Fresh Water availability and It’s Global challenge. J. Mar. Sci. Res. 2023, 2, 1–9. [Google Scholar] [CrossRef]
  4. Wang, J.; Yuan, S.; Tang, L.; Pan, X.; Pu, X.; Li, R.; Shen, C. Contribution of heavy metal in driving microbial distribution in a eutrophic river. Sci. Total Environ. 2020, 712, 136295. [Google Scholar] [CrossRef] [PubMed]
  5. Cabral, J.P.S. Water microbiology. Bacterial pathogens and water. Int. J. Environ. Res. Public Health 2010, 7, 3657–3703. [Google Scholar] [CrossRef]
  6. U.S. Department of the Navy. 3.2 Sediments and Water Quality; Training and Testing Draft EIS/OEIS; U.S. Department of the Navy: Hawaii, CA, USA, 2017. [Google Scholar]
  7. Bao, Q.; Liu, C.; Friese, K.; Dadi, T.; Yu, J.; Fan, C.; Shen, Q. Understanding the Heavy Metal Pollution Pattern in Sediments of a Typical Small- and Medium-Sized Reservoir in China. Int. J. Environ. Res. Public Health 2023, 20, 708. [Google Scholar] [CrossRef]
  8. Tundu, C.; Tumbare, M.J.; Onema, J.M.K. Sedimentation and its impacts/effects on river system and reservoir water quality: Case study of Mazowe catchment, Zimbabwe. Proc. Int. Assoc. Hydrol. Sci. 2018, 377, 57–66. [Google Scholar] [CrossRef]
  9. Buscaroli, A.; Zannoni, D.; Dinelli, E. Spatial distribution of elements in near surface sediments as a consequence of sediment origin and anthropogenic activities in a coastal area in northern Italy. Catena 2021, 196, 104842. [Google Scholar] [CrossRef]
  10. Osaro, I.L. Turbulent Suspension and Sediment Grains Transport in Natural Flows. Ph.D. Thesis, Royal Holloway, University of London, Egham, UK, August 2018. [Google Scholar]
  11. Letsoalo, M.R.; Mamo, M.A.; Ambushe, A.A. Synchronous Extraction and Quantitative Speciation of Arsenic and Chromium in Sediments by High-Performance Liquid Chromatography–Inductively Coupled Plasma–Mass Spectrometry (HPLC-ICP-MS). Anal. Lett. 2021, 54, 1943–1967. [Google Scholar] [CrossRef]
  12. Letsoalo, M.R.; Ambushe, A.A.; Mamo, M.A. Novel Chemoresistive Sensor for Sensitive Detection of Pb2+ Ions Using an Interdigital Gold Electrode Fabricated with a Reduced Graphene Oxide-Based Ion-Imprinted Polymer. ACS Omega 2021, 6, 31528–31538. [Google Scholar] [CrossRef]
  13. Aziz, K.H.H.; Mustafa, F.S.; Omer, K.M.; Hama, S.; Hamarawf, R.F.; Rahman, K.O. Heavy metal pollution in the aquatic environment: Efficient and low-cost removal approaches to eliminate their toxicity: A review. RSC Adv. 2023, 13, 17595–17610. [Google Scholar] [CrossRef] [PubMed]
  14. Biancacci, C.; Sanderson, J.C.; Evans, B.; Callahan, D.L.; Francis, D.S.; Skrzypczyk, V.M.; Cumming, E.E.; Bellgrove, A. Nutritional composition and heavy metal profiling of Australian kelps cultured in proximity to salmon and mussel farms. Algal Res. 2022, 64, 102672. [Google Scholar] [CrossRef]
  15. Oloruntoba, A.; Omoniyi, A.O.; Shittu, Z.A.; Ajala, R.O.; Kolawole, S.A. Heavy Metal Contamination in Soils, Water, and Food in Nigeria from 2000–2019: A Systematic Review on Methods, Pollution Level and Policy Implications. Water Air Soil Pollut. 2024, 235, 586. [Google Scholar] [CrossRef]
  16. Briffa, J.; Sinagra, E.; Blundell, R. Heavy metal pollution in the environment and their toxicological effects on humans. Heliyon 2020, 6, e04691. [Google Scholar] [CrossRef]
  17. Tchounwou, P.B.; Yedjou, C.G.; Patlolla, A.K.; Sutton, D.J. Molecular, clinical and environmental toxicicology Volume 3: Environmental Toxicology. Mol. Clin. Environ. Toxicol. 2012, 101, 133–164. [Google Scholar] [CrossRef]
  18. Mitra, S.; Chakraborty, A.J.; Tareq, A.M.; Emran, T.B.; Nainu, F.; Khusro, A.; Idris, A.M.; Khandaker, M.U.; Osman, H.; Alhumaydhi, F.A.; et al. Impact of heavy metals on the environment and human health: Novel therapeutic insights to counter the toxicity. J. King Saud. Univ. Sci. 2022, 34, 101865. [Google Scholar] [CrossRef]
  19. Zainurin, S.N.; Wan Ismail, W.Z.; Mahamud, S.N.; Ismail, I.; Jamaludin, J.; Ariffin, K.N.; Wan Ahmad Kamil, W.M. Advancements in Monitoring Water Quality Based on Various Sensing Methods: A Systematic Review. Int. J. Environ. Res. Public Health 2022, 19, 14080. [Google Scholar] [CrossRef]
  20. Muñoz-Arcos, E.; Millward, G.E.; Clason, C.C.; Bravo-Linares, C.; Blake, W.H. Understanding the complexity of sediment residence time in rivers: Application of Fallout Radionuclides (FRNs). Earth Sci. Rev. 2022, 233, 104188. [Google Scholar] [CrossRef]
  21. Mukwevho, N.; Ntsasa, N.; Mkhohlakali, A.; Mabowa, M.H.; Chimuka, L.; Tshilongo, J.; Letsoalo, M.R. The Impact of Induced Industrial and Urban Toxic Elements on Sediment Quality. Water 2024, 16, 2485. [Google Scholar] [CrossRef]
  22. Sharma, R.; Kumar, R.; Satapathy, S.C.; Al-Ansari, N.; Singh, K.K.; Mahapatra, R.P.; Agarwal, A.K.; Le, H.V.; Pham, B.T. Analysis of Water Pollution Using Different Physicochemical Parameters: A Study of Yamuna River. Front. Environ. Sci. 2020, 8, 581591. [Google Scholar] [CrossRef]
  23. Jollife, I.T.; Cadima, J. Principal component analysis: A review and recent developments. Philos. Trans. R. Soc. A Math. Phys. Eng. Sci. 2016, 374, 20150202. [Google Scholar] [CrossRef] [PubMed]
  24. Varekar, V.; Karmakar, S.; Jha, R. Seasonal rationalization of river water quality sampling locations: A comparative study of the modified Sanders and multivariate statistical approaches. Environ. Sci. Pollut. Res. 2016, 23, 2308–2328. [Google Scholar] [CrossRef]
  25. Rimayi, C.; Chimuka, L.; Odusanya, D.; de Boer, J.; Weiss, J. Distribution of 2,3,7,8-substituted polychlorinated dibenzo-p-dioxin and polychlorinated dibenzofurans in the Jukskei and Klip/Vaal catchment areas in South Africa. Chemosphere 2016, 145, 314–321. [Google Scholar] [CrossRef] [PubMed]
  26. Mukwevho, N.; Ntsasa, N.; Mkhohlakali, A.; Chimuka, L.; Tshilongo, J.; Mokgosi, D.; Mabowa, H.; Letsoalo, M.R. Examining the Effect of Induced Industrial and Urban Toxic Elements on Sediment Quality. In Recent Developments in Chemistry and Biochemistry Research Vol. 11; BP International: Tokyo, Japan, 2025; pp. 29–45. [Google Scholar] [CrossRef]
  27. Allion, K.; Kiemle, L.; Fuchs, S. Four Years of Sediment and Phosphorus Monitoring in the Kraichbach River Using Large-Volume Samplers. Water 2022, 14, 120. [Google Scholar] [CrossRef]
  28. Letsoalo, M.R.; Mamo, M.A.; Ambushe, A.A. Simultaneous quantitative speciation of selected toxic elements in water using high performance liquid chromatography coupled to inductively coupled plasma-mass spectrometry (HPLC-ICP-MS). Phys. Chem. Earth 2021, 124, 103011. [Google Scholar] [CrossRef]
  29. Letsoalo, M.R.; Godeto, T.W.; Magadzu, T.; Ambushe, A.A. Quantitative Speciation of Arsenic in Water and Sediment Samples from the Mokolo River in Limpopo Province, South Africa. Anal. Lett. 2018, 51, 2761–2775. [Google Scholar] [CrossRef]
  30. Huber, L. Understanding and Implementing ISO/IEC 17025 A Primer. p. 64, 2009. La démarche ISO 17025. Available online: https://www.agilent.com.cn/cs/library/primers/public/5990-4540CHCN_high.pdf (accessed on 11 March 2025).
  31. Rzetala, M.A.; Machowski, R.; Solarski, M.; Bakota, D.; Płomiński, A.; Rzetala, M. Toxic Metals, Non-Metals and Metalloids in Bottom Sediments as a Geoecological Indicator of a Water Body’s Suitability for Recreational Use. Int. J. Environ. Res. Public Health 2023, 20, 4334. [Google Scholar] [CrossRef]
  32. Cohen, D.; Rutherford, N. Technical Report on the Development of a Geochemical Atlas of Cyprus. Geol. Surv. Cyprus Lefkosia 2011, 1, 1–104. [Google Scholar]
  33. Cheng, H.; Huang, L.; Ma, P.; Shi, Y. Ecological risk and restoration measures relating to heavy metal pollution in industrial and mining wastelands. Int. J. Environ. Res. Public Health 2019, 16, 3985. [Google Scholar] [CrossRef]
  34. Rani, N.L.A.; Azid, A.; Khalit, S.I.; Gasim, M.B.; Juahir, H. Selected Malaysia air quality pollutants assessment using chemometrics techniques. J. Fundam. Appl. Sci. 2018, 9, 335. [Google Scholar] [CrossRef]
  35. Zhou, M.; Wu, S.; Zhang, Z.; Aihemaiti, Y.; Yang, L.; Shao, Y.; Chen, Z.; Jiang, Y.; Jin, C.; Zheng, G. Dilution or enrichment: The effects of flood on pollutants in urban rivers. Environ. Sci. Eur. 2022, 34, 61. [Google Scholar] [CrossRef]
  36. Wittmann, G.T.W.; Forstnert, U. Metal enrichment in inland waters—The Jukskei and Hennops drainage. Water SA 1976, 2, 67–72. [Google Scholar]
  37. Lynch, S.F.L.; Batty, L.C.; Byrne, P. Environmental risk of severely Pb-contaminated riverbank sediment as a consequence of hydrometeorological perturbation. Sci. Total Environ. 2018, 636, 1428–1441. [Google Scholar] [CrossRef] [PubMed]
  38. Joe, D.J.; Choi, M.S.; Lee, J.H.; Kim, C.K.; Choi, M.S.; Shin, H.S. Discrimination of metal contaminant sources in river sediments influenced by mining and smelting activities using stable Pb and Zn isotopes. Environ. Sci. Pollut. Res. 2024, 31, 20521–20533. [Google Scholar] [CrossRef]
  39. Xie, S.; Liu, C.; He, B.; Chen, M.; Gao, T.; Wei, X.; Liu, Y.; Xia, Y.; Sun, Q. Geochemical Fractionation and Source Identification of Pb and Cd in Riparian Soils and River Sediments from Three Lower Reaches Located in the Pearl River Delta. Int. J. Environ. Res. Public Health 2022, 19, 13819. [Google Scholar] [CrossRef]
  40. Hossain, M.M.; Jahan, I.; Dar, M.A.; Dhanavade, M.J.; Mamtaz, A.F.B.; Maxwell, S.J.; Han, S.; Zhu, D. A Review of Potentially Toxic Elements in Sediment, Water, and Aquatic Species from the River Ecosystems. Toxics 2025, 13, 26. [Google Scholar] [CrossRef]
  41. Ntsasa, N.; Mkhohlakali, A.; Mogashane, T.; Tshilongo, J.; Letsoalo, M.R. Trends in Systematic Techniques for Pollutants Monitoring in the Environmental Water Systems. Available online: www.intechopen.com (accessed on 25 January 2025).
  42. Pascal, N.M.; Dieudonné, M.E.; Jean-Noël, M.K. Evaluation of the Level of Mercury Pollution in the Sediments of the Rivers Draining the Gold Panning Sites in the Territory of Fizi, Eastern Democratic Republic of Congo. J. Geosci. Environ. Prot. 2020, 8, 98277. [Google Scholar] [CrossRef]
  43. Niane, B.; Moritz, R.; Guédron, S.; Ngom, P.M.; Pfeifer, H.R.; Mall, I.; Poté, J. Effect of recent artisanal small-scale gold mining on the contamination of surface river sediment: Case of Gambia River, Kedougou region, southeastern Senegal. J. Geochem. Explor. 2014, 144, 517–527. [Google Scholar] [CrossRef]
  44. Phala, A.; Mistry, D.; Matlala, R.L.G. Implications of illegal mining in Gauteng Province. Int. J. Humanit. Soc. Sci. Invent. 2017, 6, 56–63. [Google Scholar]
  45. Asare-Donkor, N.K.; Adimado, A.A. Influence of mining related activities on levels of mercury in water, sediment and fish from the Ankobra and Tano River basins in South Western Ghana. Environ. Syst. Res. 2016, 5, 5. [Google Scholar] [CrossRef]
  46. Martinez, G.; McCord, S.A.; Driscoll, C.T.; Todorova, S.; Wu, S.; Araújo, J.F.; Vega, C.M.; Fernandez, L.E. Mercury contamination in riverine sediments and fish associated with artisanal and small-scale gold mining in Madre de Dios, Peru. Int. J. Environ. Res. Public Health 2018, 15, 1584. [Google Scholar] [CrossRef] [PubMed]
  47. Choudhury, T.R.; Ferdous, J.; Haque, M.M.; Rahman, M.M.; Quraishi, S.B.; Rahman, M.S. Assessment of heavy metals and radionuclides in groundwater and associated human health risk appraisal in the vicinity of Rooppur nuclear power plant, Bangladesh. J. Contam. Hydrol. 2022, 251, 104072. [Google Scholar] [CrossRef]
  48. Lécrivain, N.; Clément, B.; Dabrin, A.; Seigle-Ferrand, J.; Bouffard, D.; Naffrechoux, E.; Frossard, V. Water-level fluctuation enhances sediment and trace metal mobility in lake littoral. Chemosphere 2021, 264, 128451. [Google Scholar] [CrossRef]
  49. Huffman, A.M.; Sikder, A.M. Assessment of Heavy Metal Pollution in the Sediments of the Roanoke River; The Geological Society of America: Boulder, CO, USA, 2017. [Google Scholar] [CrossRef]
  50. Geng, N.; Xia, Y.; Li, D.; Bai, F.; Xu, C. Migration and Transformation of Heavy Metal and Its Fate in Intertidal Sediments: A Review. Processes 2024, 12, 311. [Google Scholar] [CrossRef]
  51. Bartoszek, L.; Gruca-Rokosz, R.; Pękala, A.; Czarnota, J. Heavy Metal Accumulation in Sediments of Small Retention Reservoirs—Ecological Risk and the Impact of Humic Substances Distribution. Resources 2022, 11, 113. [Google Scholar] [CrossRef]
  52. Zhang, C.; Yu, Z.G.; Zeng, G.M.; Jiang, M.; Yang, Z.Z.; Cui, F.; Zhu, M.Y.; Shen, L.Q.; Hu, L. Effects of sediment geochemical properties on heavy metal bioavailability. Environ. Int. 2014, 73, 270–281. [Google Scholar] [CrossRef]
  53. Chen, C.F.; Ju, Y.R.; Lim, Y.C.; Chen, C.W.; Wu, C.H.; Lin, Y.L.; Dong, C.D. Dry and wet seasonal variation of total mercury, inorganic mercury, and methylmercury formation in estuary and harbor sediments. J. Environ. Manag. 2020, 253, 109683. [Google Scholar] [CrossRef]
  54. Duncan, A.E.; de Vries, N.; Nyarko, K.B. Assessment of heavy metal pollution in the main Pra River and its tributaries in the Pra Basin of Ghana. Environ. Nanotechnol. Monit. Manag. 2018, 10, 264–271. [Google Scholar] [CrossRef]
  55. Gao, S.; Wang, Z.; Wu, Q.; Wang, W.; Peng, C.; Zeng, J.; Wang, Y. Urban geochemistry and human-impacted imprint of dissolved trace and rare earth elements in a high-tech industrial city, Suzhou. Elementa 2021, 9, 00151. [Google Scholar] [CrossRef]
  56. Addo-Bediako, A. Risk of Chemical Pollution in Olifants River Basin, South Africa: Human Health Implications. Limnol. Rev. 2025, 25, 1. [Google Scholar] [CrossRef]
  57. Abdullah, M.I.C.; Sah, A.S.R.M.; Haris, H. Geoaccumulation Index and Enrichment Factor of Arsenic in Surface Sediment of Bukit Merah Reservoir, Malaysia. Trop. Life Sci. Res. 2020, 31, 109–125. [Google Scholar] [CrossRef]
  58. Webster, J.; Iqani, M. Johannesburg’s shitty little river: Faecal discourse and discontent regarding the Jukskei. Soc. Dyn. 2024, 50, 109–127. [Google Scholar] [CrossRef]
  59. Fitchett, A. Suds for managing surface water in Diepsloot informal settlement, Johannesburg, South Africa. Water SA 2017, 43, 310–322. [Google Scholar] [CrossRef]
  60. Madzlan, N.A.H.; Suratman, S.; Mohamed, K.N.; Chuan, O.M. Seasonal Variation in Concentration of Heavy Metals in Tropical River Sediment. Malays. J. Anal. Sci. 2023, 27, 108–118. [Google Scholar]
  61. Habineza, E.; Makwinja, R.; Inagaki, Y. Contamination and health risks of trace metals in water and sediments of May Sieley stream, Ethiopia. Phys. Chem. Earth 2023, 129, 103315. [Google Scholar] [CrossRef]
  62. Lin, K.-N.; Lim, Y.-C.; Chen, C.-W.; Chen, C.-F.; Kao, C.-M.; Dong, C.-D. Spatiotemporal Variation and Ecological Risk Assessment of Heavy Metals in Industrialized Urban River Sediments: Fengshan River in Southern Taiwan as a Case Study. Appl. Sci. 2022, 12, 1013. [Google Scholar] [CrossRef]
  63. Akoto, O.; Ephraim, J.H.; Darko, G. Heavy metals pollution in surface soils in the vicinity of abundant railway servicing workshop in Kumasi, Ghana. Int. J. Environ. Res. 2008, 2, 359–364. [Google Scholar]
  64. Papu-Zamxaka, V.; Mathee, A.; Harpham, T.; Barnes, B.; Röllin, H.; Lyons, M.; Jordaan, W.; Cloete, M. Elevated mercury exposure in communities living alongside the Inanda Dam, South Africa. J. Environ. Monit. 2010, 12, 472–477. [Google Scholar] [CrossRef]
  65. Huizenga, J.M.; Harmse, J.T. Geological and anthropogenic influences on the inorganic water chemistry of the Jukskei River, Gauteng, South Africa. S. Afr. J. Geol. 2005, 108, 439–447. [Google Scholar] [CrossRef]
  66. Singh, S.; Tiwari, R.K.; Pandey, R.S. Water Pollution due to Discharge of Industrial Effluents. Int. Arch. Appl. Sci. Technol. 2018, 9, 111–121. [Google Scholar]
  67. Sampaio, N.A.S.; Mazza, F.C.; de Siqueira, S.S.S.; Miranda, J.E.; de Souza Moutinho, J.V.; de Oliveira Pacífico, L. Applications of Correlation Analysis in Environmental Problems. Rev. Gest. Soc. E Ambient. 2024, 18, 1–16. [Google Scholar] [CrossRef]
  68. Mukaka, M.M. Statistics corner: A guide to appropriate use of correlation coefficient in medical research. Malawi Med. J. 2012, 24, 69–71. [Google Scholar] [PubMed]
  69. Mishra, P.; Singh, U.; Pandey, C.; Mishra, P.; Pandey, G. Application of student’s t-test, analysis of variance, and covariance. Ann. Card. Anaesth. 2019, 22, 407–411. [Google Scholar] [CrossRef] [PubMed]
  70. Wijesiri, B.; Egodawatta, P.; McGree, J.; Goonetilleke, A. Influence of pollutant build-up on variability in wash-off from urban road surfaces. Sci. Total Environ. 2015, 527–528, 344–350. [Google Scholar] [CrossRef]
  71. Liu, X.; Sheng, Y.; Liu, Q.; Li, Z. Suspended particulate matter affects the distribution and migration of heavy metals in the Yellow River. Sci. Total Environ. 2024, 912, 169537. [Google Scholar] [CrossRef]
  72. Hassan, K.M.T.; Ferdoushi, Z.; Rana, M.M.; Alam, M.S. Assessing the Seasonal Variability of Water Quality and Heavy Metals Concentration in Sediment, Water, and Fish Muscles of Korotoa River in Bangladesh. Aquac. Res. 2024, 2024, 5343363. [Google Scholar] [CrossRef]
  73. Zhao, R.; Coles, N.A.; Wu, J. Status of heavy metals in soils following long-term river sediment application in plain river network region, southern China. J. Soils Sediments 2015, 15, 2285–2292. [Google Scholar] [CrossRef]
  74. UNEP. Final Review of Scientific Information on Cadmium; Chemicals Branch DTIE; United Nations Environment Programme: Nairobi, Kenya, 2010. [Google Scholar]
  75. Zhang, T.; Li, L.; Xu, F.; Chen, X.; Du, L.; Wang, X.; Li, Y. Assessing the remobilization and fraction of cadmium and lead in sediment of the Jialing River by sequential extraction and diffusive gradients in films (DGT) technique. Chemosphere 2020, 257, 127181. [Google Scholar] [CrossRef]
  76. Sulistyowati, L.; Nurhasanah, N.; Riani, E.; Cordova, M.R. Heavy metals concentration in the sediment of the aquaticenvironment caused by the leachate discharge from a landfill. Glob. J. Environ. Sci. Manag. 2023, 9, 323–336. [Google Scholar] [CrossRef]
  77. Lee, A.C.; Idrus, F.A.; Aziz, F. Cadmium and Lead Concentrations in Water, Sediment, Fish and Prawn as Indicators of Ecological and Human Health Risk in Santubong Estuary, Malaysia. Jordan J. Biol. Sci. 2021, 14, 317–325. [Google Scholar] [CrossRef]
  78. Hellar-Kihampa, H.; Mihale, M.J. Lead and Cadmium Levels in Water, Surficial Sediments, and Edible Biota of Urban Rivers in Dar es Salaam, Tanzania, During Two Seasons. Environ. Prot. Res. 2023, 3, 217–381. [Google Scholar] [CrossRef]
  79. Li, D.; Chang, F.; Zhang, Y.; Duan, L.; Liu, Q.; Li, H.; Hu, G.; Zhang, X.; Gao, Y.; Zhang, H. Arsenic migration at the sediment-water interface of anthropogenically polluted Lake Yangzong, Southwest China. Sci. Total Environ. 2023, 879, 163205. [Google Scholar] [CrossRef] [PubMed]
  80. Ambushe, A.A.; Letsoalo, M.R.; Lovia, D.; Matabane, C.P.; Molele, L.S.; Godeto, T.W.; Magadzu, T. Assessment of Potentially Toxic Elements and their Species in Selected Water Systems in Limpopo Province; Water Research Commission: Pretoria, South Africa, 2020. [Google Scholar]
  81. Van Eeden, E.S.; Liefferink, M.; Durand, J.V. Legal issues concerning mine closure and social responsibility on the West Rand. TD J. Transdiscipl. Res. S. Afr. 2009, 5, 51–71. [Google Scholar]
  82. Mccarthy, T.S.; Africa, S.; Africa, S. The impact of acid mine drainage in South Africa. S. Afr. J. Sci. 2011, 107, 1–7. [Google Scholar] [CrossRef]
  83. Abiye, T.A.; Ali, K.A. Potential role of acid mine drainage management towards achieving sustainable development in the Johannesburg region, South Africa. Groundw. Sustain. Dev. 2022, 19, 100839. [Google Scholar] [CrossRef]
  84. Nkinda, M.S.; Rwiza, M.J.; Ijumba, J.N.; Njau, K.N. Heavy metals risk assessment of water and sediments collected from selected river tributaries of the Mara River in Tanzania. Discov. Water 2021, 1, 3. [Google Scholar] [CrossRef]
  85. Ullrich, S.M.; Tanton, T.W.; Abdrashitova, S.A. Mercury in the aquatic environment: A review of factors affecting methylation. Crit. Rev. Environ. Sci. Technol. 2001, 31, 241–293. [Google Scholar] [CrossRef]
  86. Báez, A.; Belmont, R.; García, R.; Padilla, H.; Torres, M.C. Chemical composition of rainwater collected at a southwest site of Mexico City, Mexico. Atmos. Res. 2007, 86, 61–75. [Google Scholar] [CrossRef]
  87. Dube, R.A.; Maphosa, B.; Malan, A.; Fayemiwo, D.M.; Ramulondi, D.; Zuma, T.A. Response of Urban and Peri-Urban Aquatic Ecosystems to Riparian Zones Land Uses and Human Settlements: A Study of the Rivers, Jukskei, Kuils and Pienaars; Water Research Commission: Pretoria, South Africa, 2017. [Google Scholar]
  88. Yüksel, B.; Ustaoğlu, F.; Tokatli, C.; Islam, M.S. Ecotoxicological risk assessment for sediments of Çavuşlu stream in Giresun, Turkey: Association between garbage disposal facility and metallic accumulation. Environ. Sci. Pollut. Res. 2022, 29, 17223–17240. [Google Scholar] [CrossRef]
  89. CLiu, W.; Lin, K.H.; Kuo, Y.M. Application of factor analysis in the assessment of groundwater quality in a blackfoot disease area in Taiwan. Sci. Total Environ. 2003, 313, 77–89. [Google Scholar] [CrossRef]
  90. Xing, M.; Yan, D.; Hai, M.; Zhang, Y.; Zhang, Z.; Li, F. Arsenic Contamination in Sludge and Sediment and Relationship with Microbial Resistance Genes: Interactions and Remediation. Water 2024, 16, 3633. [Google Scholar] [CrossRef]
  91. Shankar, S.; Shanker, U.; Shikha. Arsenic contamination of groundwater: A review of sources, prevalence, health risks, and strategies for mitigation. Sci. World J. 2014, 2014, 304524. [Google Scholar] [CrossRef] [PubMed]
  92. Alengebawy, A.; Abdelkhalek, S.T.; Qureshi, S.R.; Wang, M.-Q. Heavy Metals and Pesticides Toxicity in Agricultural Soil and Plants: Ecological Risks and Human Health Implications. Toxics 2021, 9, 42. [Google Scholar] [CrossRef]
  93. Armah, F.A.; Boamah, S.A.; Quansah, R.; Obiri, S.; Luginaah, I. Unsafe occupational health behaviors: Understanding mercury-related environmental health risks to artisanal gold miners in ghana. Front. Environ. Sci. 2016, 4, 29. [Google Scholar] [CrossRef]
  94. Gibb, H.; Leary, K.G.O. WHO Comprehensive review of mercury in ASGM. Environ. Health Perspect. 2014, 122, 667–672. [Google Scholar] [CrossRef]
  95. Hoorzook, K.B.; Pieterse, A.; Heine, L.; Barnard, T.G.; van Rensburg, N.J. Soul of the jukskei river: The extent of bacterial contamination in the jukskei river in gauteng province, south africa. Int. J. Environ. Res. Public Health 2021, 18, 8537. [Google Scholar] [CrossRef]
  96. Mpanza, M.; Adam, E.; Moolla, R. Perceptions of external costs of dust fallout from gold mine tailings: West Wits Basin. Clean. Air J. 2020, 30, 1–12. [Google Scholar] [CrossRef]
Figure 1. Selected points during sampling campaign of Jukskei River [21].
Applsci 15 03117 g001
Table 1. Relationship among RI, Eif, and pollution levels [33].
Scope of Ecological Risk Index (Eif)Ecological Risk Level of Single-Factor PollutionScope of Toxicity Index (RI)The Level of Potential Ecological Risk
Eif < 40lowRI < 150low-grade
40 ≤ Eif < 80moderate150 ≤ RI < 300moderate
80 ≤ Eif < 160higher300 ≤ RI < 600severe
160 ≤ Eif < 320high600 ≤ RIserious
Eif ≤ 320serious
Table 2. Dry and wet season sediment concentration of the heavy metals.
Sampling SeasonsSample IDAs
(mg/kg)
Cd (mg/kg)Hg
(µg/kg)
Pb
(mg/kg)
Th (mg/kg)U
(mg/kg)
Fe
(mg/kg)
DryJuks-P122.3 ± 0.900.85 ± 0.183650 ± 600267 ± 135.93 ± 0.262.3 ± 0.547,250 ± 250
Wet10.0 ± 0.060.16 ± 0.0377.5 ± 3.5438.8 ± 1.275.08 ± 0.022.02 ± 0.0319,533 ± 896
DryJuks-P28.13 ± 0.60<0.018040 ± 77035.5 ± 05.40 ± 0.332.45 ± 0.1518,600 ± 0
Wet8.6 ± 0.060.30 ± 0.0320.7 ± 0.58475 ± 4.044.59 ± 0.091.74 ± 0.0636,600 ± 624
DryJuks-P37.38 ± 0.130.18 ± 07610 ± 35025.7 ± 0.255.85 ± 0.082.60 ± 0.1210,100 ± 0
Wet2.35 ± 0.29<0.0124.5 ± 2.1212.6 ± 0.323.46 ± 0.081.26 ± 0.0512,567 ± 231
DryJuks-P44.89 ± 0.160.10 ± 011,100 ± 23015.9 ± 0.754.91 ± 0.421.88 ± 0.0612,000 ± 0
Wet5.77 ± 0.21<0.0110.3 ± 0.9913.0 ± 0.555.31 ± 0.022.86 ± 0.0516,267 ± 1097
DryJuks-P53.89 ± 1.140.14 ± 011,700 ± 52014.3 ± 1.415.15 ± 0.711.59 ± 0.186900 ± 282
Wet2.1 ± 0.140.14 ± 015.0 ± 021.2 ± 0.145.84 ± 0.022.25 ± 0.0613,233 ± 153
DryJuks-DS-17.18 ± 0.22<0.0111,600 ± 50047.5 ± 16.24.72 ± 0.111.73 ± 0.0621,300 ± 0
Wet1.6 ± 0.140.12 ± 016.0 ± 2.8321.8 ± 0.424.14 ± 0.161.67 ± 0.0110,267 ± 208
DryJuks-DS-66.05 ± 0.950.12 ± 0.012,100 ± 99014.8 ± 2.853.89 ± 0.211.89 ± 0.268900 ± 424
Wet1.09 ± 0.16<0.018.4 ± 0.8515.8 ± 1.564.96 ± 0.621.34 ± 0.006900 ± 100
DryJuks-DS-83.55 ± 0.220.12 ± 0.0911,900 ± 115016.7 ± 3.303.09 ± 0.171.37 ± 0.084750 ± 70
Wet2.1 ± 0.140.26 ± 0.0252.3 ± 4.228.2 ± 0.425.35 ± 0.292.81 ± 0.0021,867 ± 513
DryJuks-DS-96.74 ± 1.420.16 ± 0.057540 ± 36020.4 ± 0.068.16 ± 0.181.95 ± 0.0127,250 ± 1484
Wet1.3 ± 0.350.12 ± 0.0122.0 ± 2.8316.3 ± 0.404.72 ± 0.401.67 ± 0.0811,033 ± 416
Table 3. Dry and wet season water concentration of the heavy metals.
Sampling SeasonsSample IDAs (μg/L)Cd (μg/L)Hg
(μg/L)
Pb (μg/L)Th (μg/L)U
(μg/L)
WetJuks-P1<0.01<0.010.02<0.01<0.0010.04
Dry<0.01<0.010.22<0.010.620.14
WetJuks-P2<0.01<0.010.02<0.010.010.05
Dry<0.01<0.010.10.030.420.44
WetJuks-P3<0.01<0.010.01<0.01<0.010.16
Dry<0.01<0.010.10.050.360.78
WetJuks-P4<0.01<0.010.01<0.01<0.010.27
Dry<0.01<0.010.070.080.340.91
WetJuks-P5<0.01<0.010.01<0.01<0.010.34
Dry<0.01<0.010.060.030.230.95
WetJuks-DS-1<0.01<0.010.02<0.010.030.31
Dry<0.01<0.010.050.020.250.82
WetJuks-DS-6<0.01<0.010.02<0.010.090.32
Dry<0.01<0.010.060.110.220.55
WetJuks-DS-8<0.01<0.010.01<0.010.020.22
Dry<0.01<0.010.040.060.130.53
WetJuks-DS-9<0.01<0.010.01<0.010.010.22
Dry<0.01<0.010.03<0.010.090.49
Table 4. Sediment geo-accumulation index for dry season and wet season.
Sampling SeasonsSample IDAsCdHgPbThU
DryJuks-P13.910.1886.934.16−1.34−2.71
Wet−0.511.75−3.64−4.24−1.18−2.51
DryJuks-P2−1.230.008.071.24−1.48−2.62
Wet−0.72−2.74−6.245.37−1.33−2.72
DryJuks-P3−1.37−2.067.990.77−1.36−2.53
Wet−2.590.00−6.250.13−1.73−3.19
DryJuks-P4−1.97−2.888.520.08−1.61−3.00
Wet−1.30.00−7.250.18−1.11−2.01
DryJuks-P5−2.29−2.438.60−0.09−1.54−3.24
Wet−2.76−3.84−6.250.88−0.98−2.35
DryJuks-DS−1−1.410.008.591.66−1.67−3.12
Wet−3.15−4.06−6.250.92−1.47−2.78
DryJuks-DS−6−1.65−2.598.65−0.02−1.94−2.99
Wet−3.70.00−7.240.45−1.21−3.10
DryJuks-DS−8−2.43−2.618.640.17−2.28−3.45
Wet−2.75−2.94−4.931.29−1.1−2.03
DryJuks-DS−9−1.50−2.217.970.44−0.88−2.95
Wet−3.44−4.05−6.240.5−1.28−2.78
Table 5. Sediment contamination factor for dry season and wet season.
Sampling SeasonsSample IDAs Cd Hg Pb Th U
Dry Juks-P11.760.0618326.70.5930.23
Wet0.790.323.883.880.510.2
DryJuks-P20.640.004013.550.540.24
Wet0.000.61.0447.50.460.17
DryJuks-P30.580.363802.570.590.6
Wet 0.000.001.231.260.350.13
DryJuks-P40.380.205531.590.490.18
Wet 0.000.000.521.30.530.29
Dry Juks-P5 0.310.205841.430.520.19
Wet 0.000.280.752.130.580.23
Dry Juks-DS-10.570.005784.750.471.73
Wet 0.000.240.82.180.410.17
Dry Juks-DS-60.480.256021.480.390.19
Wet 0.0000.421.580.50.13
Dry Juks-DS-80.280.255971.680.310.14
Wet 0.170.522.622.820.540.28
Dry Juks-DS-90.530.323772.040.820.19
Wet0.100.241.11.630.470.17
Table 6. Sediment enrichment factor for dry and wet season.
Sampling SeasonsSample IDAs Cd Hg Pb Th U
Dry Juks-P10.370.3638.65.650.130.05
Wet 0.40.161.981.990.260.16
DryJuks-P20.4404671.910.290.13
Wet 0.190.160.2812.980.130.05
DryJuks-P30.540.343552.415.470.24
Wet 0.140.30.2810.130.05
Dry Juks-P40.380.25511.580.490.19
Wet 0.2800.980.80.280.1
Dry Juks-P5 0.440.48401.630.740.23
Wet 0.1300.321.090.330.32
Dry Juks-DS-10.290.472972.440.240.09
Wet 0.120.230.782.120.40.16
Dry Juks-DS-60.540.286771.660.440.21
Wet 0.1200.612.290.720.19
Dry Juks-DS-80.590.5212573.530.650.29
Wet 0.080.241.191.290.240.13
Dry Juks-DS-90.200.121380.750.300.07
Wet 0.090.221.001.480.430.15
Table 7. Wet season Pearson correlation matrix.
VariablesAsCdHgPbThUFe
As10.3690.520.5580.1130.2040.71
Cd0.36910.4340.6330.2420.2690.777
Hg0.520.4341−0.0530.1180.2310.306
Pb0.5580.633−0.0531−0.105−0.1180.872
Th0.1130.2420.118−0.10510.710.087
U0.2040.2690.231−0.1180.7110.273
Fe0.710.7770.3060.8720.0870.2731
Table 8. Dry season Pearson correlation matrix.
VariablesAsCdHgPbThUFe
As10.903−0.8460.9780.3060.5050.915
Cd0.9031−0.7490.9340.2380.2880.779
Hg−0.846−0.7491−0.762−0.652−0.734−0.853
Pb0.9780.934−0.76210.1930.3390.875
Th0.3060.238−0.6520.19310.4790.565
U0.5050.288−0.7340.3390.47910.424
Fe0.9150.779−0.8530.8750.5650.4241
Table 9. The potential ecological risk index.
Sampling Points* RI Wet Season* RI Dry Season
Juk-P11937502
Juk-P230216,094
Juk-P360.615,239
Juk-P433.422,148
Juk-P550.723,369
Juk-DS-151.423,159
Juk-DS-626.624,129
Juk-DS-813523,899
Juk-DS-960.415,095
* RI: risk index.
Table 10. Factor loadings for wet season.
VariablesF1F2F3F4F5
As0.785−0.0780.308−0.5160.089
Cd0.837−0.007−0.1020.5250.039
Hg0.5060.2670.7940.1890.037
Pb0.749−0.551−0.351−0.0630.072
Th0.2780.825−0.315−0.0520.372
U0.3850.819−0.186−0.104−0.367
Fe0.949−0.211−0.143−0.03−0.146
Eigenvalue3.2601.7791.0130.5960.310
Variability (%)46.57125.40814.4728.5124.425
Cumulative %46.57171.97886.45094.96299.387
Table 11. Factor loadings for dry season.
Variables F1F2F3F4F5
As−0.963−0.2320.092−0.0920.046
Cd−0.875−0.383−0.040.2880.049
Hg0.949−0.246−0.055−0.0830.17
Pb−0.912−0.40.025−0.0490.015
Th−0.5350.706−0.4540.0680.061
U−0.6050.5710.551−0.0140.059
Fe−0.941−0.037−0.233−0.239−0.008
Eigenvalue4.9631.2460.5780.1620.041
Variability (%)70.89717.8068.2602.3180.584
Cumulative %70.89788.70396.96399.28299.865
Disclaimer/Publisher’s Note: The statements, opinions and data contained in all publications are solely those of the individual author(s) and contributor(s) and not of MDPI and/or the editor(s). MDPI and/or the editor(s) disclaim responsibility for any injury to people or property resulting from any ideas, methods, instructions or products referred to in the content.

