Article

Convolutional Neural Network-Based Risk Assessment of Regional Susceptibility to Road Collapse Disasters: A Case Study in Guangxi

1
Guojiao Spatial Information Technology (Beijing) Co., Ltd., Beijing 100011, China
2
School of Civil Engineering and Geomatics, Shandong University of Technology, Zibo 255049, China
3
State Key Laboratory of Resources and Environmental Information System, Institute of Geographical Sciences and Natural Resources Research, Chinese Academy of Sciences, Beijing 100101, China
4
National Center of Technology Innovation for Comprehensive Utilization of Saline-Alkali Land, Dongying 257347, China
*
Authors to whom correspondence should be addressed.
Appl. Sci. 2025, 15(6), 3108; https://doi.org/10.3390/app15063108
Submission received: 7 February 2025 / Revised: 7 March 2025 / Accepted: 10 March 2025 / Published: 13 March 2025

Abstract

:
The Guangxi Zhuang Autonomous Region, a vital strategic geographic entity in southern China, is prone to frequent road collapse disasters due to its complex topography and high rainfall, severely affecting regional economic and social development. Existing risk assessments for these collapse disasters often lack comprehensive analysis of the combined influence of multiple factors, and their predictive accuracy requires enhancement. To address these deficiencies, this study utilized the ResNet18 model, a convolutional neural network (CNN)-based approach, integrating 10 critical factors—including slope gradient, lithology, and precipitation—to develop a risk assessment model for road collapse disasters. This model predicts and maps the spatial distribution of collapse risk across Guangxi. The results reveal that very high-risk areas span 49,218.94 km2, constituting 20.38% of Guangxi’s total area, with a disaster point density of 8.67 per 100 km2; high-risk areas cover 56,543.87 km2, representing 23.41%, with a density of 3.38 per 100 km2; and low-risk areas encompass 61,750.69 km2, accounting for 25.57%, with a density of 0.29 per 100 km2. The receiver operating characteristic (ROC) curve yields an area under the curve (AUC) value of 0.7879, confirming the model’s high reliability and predictive accuracy in assessing collapse risk. This study establishes a scientific foundation for the prevention and mitigation of road collapse disasters in Guangxi and offers valuable guidance for risk assessments in similar regions.

1. Introduction

Road collapse disasters constitute a prevalent natural hazard in mountainous and geologically complex regions, particularly in areas such as Guangxi, where the frequency of collapses is elevated due to intricate terrain, high precipitation, and fragile geological structures. These disasters pose substantial threats to transportation safety and regional economic development [1]. Annually, road collapses triggered by heavy rainfall and other contributing factors not only disrupt transportation networks and damage infrastructure but may also precipitate secondary disasters, such as debris flows, thereby impacting livelihoods and social stability [2]. Consequently, the effective assessment of road collapse disaster risk has emerged as a critical research focus in the domains of transportation safety and disaster management, providing a scientific foundation for disaster warning systems, emergency response strategies, and mitigation measures [3].
Extensive research has been conducted both domestically and internationally on road collapse disaster risk assessment. Domestic studies predominantly employ traditional geological surveys and statistical analysis methods, constructing vulnerability assessment models based on multiple factors such as slope, precipitation, and soil type. While these methods have yielded some results in specific regions, their limitations have become increasingly apparent, especially when dealing with complex environmental factors and spatial data, leading to insufficient model accuracy and adaptability [4]. Moreover, with the development of remote sensing technology and geographic information systems (GIS), some domestic research has begun to integrate these technologies into disaster assessments to improve evaluation accuracy. However, challenges remain in multi-source data fusion, model scalability, and adaptability. In contrast, international research has widely adopted convolutional neural networks (CNNs) for disaster risk assessment. CNNs possess the ability to automatically extract features and effectively handle complex datasets, demonstrating exceptional performance in large-scale data analysis [5]. However, existing studies mostly focus on specific datasets or regions and are less adaptable to complex geological environments and data-scarce areas, with the generalization capability of the models still requiring improvement [6].
An analysis of domestic and international research indicates that although existing methods have achieved preliminary results in certain regions, there are still significant shortcomings in terms of adaptability and accuracy when faced with complex and dynamic environments and high-dimensional data [7,8]. Therefore, this study proposes the following research hypothesis: the vulnerability of road collapse disasters is related to complex nonlinear relationships between multiple geological and environmental factors. CNNs can enhance disaster assessment accuracy by automatic feature extraction and multi-factor data fusion, especially in data-scarce or environmentally complex situations, where CNNs show strong adaptability [9].
The main objective of this study is to construct a vulnerability risk assessment model for road collapse disasters based on CNNs, utilizing remote sensing imagery and GIS data to extract spatial features and improve disaster prediction accuracy and reliability through multi-factor fusion. Specifically, this paper will use geographic data and remote sensing imagery from Guangxi, combining factors such as slope, lithology, precipitation, and vegetation coverage, to build a risk assessment model for road collapse disasters and train and optimize the ResNet18 CNN model [5]. The research framework includes major steps such as data collection and preprocessing, CNN model construction, model training, and evaluation, with the goal of providing scientific support for the prevention and control of road collapse disasters [6].

2. Materials and Methods

2.1. Overview of the Study Area and Data Sources

2.1.1. Overview of the Study Area

The Guangxi Zhuang Autonomous Region, situated in southern China, spans a geographical range of 20°54′ to 26°24′ N latitude and 104°27′ to 112°04′ E longitude, representing a typical mountainous zone in the region [10]. The topography is characterized by hills and low mountains with significant elevation variations. As illustrated in Figure 1, elevation distribution maps of China and Guangxi reveal an altitude range from −134 m to 2111 m, highlighting the region’s pronounced mountainous features, with roads frequently traversing these natural landscapes [11]. Influenced by a subtropical monsoon climate, Guangxi experiences high and concentrated precipitation, particularly during the rainy season, where intense rainfall often triggers geological hazards such as collapses, posing substantial risks to transportation safety and social development [12]. The interplay of complex geological conditions and diverse geomorphological features further heightens the susceptibility to collapse disasters. This study identified 10 primary collapse-influencing factors in the study area, encompassing critical elements such as topography and geology. By integrating topographic, climatic, and geological data, this study employs a convolutional neural network (CNN) model to synthesize multi-source data from the study area, aiming to enhance the prediction accuracy of collapse disaster risk and provide a scientific foundation for disaster mitigation and road planning [13].

2.1.2. Data Sources

In this study, data on multiple key factors influencing road collapse hazard susceptibility—such as topography, vegetation cover, road distribution, population size, precipitation, and lithology—were selected to support the model by comprehensively analyzing their spatial characteristics. These data were sourced from authoritative geospatial and meteorological platforms and processed to meet the requirements of the study area. Specific data sources and descriptions are presented in Table 1.
The data utilized in this study are derived from multiple sources. Topographic data, including a 30-meter resolution digital elevation model (DEM), are obtained from the Geospatial Data Cloud (Chinese Academy of Sciences, Beijing, China, http://www.gscloud.cn (accessed on 9 March 2025)), with slope and aspect maps for Guangxi generated through cropping and projection transformation. Vegetation cover data, consisting of 30-meter resolution Normalized Difference Vegetation Index (NDVI) data, are sourced from the Institute of Geographic Sciences and Natural Resources Research, Chinese Academy of Sciences (CAS), and adapted to the Guangxi region via projection transformation and resampling. Road data are acquired from the National Catalogue Service for Geographic Information, with the road network and distance-from-road maps for Guangxi produced through projection conversion and cropping. Population data are retrieved from the LandScan dataset, and the population distribution map for Guangxi is created following projection and resampling. Precipitation data are obtained from the China Meteorological Data Service Center, with monthly average precipitation data projected and converted to compute annual precipitation. Lithology data, also sourced from the National Catalogue Service for Geographic Information, are transformed and cropped to extract lithology information for Guangxi. Collapse disaster data, provided by the Institute of Geographic Sciences and Natural Resources Research, CAS, are processed through attribute filtering and projection for model training and validation.

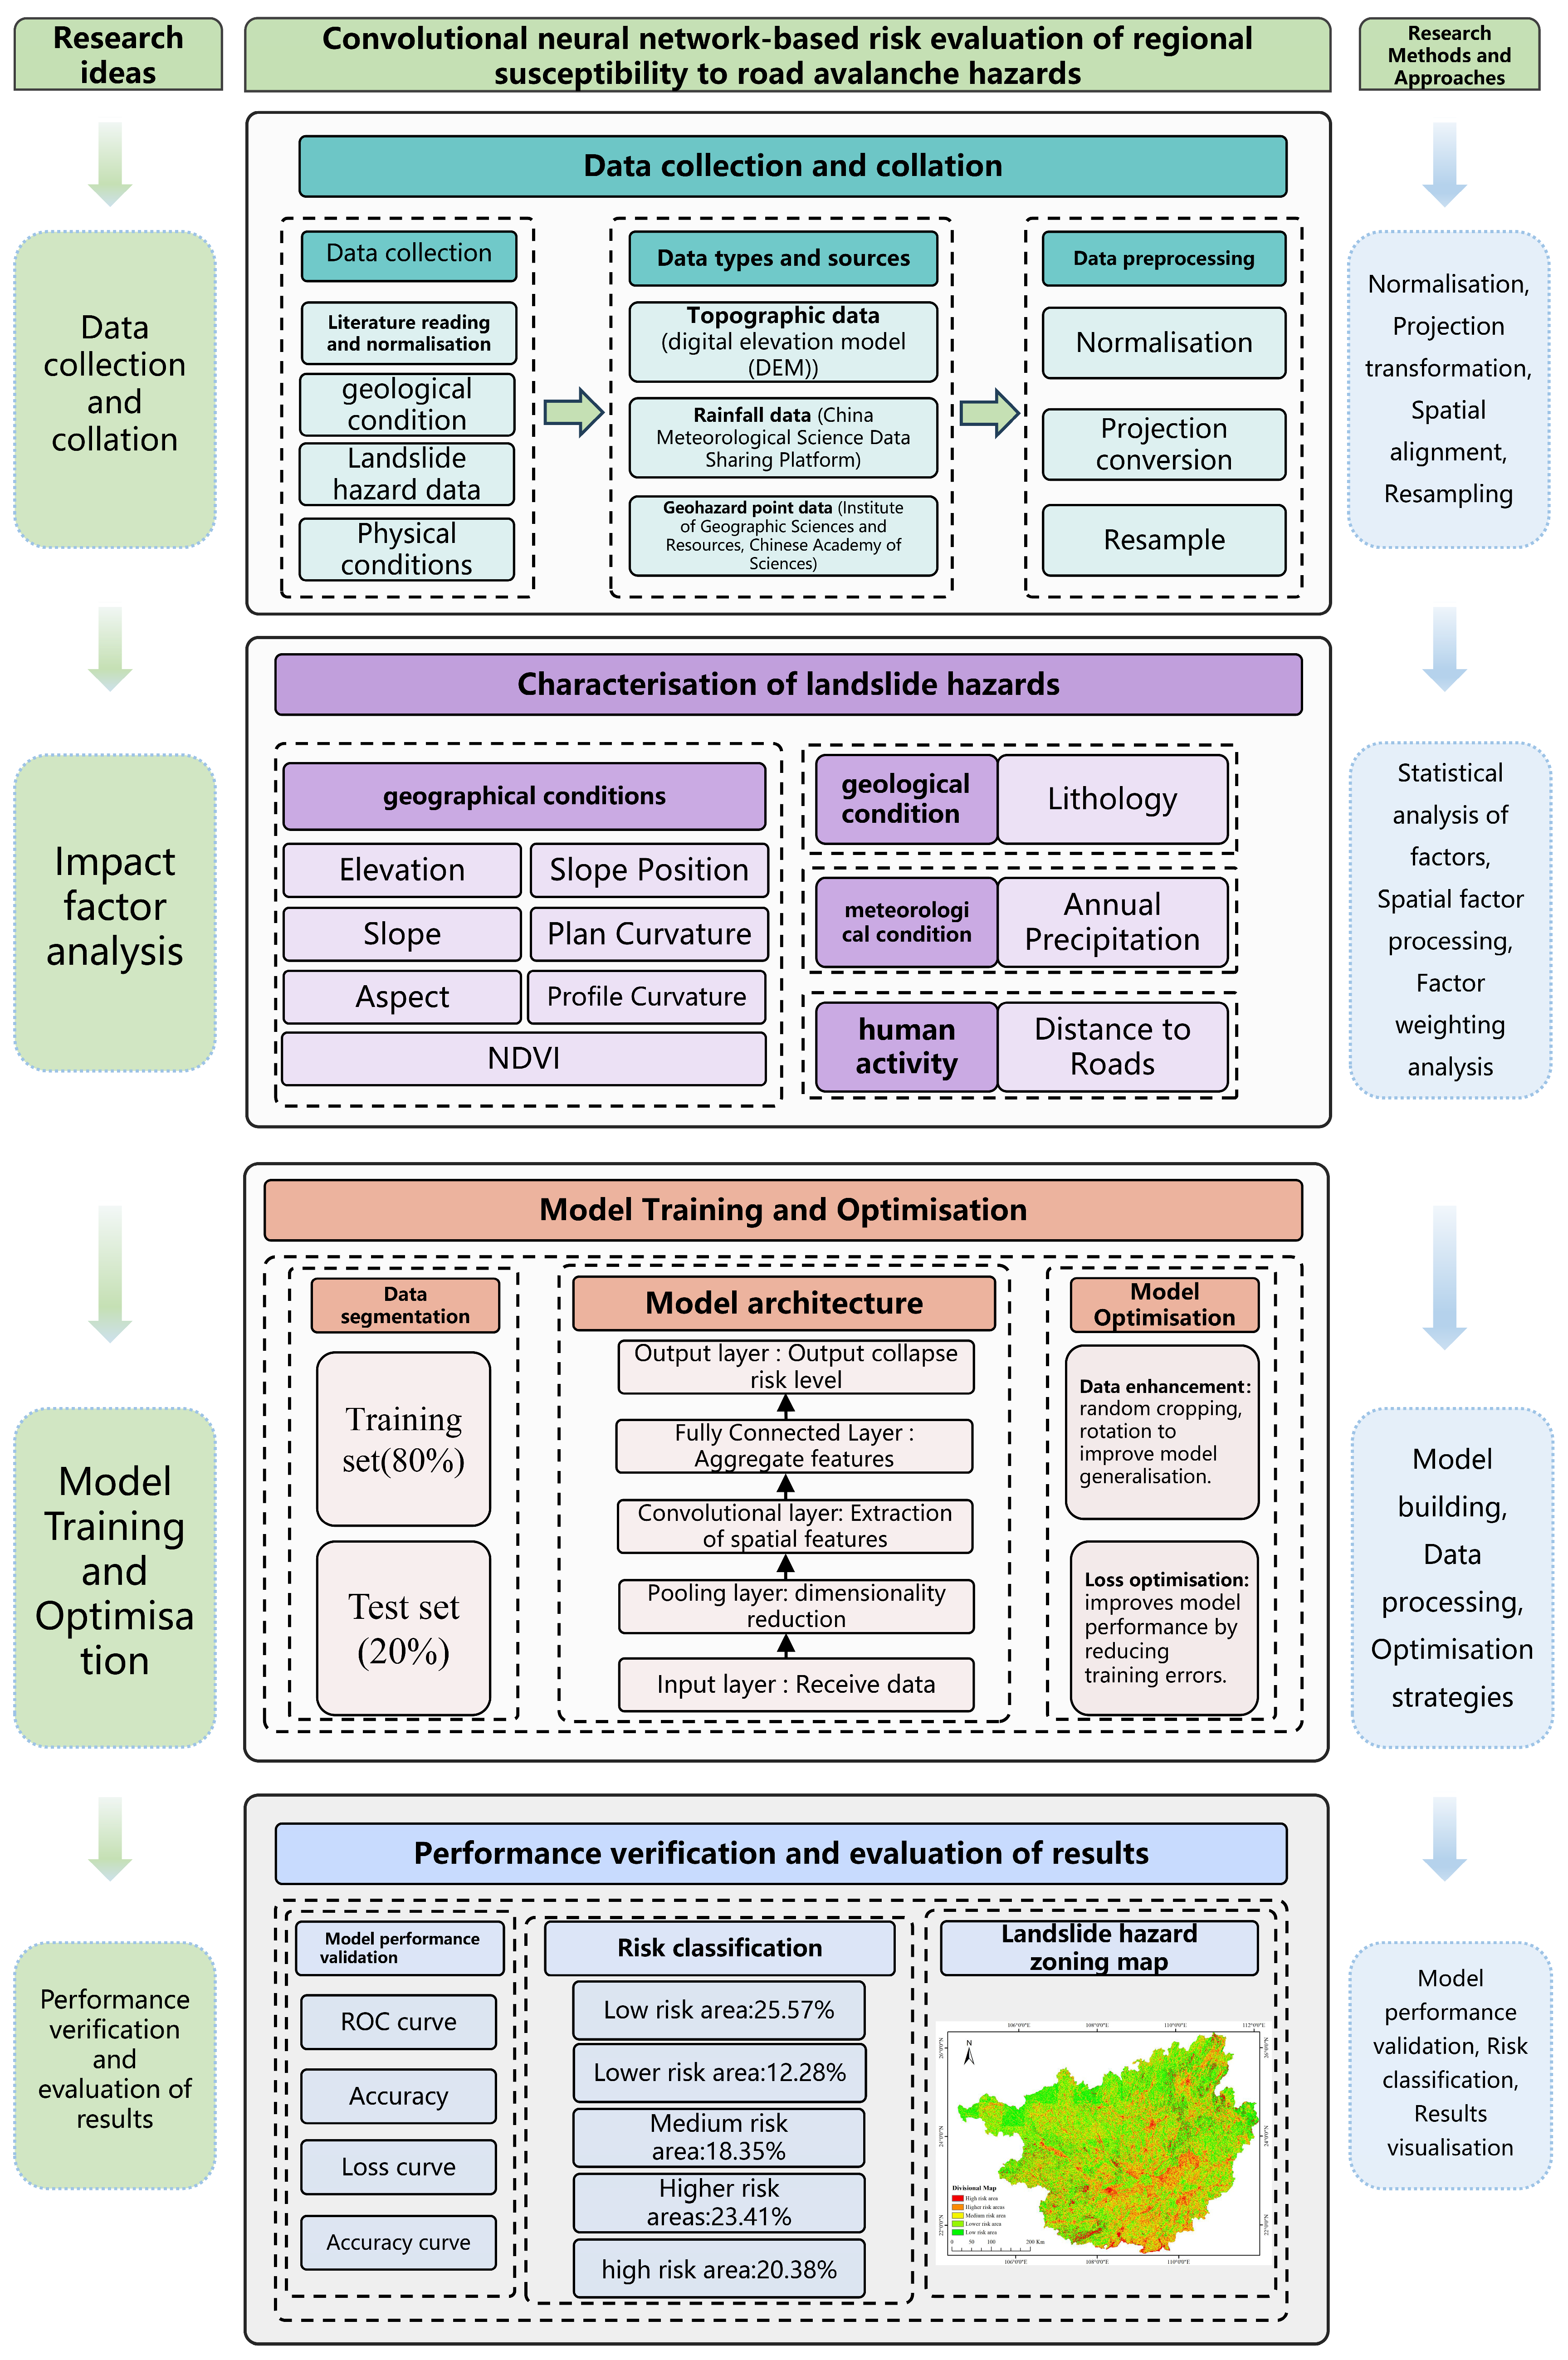
2.2. Technical Lines of Research

This study introduces a collapse disaster risk assessment model that leverages convolutional neural network (CNN) technology to evaluate collapse disaster susceptibility in the Guangxi Zhuang Autonomous Region. The technical roadmap for this model is outlined in Figure 2.
The development of the model follows a four-step technical framework:
① Data Collection: Multi-source data pertinent to collapse disasters are compiled, including historical collapse disaster inventory data, geological conditions (e.g., lithology, slope, and aspect), natural geographic factors (e.g., precipitation), and anthropogenic factors (e.g., road networks and land use). These data are preprocessed through standardization, projection transformation, and rasterization to create an analysis dataset tailored for the CNN model [7]. ② Model Training and Optimization: The CNN model is trained using the preprocessed dataset, with fivefold cross-validation applied to optimize hyperparameters. The rectified linear unit (ReLU) activation function and the Adam optimizer are employed to enhance training efficiency and predictive accuracy [14]. ③ Susceptibility Prediction: The trained CNN model is used to predict susceptibility levels across Guangxi, integrating key factors such as slope, lithology, and distance from roads [15]. ④ Susceptibility Mapping: Susceptibility maps are generated from the prediction results, with risk levels classified into five categories—very high, high, medium, low, and very low—using the Natural Breaks method, providing a foundation for disaster prevention and control strategies [16]. Additionally, the model’s predictive performance has been validated using receiver operating characteristic (ROC) curves to ensure its reliability. This approach capitalizes on the CNN’s ability to integrate complex multi-source data, thereby enhancing the precision of susceptibility assessments and delivering actionable insights for disaster mitigation in Guangxi.

2.3. Data Processing Methods

2.3.1. Convolutional Neural Network (CNN)

A convolutional neural network (CNN) is a deep learning model designed for image recognition and classification. Its core structure comprises a convolutional layer, a pooling layer, an activation layer, and a fully connected layer [17]. A CNN automatically learns complex feature representations by extracting features from the input data layer by layer while simultaneously reducing the number of model parameters and enhancing computational efficiency [18]. The convolutional layer, as the cornerstone of a CNN, extracts local features by sliding a convolution kernel across the input feature map to preserve critical spatial information [19]. The convolution operation is calculated as follows:
y j p = f i = 1 N i p 1 x j p 1 W i , j + b j p , j = 1 , 2 , M
where y j p represents the output of the p -th convolutional layer for the j -th feature map, x j p 1 denotes the input feature map from the previous layer, W i , j is the convolution kernel (weight matrix), b j is the bias term, indicates the convolution operation, f is the activation function (e.g., ReLU), N i p 1 is the number of input feature maps, and M   is the number of output feature maps.
Following the convolutional layer, the pooling layer applies maximum or average pooling to the feature map, reducing its dimensionality to decrease computational complexity while retaining key features [15]. This operation is expressed as follows:
y ij = max m , n   x i + m j + n
where y ij is the output of the pooling operation at position i , j , x i + m j + n represents the input feature values within the pooling window, and m and n denote the offsets within the pooling region.
This multilevel feature extraction can preserve the spatial information of the input image and also effectively reduce the model parameters to improve the computational efficiency. In addition, the activation function (e.g., ReLU) enhances the expressive ability of the model through nonlinear transformation, which makes the CNN perform well in high-dimensional image data processing.

2.3.2. ResNet18 Model and Its Optimization

A residual network (ResNet) is a classical architecture in deep learning designed to address the challenges of gradient vanishing and degradation [20]. As network depth increases, traditional deep neural networks often struggle to train effectively due to gradient vanishing. To overcome this challenge, ResNet introduces residual blocks (residual blocks), incorporating skip connections in each layer to directly pass the input to subsequent layers. The fundamental formula is as follows:
y = F x , { W i } + x
where F x , { w i } denotes nonlinear transformations (e.g., convolution and ReLU activation), x denotes the input, and y denotes the output. With this design, the residual block can effectively mitigate the phenomenon of gradient vanishing while improving the feature learning ability and convergence speed of the model.
ResNet18 contains an 18-layer structure with a 3 × 3 convolutional kernel and ReLU activation function, which is particularly suitable for processing high-resolution image data. In this study, parameter optimizations were performed on the model, including the use of batch normalization to reduce the internal covariate bias and speed up the training convergence and data enhancement (e.g., random cropping, rotation) to improve the model generalization ability [21,22,23,24]. Ultimately, the ResNet18 model balances computational efficiency and prediction accuracy while maintaining depth.
Selection Rationale and Performance Advantages: ResNet18 was selected for its proven ability to efficiently process complex, high-dimensional data under limited computational resources, making it an ideal choice for collapse risk assessment based on multi-source remote sensing data. Its residual structure effectively mitigates the gradient vanishing problem, enabling robust training of deep architectures. In this study, ResNet18 exhibited exceptional capability in extracting spatial and contextual features from diverse inputs, such as slope gradient, lithology, vegetation coverage, and annual precipitation, thereby enhancing the classification accuracy of collapse risk prediction. Furthermore, its integration with batch normalization and data augmentation strengthens model robustness, ensuring reliable performance across diverse remote sensing datasets [16,25,26].

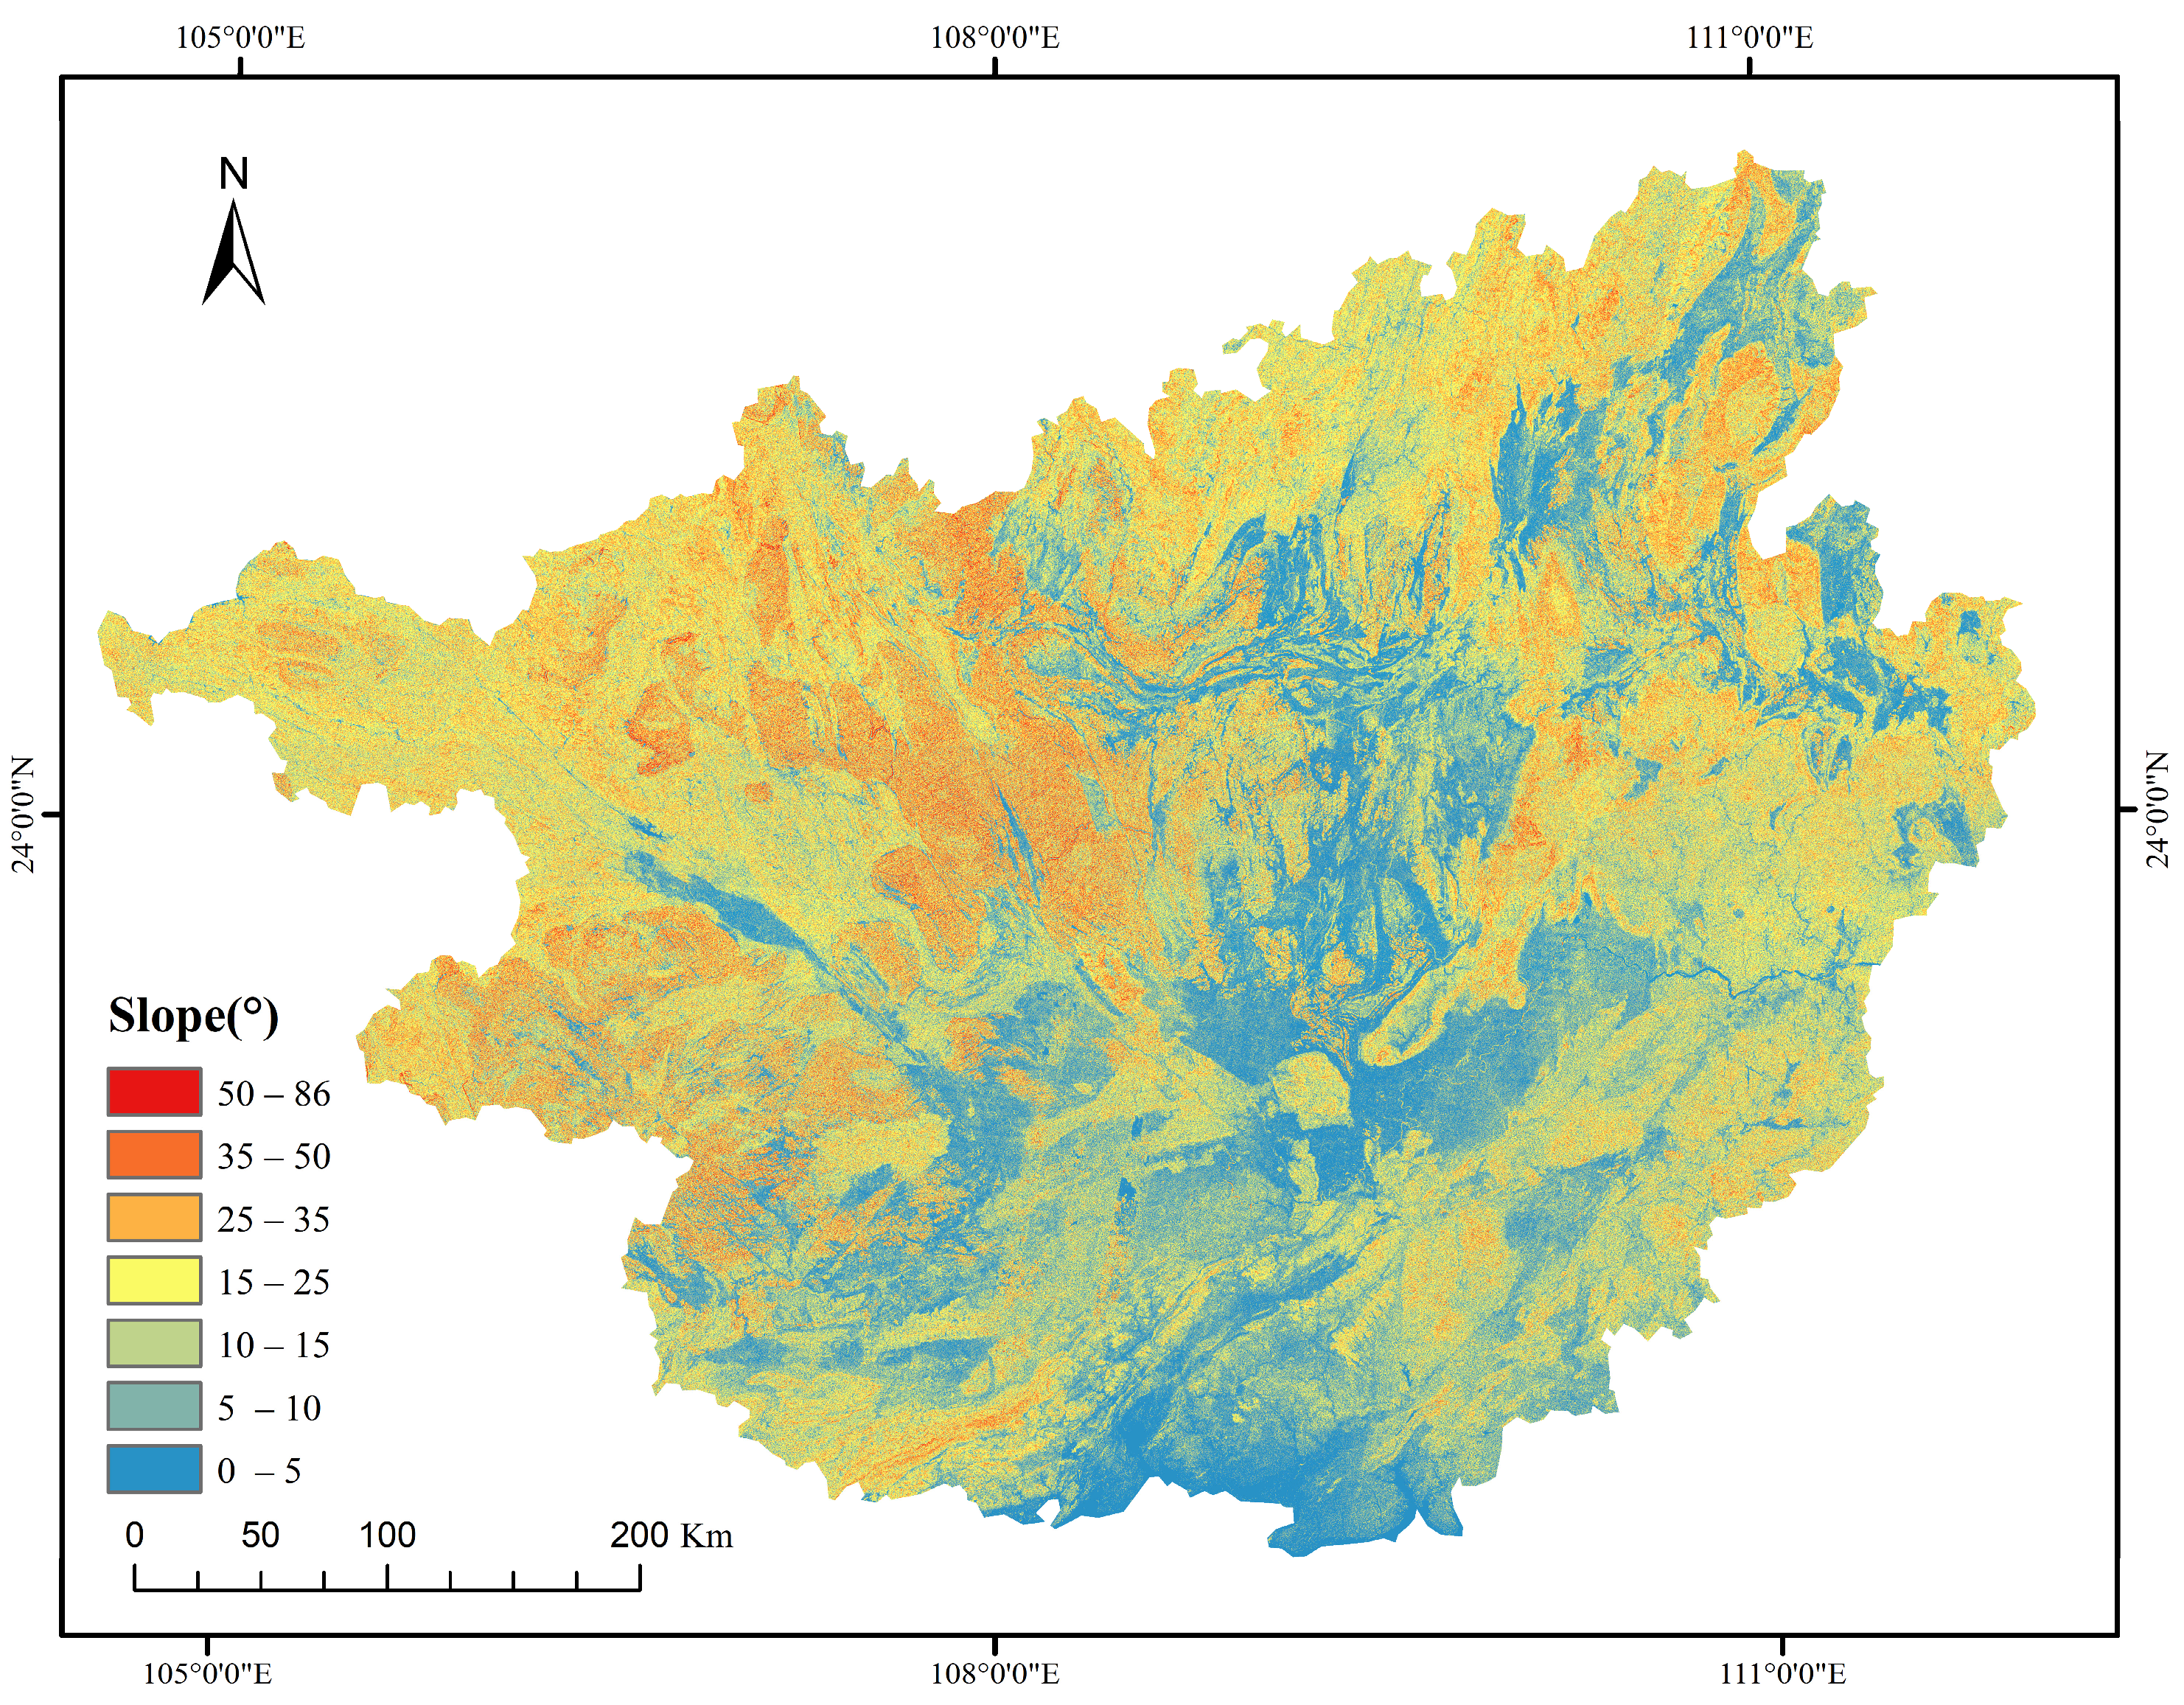
2.3.3. Factors for Evaluating the Susceptibility to Collapse Hazards

The selection of factors for evaluating collapse hazard susceptibility is a critical step in constructing predictive models [27]. In this study, 10 evaluation factors were selected based on the principles of scientific rigor and practicality, including slope, aspect, lithology, planar curvature, sectional curvature, vegetation cover, annual precipitation, population density, soil moisture, and distance from roads [28,29]. These factors comprehensively reflect the influences of geological features, climatic conditions, and human activities on collapse hazards [30,31]. During the factor selection process, the principles of systematicity and pertinence were adhered to, ensuring that the chosen factors fully captured the primary geological characteristics of the study area and addressed key influencing factors. Simultaneously, the principles of simplicity and operability were followed, enhancing model efficiency by selecting concise and manageable factors. Additionally, the principle of integrating qualitative and quantitative approaches was applied, ensuring that the factor selection was both scientifically sound and aligned with practical application needs. Through rigorous screening and optimization, the selected factors provide a robust theoretical foundation for assessing collapse hazard susceptibility, significantly improving the accuracy and reliability of the model’s predictive outcomes [32].

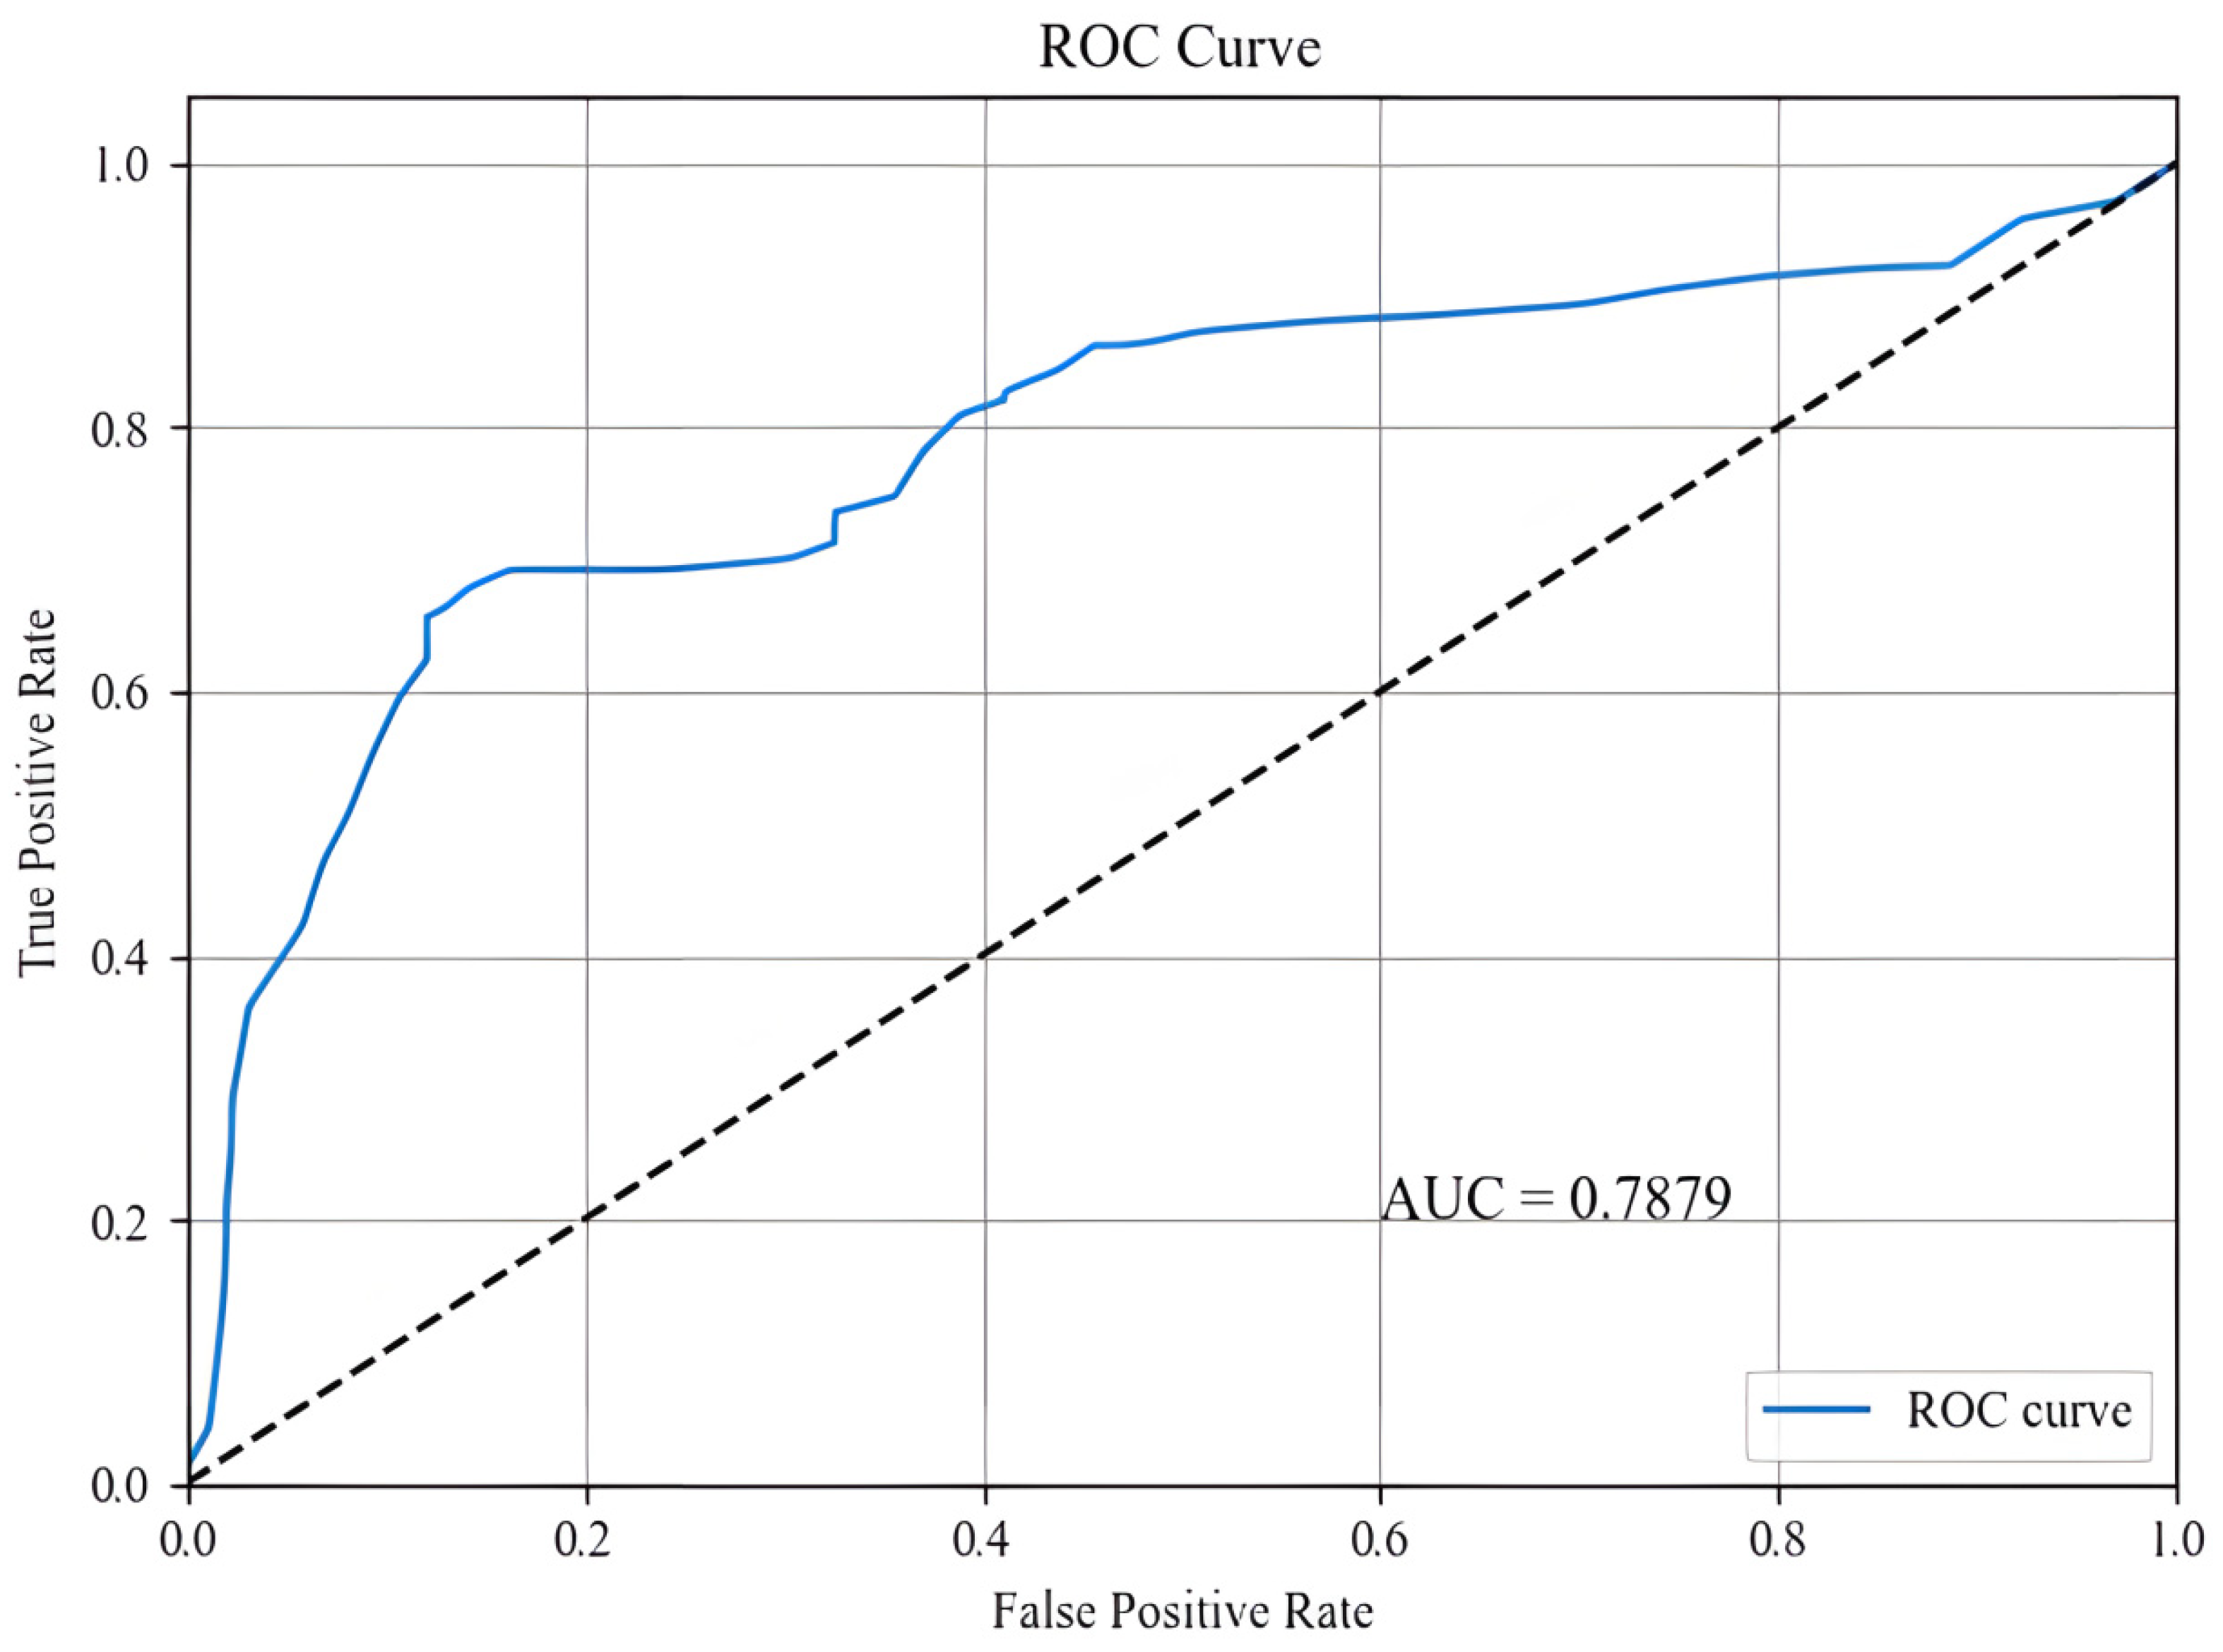
2.3.4. Precision Evaluation Method (ROC Curve)

In assessing model predictive performance, the receiver operating characteristic curve (ROC curve) serves as a widely adopted metric to evaluate the model’s classification capability across varying thresholds. The ROC curve assesses model accuracy by illustrating the relationship between the true positive rate (TPR) and the false positive rate (FPR), with the area under the curve (AUC) providing a quantitative measure of classification performance. AUC values approaching 1 indicate superior model classification performance [33]. Specifically, the true positive rate (TPR) and false positive rate (FPR) are calculated as follows:
T P R = T P T P + F N , F P R = F P F P + T N
where TP denotes the true positive, FP represents the false positive, TN is the true negative, and FN is the false negative. These metrics form the foundation for evaluating model performance. In this study, the accuracy of the ResNet18 model in assessing collapse hazard risk is evaluated by computing the area under the curve (AUC) value. The AUC values of different models are compared to determine the optimal model. Furthermore, the Receiver operating characteristic (ROC) curve is employed to detect potential overfitting or underfitting, thereby facilitating the optimization of model parameters [34].

2.3.5. Methodology for Categorizing Evaluation Factors

In the evaluation of collapse hazard susceptibility, the factor classification method constitutes a critical component of model construction. In this study, the natural breaks method (NBM) is employed to classify evaluation factors. This method leverages the natural clustering characteristics of the data, grouping them to minimize within-group variance while maximizing between-group variance [35]. The natural breaks method effectively highlights significant differences among factors, making it particularly suitable for classifying factors with non-uniform distribution characteristics in geohazard risk evaluation. To ensure the comprehensiveness and scientific rigor of the classification approach, this study also examines the equidistant classification method and the empirical classification method for comparison. The equidistant classification method, which divides the data range into equal intervals, is well-suited for uniformly distributed data and offers simplicity and ease of operation. In contrast, the empirical classification method categorizes data based on the experience of domain experts or existing research, making it applicable to specific regions or conditions, though it may introduce subjectivity [36]. Ultimately, the natural breaks method is selected as the factor classification method, not only because it more accurately reflects the natural variation characteristics of the factors but also because it facilitates the extraction of distinct characteristics of control factors within the region. This enables the formulation of a classification framework applicable to evaluating collapse hazard susceptibility, significantly enhancing the overall effectiveness and accuracy of the prediction model.

2.3.6. Evaluation Factor Selection and Normalization

Road collapse disasters arise from the combined effects of natural and human-induced factors. Considering the environmental and geological features of the Guangxi Zhuang Autonomous Region, the study area in China, this study selected 10 key evaluation factors essential for risk assessment: slope gradient, aspect, lithology, plan curvature, profile curvature, vegetation coverage, annual precipitation, population density, soil moisture, and distance to roads. These factors were standardized to ensure robust data support for collapse risk analysis, thereby improving the model’s predictive precision. Natural factors predominantly include geological and climatic elements (e.g., topography, lithology, and precipitation), whereas human-related factors encompass road infrastructure and population density.
Standardization Process: To address dimensional disparities and enhance data comparability, all factor datasets underwent a systematic standardization process, outlined as follows:
(1)
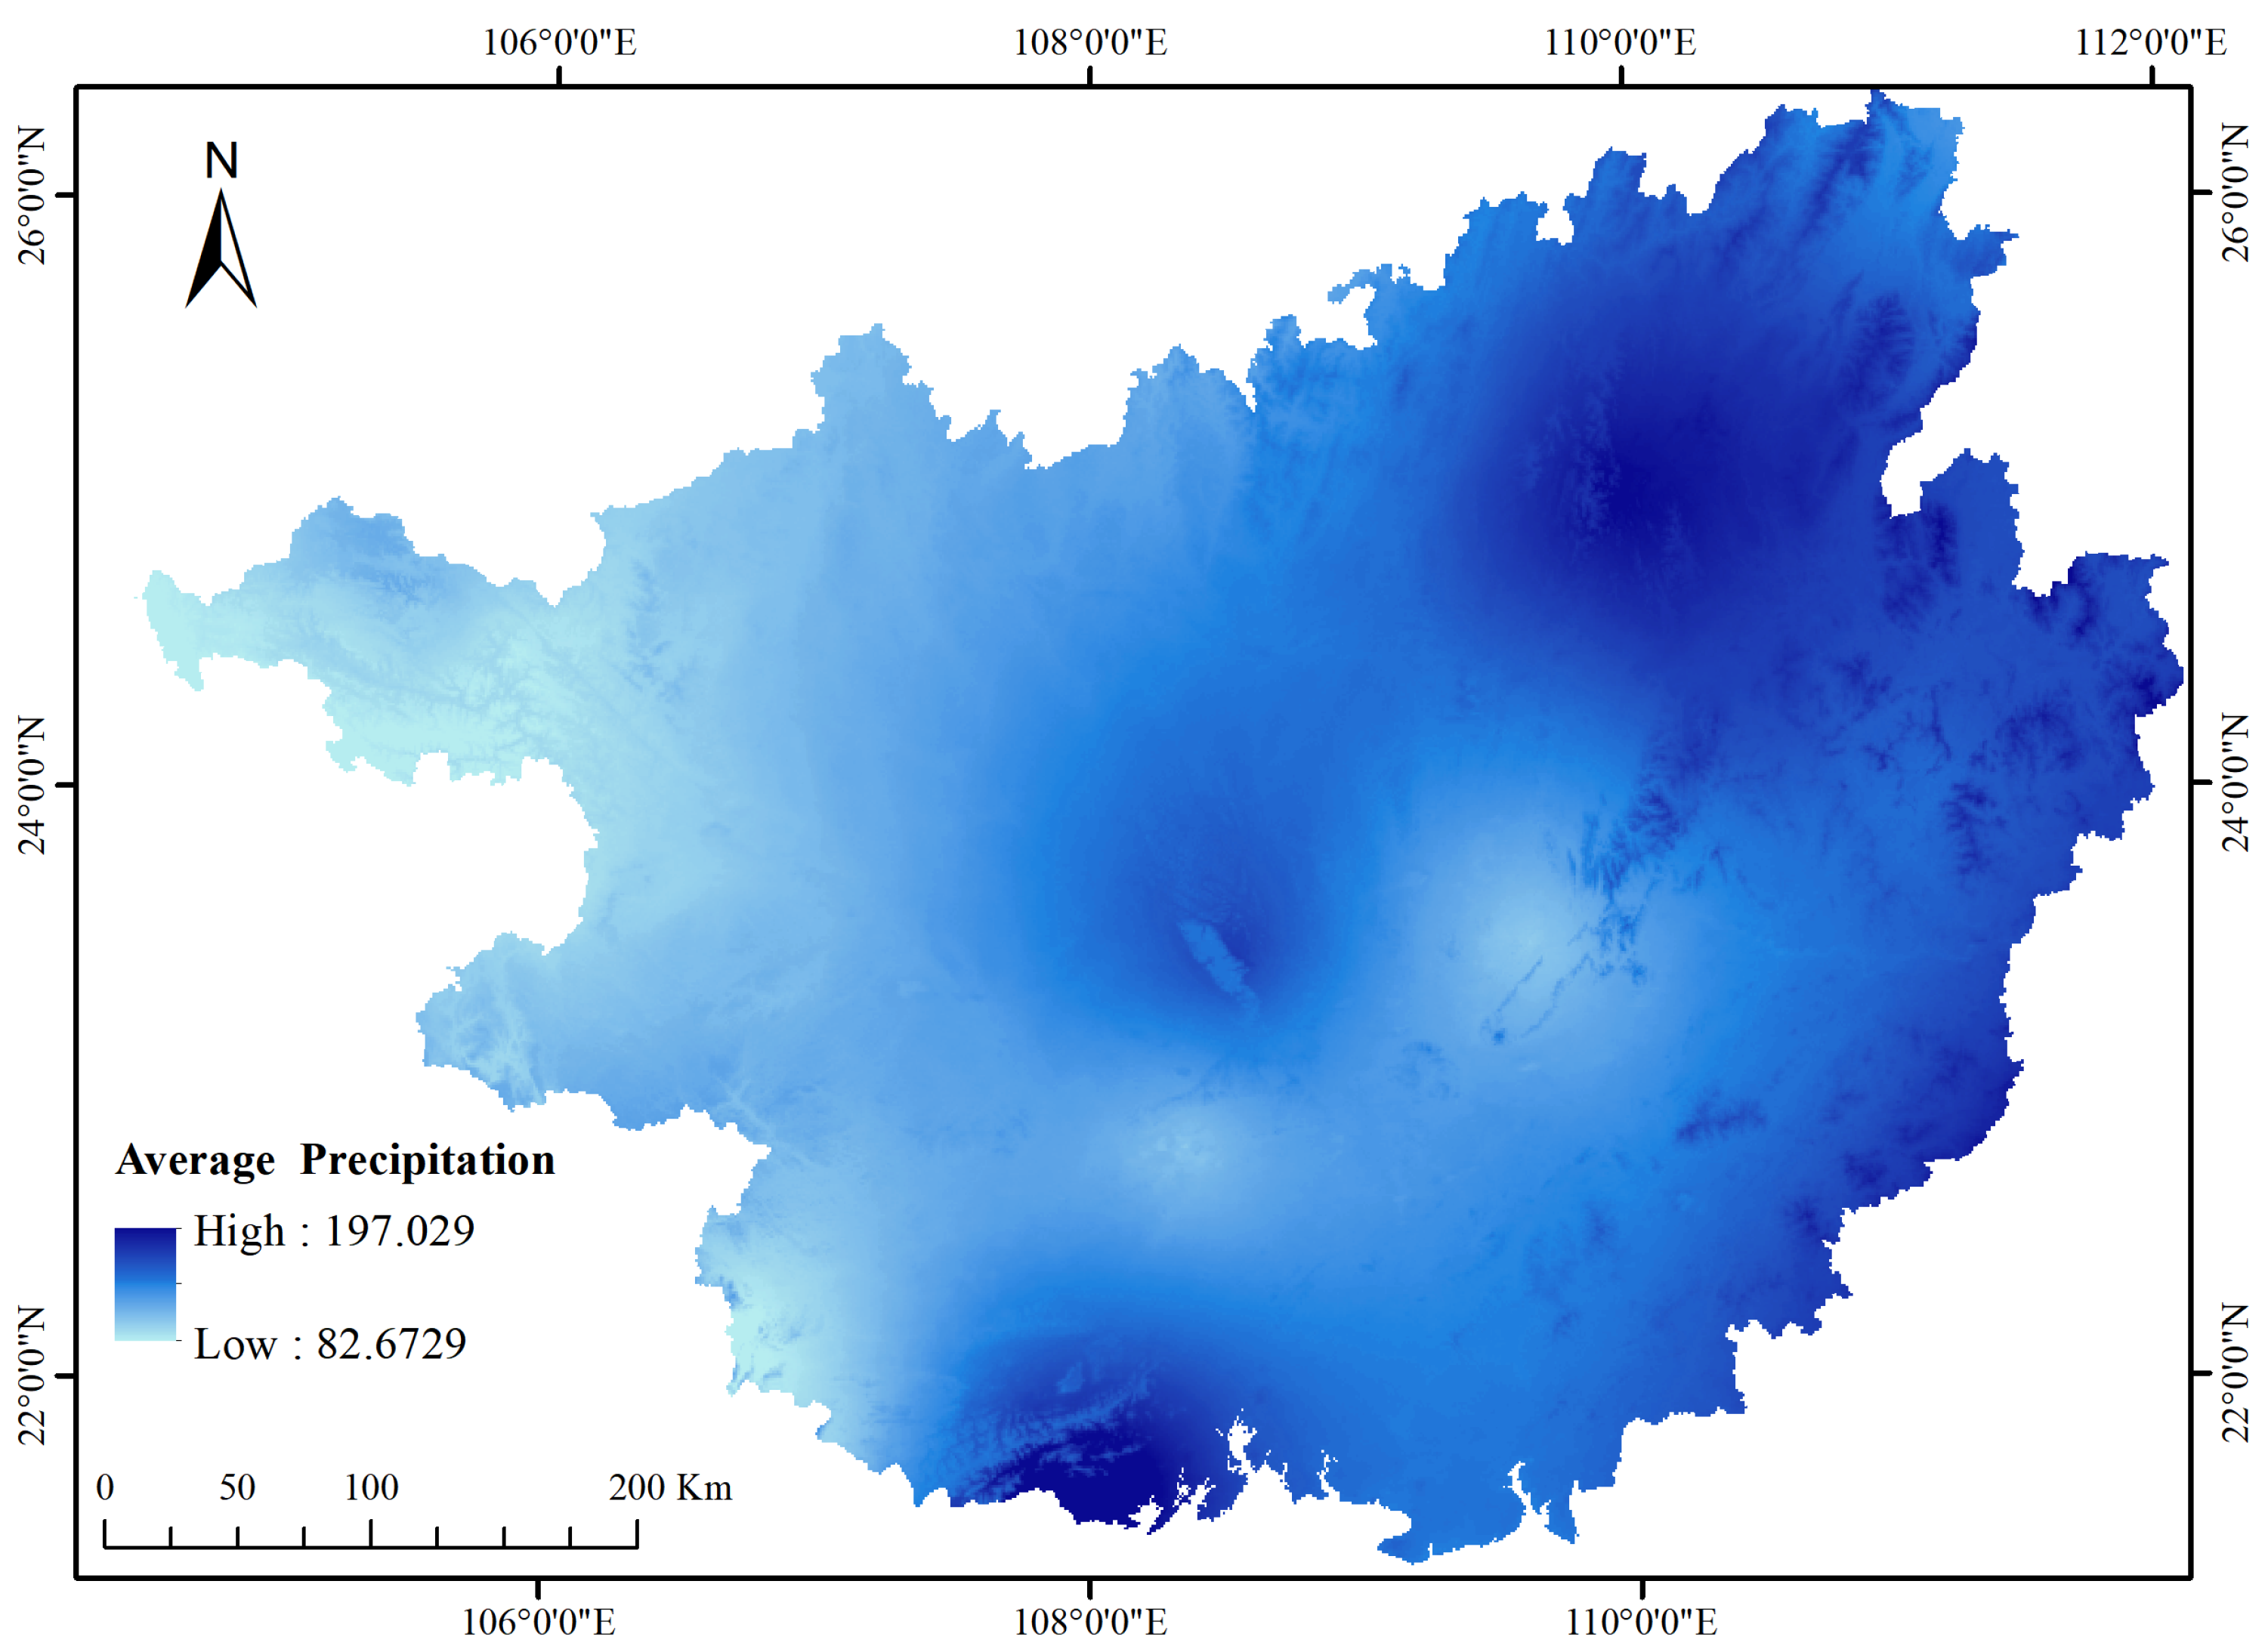
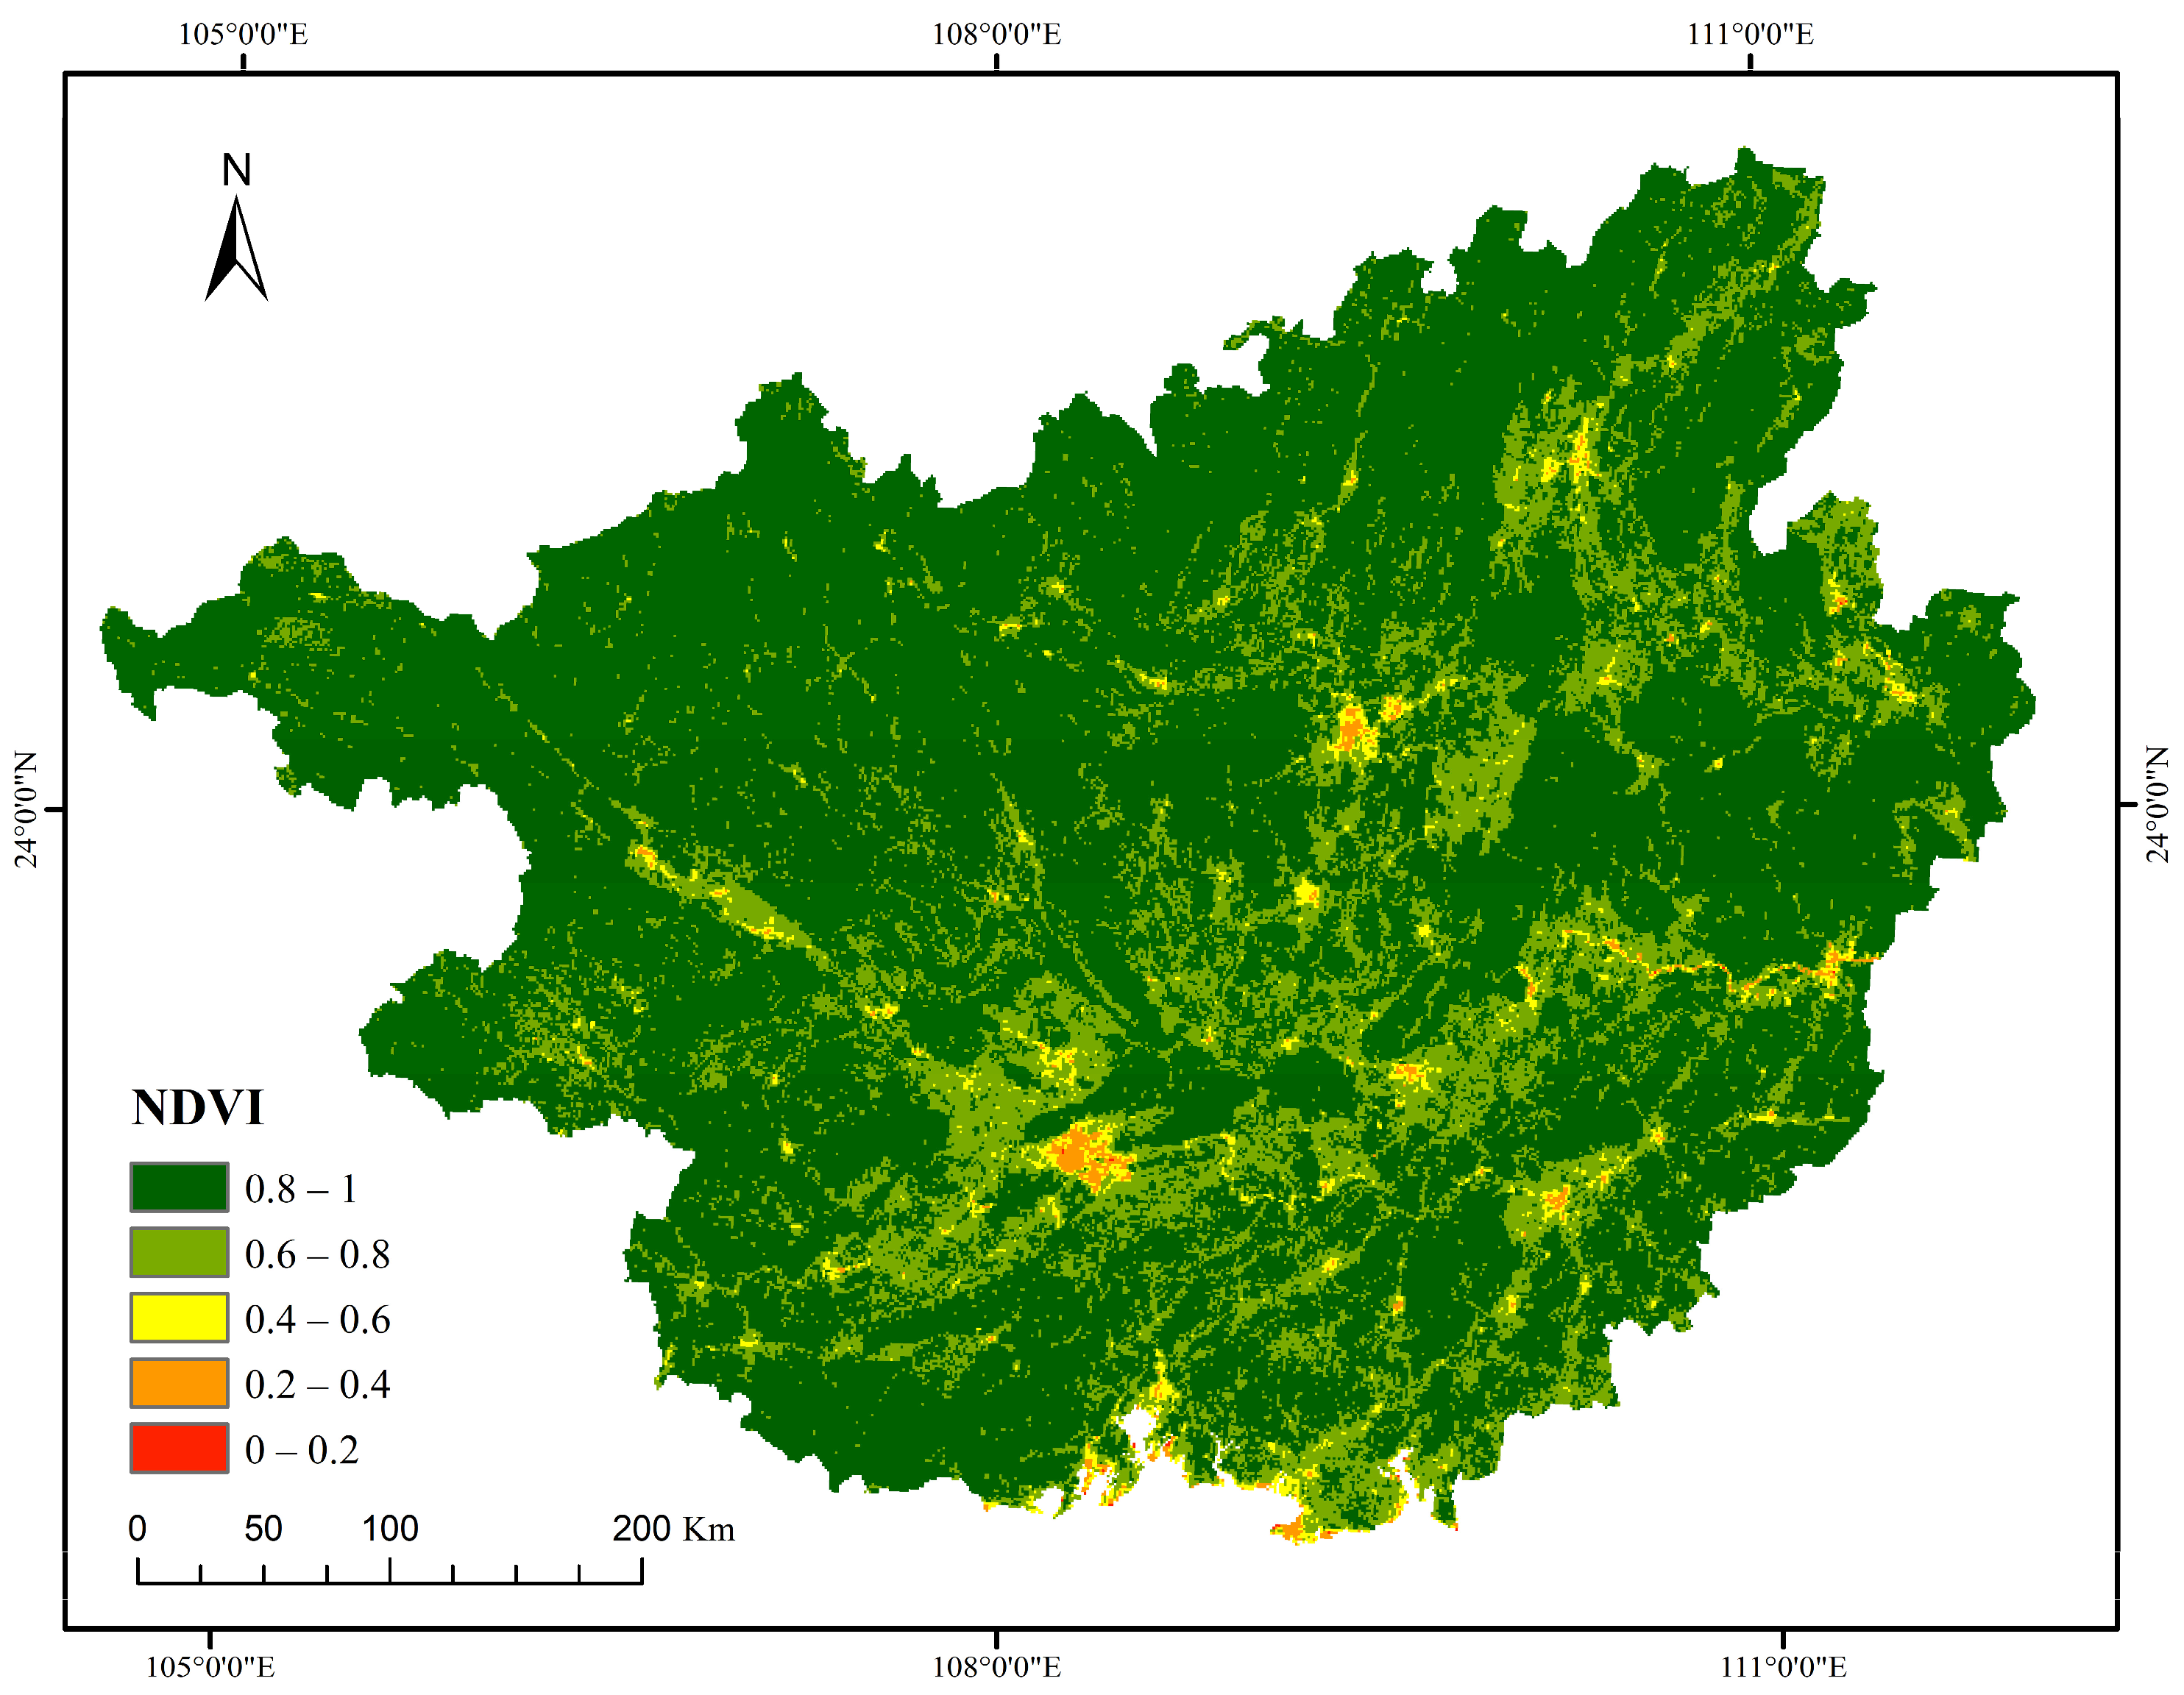
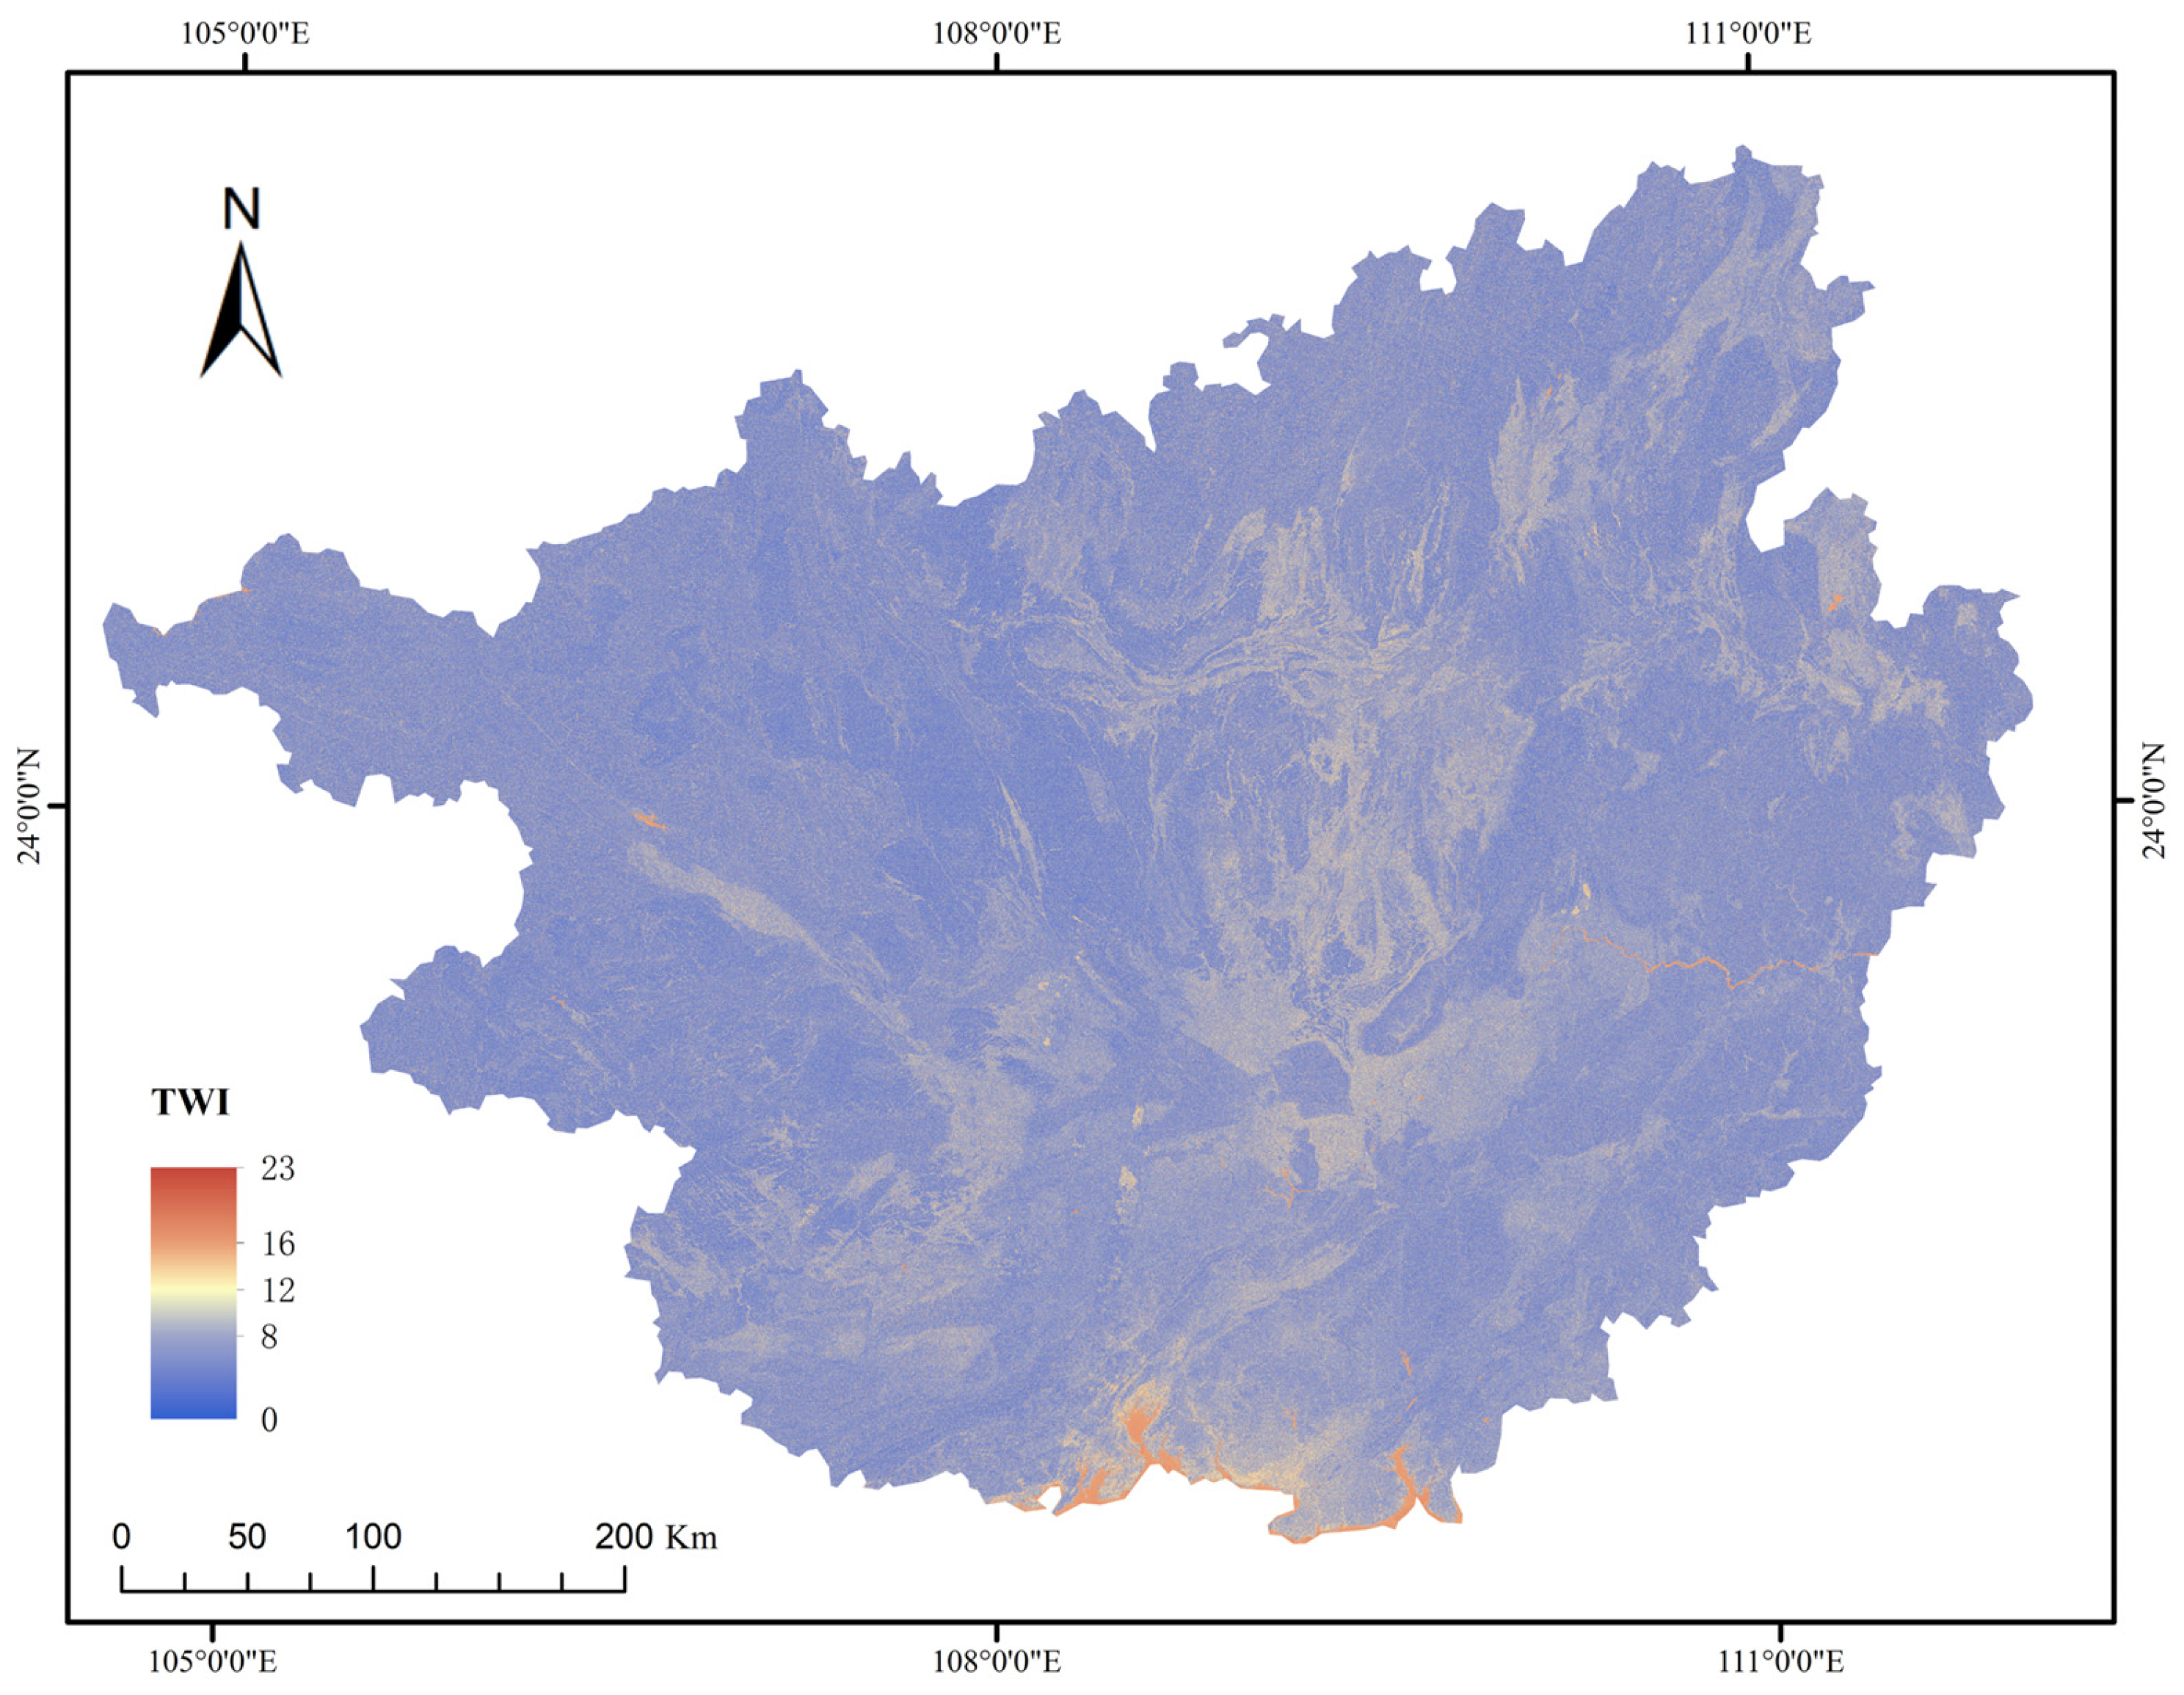
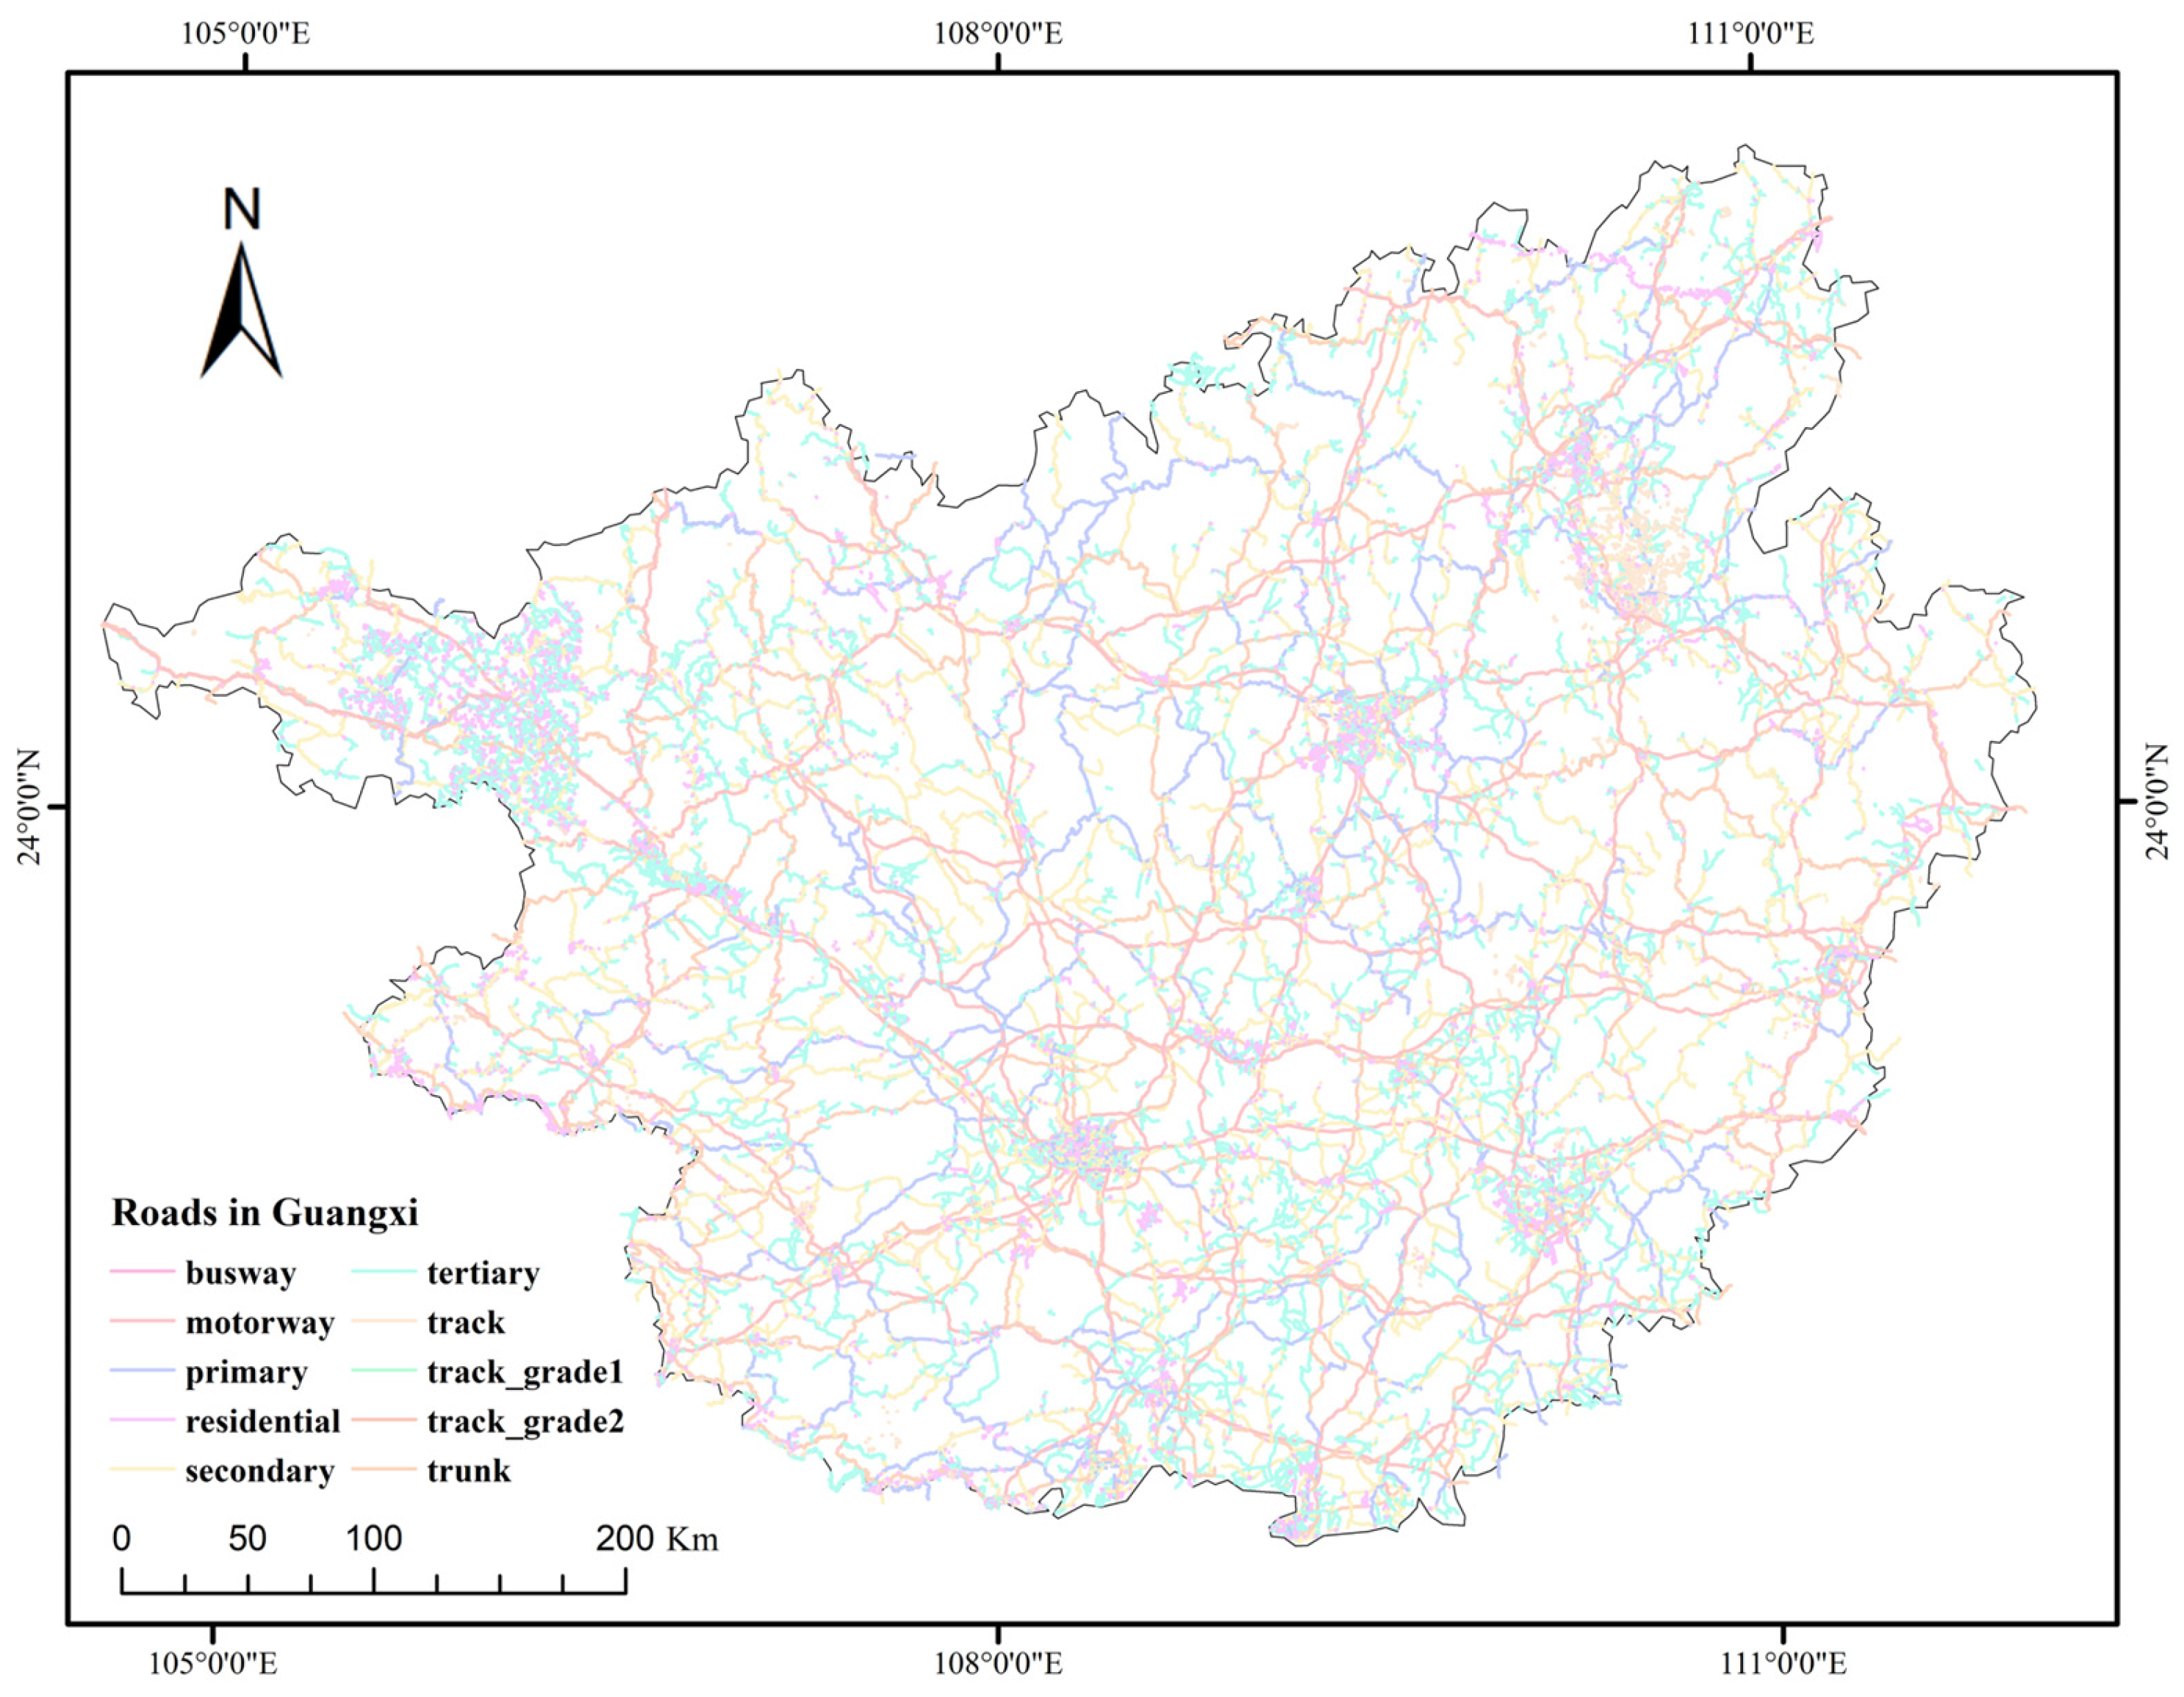
Data Collection and Preprocessing: Factor data were acquired from Guangxi sources. Slope gradient, aspect, plan curvature, and profile curvature were extracted from a digital elevation model (DEM); lithology data were sourced from geological surveys; vegetation coverage and soil moisture data were derived from remote sensing imagery; annual precipitation was obtained from meteorological records; and population density and distance to roads were calculated using demographic and road network data. All datasets were cleaned and standardized to ensure quality and uniformity.
(2)
Standardization Method: Given the data distribution and the convolutional neural network (CNN) model’s requirements, min–max normalization was employed. This method rescales factor values to the [0, 1] range, maintaining their relative relationships while aligning with the neural network’s input specifications [16].
(3)
Normalization Calculation: For each factor X (e.g., slope gradient or precipitation), the normalized value X norm is calculated using the following formula:
X norm = X X min X max X min
where X min and X max denote the minimum and maximum values of the factor across the study area, respectively [26].
(4)
Data Validation and Adjustment: After standardization, the normalized data were examined to detect and correct outliers or missing values. For factors prone to extreme values (e.g., population density), logarithmic transformation or truncation was applied prior to normalization to reduce skewness and improve model training stability [25].
(5)
Application of Results: The standardized factors were utilized as input features for CNN training and risk assessment, unifying their scales and enhancing the model’s capacity to discern variable interactions [26].
This rigorous standardization process ensured data consistency, providing a solid foundation for the accuracy and reliability of the subsequent risk prediction model.

3. Results

3.1. Modeled Prediction Result

3.1.1. The Partitioned Risk of Collapse Disaster Susceptibility in Guangxi

Utilizing the ResNet18 model to assess collapse disaster risk in Guangxi, this study classifies collapse susceptibility into five levels: very high risk, high risk, medium risk, low risk, and very low risk. The assessment results, as depicted in Figure 3, indicate that the very high-risk zone spans approximately 49,219 km2, accounting for 20.4% of Guangxi’s total area, with 4266 collapse disaster sites and a density of 8.7 sites per 100 km2. This zone features a complex geological environment and an average annual rainfall typically exceeding 200 mm, which, combined with the dense highway network, significantly heightens the likelihood of collapse occurrences. The high-risk zone encompasses approximately 56,544 km2, representing 23.4% of the total area, with 1909 collapse disaster sites and a density of 3.4 sites per 100 km2. The medium-risk zone covers 44,325 km2, constituting 18.3%, with 807 collapse disaster sites and a density of 1.8 sites per 100 km2. Conversely, the low-risk and very low-risk zones exhibit substantially lower collapse disaster risk. The low-risk zone occupies 29,665 km2, accounting for 12.3%, with 324 collapse disaster sites and a density of 1.1 sites per 100 km2, while the very low-risk zone extends across 61,751 km2, comprising 25.6%, with 180 collapse disaster sites and a density of 0.3 sites per 100 km2. Collectively, the very high- and high-risk zones constitute 43.8% of the total area, marking them as critical regions for collapse disaster prevention and mitigation. In contrast, the medium-, low-, and very low-risk zones display a sparse distribution of collapse sites and relatively low risk. This risk zoning provides a scientific foundation for the prevention, control, and management of collapse disasters in Guangxi.

3.1.2. Area and Risk Distribution for Each Risk Class

By dividing the risk of collapse disaster susceptibility in Guangxi into regions, this study classified the risk of collapse disaster into five levels based on the ResNet18 model: very high risk, high risk, medium risk, low risk, and very low risk. This study counted the percentage of each area, the number of disaster sites, and the density of disaster sites in each risk level; the results are shown in Table 2.
The spatial distribution characteristics of collapse disaster risks in Guangxi were demonstrated. The results show that the very high-risk and high-risk areas occupy about 43.8% of the total area of Guangxi, which is the main area for the development of collapsed hazards, and the density of the disaster sites is significantly higher than that of other areas, so it is necessary to focus on strengthening prevention, control, and management measures in these areas. In contrast, although the medium risk and below account for a larger area (56.2%), the density of disaster points is significantly lower, and the overall risk is controllable. Such distribution characteristics reflect the differences in risk under the combined effects of geology, climate, and human activities, further indicating that the very high-risk and high-risk areas need to be prioritized for disaster prevention, while the low-risk and very low-risk areas can appropriately adopt ecological restoration and other strategies to comprehensively enhance the level of regional safety.

3.2. Model Accuracy and Evaluation Analysis

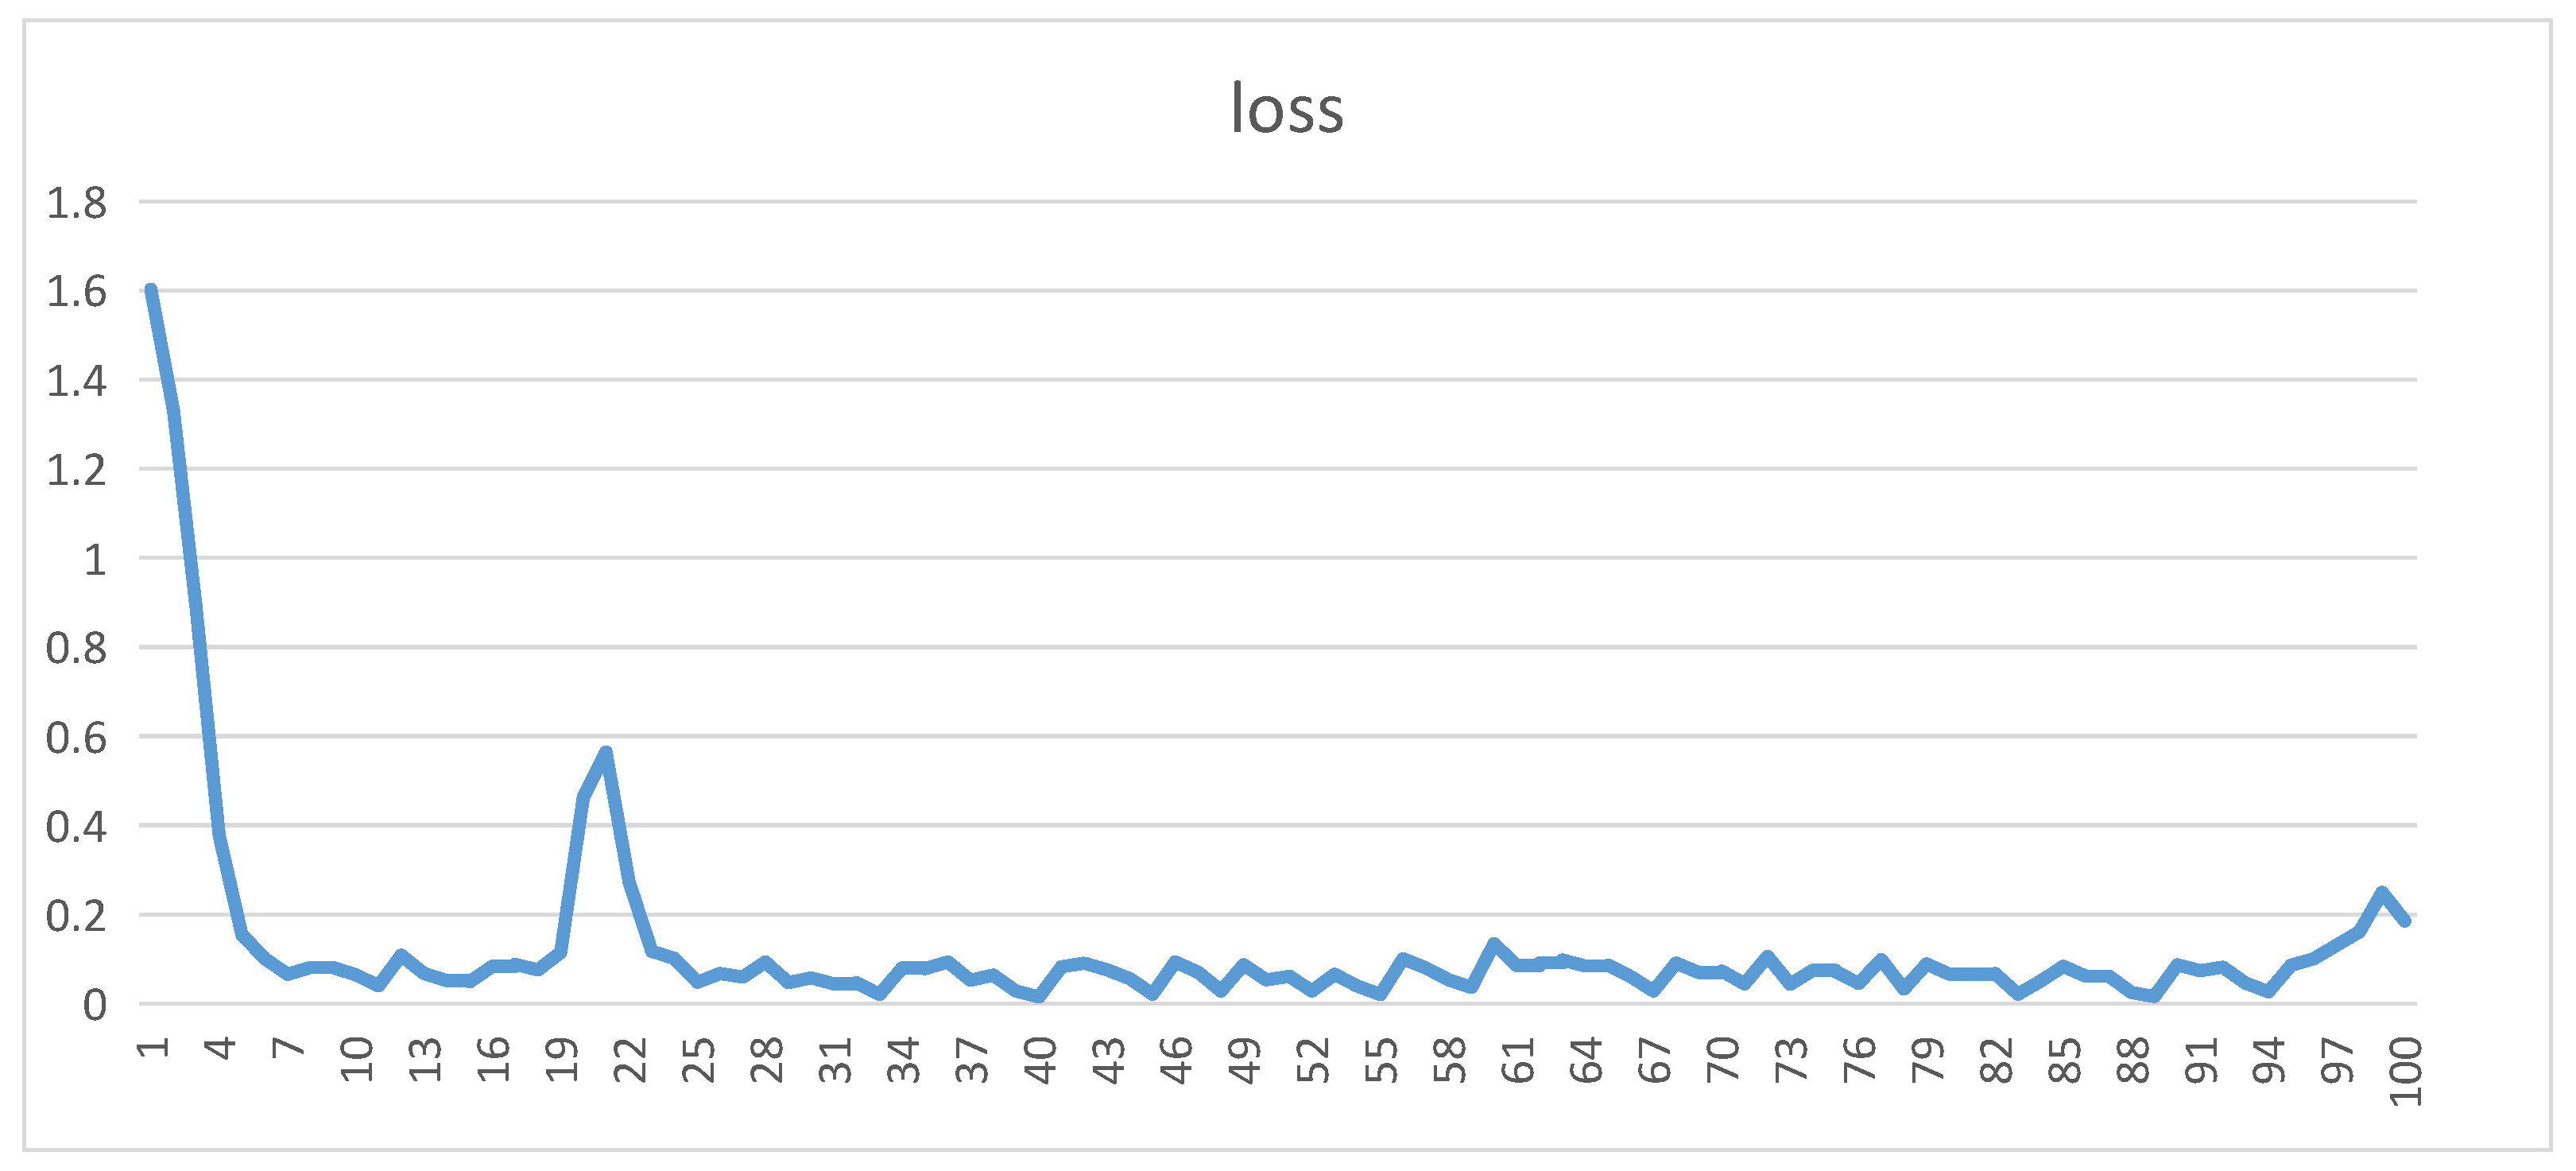
3.2.1. Analysis of the Model Training Process

This study optimized parameter configurations and data processing workflows, effectively enhancing the training performance of the ResNet18 model for road collapse disaster risk assessment. During the data preprocessing phase, multi-source factor data, including lithology and plan curvature, were uniformly resampled to a consistent spatial resolution to ensure data compatibility [37]. To meet the input requirements of the ResNet18 model, Python (3.9.5) scripts were utilized to transform single-channel factor data into three-channel color images, aligning with the model’s pretrained input format. Subsequently, all factor data were integrated into a comprehensive factor map for model training and testing.
Model training employed the stochastic gradient descent (SGD) optimizer for parameter optimization, with an initial learning rate of 0.001 and a dynamic learning rate adjustment strategy. For data allocation, 80% of the road collapse disaster points were assigned to the training set, with the remaining 20% allocated to the test set. Through iterative experimentation, the optimal parameter combination was determined, setting the training duration to 100 epochs, with each epoch processing batches of 64 images fed into the model.
Figure 4 illustrates the loss curve during the ResNet18 model training process, where the horizontal axis represents training epochs (unitless, ranging from 0 to 100), and the vertical axis indicates loss values (unitless, ranging from 0 to 1.8). The loss value is defined as the cross-entropy loss between the model’s predicted probabilities and true labels, serving as a metric for evaluating classification performance [38]. The calculation formula is as follows:
L = 1 N i = 1 N y i log y i ^ + 1 y i log 1 y i ^
where L represents the loss value, N denotes the number of samples, y i is the true label for the   i -th sample, and y i is the predicted probability for the   i -th sample [39]. The loss curve indicates a rapid decline in loss within the first 10 epochs, followed by stabilization, signifying robust convergence during the training process [40].
Figure 5 illustrates the accuracy curve of The ResNet18 model for road collapse risk assessment using multi-source remote sensing data, including slope gradient, lithology, vegetation coverage, and annual precipitation. The horizontal axis represents training epochs (unitless, ranging from 0 to 100), while the vertical axis denotes accuracy (expressed as a percentage, ranging from 0% to 100%), calculated by comparing model predictions with ground-truth labels using a test set comprising 20% of the road collapse points. The curve reveals that accuracy rises rapidly within the first 5 epochs, reaching approximately 80%, exhibits slight fluctuations and a brief decline around the 20th epoch, and subsequently stabilizes at approximately 90% by the 100th epoch. These approximate values reflect the model’s performance trend on the test set; results may vary if computed using other datasets (e.g., training or validation sets), indicating The ResNet18 model’s high classification capability and learning efficiency in this task.

3.2.2. The Evaluation of Classified Model Performance

After completing the model training, we validated the classification performance of the ResNet18 model using the ROC curve (receiver operating characteristic curve). The ROC curve is an important tool for measuring the performance of a classification model, and its shape and area can intuitively reflect the model’s classification stability under different thresholds and the accuracy of the model under different thresholds. Figure 6 shows the ROC curve of the ResNet18 model, which shows a smooth and continuous upward trend, indicating that the model exhibits high classification stability in distinguishing the risky and non-risky areas of collapse disasters.
To quantify the classification performance of the model, this study further calculated the area under the receiver operating characteristic (ROC) curve (AUC), which ranges from 0 to 1, with values closer to 1 indicating superior classification performance. In this study, The ResNet18 model achieved an AUC value of 0.7879, demonstrating strong discriminatory ability. Although this value does not reach an exceptionally high level (e.g., above 0.9) and is lower than the peak accuracy of 90% observed on the test set, this discrepancy does not indicate an anomaly but rather reflects the inherent differences between AUC and accuracy as evaluation metrics: accuracy is based on a single threshold and may be inflated by imbalanced data distributions (e.g., a higher proportion of non-risk samples), whereas AUC integrates performance across all thresholds. In the task of road collapse risk assessment using multi-source remote sensing data—including slope gradient, lithology, vegetation coverage, and annual precipitation—the AUC is constrained by data complexity and noise, making values above 0.9 challenging to attain. Combined with the training performance in terms of loss rate and accuracy, an AUC of 0.7879 still confirms the reliability and applicability of The ResNet18 model for road collapse risk assessment [41].
This figure visualizes the classification performance of the ResNet18 model in the avalanche hazard risk evaluation task. As can be seen from the curve, the model maintained a good balance between high sensitivity (true positive rate) and specificity (1 false positive rate) under different thresholds. This performance further verified the robustness and stability of the model in dealing with multi-factor input data, indicating that its prediction results possess high accuracy and reliability and provide theoretical support for the risk zoning and management of collapse disasters in Guangxi.

4. Discussion

The results of this study show that the risk for collapse hazards in Guangxi is mainly concentrated in the southern and southeastern low-mountain and hilly areas, which are characterized by high topographic relief, high precipitation, a more fragile geological environment, and intensive human activities. This regional high-risk feature poses a serious challenge to the construction and maintenance of roads and infrastructure. Clarifying the distribution of the risk levels helps to optimize resource allocation and disaster prevention strategies. Despite the high accuracy of the model in this study, there were some limitations in data collection; for example, the effects of topographic data and environmental factors over time were not fully considered. Future studies can improve the dynamics and timeliness of risk evaluation by introducing real-time monitoring data or improving the model algorithm.

4.1. Interaction of Different Factors and Their Impact on Road Collapse Disasters

In this study, the susceptibility risk assessment of road collapse disasters takes into account multiple natural and anthropogenic factors. These factors not only individually influence the risk assessment outcomes but also interact with one another, generating complex synergistic effects. To comprehensively understand their mechanisms of influence on road collapse disasters, this section examines the roles of individual factors and their interrelationships, delving into their contributions to risk assessment and the rationality behind their inclusion.
(1) Slope: Slope is a critical geological factor influencing the risk of road collapse disasters. Generally, steeper slopes are associated with poorer soil stability, thereby increasing the likelihood of landslides and collapses [24]. As shown in Figure 7, areas with steeper slopes are typically located in high-risk zones, which aligns with the study’s findings and underscores the significant role of slope in collapse risk assessment. However, the influence of slope is not isolated; it interacts with other factors such as precipitation and soil moisture [40]. In areas with steeper slopes, increased precipitation, and soil moisture further destabilize the soil, elevating the risk of collapse.
This figure illustrates the slope classification for the Guangxi Zhuang Autonomous Region, based on the ASTER GDEM digital elevation model (DEM) with a resolution of 30 m sourced from the Geospatial Data Cloud platform. Slope values were extracted from elevation data using geographic information system (GIS) techniques and were classified using the Natural Breaks method [7,29]. The classification intervals are defined as: 0–5°, 5–10°, 10–15°, 15–25°, 25–35°, 35–50°, and 50–86°. The natural breaks method optimizes within-group variance minimization and between-group variance maximization based on the distribution characteristics of slope data. Regions with steeper slopes (e.g., 50–86°) are categorized as high-risk zones due to reduced soil stability and increased vulnerability to collapse disasters, while gentler areas with slopes less than 10° are categorized as low-risk zones. This slope classification is a key input to the susceptibility risk assessment model based on a convolutional neural network (CNN), providing essential support for disaster prevention and regional planning.
(2) Lithology: Lithology directly affects soil stability. Areas dominated by soft rocks or highly fractured rock formations are more prone to landslides and collapses [25]. As illustrated in Figure 8, regions with softer lithology or well-developed fractures are generally associated with higher collapse risk, and the model results validate the rationality of including lithology as a factor. The synergistic interaction between lithology and other environmental factors, such as precipitation and vegetation coverage, also plays a significant regulatory role [41]. In regions with high precipitation, soft rock areas are susceptible to water infiltration, which further reduces the soil’s resistance to sliding and increases the risk of collapse.
This figure illustrates the lithological distribution in the Guangxi Zhuang Autonomous Region, generated based on geological surveys and geospatial data, highlighting the rock types influencing soil stability and collapse risk. The lithological classification includes sedimentary rocks (SC16, SC5, SC4, SC2, SC3, SC1, SO1, SO2), varying in hardness and fracturing degree, with softer or more erodible types exhibiting increased collapse risk under rainfall conditions; metamorphic rocks (UF, MB1, MB2, MA4/MB2, MA3/MB1), characterized by pronounced fracturing, resulting in reduced stability; and igneous rocks (IB1, IB2, IA4, IA1, UM), which generally resist weathering and exhibit high cohesion, though highly fractured or weathered igneous rocks (UR, WR, RK, IP2) are prone to collapse [26]. Softer lithologies show a significant correlation with higher collapse risk, a conclusion further validated by the model’s predictive results.
(3) Precipitation: Precipitation is a key climatic factor influencing collapse risk. Excessive precipitation can lead to soil saturation, thereby increasing soil instability. As shown in Figure 9, regions with higher annual precipitation typically exhibit greater collapse risk. The effect of precipitation is not isolated but interacts with factors such as slope and soil moisture [42]. In areas with steeper slopes, increased precipitation significantly elevates soil saturation, further exacerbating the occurrence of landslides and collapses. Thus, the interaction between precipitation and other natural factors is a critical contributor to the occurrence of road collapse disasters.
(4) Vegetation Cover: Vegetation coverage plays a significant role in maintaining soil stability, particularly in reducing soil erosion and retaining moisture [43]. As depicted in Figure 10, areas with dense vegetation coverage are typically classified as low-risk zones [12]. This finding suggests that vegetation can, to some extent, mitigate soil erosion and enhance soil stability. However, the effect of vegetation coverage varies across different regions and climatic conditions. Notably, in areas with high precipitation, vegetation may help alleviate soil saturation, thereby reducing collapse risk. In regions with substantial rainfall, high vegetation coverage contributes to maintaining greater soil stability, whereas in areas with sparse vegetation, even moderate precipitation can lead to soil instability and subsequent collapse.
This figure illustrates the distribution of the Normalized Difference Vegetation Index (NDVI) in the Guangxi Zhuang Autonomous Region, generated based on remote sensing data [10]. The NDVI values and their implications are as follows: values below 0.2 indicate water bodies or bare surfaces with a high risk of erosion; 0.2 to 0.4 correspond to sparse vegetation with low stability; 0.4 to 0.6 represent moderate vegetation density with a reduced erosion risk; 0.6 to 0.8 denote dense vegetation with a low collapse risk; and values above 0.8 signify extremely dense vegetation, capable of significantly stabilizing soil under varying rainfall conditions.
(5) Soil Moisture: Soil moisture directly affects the mechanical properties of soil and is a key factor in collapse risk assessment [44]. Higher soil moisture is typically associated with an increased risk of collapse, particularly in regions with substantial precipitation. As illustrated in Figure 11, in these areas, increased soil saturation significantly reduces stability, heightening the risk of landslides or collapses. Soil moisture also interacts with factors such as lithology and slope gradient [45]. In soft rock regions with elevated soil moisture, the soil’s resistance to sliding diminishes, making collapses more likely.
This figure illustrates the distribution of the Topographic Wetness Index (TWI) in the Guangxi Zhuang Autonomous Region, generated based on digital elevation model (DEM) data and hydrological analysis [7]. The TWI values and their implications are as follows: values below 8 indicate strong runoff zones, located on steep slopes and ridges, with high soil stability and low collapse risk due to limited water accumulation; values from 8 to 12 represent transitional zones, situated on gentle slopes and terraces, with moderate stability and intermediate risk; values from 12 to 16 denote shallow soil water saturation zones, found in valley bottoms and gullies, with reduced stability and increased collapse risk due to significant water accumulation; and values above 16 signify surface water convergence zones, located in river channels and wetlands, with high soil moisture, markedly reduced stability, and substantially elevated collapse risk.
(6) Distance from Road: The presence and construction of roads can increase collapse risk by disturbing soil structure and altering surface water flow paths [46]. As shown in Figure 12, areas near roads typically exhibit higher collapse risk. This is particularly evident around mountain roads, where natural factors such as slope gradient and precipitation may be exacerbated by road construction, resulting in elevated risk. Anthropogenic activities during road construction, such as quarrying and excavation, may damage soil structure and consequently trigger collapses [47]. Therefore, the interaction between the presence of roads and other environmental factors is a critical consideration in assessing collapse risk.
This figure illustrates the classified road network in the Guangxi Zhuang Autonomous Region, showing the impact of different road types on regional stability [10]. The road types include busways, motorways, primary roads, residential roads, secondary roads, tertiary roads, tracks, grade 1 tracks, grade 2 tracks, and trunks. Primary roads and motorways typically pass through steep terrains, leading to higher collapse risks, while secondary roads and tracks present lower risks. The road network is negatively correlated with the Normalized Difference Vegetation Index (NDVI); areas near primary roads have lower NDVI values, indicating poor soil stability, whereas areas farther from roads have higher NDVI values, reflecting better soil stability. Additionally, the road network is positively correlated with rainfall, with areas of higher road density experiencing increased rainfall, further exacerbating the collapse risk.
In summary, factors such as slope gradient, lithology, precipitation, vegetation coverage, soil moisture, and road proximity play critical roles in the risk assessment of road collapse disasters. These factors interact with one another, forming complex synergistic effects. The combined influence of slope gradient, lithology, and precipitation significantly increases collapse risk in specific areas, while vegetation coverage helps mitigate risk in certain regions. By comprehensively considering the synergistic effects of these factors, the model proposed in this study can more accurately assess collapse risk, providing a scientific basis for disaster prevention and mitigation.

4.2. Weighting Analysis of Impact Factors

In this study, the relative importance of each influencing factor in the prediction of collapse disaster risk was analyzed using weighting through the convolutional neural network model. Figure 13 demonstrates the weight distribution of each factor in the evaluation of collapse disaster risk, showing the degree of contribution of the different factors to the collapse risk.
As can be seen from the figure, the slope has the largest weight, indicating that the slope has the most significant effect on the risk of collapse. Soils in high-slope areas are less stable and prone to sliding and collapse, so the weight of the slope factor was ranked first among all factors. The lithology factor followed closely, with a high weight, indicating that the physical properties of rocks (e.g., hardness, weathering resistance) directly affect the stability of the soil body, and the risk of collapse is higher, especially in areas with soft rocks or fissure development. In addition, the weight of vegetation cover was equally high, indicating that vegetation plays an important role in reducing the risk of collapse. In particular, in areas with better vegetation cover, the stability of the soil body is enhanced. The weight of the precipitation factor was also higher; in areas with high precipitation, the soil body is affected by water saturation and is easily destabilized, thus increasing the risk of collapse. The graphs also show that some other factors, such as the aspect, curvature, population size, soil moisture, and distance from roads, have relatively low weights, but they play an auxiliary role in predicting the results of collapse hazards by combining to influence the stability of geological conditions.

5. Conclusions

In this study, the risk evaluation of roadway collapse disaster susceptibility in the Guangxi Zhuang Autonomous Region is conducted using the ResNet18 model, a convolutional neural network (CNN). By collecting and processing multi-source data, a collapse risk zoning map of the region is generated, integrating various natural and anthropogenic factors, including slope, lithology, precipitation, and vegetation cover. The findings demonstrate that high-risk areas are predominantly located in regions characterized by steep slopes, loose lithology, and high precipitation. The model’s predictions exhibit a high degree of rationality and accuracy, providing a scientific basis for the prevention and management of roadway disasters in Guangxi.
The innovation of this study lies in applying the CNN model to assess collapse disaster susceptibility, overcoming the limitations of traditional statistical approaches, and enhancing the precision of multi-factor interaction analysis. Additionally, the integration of multi-source data enables a more comprehensive evaluation of the combined effects of natural and anthropogenic factors, resulting in a more targeted risk assessment framework. Nevertheless, the study has certain limitations, such as the low spatial resolution of some factors and the model’s limited generalization ability, which may impact prediction accuracy across diverse geographic environments.
Future research will focus on enhancing data accuracy and model adaptability by incorporating higher-resolution data and advanced deep learning techniques to optimize model performance. Furthermore, the study will explore trends in collapse hazards by integrating dynamic factors such as climate change and aim to combine deep learning with other geohazard assessment methods. These efforts seek to provide more robust technical support for disaster prevention and mitigation in Guangxi and regions with similar geomorphic characteristics.

Author Contributions

Conceptualization, Y.L.; data curation, C.L., Z.L., Y.H., Z.D. and C.H.; methodology, C.L., Z.L., Y.H., Y.L. and Z.D.; project administration, Y.L.; supervision, C.L. and Y.L.; writing-original draft, C.L., Z.L. and C.H.; writing-review and editing, C.L. and Y.L. All authors have read and agreed to the published version of the manuscript.

Funding

This research was funded by the Major Project of High Resolution Earth Observation System of China (No. GFZX0404130304); the Zibo City Social Science Planning Research Project of China (No. 2023ZBSK041); and the Shandong Province Culture and Tourism Research Project of China (No. 23WL(Y)53).

Institutional Review Board Statement

Not applicable.

Informed Consent Statement

Not applicable.

Data Availability Statement

The raw data supporting the conclusions of this article will be made available by the authors on request.

Conflicts of Interest

Authors Cheng Li and Yulong Hu were employed by the company Guojiao Spatial Information Technology (Beijing) Co., Ltd. The remaining authors declare that the research was conducted in the absence of any commercial or financial relationships that could be construed as a potential conflict of interest.

References

  1. Wilson, B.; Allstadt, K.E.; Thompson, E.M. A near-real-time model for estimating probability of road obstruction due to earthquake-triggered landslides. Earthq. Spectra 2021, 37, 2400–2418. [Google Scholar] [CrossRef]
  2. Batur, A. Invisible danger: The secondary effects of disasters. Am. J. Emerg. Med. 2025, 89, 267. [Google Scholar] [CrossRef] [PubMed]
  3. Chen, L.; Wang, W.; Zhang, W. Risk Evaluation of Regional Collapses Geological Hazard Based on D-S Evidence Theory-A case study of Haiyuan active fault belt in Ningxia Province. Energy Procedia 2012, 16, 371–376. [Google Scholar] [CrossRef]
  4. Zhao, Y.; Ni, H.; Wu, J.; Sun, Q.; Zhang, T.; Liu, M. Evaluation of geological disaster susceptibility based on the AHP-CF model--taking Shiyang Township of Taishun County as an example. East China Geol. 2021, 42, 66–75. [Google Scholar]
  5. Santi, P.M.; Russell, C.P.; Higgins, J.D.; Spriet, J.I. Modification and statistical analysis of the Colorado Rockfall Hazard Rating System. Eng. Geol. 2008, 104, 55–65. [Google Scholar] [CrossRef]
  6. Agliardi, F.; Crosta, G.B.; Frattini, P. Integrating rockfall risk assessment and countermeasure design by 3D modelling techniques. Nat. Hazards Earth Syst. Sci. 2009, 9, 1059–1073. [Google Scholar] [CrossRef]
  7. Qi, W.; Chen, Y.; Cheng, X.; Wang, Q.; Wei, Y. Landslide susceptibility mapping based on GIS modle on Shicheng Jiangxi province, china. IOP Conf. Ser. Earth Environ. Sci. 2017, 57, 012024. [Google Scholar] [CrossRef]
  8. Wang, H. Research on Several High-Dimensional Data Testing Problems. Ph.D. Thesis, Northeast Normal University, Changchun, China, 2024. [Google Scholar] [CrossRef]
  9. Feng, O.; Zeng, H.; Deng, H.; Tu, P.F. Step-type landslide displacement prediction model based on creep-slip trend influence and feature optimisation algorithm. J. Rock Mech. Eng. 2024, 1–16. Available online: http://kns.cnki.net/kcms/detail/42.1397.O3.20241224.1124.004.html (accessed on 15 October 2024).
  10. Xie, Q.; Jiang, Q.; Wang, Y.; He, W. Discussion on sampling method for quality check and acceptance of geographic national condition monitoring results—Taking Guangxi as an example. South. Nat. Resour. 2023, 1, 49–51, 56. [Google Scholar]
  11. Tang, J.; Qin, Y.; Huang, K.; Zhuo, Y.; Hu, J.; Qi, H.; Meng, W.; Liu, L.; Chen, M. Characteristics of cold wave climate change and analysis of atmospheric circulation anomalies in Guangxi from 1961 to 2022. Clim. Environ. Res. 2024, 29, 563–574. [Google Scholar]
  12. Huang, X.; Xie, M.; Liao, X.; Xu, S.; Zhao, J.; Pang, F. Analysis of causes and hazards of ecological meteorological disasters in Guangxi. Meteorol. Res. Appl. 2019, 40, 60–62. [Google Scholar] [CrossRef]
  13. Zhou, C.; Chen, M.; Chen, J.; Chen, Y.; Chen, W. A Multi-Hazard Risk Assessment Model for a Road Network Based on Neural Networks and Fuzzy Comprehensive Evaluation. Sustainability 2024, 16, 2429. [Google Scholar] [CrossRef]
  14. Yu, B.; Xing, H.; Yan, J.; Li, Y. Small-scale, large impact: Utilizing machine learning to assess susceptibility to urban geological disasters—A case study of urban road collapses in Hangzhou. Bull. Eng. Geol. Environ. 2024, 83, 454. [Google Scholar] [CrossRef]
  15. Qi, Y.M.; Cai, J.Y.; Qi, X.L. Inferring skin lesion segmentation with fully connected CRFs based on multiple deep convolutional neural networks. IEEE Access 2020, 8, 144246–144258. [Google Scholar] [CrossRef]
  16. Yang, P.; Li, W.; Wen, C.; Liu, P. Fault diagnosis method of multi-rotor UAV based on one-dimensional convolutional neural network with adaptive batch normalization algorithm. Meas. Sci. Technol. 2023, 35, 025102. [Google Scholar] [CrossRef]
  17. Protas, É.; Bratti, J.D.; Gaya, J.F.O.; Drews, P.; Botelho, S.S.C. Networks—Neural Networks and Learning Systems; Reports from Federal University Describe Recent Advances in Neural Networks and Learning Systems (Visualization Methods for Image Transformation Convolutional Neural Networks). Comput. Netw. Commun. 2019, 30, 2231–2243. [Google Scholar] [CrossRef]
  18. Wang, S. Application of Deep Convolutional Neural Networks in Image Recognition and Classification in Library Management. Wirel. Pers. Commun. 2023, 1–18. [Google Scholar] [CrossRef]
  19. Ding, Y.; Li, P.; Liu, J.; Luo, D.; Li, X.; Li, Z. Training and Operation of Multi-layer Convolutional Neural Network Using Electronic Synapses. In Proceedings of the 2nd International Conference on Artificial Intelligence and Computer Science (AICS 2020), Hangzhou, China, 25–26 July 2020. [Google Scholar]
  20. Zhu, H.; Wu, L.; Yang, X.; Xu, L.; Zhang, Y.; Chen, S.Y. Target parameter prediction based on residual network. Radio Commun. Technol. 2024, 1–11. Available online: http://kns.cnki.net/kcms/detail/13.1099.tn.20241210.1733.016.html (accessed on 11 December 2024).
  21. Ye, Y.G. Research on image recognition technology based on deep residual network. J. Shaoguan Coll. 2020, 41, 18–22. [Google Scholar]
  22. Ioffe, S.; Szegedy, C. Batch Normalization: Accelerating Deep Network Training by Reducing Internal Covariate Shift. arXiv 2015, arXiv:1502.03167. [Google Scholar]
  23. Ning, X.; Ding, T.; Zhu, H. Research on Arc Fault Detection Based on Conditional Batch Normalization Convolutional Neural Network with Cost-Sensitive Multi-Feature Extraction. Sensors 2024, 24, 7628. [Google Scholar] [CrossRef] [PubMed]
  24. Sirotkin, K.; Escudero-Viñolo, M.; Carballeira, P.; García-Martín, Á. Improved transferability of self-supervised learning models through batch normalization finetuning. Appl. Intell. 2024, 54, 11281–11294. [Google Scholar] [CrossRef]
  25. Duc, H. Data Augmentation with Python: Enhance Deep Learning Accuracy with Data Augmentation Methods for Image, Text, Audio, and Tabular Data; Packt Publishing Limited: Birmingham, UK, 2023; pp. 1–536. [Google Scholar]
  26. Aldabbas, H.; Asad, M.; Ryalat, M.H.; Malik, K.R.; Qureshi, M.Z.A. Data Augmentation to Stabilize Image Caption Generation Models in Deep Learning. Int. J. Adv. Comput. Sci. Appl. (IJACSA) 2019, 10, 571–579. [Google Scholar] [CrossRef]
  27. Meena, S.R.; Puliero, S.; Bhuyan, K.; Floris, M.; Catani, F. Assessing the importance of conditioning factor selection in landslide susceptibility for the province of Belluno (region of Veneto, northeastern Italy). Nat. Hazards Earth Syst. Sci. 2022, 22, 1395–1417. [Google Scholar] [CrossRef]
  28. Yang, X.; Zhang, G.; Yu, Y.; Yu, Q.; Lei, M.; Ding, B. Factors Influencing the Coefficient of Restitution in Rockfall Impacts. Nat. Hazards Rev. 2021, 22, 04021024. [Google Scholar] [CrossRef]
  29. Huang, S.; Lyu, Y.; Peng, Y.; Huang, M. Analysis of Factors Influencing Rockfall Runout Distance and Prediction Model Based on an Improved KNN Algorithm. IEEE Access 2019, 7, 66739–66752. [Google Scholar] [CrossRef]
  30. Zhang, L.; Guo, Z.; Qi, S.; Zhao, T.; Wu, B.; Li, P. Landslide susceptibility evaluation and determination of critical influencing factors in eastern Sichuan mountainous area, China. Ecol. Indic. 2024, 169, 112911. [Google Scholar] [CrossRef]
  31. Bathrellos, G.D.; Koukouvelas, I.K.; Skilodimou, H.D.; Nikolakopoulos, K.G.; Vgenopoulos, A.-L. Landslide causative factors evaluation using GIS in the tectonically active Glafkos River area, northwestern Peloponnese, Greece. Geomorphology 2024, 461, 109285. [Google Scholar] [CrossRef]
  32. Dai, F.; Lee, C.; Ngai, Y. Landslide risk assessment and management: An overview. Eng. Geol. 2002, 64, 65–87. [Google Scholar] [CrossRef]
  33. Shano, L.; Raghuvanshi, T.K.; Meten, M. Landslide susceptibility evaluation and hazard zonation techniques—A review. Geoenvironmental Disasters 2020, 7, 18. [Google Scholar] [CrossRef]
  34. Kohn, M.A.; Newman, T.B. The Walking Man Approach to Interpreting the ROC curve and area under the ROC Curve. J. Clin. Epidemiol. 2023, 162, 182–186. [Google Scholar] [CrossRef]
  35. Ke, C.; He, S.; Qin, Y. Comparison of natural breaks method and frequency ratio dividing attribute intervals for landslide susceptibility mapping. Bull. Eng. Geol. Environ. 2023, 82, 384. [Google Scholar] [CrossRef]
  36. Mohammad, A.; Masoud, B.H.; Reza, D. A novel empirical classification method for weak rock slope stability analysis. Sci. Rep. 2022, 12, 14744. [Google Scholar]
  37. Uma, K.V. Improving the Classification accuracy of Noisy Dataset by Effective Data Preprocessing. Int. J. Comput. Appl. 2018, 180, 37–46. [Google Scholar]
  38. Jin, J.; Wang, Y.; Yuan, R.; Yang, X. Sensitivity analysis of earthquake landslide impact factors in Longmenshan area based on the deterministic coefficient method–taking Wenchuan earthquake and Lushan earthquake induced landslides as an example. Quat. Res. 2018, 38, 355–366. [Google Scholar]
  39. Hu, J.; Zhang, Z.; Li, Q.; Wu, Y. Analysis of deformation and damage mechanism of wedge-shaped rocky landslides in southwestern Yunnan and research on their management. Highway 2022, 67, 85–89. [Google Scholar]
  40. Lin, C.; Wang, J.; Liang, F.; Ji, J.; Tan, S.; Liu, Y. Research on predicting the change of landslide disaster risk in Hebei province based on CMIP6 model precipitation. China Rural Water Conserv. Hydropower 2025, 1, 201–208. Available online: http://kns.cnki.net/kcms/detail/42.1419.TV.20240913.1249.024.html (accessed on 16 January 2025).
  41. Airola, A.; Pahikkala, T.; Waegeman, W.; De Baets, B.; Salakoski, T. An experimental comparison of cross-validation tech-niques for estimating the area under the ROC curve. Comput. Stat. Data Anal. 2011, 55, 1828–1844. [Google Scholar] [CrossRef]
  42. Wu, W.; Guo, S.; Shao, Z. Landslide risk evaluation and its causative factors in typical mountain environment of China: A case study of Yunfu City. Ecol. Indic. 2023, 154, 110821. [Google Scholar] [CrossRef]
  43. Ji, H.; Xu, G.; Zhang, L.; Ma, W.; Wen, Y.; He, J.; Liu, X. The effect of ecological blankets on soil moisture and nutrients in earthquake-induced landslide areas. Sichuan For. Sci. Technol. 2014, 35, 47–50. [Google Scholar] [CrossRef]
  44. Yin, Y.; Wu, Y. Effects of Vegetation Cover on Slope Stability and Landslide Risk. Geotech. Test. J. 2018, 41, 985–997. [Google Scholar]
  45. Wu, C.; Zhao, D.; Liu, C.; Jiao, Y.; Feng, Z.; Liu, J. GIS-based analysis of landslide disaster impact factors and evaluation of susceptibility in Huaning County. Res. Soil Water Conserv. 2019, 26, 212–218, 225. [Google Scholar] [CrossRef]
  46. Zhang, Z.; Qi, Q.; Cheng, Y.; Cui, D.; Yang, J. An Integrated Model for Risk Assessment of Urban Road Collapse Based on China Accident Data. Sustainability 2024, 16, 2055. [Google Scholar] [CrossRef]
  47. Amol, S.; Chander, P. Impact Assessment of Road Construction on Landslide Susceptibility in Mountainous Region using GIS-Based Statistical Modelling. J. Geol. Soc. India 2023, 99, 1131–1140. [Google Scholar]
Figure 1. Elevation distribution map of China and the Guangxi Zhuang Autonomous Region.
Applsci 15 03108 g001
Figure 2. Technology roadmap of the collapse disaster susceptibility risk assessment model. This figure is an original illustration created by the authors of this study and is protected by copyright © 2025.
Applsci 15 03108 g002
Figure 3. The partitioned collapse map.
Applsci 15 03108 g003
Figure 4. Loss curve of the ResNet18 model during training for collapse hazard risk assessment using multi-source remote sensing data.
Applsci 15 03108 g004
Figure 5. Accuracy curve of ResNet18 model for road collapse hazard risk assessment based on multi-source remote sensing data during training.
Applsci 15 03108 g005
Figure 6. ROC curve diagram.
Applsci 15 03108 g006
Figure 7. Slope map of the Guangxi Zhuang Autonomous Region.
Applsci 15 03108 g007
Figure 8. Lithology of the Guangxi Zhuang Autonomous Region.
Applsci 15 03108 g008
Figure 9. Average annual precipitation in the Guangxi Zhuang Autonomous Region.
Applsci 15 03108 g009
Figure 10. NDVI map of the Guangxi Zhuang Autonomous Region.
Applsci 15 03108 g010
Figure 11. Soil moisture index map of the Guangxi Zhuang Autonomous Region.
Applsci 15 03108 g011
Figure 12. Roads in the network-classified map of the Guangxi Zhuang Autonomous Region.
Applsci 15 03108 g012
Figure 13. Distribution of the weights of factors in the risk evaluation of collapse hazards.
Applsci 15 03108 g013
Table 1. Data fact sheet.
Data TypeData DescriptionData SourcesWebsite
Topographic DataDEM data of Guangxi Zhuang Autonomous RegionGeospatial Data Cloudhttp://www.gscloud.cn/ (accessed on 20 December 2024)
Vegetation CoverageNational 1000 m resolution vegetation coverage dataInstitute of Geographic Sciences and Natural Resources Research, Chinese Academy of Scienceshttp://www.resdc.cn/ (accessed on 20 December 2024)
Road DataHighway distribution data of Guangxi and surrounding areasNational Geographic Information Resource Directory Service Systemhttps://www.webmap.cn/ (accessed on 20 December 2024)
Population DataPopulation distribution data of Guangxi Zhuang Autonomous RegionLandScan Population Datasethttps://landscan.ornl.gov/ (accessed on 20 December 2024)
Precipitation DataMonthly average precipitation data of Guangxi (2019–2023)National Tibetan Plateau Data Centerhttps://data.tpdc.ac.cn/ (accessed on 20 December 2024)
Lithology DataLithological distribution data of Guangxi Zhuang Autonomous RegionNational Geographic Information Resource Directory Service Systemhttps://www.webmap.cn/ (accessed on 20 December 2024)
Geological Hazard Distribution DataVector data of geological hazard points in GuangxiInstitute of Geographic Sciences and Natural Resources Research, Chinese Academy of Scienceshttp://www.resdc.cn/ (accessed on 20 December 2024)
Table 2. Statistics on the area and density of hazard sites for each risk level.
Risk LevelArea (km2)Proportion of Guangxi’s Total Area (%)Number of Collapse Hazard PointsHazard Point Density (Points/100 km2)
High-Risk Area49,21920.442668.7
Relatively High-Risk Area56,54423.419093.4
Medium-Risk Area44,32518.38071.8
Relatively Low-Risk Area29,66512.33241.1
Low-Risk Area61,75125.61800.3
Disclaimer/Publisher’s Note: The statements, opinions and data contained in all publications are solely those of the individual author(s) and contributor(s) and not of MDPI and/or the editor(s). MDPI and/or the editor(s) disclaim responsibility for any injury to people or property resulting from any ideas, methods, instructions or products referred to in the content.

