Abstract
Modern product manufacturing is not only becoming more advanced but also requires increasingly precise and technologically advanced solutions, especially in the production process. One example is the automotive industry, where customization is becoming a key requirement. This work aimed to analyze the factors determining the efficiency of production processes, using the example of a selected company from the automotive industry—the production of spare parts—and to assess the impact of the applied optimization tools and techniques on improving operational results. This work combines theoretical and practical aspects, presenting a detailed analysis of data and actions taken in a real production environment. As part of the research, a thorough research program was presented, including the analysis of production data before and after conducting optimization workshops. Before the workshop, key problems were identified, such as the time-consuming rearranging of machines. The analysis using the parametric Student’s t test for two subsidiaries showed the rightness of the optimization activities. During the workshop, several changes were implemented, including the use of a new Destacker, modification of conversation procedures and training operators. The data collected after the workshop indicated a significant reduction in the times of reliance, which confirmed the effectiveness of the activities used. The analysis used tools such as the Pareto diagram and the ABC method, which allowed the identification of priority areas to improve. This work proves that the use of appropriate management tools and employee involvement in the optimization process can significantly improve the efficiency of production processes. Key success factors included the elimination of losses resulting from inefficient procedures, improvement of work organization and implementation of technological solutions. The results of this analysis form the basis for further research on improving production processes in the automotive industry.
1. Introduction
Dynamic technological development and growing market requirements force manufacturing companies to continuously improve their processes and strive to optimize their efficiency. One of the most commendable examples of dynamic process transformation is the automotive sector. The efficiency of production processes is one of the key factors determining a company’s competitiveness and ability to survive in a variable market environment. Entities from this market sector face the challenge of identifying factors affecting the efficiency and implementation of modern solutions that support development [1]. It is increasingly being driven by robots and the specifics of products, especially on assembly lines. It should be noted that the production process of construction components for vehicles is highly labor-intensive, as well as susceptible to errors.
A modern car is the result of cooperation between many manufacturing companies specializing in different technologies. As many as 80% of car components are manufactured by independent parts manufacturers, and the remaining 20% by companies producing vehicles. Therefore, the production cycle of a car alone can include over 850 processes [2]. In practice, there are highly different, if not contradictory, conditions among the individual assembly stages, which serve to optimize the production sequence. It may be surprising that in car production the number of required parameters usually ranges from 100 to 120. This number also includes mutually exclusive conditions, such as that a given engine cannot be combined with a given gearbox. Therefore, a definite advantage of manual work on assembly lines is the possibility of using human reasoning and ensuring flexibility in adapting to the fluctuations in production, product range and short product life cycles. This is a particularly important aspect for the automotive industry because the growing complexity of the structure of modern vehicles is caused by the use of an increasing number of spare parts.
The trend of product customization is considered to be the driving force of the modern automotive industry [3]. For many years, automotive companies have been using process solutions that allow customers to maximally delay the moment of making a final decision regarding, for example, equipment or personalization of individual parts. These factors mean that the process of producing spare parts in an effective and low-investment way cannot be fully automated.
Automotive companies require continuous development and the demonstration of huge adaptability to market requirements. The level of competition in this sector has created a need to increase efficiency and quality to meet customer requirements. Despite the possibilities offered by the automation of production and logistics systems, many companies, especially the automotive industry, still use manual labor because of their flexibility and cognitive and motor skills, which machines are unable to perform. Therefore, due to the multidimensionality and specificity of production technologies, a person should be able to effectively find themself in the surrounding production reality. The worker’s appropriate role affects the efficiency of production processes. The implementation of automation and the effective role of the employee in the implementation of production tasks can only be effective when there is a strong synergy between human and machine. Therefore, the tools proposed by the author’s quality effort and their research in a real production environment allow for the enrichment of the substantive value of the research. Analysis of quality tools allows for effectively determining the factors affecting the efficiency of production processes and allows for possible optimization to increase the quality of the goods provided and therefore increase competitiveness [4,5].
The research presented in this article aimed to determine and indicate the relationships among factors influencing the efficiency of production processes in a manufacturing enterprise from the automotive industry with a low level of automation. As part of the research, an analysis of the efficiency of production processes was carried out based on selected methods, a broader description of what was included in the individual subchapters of this work. The research process itself was based on taking into account the business profile of the analyzed company. The next stage was to collect data on key production indicators before the optimization workshop, such as the time of removing selected products, the number of strokes of Machine X and the availability of working time. Improvements were implemented for the analyzed research workshop based on the results of the tests. The assessment of the effectiveness of the introduced changes and their impact on the efficiency of production processes was determined based on statistical analysis.
The structure of this article is as follows. Section 2 reviews the world and national literature on the use of Industry to Industry 4.0 in the optimization of production processes. Section 3 describes the research methodology used to assess the effectiveness of production processes. Section 4 describes and discusses the results. Section 5 presents the conclusions and prospects of future research.
2. Literature Review of the Problem
Undoubtedly, quality is a key factor affecting the success of every organization. Regardless of whether the company is a production, service or even a non-profit organization, effective quality management benefits and is an integral part of achieving customer satisfaction, improvement of processes and increasing competitiveness. From the birth of the concept of quality control in production to developing international standards, quality management systems have transformed into an integral part of organization management. In the face of increasing competition and growing customer expectations, quality management systems remain a key tool in ensuring the quality of products and services and achieving business success. The implementation of effective quality management brings many benefits to the company, including:
- increasing customer loyalty: high-quality products and services attract customers, encouraging them to return,
- improving reputation: positive customer reviews and good quality results translate into a positive reputation for the company,
- optimization of processes: quality management systems are a tool for identifying a specific problem or areas that require improvement, which can lead to more effective and efficient processes,
- reduction of costs: improving quality means fewer disadvantages and fewer complaints, which can lead to a reduction in production costs,
- competitiveness: companies that consistently provide high-quality products have a competitive advantage in the market.
Quality management in the production process is a key aspect of achieving success in today’s competitive business environment. Companies must use various quality methods and tools to ensure quality consistency and continuous improvement. It is worth investing in the basics of quality management, such as ISO 9001, using statistical quality control methods, implementing the concept of Kaizen, practicing lean manufacturing and developing the Total Quality Management approach to ensure comprehensiveness in terms of company quality [6]. Thanks to this, with the development of quality management, companies can not only meet customer expectations but also gain a competitive advantage in the market and improve the management of the entire enterprise. The implementation of these methods requires systematics, commitment and trust of all employees and the constant pursuit of perfection in every aspect of production.
In manufacturing companies, the production process is defined as the one that is key and generates the highest costs. One of the indicators used to evaluate the production process is actual/theoretical efficiency. The main factors that affect this state are the problems encountered during the organization and management of the production process itself. To improve efficiency, all problems and constraints must be identified [7]. The next step is the analysis of collected problems in terms of weight and quantity (Pareto) [8]. After choosing the biggest problem, you should think about its solution by its detailed analysis [9]. After determining the appropriate actions and eliminating other key problems, the actual performance should significantly get closer to the theoretical performance [10,11,12,13] Another way to increase the efficiency of processes and improve the functioning of production is organizational changes that can lead to increased efficiency. After a thorough analysis of each of the activities in a given process, we can determine which of them are unnecessary [14]. Thanks to their accurate analysis and Kaizen activities, we can improve their efficiency, which will translate into our profits [15,16].
The problem with a reliable and unambiguous assessment of production efficiency results from a lack of comprehensive indicators enabling its determination. The performance is analyzed both at the level of the workstation, individual operation, as well as the entire production process. Therefore, it should be stated that the production efficiency of resources is defined as the maximum amount of products that can be produced at a specified time [17]. It determines the potential of the company’s resources (e.g., the production capacity of machines and equipment), which can be used at the same time. Most authors in the literature on the subject [18,19,20] relate to the concept of production efficiency only to analyze the potential possibilities of human work, while performance is a feature of all objects involved in the production process [21]. Due to the level of detail of production efficiency analysis, planning performance and effective efficiency are distinguished [22]. A detailed production efficiency analysis requires such a distinction, as it is the basis for its assessment at various analytical levels in the company [23]. Planned performance usually assumes ideal conditions that do not consider any production interference [24]. Planned performance does not consider the unproductive time related to intentionally planned downtime [25]. To calculate the planned performance of the entire production process, you must first determine the performance of individual operations. Because a given production operation is most often performed at several workstations, its performance is determined as the sum of the performance of individual positions.
For example, in work [26]. Discusses aspects related to the effectiveness of production processes. Management concepts focused on increasing efficiency, such as Lean Manufacturing, TOC, TQM, Six Sigma, TPM and Kaizen philosophy were analyzed. Each of these concepts offers a set of tools and methods that allow to optimize manufacturing processes. Finally, specific organizational methods and techniques were discussed, such as Ishikawa charts, ABC analysis (Pareto-Lorenza method), smart method, technique 5 Why, Kanban cards and Gantt charts [27]. These tools allow systematic diagnosis and problem solving, which supports continuous improvement of production processes. In many publications related to the subject of quality management, you can find the approach that tools and techniques used to manage quality are extremely important in the support of development and improvement of the quality of final products that go to buyers [28]. The spectrum of methods and tools of assessment. The quality that is mentioned in the literature on the subject is wide [29]. Various quality management methods and tools can be used to monitor the entire production cycle from the design stage, through manufacturing to the control of the finished product. All tools and methods are characterized by planned, repetitive and scientific basis for the way they are used during their use [30].
The literature emphasizes that production efficiency is the key to maintaining competitiveness and profitability [31]. One way to improve efficiency is to support the decision to optimize data. The Industry 4.0 concept introduced a revolution in the approach to collecting and using data in production companies in the automotive sector. Thanks to this, the process of preparing, sending and archiving information has become much simpler and more available [32]. The main challenge that organizations face today is how to effectively find themselves in this thicket of information, to conduct effective Data management and to extract critical information from an endless data stream. Excess chaotic information can lead to the same as the same as they are completely lacking—the inability to make decisions efficiently [33,34,35]. Only effective response will improve production processes and increase the efficiency of devices to previously unattainable levels. To achieve this, the data themselves are not enough. As one of the researchers emphasizes, what is needed is essence—important, key information, maintained in a specific context and data extracted from the silos. This information must be available to conduct data analytics, which is a well-known concept of the so-called Big Data [36,37,38]. Along with it, there is also the possibility of visibility of real-time data.
Thanks to the visibility of data, production companies can track their production activities in real time. They can monitor production lines, inventory levels and other key performance indicators (KPIs), such as the total equipment efficiency (OEE) to identify problems as they appear and improve your actions [39]. This allows you to immediately undertake repair actions, minimizing unplanned downtime and limiting losses.
By analyzing data from all devices and combining this information in one place, as another researcher points out the possibility of easy identification, from machines or production lines requires quick intervention and more detailed analysis [40]. Thanks to this, you can react quickly to avoid unplanned downtime [41]. The data placed in the appropriate pads allow us to assess whether potential changes and innovations (aimed at eliminating problems and improving production efficiency) meet their assumptions. In addition, thanks to the continuous measurement of efficiency, it can be quickly assessed whether the correct direction of changes has been chosen whether the pace of these changes is acceptable and, most importantly, whether the costs incurred at these innovations will pay back at the time designated during the time [42].
The production line with the lowest OEE indicator is not always the factor that inhibits the performance of production processes. Looking at the problem more broadly, having not only production data at your disposal but also orders and implementation times—you can assess where there are real gaps in the production capabilities of machines. The OEE indicator is a great tool to determine where you should potentially invest time and money [43]. Thanks to access to data, manufacturers can track reserve levels and use patterns. This allows you to optimize inventory, ensuring that they have enough materials and supplies on hand—but without excessive stocks. By reducing excessive stocks, manufacturers can release space and capital, obtaining better financial results. Real-time visibility allows manufacturers to monitor the quality of their products throughout the entire production process. They can track and analyze data from sensors and other sources to identify early potential quality problems [44]. This enables recovery actions before producing defective goods. This reduces the amount of waste and increases the satisfaction of end customers. In addition, it affects sustainable development by reducing the carbon trace and of course reduction of operating costs [45].
The analysis of scientific literature on the effectiveness of production processes indicates numerous studies on general concepts of optimization, such as Lean Manufacturing, Six Sigma or Total Productive Maintenance. These methods are widely used in the automotive industry, but theoretical research often focuses on general principles or large production systems, ignoring detailed analyses of local optimization activities, such as workshops conducted at the level of a specific process or workplace.
The research gap is focused on the lack of detailed analysis of the impact of optimization workshops as well as the implementation of technology and updating procedures on the effectiveness of production processes. The tests performed by analyzing empirical data before and after the workshop fill this gap, providing current information about the effectiveness of optimization activities in automotive enterprises. Constituting an important contribution, both practical and theoretical, to the research topic mentioned by the authors.
3. Materials and Methods
3.1. Research Program
In the automotive industry, production processes must be as efficient as possible to ensure a short cycle time for manufacturing and delivering a new product. The market situation also sets such requirements. Customers value the right to unrestricted choice and even customization of spare parts. Therefore, the research process itself was divided into several stages:
- Review of literature and identification of research gaps.
- Collecting data before the analyzed research workshop. Measurement and analysis of production indicators (reference length, machine availability, and machine productivity) before the implementation of remedial activities.
- Implementation of planned optimization activities, including analysis of work with the new Destacker and modification of conversation procedures.
- Measurement of production efficiency indicators after the changes.
- Statistical analysis. Comparison of data from before and after the workshop using a parametric Student’s t-test—for dependent rehearsals to assess the significance of the observed changes and interpretation of the results.
- Formulation of conclusions. Summary of the workshop effects, indicating its effectiveness and identification of factors having a key impact on production efficiency.
3.2. Models and Indicators of Operational Effectiveness Assessment
As indicated in the literature, efficiency measurement is of key importance for production management processes. Analysis of data from Formula (1) can be the basis for productivity analysis. One of the researchers emphasized that productivity is often treated as a relationship between the size of the “output” of the process and the “entrance”, which means that the concepts of effectiveness and productivity are related [46]:
where:
- E—efficiency,
- e—effects,
- n—outlays.
Based on Formula (1), there are several ways to improve efficiency, including:
- reduction of expenditure while maintaining existing effects,
- reduction of expenditure when increasing the effects,
- maintaining expenditure when increasing the effects,
- increasing expenditure to drastically increase the effects.
The OEE indicator is a tool to determine the degree of use of production resources and assess the effectiveness of work in production systems. It takes into account the following elements: performance, availability and quality.
OEE = (availability) × (efficiency) × (quality), %
The availability indicator presents the relationship between the planned working time of the machine and its actual time of operation in a certain period. This indicator is mainly affected by failures, delays caused by a lack of materials and unforeseen events that can extend the duration of the production process.
Availability = (real working time)/(planned working time), %
The performance indicator expresses the relationship between the planned time of making one product unit and the actual time needed to produce it. You can also describe performance as the ratio of the number of actually made products to the maximum possible number in a given period. The performance is influenced by, among others, errors made by operators and the need to carry out additional transport activities. These errors also affect the availability of machines, because their operation is directly dependent on the correct service by employees.
Efficiency = (real production time)/(planned production time), %
The quality indicator determines the proportion of products that meet standards to the total number of products produced in a given period. The quality of production is influenced by many factors, including human errors, such as improper use of machines.
Quality = (number of good elements)/(number of all elements), %
The level of the OEE indicator considered satisfactory is over 85%, but the key is continuous improvement of processes and elimination of the causes of losses. In practice, however, many companies achieve results around 60%.
The MTTR indicator (Mean Time to Repair) determines the average time needed to restore the system to efficiency after the failure. It may include the time needed to diagnose the fault, the waiting time for the service technician’s arrival and the time to repair the system itself. MTTR can be used to assess the efficiency of the movement maintenance team and the quality of their repairs [47]:
where:
- N—number of failures,
- Ti—failure time.
MTTF (Mean Time to Failure) is the average operation time of the device until the failure. It specifies the period from the start of use or the last repair until the next defect. Most often it is measured in hours.
where:
- TD—the time when the machine should work (time available),
- N—number of failures,
- Ti—failure time.
The MTBF (Mate Time Between Failure) indicator indicates how often a specific technical device fails, i.e., this is the average time between failures, which is calculated as the sum of the values of MTTR and MTTF. In practice, it is used to plan the frequency of preventive inspections.
The MTBF factor affects both reliability and system availability. Reliability means the ability of the system or component to properly act in certain conditions for a given time, i.e., the likelihood that the system will accomplish its task without failure. However, availability describes the system’s readiness to act when needed. This means that the system will be functional and capable of acting at the moment.
The MTBF coefficient is a key indicator of the system reliability, usually given in hours. A higher MTBF value means greater reliability of the device or product [48]:
Like MTBF, the MTTR factor is usually expressed in hours. It affects the availability of the system, but it has no direct impact on its reliability. The higher the MTTR value, the less effective and prone to emergencies the system becomes.
For the above equations to be true, a certain assumption should be taken when analyzing the MTBF coefficient. Unlike mechanical systems, most electronic systems do not contain movable components. For this reason, it is assumed that the failure coefficients in electronic systems are constant at all times.
3.3. Quality Control
This method of quality control consists of analyzing the visual characteristics of the product, when the representativeness of the results is not necessary, and the basis is the typical characteristics of the produced product. The main purpose of conducting a qualitative test is to perform a reliable description and obtain information of the highest quality to expand the state of knowledge about the studied products. Conducting qualitative research allows for the verification of current knowledge and the introduction of corrections in existing information states. Compared to quantitative methods, qualitative tests are not systematized in any way. Due to the lack of specific norms, the result of the research is not a statistical number, but current information that advising specialists, designers, and controllers can use to help in understanding the needs and requirements of customers. Due to the costs resulting from a qualitative analysis, it is used on a much smaller scale than the quantitative method.
Quality inspection involves actions aimed at checking, measuring or testing one or more product features and referring results to specialized requirements to confirm compliance. This task is usually performed by specialized staff and does not fall within the duties of production workers. Products incompatible with the specification are rejected or transmitted to improve. Control may have the following forms:
- passive, which concerns finished products and involves eliminating bad products,
- active, covering the overall process of implementation, and during its duration, error sources are identified,
- total, when all products are subject to quality control; it is expensive, but the surest method,
- partial (random) when a certain proportion of products are selected according to a specific algorithm, usually random.
This method often is called statistical quality control. The principle of statistical quality control is a variant of random control, the course of which is determined based on statistical data and probability accounts.
Statistical research is based on the data existing in the production plant recorded in files and reports. The proposed research method allows for determining the effectiveness of manufacturing workshops while giving the possibility of correcting the size of production orders. This allows for developing more accurate assumptions for rational warehouse management, a better selection of appropriate production components, and for developing the right program for their reconstruction. Based on theoretical premises, it was assumed that the rear arrangements and the number of machine strokes are subject to the laws of normal distribution. This assumption was based on the claim that the distribution of error strives for normal when the error is caused by the sum of similarly affecting mutually independent factors. In practical conditions, the production process can be interrupted by organizational factors resulting, among others, from the schedules of production orders. This means that in practice, the spread of masses, followed by reconstruction, is narrowed. Based on the results of research on the implementation of production orders and statistical calculations, the production capabilities of the analyzed manufacturing workshops were determined. When examining the normality of the distribution—according to the statistical principles, it was assumed that the number of machines is subject to the laws of a normal distribution. Taking into account these two hypotheses:
H0.
If a given distribution is normal, then the exchanges of workshop modifications are determined by physical phenomena prevailing during the production processes.
H1.
In addition, an alternative hypothesis was assumed that if the tested distribution is not normal, then the production workshops are not being used correctly.
As a result of the analysis, using the compliance test at the level of significance α = 0.05, it was found that in the workshop process, in 10% of cases, the test did not confirm the assumption about the normality of the distribution. This method consisted of finding which part of the normal distribution curve is represented by data included in the files and production reports. Workshops that were withdrawn from production due to technical faults were not included. The size of the collected data was different, depending on the number of registered results in the analyzed period of tests. According to the assumptions, these cases will be used to determine the degree of improper use of workshops and develop more accurate assumptions for the rational economy of their use.
The research facility is a company located in the Śląskie Voivodeship, producing components for the automotive industry. The first stage of research concerned the analysis of qualitative problems in the enterprise by using quality tools, i.e., the Ishikawa diagram and the Pareto–Lorenz diagram (too much downtime during work). The second stage of research concerned the organization of the production process of a single product to determine the types of waste.
4. Results and Discussion
4.1. Collecting Data Before the Workshop: Measurement and Analysis of Production Indicators
Before implementing optimization activities, the key stage was the collection and analysis of data on the functioning of the production process. The measurement of production indicators enabled the assessment of the initial state of process efficiency and the identification of areas requiring improvements. These data constituted a reference point for the assessment of the impact of implemented changes. Considering the specification of the production of the analyzed plant, in particular, the focus was placed on the analysis of three key indicators: reliability time, machine availability and the number of machine strokes in the time unit (productivity). During the analysis, before the implementation of the changes, data on the efficiency of the production process was collected, including rearranging times for products A and B on machine X and the productivity and availability of the machine time. The results have been combined and presented in tabular and graphic form. The measurement data presented in Figure 1 for medium-sized rearranging times over months indicate significant differences in work efficiency for the two analyzed products.
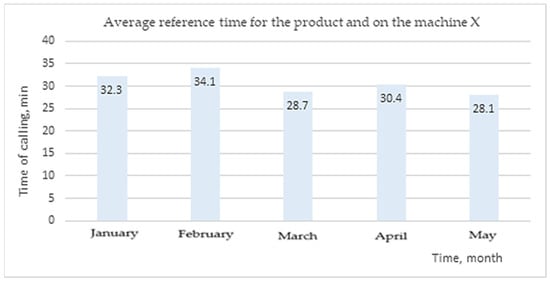
Figure 1.
Average rearranging time of machine X before conducting the workshop.
Analysis of the data contained in Figure 1 shows the average calling time for the product and machine X in the period from January to May, where the average rearranging time for product A was 30.72 min. In January and February, the conversion time was on average 35 min, which suggests that this process was less effective during this period than in other months. Such a result may be the result of the lack of optimization of conversation procedures and insufficient staff training in the scope of rapid performance of this operation. It is possible that in the following months, some improvements were introduced at the stage of preparation for the workshop, such as better resource planning and more accurate preparation of tools, which could contribute to improving the effectiveness of the process.
The average calling time for product B (Figure 2) is 35.12 min and it is more stable compared to product A, which may indicate a less complex process of reckoning in the case of product B. At the same time, the indicator showing the number of strokes in a minute of machine X was analyzed. The results of this analysis are shown schematically in Figure 3.
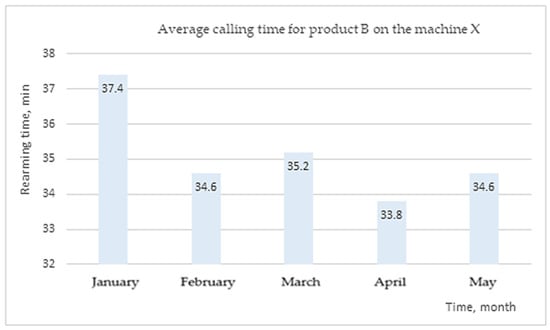
Figure 2.
Average rearranging time of machine X for product B before conducting the workshop.
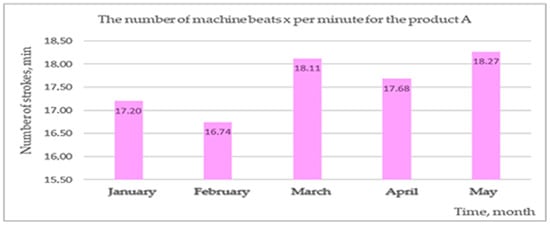
Figure 3.
Number of machine X beats per minute for the product before conducting the workshop.
Fluctuations in the number of strokes of machine X for product A before the workshop reflect the instability of the production process. The lack of uniform results and declines in February and April indicate the need to improve the procedures of conversion, reduce the amount of downtime and better machine management.
The data presented in Figure 4 suggest that the production process of product B is less exposed to fluctuations, but still requires improvements, especially in the context of increasing maximum efficiency and the elimination of minor interference. Figure 5 and Table 1 show the machine’s working time before the workshop. Presenting these detailed data allows for determining the challenges related to the effectiveness of production processes and potential areas for optimization.
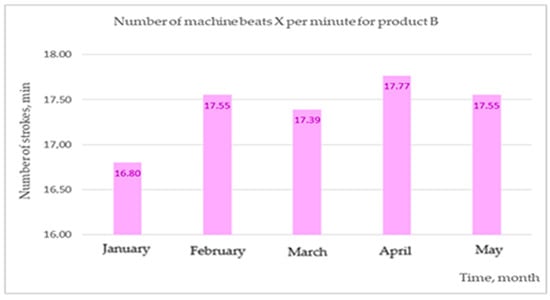
Figure 4.
Number of machine X beats per minute for product B before conducting the workshop.
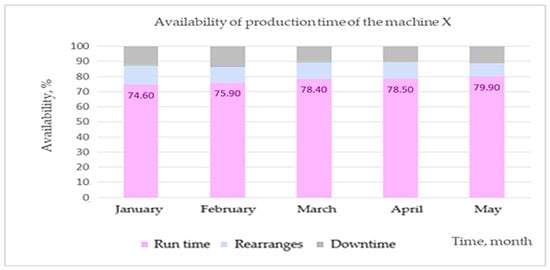
Figure 5.
Availability of production time on machine X before conducting the workshop.

Table 1.
Division of machine working time before conducting the workshop.
The machine availability indicator increases successively in the analyzed period—from 74.6% in January to 79.9% in May. This means that despite the lack of direct workshop activities, some changes in the organization of work or operation of the machine could have a positive impact on the effective production time. The share of time intended for reliability decreased in the analyzed period—from 12.4% in January to 8.75% in May. Such a trend is particularly promising because references are one of the key areas of production losses; despite this exceeding 8%, it still indicates the potential for further optimization, especially in the field of reduction of time-consuming operations. The downtime indicator drops from January (13%) to April (10.25%), which may indicate better management of operators’ work or reduction of unproductive periods, such as social breaks, training, or lack of operators at the workplace. However, in May, the value increased again to 11.35%, which may indicate unforeseen difficulties related to human resource management. Analysis of data from before the workshop indicates that although production processes show some positive trends, there are still significant areas that require intervention. Effective workshop activities can help maintain positive changes and stabilize the results.
4.2. Conducting a Workshop: Implementation of Planned Optimization Activities, Including Analysis of Work with the New Destacker and Modification of Conversation Procedures
As part of the activities aimed at optimizing production processes on machine X, a workshop was conducted aimed at introducing key improvements in the field of transmitting and improving the accessibility of the machine’s production time. The workshop included both technical modifications and the update of operational procedures, as well as employees’ involvement in practical exercises that allow for the implementation of fresh solutions in real working conditions. The workshop began with a clear determination of expectations and goals. The most important assumptions were the improvement of the machine’s availability, relieving rearranging time and updating the procedures related to this process. In addition, it was focused on analyzing work with the new Destacker, which included, among others, replacement of technical elements such as the “spider” and sensors, as well as the implementation of new tools aimed at increasing the precision and safety of operations. The introduction of a new “spider” and sensors equipped with lasers to set the magnets was aimed at eliminating potential collisions during reckoning. In addition, it was decided to use two “spiders” for replacement—one in current use and the other during cleaning. Another improvement was the installation of measures for sensors on both Destacker tables, which allowed them to precisely set them at the same height, minimizing the time needed to calibrate the device. After the introduction of technical changes, a detailed analysis of the rearranging process was carried out. It includes all key aspects related to the organization of work. The role of the team’s leader was emphasized as central in the coordination of activities and monitoring the progress of conversion. The tasks of the setter, including the technical adaptation of the machine to the requirements of the production of a new product, have been optimized by using new tools and procedures. Emphasis was also placed on the identification of external activities that could be performed even before the process of rearranging, which significantly reduced the downtime of the machine.
One of the key elements of the workshop was practical physical exercises carried out by the new conversion procedure. Operators and plants had the opportunity to test changes in real working conditions, which allowed for quick identification of potential problems and their immediate solutions. Thanks to this, the process of implementing fresh solutions was more efficient, and employees gained practical experience in new procedures. During the workshop, a temporary goal was also established for the rearranging process, which was 30 min for both analyzed products—A and B. This goal was agreed upon during consultation with the head of the compressor and was intended to determine the real, but at the same time ambitious, standard for the team. After the workshop and the use of new procedures, it was possible to set a time of 25.5 min for the product, which significantly exceeded the assumed goal and confirmed the effectiveness of the changes introduced. In the case of product B, the rearranging time was 35.2 min, which indicates a lack of significant benefits in this case and the need for further improvements in the process.
4.3. Collecting Data After the Workshop: Measurement of Production Efficiency Indicators After the Implementation of the Changes and the Completion of the Workshop
In the process of implementing changes based on the improvement workshop, one of the key steps is collecting and analyzing data on production efficiency. The collected information allows for assessing the effectiveness of the introduced modifications and enables further processes. After the workshop, measurements of production efficiency indicators were carried out to assess the impact of the implemented changes on the functioning of machine X. The workshop conducted in the 20th week, i.e., in mid-May, was an important turning point in the production processes of machine X. Data from May reflect the transitional situation, constituting the point between the results from before the workshop (January–April) and the effects after its completion, visible in the data from June and the following months (Figure 6).
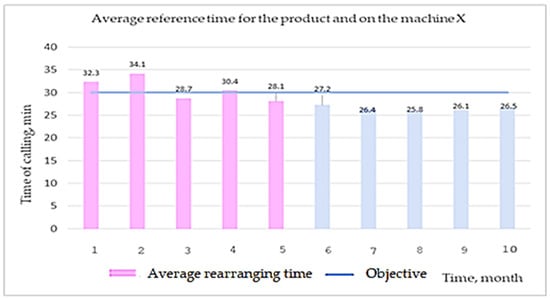
Figure 6.
Comparison of the average time of rearranging of machine X for the product before and after the workshop.
Data on the average time of rearranging the product A on machine X is shown in Figure 6, indicating significant changes in the effectiveness of the process before and after conducting the workshop. In the period before the workshop (January–April), clear fluctuations are noticeable, with the longest time in February (34.1 min) and the shortest in March (28.7 min). The average calling time in these months lasts at a level above the target set for 30 min, which indicates problems with the effectiveness of transmitting procedures. In May, when the workshop took place, the rearranging time dropped to 28.1 min before the change, and after the workshop, it reached 27.2 min, which suggests the initial effect of the implemented improvements. After the workshop, in the period from June to September, the rearranging time persisted at a shorter, more stable level, with the lowest value in July (25.8 min). These results show a clear trend of improving efficiency as a result of the implemented changes, consistently reaching the reference times. The agreed goal below is 30 min; they testify to the effectiveness of the workshop in improving production processes (Figure 7).
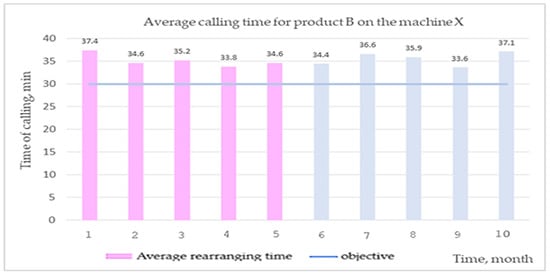
Figure 7.
Comparison of the average time of rearranging of machine X for product B before and after the workshop.
In the case of product B, the data presented in Figure 7 show much fewer benefits resulting from the workshop. Before the workshop, the time of rearranging ranged between 37.4 and 34.6 min. In May, a slight improvement was observed, but this result, which is the average data from before and after the workshop, does not reflect the full influence of the introduced changes. There was no clear improvement after the workshop—in June, the time was 36.6 min, which may have resulted from the initial difficulties in adapting to new procedures. The lack of a stable inheritance trend after the workshop suggests that for product B, the introduced changes could be less effective than in the case of other processes or that there are additional factors affecting the time of transmitting, which require further analysis and improvements.
Analysis of the number of machine X beats per minute for the product A show significant improvement in the process after the workshop. In the period before the workshop (January–April), the results shown in Figure 8 show some fluctuations. The lowest value was recorded in February (16.74), and the highest in March (18.11). This range of values suggests a lack of stability in the production process, although in May, the number of strokes increased to 18.27, which could be the result of the initial optimization activities conducted during the workshop. After the workshop, the results show a clear and lasting increase in efficiency. Already in May, there was a further increase in the number of strokes (18.50), and this trend persisted in the following months. In June, the number of strokes increased to 18.70 and reached the maximum value in July (18.85). In August (18.78) and September (18.67), the result remained at a prominent level, which confirms the effectiveness of the changes introduced. Stabilization of the results at a higher level after the workshop suggests that the improvements used—such as improving the processing procedures or optimization of machine settings—had a positive impact on the production process. Regular results in the range of 18.67–18.85 beats per minute prove that the efficiency of product A significantly increased, and the process has become more repetitive.
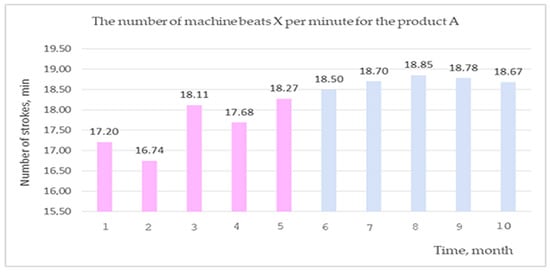
Figure 8.
Comparison of the number of machine X for product A before and after the workshop.
For product B (Figure 9) the number of the machine’s beats per minute before the workshop was more stable, with a slight increase to 17.55 in May. After the workshop, the data were more variable. In June, the result dropped to 17.01, which may indicate difficulties in the initial stage of implementing changes. In the following months, the values fluctuated, reaching 16.88 in September. A lack of permanent improvement in the case of product B may result from the more complex requirements of this product, which have not been fully included in the workshop.
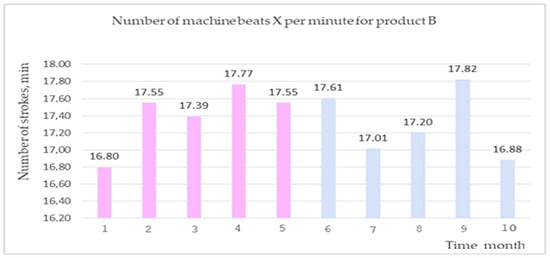
Figure 9.
Comparison of the number of machine X strokes for product B before and after the workshop.
An additional indicator that illustrates the efficiency of machine X is the number of beats per minute (Figure 10), measured for the entire machine regardless of the product. These data allow for assessing the overall equipment efficiency before and after the workshop. In the period before the workshop (January–April), the number of machine X strokes increased gradually, from 16.43 in January to 17.29 in April. The result from May, equal to 17.60, represents transient values, reflecting the average results before and after the workshop. After the workshop, from June to November, the number of machine strokes showed a tendency to further increase, despite slight fluctuations. In November, it reached the highest value in the analyzed period of 17.93.
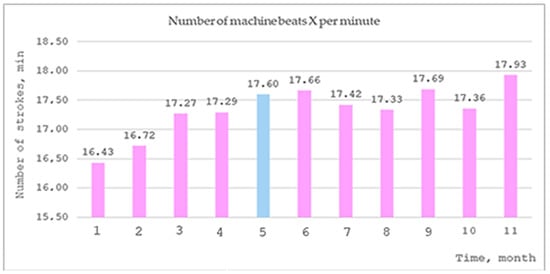
Figure 10.
Comparison of the number of machine X strokes per minute for product B before and after the workshop.
Before the workshop, the availability of production time (Figure 11 and Table 2) increased from 74.6% in January to 79.9% in May. After the workshop, the availability of production time continued to increase, reaching 81.4% in September. This is an improvement of 8% compared to January and 1.9% compared to May. A decrease in the share of time intended for reference—from 8.75% in May to 8.0% in September—also indicates the effectiveness of the workshop. The downtime rate, which before the workshop decreased from 13.0% in January to 11.35% in May, showed fluctuations after the workshop but generally decreased to 10.6% in September. This indicates a gradual improvement in the stability of the process. The collected data after the workshop confirms the effectiveness of the actions carried out, especially in the case of product A, where a permanent improvement in the time of the conversion and the number of machine beats per minute has been achieved. A clear shortening of the conversion time and an increase in the availability of production time indicate the effectiveness of the workshop. However, the results for product B indicate the necessity for further improvements to better adapt the processes to the specifics of this product.
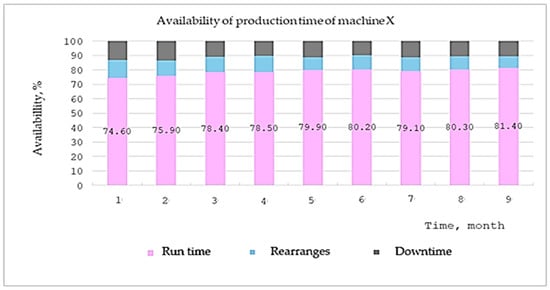
Figure 11.
Available working time of machine X before and after the workshop.

Table 2.
Division of machine working time after the workshop.
In the case of product B, the rearming time was 35.2 min, which is 9.7 min longer compared to product A. This result indicates the lack of significant benefits in this case and the need for further improvements in the process. These improvements can be obtained by introducing complex automation and robotization of production processes, taking into account the ideas of industry 4.0, e.g., introduction, Internet of Things or a digital twin.
4.4. Comparison of Data from and After the Workshop Using Statistical Methods to Assess the Significance of Observed Changes
To assess the impact of the workshop on the efficiency of production processes, a statistical analysis of selected indicators was carried out, such as the rearranging time and the number of machine X beats per minute. To assess the differences before and after the workshop, a parametric Student’s t-test for dependent tests was used, with the level of significance α = 0.05. The results of the analysis are presented in Table 3.

Table 3.
Comparison of measurements before and after the workshop conducted in terms of average rearranging of machine X for the product (Student’s t-test for subsidiaries).
Statistical analysis carried out using Student’s t-test for dependent tests (Table 4) showed statistically significant differences between the measurement results of the average time of rearranging the product and on machine X before and after the workshop. Since the p-value is lower than the adopted level of significance α = 0.05, it can be said that the differences are significant. The average time of reckoning after the workshop (Wed = 26.4; SD = 0.524) is significantly shorter than the average time before the workshop (Wed = 30.72; SD = 2.498), which is confirmed by the average difference of 4.32. The test result is t (4) = 4.172; p = 0.014.

Table 4.
Comparison of measurements before and after the workshop conducted in terms of the average time of rearranging product B on machine X (Student’s t-test for subsidiaries).
The conducted statistical analysis using the parametric Student’s t-test for two dependent tests (Table 4) did not show statistically significant differences between the measurement results of the average time of rearranging product B on machine X before and after the workshop. The p value is greater than the adopted level of significance α = 0.05, which means that the observed differences in medium-sized times may result from accidents. The average rearranging time after the workshop (Wed = 35.52; SD = 1.479) is longer than the average time before the workshop (Wed = 35.12; SD = 1.137), and the medium difference is −0.4. The test result is T (4) = −0.411; p = 702.
The statistical analysis of the results, carried out using Student’s t-test for subsidiaries (Table 5), showed significant differences in the number of machine X strokes for product A before and after the workshop. Since the p value is lower than the determined level of significance α = 0.05, it can be considered that the observed differences are statistically significant. The average number of impacts after the workshop (Wed = 18.7; SD = 0.132) is significantly greater than the average number of strokes before the workshop (Wed = 17.6; SD = 0.635), which confirms the medium difference in the average of −1.1. The test result is T (4) = −4159; p = 0.1.

Table 5.
Comparison of measurements before and after the workshop in terms of the number of machine X strokes for product A (Student’s t-test for subsidiaries).
The conducted statistical analysis, using the parametric Student’s t-test for two subsidiaries (Table 6), did not reveal statistically significant differences in the number of machine X strokes for product B before and after the workshop. The value of p, higher than the adopted level of significance α = 0.05, indicates that the observed differences are not significant. The average number of strokes after the workshop (Wed = 17.304; SD = 0.399) is lower than the average number of strokes before the workshop (Wed = 17.412; SD = 0.369), and the medium difference is 0.108. The test result is T (4) = 0.412; p = 702.

Table 6.
Comparison of measurements before and after the workshop in terms of the number of strokes of machine X for product B (Student’s t-test for subsidiaries).
4.5. Use of Tools Supporting the Improvement of Efficiency in the Analyzed Enterprise
In the process of optimizing activities in the analyzed automotive company, several tools supporting the analysis, planning and implementation of improvements were used. These tools, commonly used in production process management, enabled a thorough diagnosis of problems, a systematic approach to planning activities and effective implementation of solutions to improve efficiency. The most important methods that were used in the analysis and implementation of improvements are presented below.
4.5.1. Method 5 WHY
The analysis of the causes of problems using the 5WHY method allowed for the accurate identification of sources of extended reliability and other restrictions negatively affecting production efficiency. Thanks to this tool, it was possible to carry out a multi-level recognition of problems and direct activities to their elimination. The following is an example of using the 5WHY method in practice:
- Problem: Extended rearranging time for the product A.
- Why? Too time-consuming to machine settings.
- Why? No standardization of procedures.
- Why? There are no clearly defined instructions for operators.
- Why? Insufficient training.
- Why? Inadequate training program.
The analysis showed that the main problems were inefficient procedures and insufficient preparation of machine operators. Lack of standardization and detailed instructions resulted in various work practices, which extended the process of reliance and reduced performance.
4.5.2. Method ABC (Pareto–Lorenza)
As part of the optimization workshop, the enterprise used the ABC method based on the Pareto–Lorenz principle to identify the most important factors affecting the efficiency of production processes. This method enabled a detailed analysis to concentrate optimization activities in key areas generating the greatest losses (Table 7). The data were collected within a month from the production process, during which about 65 uses of the X machine were carried out. Here is a summary of the causes of losses, their value and percentage participation in total losses.

Table 7.
Production losses.
The factors were assigned to ABC groups based on their impact on total time losses (Table 8).

Table 8.
Classification of factors (ABC method).
Analysis of data on losses in the process of moving machine X allowed for the assignment of individual factors to groups A, B and C, which enabled the determination of the priorities of optimization activities. Group A covered the most important causes of losses, responsible for 80.27% of the total loss time. It includes time-consuming tools, no precise instructions and sensor problems. These factors have been considered key to eliminate because their reduction would bring the greatest benefits for the effectiveness of the process. Group B covered reasons with an average impact on losses, which in total constituted 16.34% of losses. These were operators’ mistakes, logistic problems related to the lack of tools and deficiencies in materials. These factors, although less important than those from Group A, still require corrective actions to minimize their impact on the downtime of the machine. In turn, Group C contained factors with the slightest impact on losses, responsible only for 3.59% of the total loss time. This group includes sporadic machine failures and other incidental problems. Due to their low participation in losses, they were considered the least important in the short-term perspective of optimization activities. As part of this research, a Pareto chart was developed, which illustrates the percentage distribution of individual losses and their cumulative impact. On this basis, optimization activities were focused on processes with the greatest impact on overall performance.
Figure 12 shows that time-consuming tool settings, no precise instructions and sensor problems are responsible for most losses (Group A).
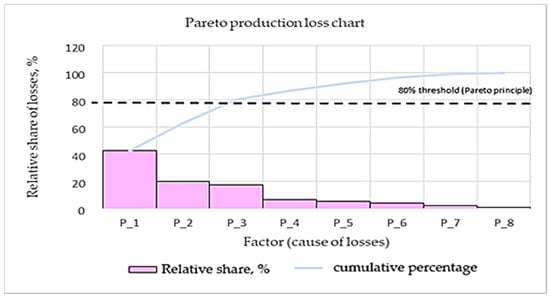
Figure 12.
Pareto function loss.
4.5.3. Chart Ishikawa
To identify the causes of taking so long for product B before the workshop, the cause-and-effect analysis was applied using an Ishikawa diagram (Figure 13). The 5 M + E was divided into six main categories: human factor (MEN), method, machine, material, management and environment. As part of each category, specific reasons were identified, such as lack of employee experience, non-optimal calling procedures, machine failures, and problems with the availability of parts or inappropriate working conditions. Diagnosis of these causes allowed for the development of effective optimization activities that contributed to improving the effectiveness of the process after conducting the workshop.
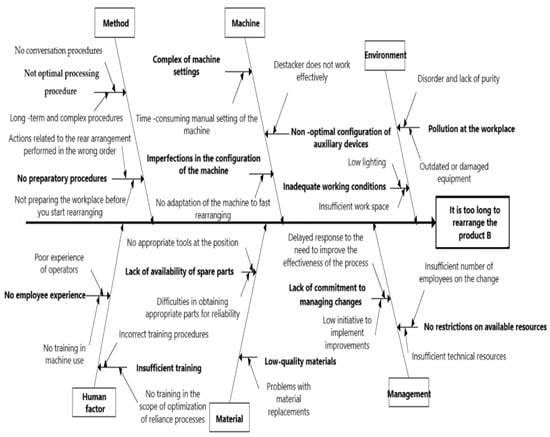
Figure 13.
Chart Ishikawy.
4.5.4. Method SMART
When formulating the optimization goals, the SMART method was used, which enabled them to precisely define and implement the process. An example of a target that was formulated as part of this method is “shortening the average time of rearranging for the product, only up to 30 min after the workshop”. The goal is clearly defined and leaves no room for doubt as to what exactly is to be achieved. In this case, the specificity of the target is that it is about shortening the average time of rearranging for product A. The goal indicates a specific process (reckoning) and determines which product (A) is to be optimized.
Measurable—the target is measurable because it determines the specific value to which to strive in the optimization process. In this case, the goal is to achieve an average rearranging time of 30 min. This is a measurable indicator that allows for easily assessing progress and determining whether the goal has been achieved.
Acceptable (Achievable)—the goal is acceptable because it is based on the real capabilities of the company. It was determined taking into account available resources, technology and team experience. As part of the workshop, it is planned to introduce appropriate tools, methods and training that will allow for reducing the time of rearranging. Based on previous process analyses, it was considered that such a goal was realistic to achieve at a specified time.
Realistic—the goal is realistic because it was determined in the context of the company’s previous experience and available funds. Shortening the average time of rearranging for the product by up to 30 min is possible to achieve by optimizing existing processes, for example by improving work organization, modification of conversation procedures or introducing new technologies. The purpose takes into account real restrictions and resources that are available at the plant.
Time-bound—the target is set out in time because a specific date has been set for implementation after the workshop. By giving time to implement the planned optimization activities and monitoring them, the goal becomes more concentrated and they can precisely determine when it should be achieved. Determining the deadline also allows for assessing its progress.
5. Conclusions and Discussion
Based on the presented analyses and research, the following conclusions were drawn:
- The workshop produced a significant improvement in the efficiency of production processes, which was confirmed by statistical analysis of the reception time. In the case of product A, the reference time was reduced by an average of 4.32 min, which was a statistically significant change (p < 0.05). For product B, the average redemption time did not change significantly after the workshop, which indicates that the implemented actions had a limited impact on the process of reliability for this product, which may be related to a different specificity of production.
- After the workshop, an increase in the number of Machine X strokes was recorded for both products A and B. In the case of product A, the number of strokes increased significantly, which indicates an improvement in the machine’s efficiency as a result of optimization. However, for product B, the differences in the number of beats before and after the workshop were statistically insignificant, which may indicate the need for further analysis of the production technology of this product.
- The introduced organizational and technological changes translated into growth in terms of the availability of the production time of the X. Reducing the recreation time and optimization of the Destacker’s work allowed for more effective use of the machine.
- The workshop had a positive impact on the key indicators of operational efficiency. Shortening the time of tailoring and increasing the efficiency of Machine X for product A confirmed the effectiveness of the optimization activities used. Although the impact on product B was less pronounced, the general increase in the efficiency of production processes indicates the benefits of the implemented changes.
- Applications regarding the impact of the workshop were confirmed by statistical tests, which emphasize the importance of a systematic approach to assessing processes efficiency. Statistical analysis provided reliable evidence for the effectiveness of the carried-out activities, enabling the identification of areas with the highest potential for improvement.
- Based on the analyses conducted, it is recommended to continue monitoring effectiveness indicators and regularly implement optimization activities. Particular attention should be paid to product B to identify and eliminate barriers limiting the increase in efficiency in this area. In addition, it is worth developing and implementing modern 4.0 industry technologies, such as automation and robotization, which can bring further benefits in the context of the efficiency of production processes.
The presented study can serve as a basis for further research and the use of the developed mathematical model for analysis in low-level plants to increase control of the dependencies occurring in assembly processes.
Further research directions in this area should focus on more advanced cooperation between humans and machines, with an emphasis on greater intuitiveness and effectiveness of cooperation. Digital twins, i.e., virtual models of real objects, will be increasingly used to monitor and optimize design and manufacturing processes. This will allow for better resource management and faster responses to problems.
To summarize, the issues presented related to the evaluation of parameters affecting the efficiency of production processes, including barriers and prospects for automation in a real production environment, are certainly not exhaustive. However, they are a starting point for research into the future challenges of the automotive industry.
Author Contributions
Conceptualization, M.N. and W.L.; methodology, M.N. and W.L.; software, M.N. and W.L.; validation, M.N.; formal analysis, M.N. and W.L.; investigation, M.N. and W.L.; resources, M.N.; data curation, M.N. and W.L.; writing—original draft preparation, M.N., W.L., A.K. and K.S.; writing—review and editing, M.N., W.L., A.K. and K.S.; visualization, M.N.; supervision, W.L.; project administration, M.N., W.L., A.K. and K.S.; funding acquisition, A.K. All authors have read and agreed to the published version of the manuscript.
Funding
This research received no external funding.
Data Availability Statement
The data presented in this study are available on request from the corresponding author.
Conflicts of Interest
The author declares no conflicts of interest.
References
- Kampa, A.; Gołda, G.; Paprocka, I. Discrete event simulation method as a tool for improvement of manufacturing systems. Computers 2017, 6, 10. [Google Scholar] [CrossRef]
- Bubeníková, E.; Bubeník, P. Internet of things (IoT). Technol. Roč. 2017, 9, 131–134. [Google Scholar]
- Peniak, P.; Rástočný, K.; Kanáliková, A.; Bubeníková, E. Simulation of Virtual Redundant Sensor Models for Safety-Related Applications. Sensors 2022, 22, 778. [Google Scholar] [CrossRef] [PubMed]
- Renna, P.; Mancusi, V. Controllable processing time policy in job shop manufacturing systems: Design and evaluation by simulation modelling. Int. J. Serv. Oper. Manag. 2017, 27, 366. [Google Scholar] [CrossRef]
- Jia, Y.; Tian, H.; Chen, C.; Wang, L. Predicting the availability of production lines by combining simulation and surrogate model. Adv. Prod. Eng. Manag. 2017, 12, 285–295. [Google Scholar] [CrossRef]
- Więcek, D.; Więcek, D.; Dulina, L. Materials requirement planning with the use of activity-based costing. Manag. Syst. Prod. Eng. 2020, 28, 3–8. [Google Scholar] [CrossRef]
- Gasova, M.; Gaso, M.; Stefanik, A. Advanced industrial tools of ergonomics based on the Industry 4.0 concept. Procedia Eng. 2017, 192, 219–224. [Google Scholar] [CrossRef]
- Hietanen, A.; Latokartano, J.; Pieters, R.; Lanz, M.; Kamarainen, J.-K. AR-based interaction for human-robot collaborative manufacturing. Robot. Comput.-Integr. Manuf. 2020, 63, 101891. [Google Scholar] [CrossRef]
- Long, P.; Chevallereauo, C.; Chablat, D.; Girin, A. An industrial security system for human-robot coexistence. Ind. Robot 2018, 45, 220–226. [Google Scholar] [CrossRef]
- Matheson, E.; Minto, R.; Zampieri, E.G.G.; Faccio, M.; Rosati, G. Human-robot collaboration in manufacturing applications: A review. Robotics 2019, 8, 100. [Google Scholar] [CrossRef]
- Gołda, G.; Kampa, A.; Paprocka, I. Analysis of Human Operators and Industrial Robots Performance and Reliability. MPER 2018, 9, 24–33. [Google Scholar]
- Bona, G.D.; Cesarotti, V.; Arcese, G.; Gallo, T. Implementation of Industry 4.0 technology: New opportunities and challenges for maintenance strategy. Procedia Comput. Sci. 2021, 180, 424–429. [Google Scholar] [CrossRef]
- Pinciroli, L.; Baraldi, P.; Zio, E. Maintenance optimization in industry 4.0. Reliab. Eng. Syst. Saf. 2023, 234, 109204. [Google Scholar] [CrossRef]
- Raja, H.A.; Kudelina, K.; Asad, B.; Vaimann, T.; Kallaste, A.; Rassölkin, A.; Khang, H.V. Signal Spectrum-Based Machine Learning Approach for Fault Prediction and Maintenance of Electrical Machines. Energies 2022, 15, 9507. [Google Scholar] [CrossRef]
- Zamora-Antuñano, M.A.; Cruz-Salinas, J.; Rodríguez-Reséndiz, J.; González-Gutiérrez, C.A.; Méndez-Lozano, N.; Paredes-García, W.J.; Altamirano-Corro, J.A.; Gaytán-Díaz, J.A. Statistical Analysis and Data Envelopment Analysis to Improve the Efficiency of Manufacturing Process of Electrical Conductors. Appl. Sci. 2019, 9, 3965. [Google Scholar] [CrossRef]
- Gola, A.; Wiechetek, Ł. Modelling and simulation of production flow in a job-shop production system with enterprise dynamics software. Appl. Comput. Sci. 2017, 13, 87–97. [Google Scholar] [CrossRef]
- Silvestri, L.; Forcina, A.; Introna, V.; Santolamazza, A.; Cesarotti, V. Maintenance transformation through Industry 4.0 technologies: A systematic literature review. Comput. Ind. 2020, 123, 103335. [Google Scholar] [CrossRef]
- Rakyta, M.; Bubenik, P.; Binasova, V.; Micieta; Staffenova, K. Advanced Logistics Strategy of a Company to Create Sustainable Development in the Industrial Area. Sustainability 2022, 14, 12659. [Google Scholar] [CrossRef]
- Stofkova, J.; Krejnus, M.; Stofkova, K.R.; Malega, P.; Binasova, V. Use of the analytic hierarchy process and selected methods in the managerial decision-making process in the context of sustainable development. Sustainability 2022, 14, 11546. [Google Scholar] [CrossRef]
- Veisi, B.; Farughi, H.; Raissi, S. Two-Machine Robotic Cell Sequencing under Different Uncertainties. Int. J. Simul. Model. 2018, 17, 284–294. [Google Scholar] [CrossRef]
- Tran, N.-H.; Park, H.-S.; Nguyen, Q.-V.; Hoang, T.-D. Development of a Smart Cyber-Physical Manufacturing System in the Industry 4.0 Context. Appl. Sci. 2019, 9, 3325. [Google Scholar] [CrossRef]
- Huang, X.-Q.; Tang, X.-T.; Chen, L. Simulation for trajectory tracking of multi-flexible-link space robot with dead zone. Int. J. Simul. Model. 2018, 17, 677–689. [Google Scholar] [CrossRef] [PubMed]
- Niekurzak, M.; Mikulik, J. Modelling of Energy Consumption and Reduction of Pollutant Emissions in a Walking Beam Furnace Using the Expert Method—Case Study. Energies 2021, 14, 8099. [Google Scholar] [CrossRef]
- Kuric, I.; Klackova, I.; Domnina, K.; Stenchlak, V.; Saga, M. Implementation of predictive models in industrial machines with proposed automatic adaptation algorithm. Appl. Sci. 2022, 12, 1853. [Google Scholar] [CrossRef]
- Sun, Z.; Guo, Y.; Sun, Z.; Yang, S.; Hao, B. Maintenance cost prediction for the vehicle based on maintenance data. Proc. Inst. Mech. Eng. Part D J. Automob. Eng. 2023, 238, 1550–1556. [Google Scholar]
- Zonta, T.; Da Costa, C.A.; Righi, R.D.R.; De Lima, M.J.; Da Rindade, E.S.; Li, G.P. Predictive maintenance in the Industry 4.0: A systematic literature review. Comput. Ind. Eng. 2020, 150, 106889. [Google Scholar] [CrossRef]
- Kuric, I.; Klarák, J.; Sága, M.; Císar, M.; Hajdučík, A.; Wiecek, D. Analysis of the possibilities of tire-defect inspection based on unsupervised learning and deep learning. Sensors 2021, 21, 7073. [Google Scholar] [CrossRef]
- Krajčovič, M.; Matys, M.; Gabajová, G.; Komačka, D. Utilization of Immersive Virtual Reality as an Interactive Method of Assignment Presentation. Electronics 2024, 13, 1430. [Google Scholar] [CrossRef]
- Micieta, B.; Macek, P.; Binasova, V.; Dulina, L.; Gaso, M.; Zuzik, J. Modular Intelligent Control System in the Pre-assembly Stage. Electronics 2024, 13, 1609. [Google Scholar] [CrossRef]
- Micieta, B.; Binasova, V.; Marcan, P.; Gaso, M. Interfacing the Control Systems of Enterprise-Level Process Equipment with a Robot Operating System. Electronics 2023, 12, 3871. [Google Scholar] [CrossRef]
- Tessoni, V.; Amoretti, M. Advanced statistical and machine learning methods for multi-step multivariate time series forecasting in predictive maintenance. Procedia Comput. Sci. 2022, 200, 748–757. [Google Scholar] [CrossRef]
- Firdaus, N.; Ab-Samat, H.; Prasetyo, B.T. Maintenance strategies and energy efficiency: A review. J. Qual. Maint. Eng. 2023, 29, 640–665. [Google Scholar] [CrossRef]
- Niekurzak, M.; Brelik, A.; Lewicki, W. The economic potential for the recovery and recycling of silicon photovoltaic cells and non-ferrous metals as part of the transition to a circular economy. Econ. Environ. 2023, 86, 202–224. [Google Scholar] [CrossRef]
- Psarommatis, F.; Gökan, M.; Azamfirei, V. Envisioning maintenance 5.0: Insights from a systematic literature review of Industry 4.0 and a proposed framework. J. Manuf. Syst. 2023, 68, 376–399. [Google Scholar] [CrossRef]
- Psarommatis, F.; Sousa, J.; Medonca, J.P.; Kiritsis, D. Zero-defect manufacturing the approach for higher manufacturing sustainability in the era of industry 4.0: A position paper. Int. J. Prod. Res. 2022, 60, 73–91. [Google Scholar] [CrossRef]
- Bubenik, P.; Capek, J.; Rakyta, M.; Binasova, V.; Staffenova, K. Impact of strategy change on business process management. Sustainability 2022, 14, 11112. [Google Scholar] [CrossRef]
- Mohan, T.R.; Roselyn, J.P.; Uthra, R.A.; Devaraj, D.; Umachandran, K. Intelligent machine learning based total productive maintenance approach for achieving zero downtime in industrial machinery. Comput. Ind. Eng. 2021, 157, 107267. [Google Scholar] [CrossRef]
- Wróblewski, P.; Niekurzak, M. Assessment of the possibility of using various types of renewable energy sources installations in single-family buildings as part of saving final energy consumption in Polish conditions. Energies 2022, 15, 1329. [Google Scholar] [CrossRef]
- Abidi, M.H.; Mohammed, M.K.; Alkhalefah, H. Predictive Maintenance Planning for Industry 4.0 Using Machine Learning for Sustainable Manufacturing. Sustainability 2022, 14, 3387. [Google Scholar] [CrossRef]
- Arena, S.; Manca, G.; Murru, S.; Orrú, P.F.; Perna, R.; Reforgiato Recupero, D. Data Science Application for Failure Data Management and Failure Prediction in the Oil and Gas Industry: A Case Study. Appl. Sci. 2022, 12, 10617. [Google Scholar] [CrossRef]
- Lu, Y.; Zheng, H.; Chand, S.; Xia, W.; Liu, Z.; Xu, X. Outlook on human-centric manufacturing towards Industry 5.0. J. Manuf. Syst. 2022, 62, 612–627. [Google Scholar] [CrossRef]
- Satyro, W.C.; Contador, J.C.; Monken, S.F.d.P.; Lima, A.F.d.; Soares Junior, G.G.; Gomes, J.A.; Neves, J.V.S.; do Nascimento, J.R.; denAraújo, J.L.; Correa, E.d.S.; et al. Industry 4.0 Implementation Projects: The Cleaner Production Strategy—A Literature Review. Sustainability 2023, 15, 2161. [Google Scholar] [CrossRef]
- Nigischer, C.; Reitererer, F.; Bougain, S.; Grafinger, M. Finding the proper level of detail to achieve sufficient model fidelity using FlexSim: An industrial use case. Procedia CIRP 2023, 119, 1240–1245. [Google Scholar] [CrossRef]
- Caiado, R.G.G.; Scavarda, L.F.; Azevedo, B.D.; de Mattos Nascimento, D.L.; Quelhas, O.L.G. The challenges and benefits of sustainable Industry 4.0 for supply chain operations and management—A framework to achieve the 2030 Agenda. Sustainability 2022, 14, 830. [Google Scholar] [CrossRef]
- Micieta, B.; Binasova, V.; Lieskovsky, R.; Krajcovic, M.; Dulina, L. Product segmentation and sustainability in customized assembly concerning the basic elements of industry 4.0. Sustainability 2019, 11, 6057. [Google Scholar] [CrossRef]
- Dulina, L.; Zuzik, J.; Furmannova, B.; Kukla, S. Improving Material Flows in an Industrial Enterprise: A Comprehensive Case Study Analysis. Machines 2024, 12, 308. [Google Scholar] [CrossRef]
- Carsodo, D.; Ferreira, L. Application of Predictive Maintenance Concepts Using Artificial Intelligence Tools. Appl. Sci. 2021, 11, 18. [Google Scholar]
- Breznik, M.; Buchmeister, B.; Vujica Herzog, N. Assembly line optimization using MTM time standard and simulation modelling—A case study. Appl. Sci. 2023, 13, 6265. [Google Scholar] [CrossRef]
Disclaimer/Publisher’s Note: The statements, opinions and data contained in all publications are solely those of the individual author(s) and contributor(s) and not of MDPI and/or the editor(s). MDPI and/or the editor(s) disclaim responsibility for any injury to people or property resulting from any ideas, methods, instructions or products referred to in the content. |
© 2025 by the authors. Licensee MDPI, Basel, Switzerland. This article is an open access article distributed under the terms and conditions of the Creative Commons Attribution (CC BY) license (https://creativecommons.org/licenses/by/4.0/).