Abstract
Properly determining reservoir wettability is crucial for enhancing oil recovery and optimizing production strategies; this is particularly the case for tight oil reservoirs. The lower-fourth member of the Shahejie Formation (Es4x) in the Bonan Sag of the Bohai Bay Basin is a typical tight sandstone play, which is characterized by a low permeability and poor fluid mobility and quite variable daily production. Despite efforts in reservoir stimulation, the incremental production remains negligible. A detailed investigation of the reservoir wettability was carried out using four representative tight sandstone samples from Es4x to better understand the production behavior of the tight oil reservoir. We employed a suite of analytical methods, including Environmental Scanning Electron Microscopy, contact angle measurement, spontaneous imbibition, and Nuclear Magnetic Resonance, to comprehensively evaluate the wettability characteristics of the reservoir at different scales. Two samples, C1 and C2, exhibit oil-wet characteristics at both pore and macro scales, with Sample C1 showing weak oil-wet behavior and Sample C2 demonstrating strong oil-wet behavior. In contrast, the other samples, C3 and C4, display strong water-wet characteristics across different scales. The pore size threshold between water-wet and oil-wet conditions for samples C1 and C2 is 0.1 μm, while that for samples C3 and C4 is 1 μm. Grain-coating chlorite and grain-coating illite are the primary clay minerals contributing to the oil-wet pore walls of the reservoir, whereas dispersed sheet-like chlorite and rosette chlorite predominantly exhibit water-wet characteristics. The tight oil reservoir in Es4x exhibits pronounced wettability heterogeneities, with distinct regions displaying either oil-wet or water-wet characteristics, significantly impacting the mobility and producibility of the tight oil in this reservoir interval.
1. Introduction
China has recently achieved notable progress in the exploration and development of tight sandstone oil, as highlighted by the discovery of several substantial tight oil reserves in the Ordos, Junggar, Songliao, and Bohai Bay basins [1]. These discoveries not only show the vast potential of tight oil resources in China [1] but also drive innovation in exploration and development technologies for tight sandstone reservoirs. Tight oil reservoirs are typically classified based on their petrophysical properties, specifically those with permeability below 0.1 mD and porosity below 10% [2]. Tight sandstone reservoirs have generally undergone intense diagenesis, mainly characterized by strong compaction, cementation, and dissolution, resulting in low porosity and permeability [3]. They are further characterized by poor petrophysical properties, complex pore structures, and pronounced heterogeneities [4]. Due to poor permeability and low production capacity, reservoir stimulation is often required to achieve an industrial oil flow rate [5]. The low permeability of tight oil reservoirs causes significantly higher capillary resistance compared with conventional reservoirs, with oil migration and accumulation largely governed by buoyancy and capillary forces [6]. According to the Washburn equation [7], capillary forces are primarily determined by pore-throat radius, oil–water interfacial tension, and fluid–rock interactions or reservoir wettability within the reservoir [8]. Therefore, pore structure and wettability are pivotal in determining oil and gas mobility within tight oil reservoirs, making research into these characteristics essential for enhancing oil recovery. Within our study area, the pore structure of the Shahejie Formation reservoirs in the Bohai Bay Basin has been extensively studied; however, there is still a lack of systematic research on the reservoir wettability characteristics in the lower Es4 tight sandstone reservoirs, hampering tight oil production.
Wettability denotes the tendency of a fluid phase in a multiphase system to spread over or adsorb onto a solid surface [9,10]. As a fundamental property of tight sandstone reservoirs, wettability governs both the distribution of reservoir fluids within porous media and the flow behavior of oil and water [11]. The in-depth study of wettability and its influencing factors is crucial for refining enhanced oil recovery techniques, such as water/surfactant/CO2 flooding, and for predicting reservoir dynamics, evaluating development prospects, and formulating effective extraction strategies. Tight sandstone reservoir rocks develop extensive micro- and nano-scale pores and throats, within which the influence of wettability on oil–water flow is particularly pronounced, increasing the complexity of fluid distribution and migration pathways [12]. Therefore, the accurate characterization of wettability is essential for enhancing oil extraction efficiency and prolonging the economic lifespan of oil reservoirs. The heterogeneity of the pore structure in tight sandstone reservoirs, coupled with the complex relationships among various minerals, renders the assessment of wettability particularly challenging. This is further complicated by the scarcity of specific techniques for characterizing wettability within micro- and nano-scale pores and a lack of research on the mechanisms of oil–water retention [13]. Currently, the standard methods for evaluating rock wettability include the Amott test, the United States Bureau of Mines (USBM) test, spontaneous imbibition (SI), contact angle (CA) measurements, Nuclear Magnetic Resonance (NMR) experiment, Environmental Scanning Electron Microscopy (ESEM) for in situ observation, and molecular dynamics simulation [14]. Due to their small pore-throat sizes as well as low porosity and low permeability of tight oil reservoirs, indirect measurement methods such as the Amott and USBM tests, which rely on displacement processes, often struggle to achieve accurate results [15]. The CA method, a standard technique in the petroleum industry, provides a direct and quantitative means of assessing the wettability of reservoir rocks. However, as a localized measurement, it may not represent the overall wettability of the sample and is susceptible to variations due to surface roughness, cleanliness, and mineral heterogeneity, which can complicate the achievement of reliable results [16,17]. Spontaneous imbibition, often used to mitigate this limitation, involves the spontaneous displacement of the non-wetting phase by the wetting phase through capillary action. However, this experiment only characterizes the average wettability of a sample, rather than the wettability of pore surfaces across different pore sizes [18,19]. NMR offers an effective alternative for evaluating reservoir wettability, providing distinct advantages by detecting fluid signals from different pore sizes, enabling a more rapid and accurate assessment of wettability [20]. Advancements in ESEM technology have enabled the direct observation and measurement of pore wall wettability, providing a reliable method for characterizing micro-scale wettability in tight sandstone [21,22]. Wang et al. (2019) conducted a series of ESEM experiments and established the criteria for identifying wettability on rock pore walls [23]. They have developed quantitative methods for measuring mixed wettability states by using Automatic Mineral Identification and Characterization System (AMICS) scanning to determine the spatial distribution of rock minerals on a two-dimensional (2D) surface and analyze the contact relationships among minerals and between minerals and pores. By statistically analyzing the mineral proportions around sample pores, they observed the condensation water characteristics on mineral surfaces under ESEM, reflecting the wettability at the pore-scale in tight sandstone reservoirs [13]. Yan et al. (2019) analyzed the 1D and 2D NMR T2 spectra of pores in organic-rich tight oil samples under different wettability conditions [19]. The study revealed the coexistence of water-wet, mixed-wet, and oil-wet pores, noting that completely water-wet inorganic pores displayed a T2 relaxation time of approximately 13.64 ms. Oil within highly hydrocarbon-wetting organic pores exhibited the fastest NMR relaxation, with a peak transverse relaxation time of approximately 0.13 ms. Liu et al. (2023) conducted a comprehensive experimental study on the wettability of tight sandstone reservoir cores from the Yanchang Formation in the Ordos Basin, utilizing CA measurements, NMR experiments, and Controlled Rate Mercury Injection (CRMI) tests [12]. They revealed the intricate dynamics of oil–water distribution in the reservoir pore structure when the wettability was altered from water-wet to oil-wet conditions, highlighting the significant effects on relative permeability and the efficiency of water-driven oil recovery processes. Jia et al. (2022) employed a multi-technique approach, incorporating micro-X-ray CT imaging, CA assessments, SI experiments, and physical simulations of oil migration, to examine the wettability characteristics of tight sandstone reservoir samples from the Dongying Depression in the Bohai Bay Basin [8]. The study emphasized the pivotal role of wettability in modulating capillary forces, thereby controlling the migration and accumulation patterns of oil and gas.
Recognizing the inherent limitations of individual methods in assessing the wettability of tight sandstone, we introduced a comprehensive approach to characterize the wettability of tight sandstone from the Bonan Sag, the Bohai Bay Basin. The approach commences with high-resolution ESEM imaging to examine the rock surface microstructure and determine pore-scale wettability via the condensation patterns of water vapor on pore walls. Subsequently, CA measurements are employed to quantitatively evaluate the mesoscopic wettability characteristics of the tight sandstone surface. The methodology integrates NMR with SI experiments to assess wettability across different pore sizes and the core plug samples. This multi-scale, integrated assessment of wettability bridges from the microscopic pore walls to the macroscopic rock surface, capturing both the overall sample wettability and that of pores with varying sizes. By harnessing the strengths of each technique, this integrated workflow enhances the precision and reliability of the measurements. It allows us to elucidate the wettability characteristics of tight sandstone at different scales and pore sizes, which is of significant importance for understanding the production capacity of different wells in the study area.
2. Geological Setting
Located on the eastern coast of China, the Bohai Bay Basin extends approximately 1050 km in a northeast–southwest orientation and about 440 km in a northwest–southeast direction [24], covering an area of about 200 × 103 km2. Characterized as a quintessential sedimentary basin from the Mesozoic to the Cenozoic era, it is uniquely shaped by the Tan-Lu fault zone on its eastern side and the Taihang Mountain east fault zone to its west, which together engender a dustpan-like basinal morphology [25,26]. The basin comprises seven depressions, namely the Jizhong, Linqing, Huanghua, Jiyang, Changwei, Liaodong Bay, and Lower Liaohe depressions [27]. The Bonan Sag is located in the northern part of the Jiyang Depression, is mainly controlled by a series of normal faults [24], and is characterized as a half-graben sag with a steep slope in the northwest and a gentle slope in the southeast, trending east–north, and covering an area of nearly 800 km2 [28]. The Bonan Sag contains a relatively complete sequence of Mesozoic and Cenozoic sedimentary deposits from both the depression and rifting lake basin periods. The boundaries of the Bonan Sag are quite distinct: to the north, the sag is connected to the Chengnan-Chengdong Fault and the Chengdong Uplift; to the east, it is bordered by the Guxi Fault linking with the Gubei Sag and the Gudao buried hill structural belt; to the south, it transitions to the gentle slope leading to the Chenjiazhuang Uplift; and to the west, it is connected to the Yidong Fault Zone of the Yihezhuang Uplift [29,30]. The Bonan Sag evolved as a negative tectonic domain under extensional conditions [31] and is further subdivided into four structural belts, running from south to north: the Southern Gentle Slope Zone, the Boshen 4 Step-fault Zone, the Deep Depression Zone, and the Northern Steep Slope Zone (Figure 1).
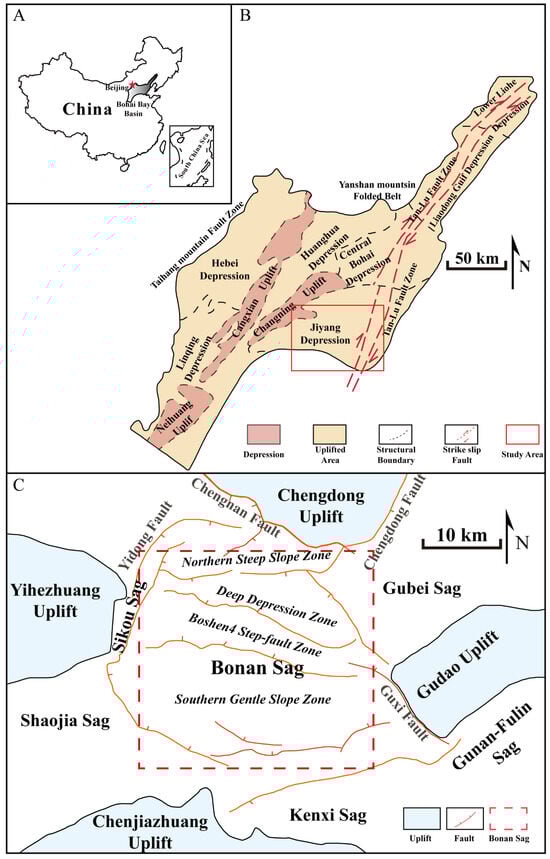
Figure 1.
Location map of the study area: (A) geographic location of the Bohai Bay Basin in eastern China; (B) location of the Jiyang Depression in the Bohai Bay Basin (red rectangle); (C) structural units and major faults in the Bonan Sag.
The sediments in the Bonan Sag were primarily deposited during the syn-rift stage, spanning from the Paleocene to the Eocene, and represent two phases of sedimentation. During the initial rifting stage, the Kongdian Formation (Ek) and the lower-fourth member of the Shahejie Formation (Es4x) were deposited. In the later extensional stage, the fourth, third, and lower-second members of the Eocene Shahejie Formation were deposited. During the subsidence process, the upper second and first members of the Shahejie Formation were deposited [32]. The Paleogene Shahejie Formation is the primary oil-generation strata, owing to its considerable thickness and widespread distribution. From top to bottom, the Shahejie Formation comprises Es1, Es2, Es3, and Es4, with Es4 being further subdivided into Es4s and Es4x. The main source rocks in the Bonan Sag are lacustrine mudstones and oil shales from the upper Es4 interval, lower Es3 interval, and Es1 interval [24]. The target layer, Es4x, is characterized by depositional facies including fan delta, braided river, braided river delta, lacustrine, and alluvial fan, with an average stratigraphic thickness of about 210 m. The lower part is composed primarily of purplish-red mudstone, silty mudstone, and gray fine sandstone, while the upper part consists mainly of gray mudstone and fine sandstone, with local occurrences of coarse sandstone, gravelly coarse sandstone, pebble sandstone, and sandy conglomerate [33].
3. Samples and Methods
3.1. Sample Information and Sample Preparation
The core samples used in this study were collected from the Es4x tight sandstone reservoir interval in the Bonan Sag. The samples are cylindrical plugs, each with a diameter of 2.5 cm and a length ranging from 2.5 to 8.0 cm. The porosity and permeability values in Table 1 were measured using a helium porosimeter (Model AP-121-003-1, ±0.01% accuracy) and a permeability measurement instrument (Model ECK-III, ±0.001 × 103 μm2 accuracy), following the SY/T 5336-2006 standard measurement workflow, with porosity values ranging from 7.26% to 22.41% and permeability between 0.401 × 10⁻³ μm2 and 56.380 × 10⁻³ μm2.

Table 1.
Information from samples investigated.
The crude oil used in the experiments has a density of 0.8469 g/cm3, a dynamic viscosity of 3.32 MPa at 50 °C, freezing point of −11 °C, wax content of 14.78%, sulfur content of 0.72%, combined saturate and aromatic component of 48.89%, and asphaltene and resin content of 36.33%.
All core samples were cleaned for 48 h using a Soxhlet extractor with a mixture of petroleum ether, ethanol, and toluene (in a 1:1:2 ratio) at 120 °C. Subsequently, the core plugs were sectioned into three parts: upper section A, middle section B, and lower section C (Figure 2). Section A, a 3–5 mm thick sample with a flat bottom and a fresh fracture surface, was used for ESEM to evaluate the wettability of the pore walls. Section B, a 2–3 mm thick circular thin slice, was polished with 1000-grit sandpaper for CA measurements to assess the macroscopic wettability of the rock surface. Samples from the CA measurements were then sliced into thin sections for SEM-AMICS scanning. Section C, a cylindrical plug with a length of 2.0–4.9 cm, was utilized for SI combined with NMR experiments to determine the macroscopic wettability of the samples. The brine used for SI was a 20 g/L NaCl solution, and the crude oil was supplied by the Exploration and Development Research Institute, Shengli Oilfield Company, SINOPEC, sourced from the Es4x tight sandstone reservoir in the Bonan Sag.
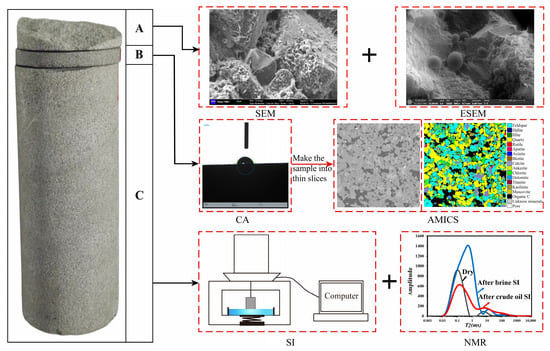
Figure 2.
Schematic diagram of core plug sample preparation. (A) sample for pore-scale wettability observation, (B) sample for meso-scale wettability observation, (C) sample for macro-scale wettability observation.
3.2. Automatic Mineral Identification and Characterization
The samples were first subjected to a pretreatment process involving grinding with progressively finer grit sandpapers to achieve a smooth surface, followed by further surface polishing using argon ion milling to create a sample surface suitable for imaging using electron microscopy. The samples were examined using a Zeiss Crossbeam 550 scanning electron microscope (Zesis, Oberkochen, Germany), in both secondary electron (SE) imaging and backscattered electron (BSE) imaging modes at 20 kV and 3 nA, respectively. The AMICS software (3.0.0.45) was used to obtain mineral compositions and their spatial distribution on mosaicked large-field BSE images by integrating the strong stereoscopic effect of SE imaging with the mineral brightness contrast from BSE imaging and the elemental distribution data from EDS analysis.
3.3. Environmental Scanning Electron Microscopy
Environmental Scanning Electron Microscopy (ESEM) experiments were conducted using an FEI Quanta 200F (Thermo Fisher, Waltham, MA, USA) field emission instrument, operated at a working voltage of 15 kV. These experiments, conducted at the Electron Microscopy Laboratory of Peking University, involved the following key steps: (1) segment A of samples (see Figure 2) was placed on a cooling stage and cooled to a stable temperature of 1–2 °C, after which the morphology of the sample in its dry state was recorded, with specific areas of interest marked for reference; (2) the chamber pressure was gradually increased until water vapor condensed into droplets or formed a film on the sample surface, and the morphology of the pore walls at the pre-marked locations was examined and imaged; (3) the morphology of the samples in the dry state and after condensation was compared and analyzed, and the wettability of the pore wall was evaluated based on the shape of the condensed water.
3.4. Contact Angle Experiment
Static contact angles were measured using a KRUSS DSA30S drop shape analyzer (KRUSS, Hamburg, Germany) at room temperature and atmospheric pressure, with a droplet volume of about 2 μL. To ensure measurement precision, contact angle assessments were conducted at multiple sites on the sample surface, with 4 to 5 trials performed at each site.
3.5. Spontaneous Imbibition Combined with Nuclear Magnetic Resonance Measurements
The experimental setup for spontaneous imbibition consists of a high-precision balance (Sartorius GL2241-15CN, Sartorius, Göttingen, Germany, with a precision of 0.0001 g), a computer, and adjustable supports. During the imbibition process, segment C of the core sample in Figure 2 is suspended in the imbibing fluid via a fine thread, using a high-precision balance measuring and a computer recording the weight in real time. To manage the amount of data, the sampling frequency is adjusted in stages. During the first 2 min of the experiment, data were collected every second, then every 30 s afterward until the end of the first hour, and every 120 s starting from the second hour to the end of the sixth hour. After 6 h, the recording frequency was reduced to once every 300 s.
The NMR T2 spectra were measured using a MicroMR12 analyzer from the Wuxi Research Institute of Petroleum Geology, SINOPEC, Wuxi, China. The Carr-Purcell-Meiboom-Gill (CPMG) pulse sequence was applied for acquiring the NMR echo train, using the following parameters: an echo time interval (TE) of 0.06 ms, a waiting time (TW) of 6000 ms, 4096 echoes (NE), and 64 sampling repetitions (NS).
The combined SI and NMR measurement experiment were carried out at ambient room temperature, including the following steps: initially, samples were dried in oven at 110 °C for at least 24 h, recording the mass and dimensions afterward, and then dry-state NMR T2 spectra were measured. Subsequently, samples underwent spontaneous brine imbibition for approximately 24 h, followed by the removal of surface liquid with filter paper, recording weights, and subsequent NMR T2 spectral measurement. Finally, after re-drying, samples were immersed in crude oil for 24 h, and after wiping off the surface oil and weighing, the post-oil imbibition NMR T2 spectra was obtained.
4. Results and Interpretation
4.1. Petrological Characteristics
The AMICS results (Table 2) indicate that the estimated mineral compositions of the sandstone in the lower Es4 is dominated by feldspar and quartz with high compositional maturity. Quartz content ranges from 30.55% to 39.37%, with an average of 34.37%, while feldspar ranges from 25.56% to 40.22%, averaging 31.58%. The clay mineral content ranges from 2.55% to 12.69%, averaging 7.68%. The clay minerals in samples C1 and C2 are mainly illite (Figure 3a–d). Chlorite is the principal clay minerals in samples C3 and C4 (Figure 3e–h). Samples C1 and C4 contain a minor amount of mica, while Sample C2 contains a high oil saturation (Figure 3c,d).
Table 2.
Estimated mineral and hydrocarbon contents in the tight sandstone samples investigated.
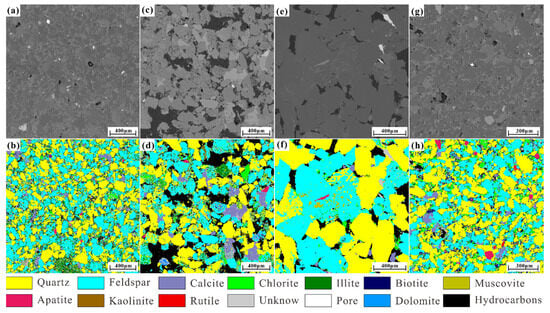
Figure 3.
High-resolution, large-field photo mosaic of backscattered electron images and mineral composition maps of tight sandstone. Images (a,b) from Sample C1; images (c,d) from Sample C2; images (e,f) from Sample C3; images (g,h) from Sample C4.
4.2. Pore-Scale Wettability Characteristics
It has been demonstrated that the wetting condition of sandstone samples can be determined using ESEM observation/imaging of the state of water condensation on pore walls: film-shaped water indicates strong water-wet conditions, low-dome-shaped water indicates weak water-wet conditions, and the absence of condensed water or dome- or spherical-shaped water indicates oil-wet conditions [34]. The condensation behavior of water on mineral surface/pore walls can be significantly influenced by temperature and pressure. After multiple experimental adjustments, optimal ESEM chamber conditions for determining the wetting conditions of the Es4x tight sandstone are 2 °C and 6.6–6.9 Torr. The wettability measurement of the four samples was conducted under this P-T condition. Sample C1 is predominantly covered with hemispherical-shaped water droplets of different sizes, along with some spherical-shaped water droplets (Figure 4a–c), indicating weak oil-wet conditions. A significant amount of spherical-shaped water droplets are present in Sample C2 (Figure 4d–f), indicating a strong oil-wet condition. Sample C3 contains primarily low-dome-shaped water droplets, with some hemispherical-shaped water droplets (Figure 4g–i), indicating weak water-wet conditions. Sample C4 is covered completely by film-shaped water (Figure 4j–l), indicating a strong water-wet condition. The morphologies of the condensed water were found sometimes to vary within different regions of the same sample, suggesting fractional wettability characteristics at the micro-scale [35].
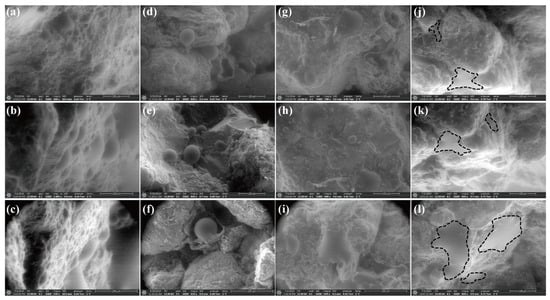
Figure 4.
ESEM images showing typical water vapor condensation scenarios at pore walls. Images (a–c) from Sample C1 showing low-dome morphology of water droplets; images (d–f) from Sample C2 showing globular shaped water droplets; images (g–i) from Sample C3 showing low-dome morphology of water droplets; images (j–l) from Sample C4 showing water films on mineral surfaces.
4.3. Meso-Scale Wettability Characteristics
Rocks are considered water-wet when the aqueous phase contact angles are less than 75°, exhibit intermediate wettability between 75° and 105°, and are oil-wet between 105° and 180° [36]. Contact angle measurements were taken at multiple sites on the surfaces of four samples, as illustrated in Figure 5. The results revealed that water contact angles range from 12.6° to 89.7°, reflecting a transition from water-wet to intermediate wettability. Notably, Sample C2 is characterized by contact angles between 65.4° and 89.7°, indicating an intermediate water-wet state at millimeter scale. The remaining samples displayed lower contact angles, ranging from 12.6° to 49.2° with an average of 28.6°, indicative of a water-wet state.
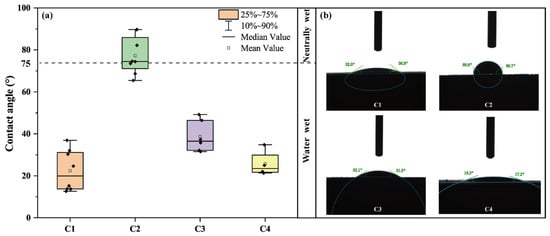
Figure 5.
Contact angle results. (a) Box-plot of contact angles (CA) of four samples measured and (b) images of CA measurements.
4.4. Macro-Scale Wettability Characteristics
To minimize the potential influence of sample shape and size on experimental outcomes, we meticulously recorded the mass/weight changes of both the samples and the solution before and after the experiment. The volume of imbibed brine and crude oil was then calculated based on these measurements. To quantify the imbibition effect and facilitate a comparative analysis of sample wettability, we employed the Wetting Affinity Index, as defined by Habibi et al. (2016) [15] and Lan et al. (2015) [37]:
where Iw and Io represent the volumes of brine and oil, respectively, imbibed into the samples.
Analyzing the SI results for brine and crude oil (Figure 6), it is evident that the imbibition process can be broadly divided into two phases: an initial rapid imbibition phase followed by a subsequent stable phase. For crude oil imbibition, a stable equilibrium state is more readily achieved. For samples C1 (Figure 6a) and C2 (Figure 6b), the volumes of oil imbibed per unit volume were markedly higher than that of brine. Conversely, in samples C3 (Figure 6c) and C4 (Figure 6d), the imbibed volumes of brine exceeded that of oil. The calculated wettability indices for the four samples are depicted in Figure 6e, with brine wettability indices of 0.431, 0.302, 0.681, and 0.576 and crude oil-wet indices of 0.569, 0.698, 0.319, and 0.424, respectively. These results indicate that samples C1 and C2 are more oil-wet, while Sample C2 exhibits a stronger oil affinity. In contrast, samples C3 and C4 display a stronger tendency toward water-wet conditions.
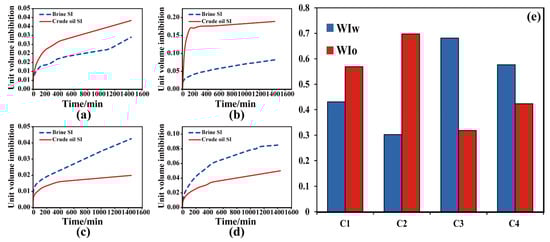
Figure 6.
The SI results for brine and crude oil: (a–d) Unit volume imbibition curves for brine and oil of C1, C2, C3 and C4; (e) the distribution of wettability indices for hydrophilic and oleophilic samples.
4.5. Fluid Distributions in Different Pores
To investigate the fluid distribution characteristics across varying pore scales, this study measured the transverse relaxation time (T2) distribution of four tight sandstone samples obtained through NMR measurements after the spontaneous imbibition of crude oil and brine. The experimental results demonstrate distinct multimodal T2 spectral patterns (Figure 7), with relaxation times predominantly ranging from 0.01 ms to 10 ms. A comparative analysis of different fluid imbibition experiments reveals distinct patterns: the T2 spectral peaks formed after brine imbibition display an overall broad distribution, whereas the main peak of the T2 spectrum for the crude oil imbibed samples is within the range of 0.01–1 ms. Notably, the peak amplitude of crude oil imbibed samples demonstrates a 40–60% reduction compared to that in the corresponding brine imbibed samples.
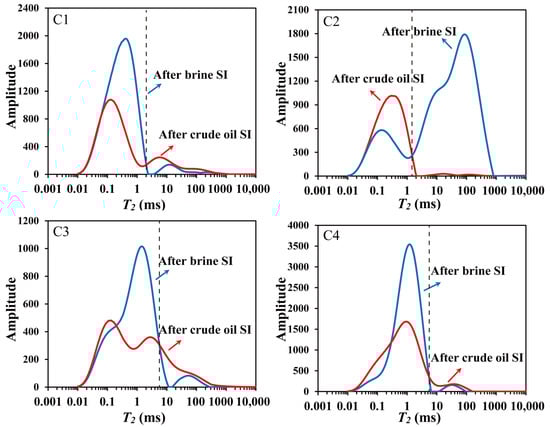
Figure 7.
T2 spectrum of four samples after spontaneous imbibition (SI) of brine and crude oil.
To investigate the fluid distribution and changes in fluid signals within pores of varying sizes in tight sandstone cores, the NMR T2 spectrum was converted into pore radius. Because the NMR T2 spectrum has similar morphological characteristics to the pore size measured by MICP [38], by analyzing the similarities and differences between the T2 curve of tight sandstone and the mercury injection distribution curve, Li et al. (2015) found that T2 and r have a power-exponential relationship [39]:
where r is the pore radius, μm; T2 is transverse relaxation time, ms; C = ρ2FS; FS is the shape factor of a single pore, with FS = 3 for spherical pores, and FS = 2 for columnar pores; ρ2 is the transverse surface relaxation rate.
By comparing the cumulative probability curve of the T2 spectrum obtained by NMR experiment with the cumulative probability curve of the pore radius obtained by MICP measurement and determining the conversion coefficient n at the tangent point of the two, the accurate conversion between the T2 spectrum and MICP pore size can be realized.
In Figure 8a,d,g,j, we can observe that the peak of the pore size distribution in the tight sandstone, derived from the MICP experiment, primarily falls within a pore radius range between 0.01 μm and 1 μm. Figure 8b,e,h,k, which show the transformed r values derived from T2, also exhibit similar pore size distribution characteristics, thereby demonstrating the validity of converting the NMR T2 spectrum into a pore size distribution curve. Figure 8b,e,h,k reveal the distribution of fluids across different pore radii after spontaneous imbibition of brine and crude oil. Figure 8c,f,i,l display the imbibition amounts of brine and crude oil in different pore radii. The results show that in smaller pores, the average imbibition of brine exceeds that of crude oil, while in larger pores, crude oil imbibition is higher than that of brine. This suggests that smaller pores exhibit stronger water-wet conditions compared to larger pores, which in turn show stronger oil-wet conditions, presenting clear mixed wettability characteristics.
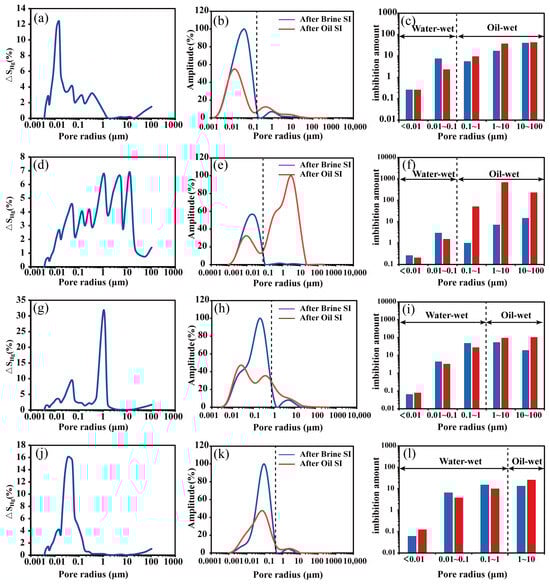
Figure 8.
NMR experimental results: (a–c) MICP pore size distribution, NMR pore size distribution, and oil–water imbibition amount of Sample C1 with different pore sizes; (d–f) MICP pore size distribution, NMR pore size distribution, and oil–water imbibition amount of Sample C2 with different pore sizes; (g–i) MICP pore size distribution, NMR pore size distribution, and oil–water imbibition amount of Sample C3 with different pore sizes; (j–l) MICP pore size distribution, NMR pore size distribution, and oil–water imbibition amount of Sample C4 with different pore sizes.
A comprehensive analysis of brine and crude oil imbibition across different pore sizes for the four samples (Figure 9) reveals some distinct trends. Samples C1 and C2 exhibit greater brine imbibition volumes than crude oil imbibition volumes within the pore size range of less than 0.1 μm. Conversely, in the pore size ranges of 0.1 μm to 1 μm and greater than 1 μm, the brine imbibition volumes are less than those of crude oil. In contrast, samples C3 and C4 demonstrate higher brine imbibition volumes than crude oil in the pore size ranges of less than 0.1 μm and 0.1 μm to 1 μm. However, for pores with radii larger than 1 μm, the brine imbibition volumes are lower than those of crude oil.
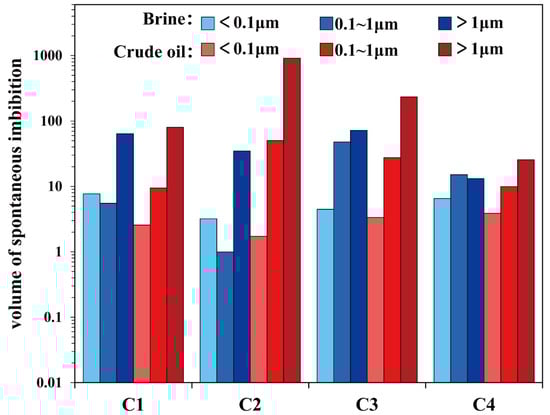
Figure 9.
Distribution of oil and brine within various pore sizes (radius).
5. Discussion
5.1. Comparison of Different Methods
When comparing the macro-scale SI with the meso-scale CA results and the pore-scale ESEM observations, it is noted that there are inconsistencies or sometimes even contradictions in the wetting state of tight sandstone determined by these different methods. Comparing the results from ESEM and CA (Figure 4 and Figure 5), it is evident that there are discernible differences in contact angles between the micro-scale and meso-scale, a phenomenon consistent with observations made by Al-Naimi et al. (2023) [35]. Mesoscopic contact angles typically manifest as either water-wet or intermediately wet, whereas at the microscopic level, spatial variations in wettability are readily apparent. Even on the surfaces of the same mineral, the morphology of condensed water can vary (Figure 4), indicating a fractional wettability. This variation is quite challenging to detect at the mesoscopic scale, as the contact angle provided by the sessile drop method is contingent upon the heterogeneity of the solid surface, its roughness, the size of the droplet, and ambient vibrations and thus only characterizes the average wettability of the rock–fluid system [40]. Generally, the surface roughness of individual minerals is less than that of a heterogeneous mineral surface, and a lower roughness leads to a larger contact angle [41,42], which may be one reason for the larger contact angles at the micro–nano scale compared to that at the meso-scale. These differences in wettability across scales may also stem from mixed mineralogies [35]. Due to the strong heterogeneity in wettability and mineral compositions of tight reservoirs and the fact that the mineral surfaces measured in contact angle assessments do not reflect the actual pore wall minerals, it is difficult to obtain accurate results from mesoscopic contact angle measurements [20,43,44].
The discrepancy on the wettability between SI and CA results may be due to the latter being conducted in a water–air–rock system, where surface roughness can also have a significant impact [41]. In tight sandstone reservoirs, factors such as mineralogy variations, low permeability, complex pore structures, and the presence of organic matter may further complicate the interpretation of wettability [45]. The spontaneous imbibition characteristics of mixed wettability, influenced by the heterogeneities of mineral compositions and pore structures, require further investigation [20].
Despite significant variance in wettability measurements across different scales, these methods demonstrate consistency in characterizing their relative strength of wettability. For instance, ESEM observations for Sample C2 show a predominance of spherically condensed water drop and the largest water contact angle among all samples. The sessile drop method yielded the highest water contact angles for Sample C2, albeit hemispherical, aligning with its higher Wetting Affinity Index of Oil compared to its Wetting Affinity Index of Brine. This phenomenon is consistent across all samples, with Sample C2 exhibiting the strongest oil-wetting affinity, as indicated by the highest Wetting Affinity Index of Oil.
5.2. Factors Influencing Tight Sandstone Wettability
In order to investigate the factors influencing the wettability of tight sandstones in the lower Es4 sub-member of the Bonan Sag, we conducted a comparative analysis of the characteristics of pore size and mineral compositions between two oil-wetting samples and two water-wetting samples.
SEM observations indicate that Sample C1 is composed predominantly of grain-coating illite (Figure 10a,b), which uniformly wraps the grains, creating a honeycomb-like structure, with individual illite crystals occurring as curved sheet perpendicular to the grain surfaces [46]. Durand and Rosenberg (1998) utilized cryo-SEM to observe large illite crystals that stacked in a habit close to that of kaolinite, characteristic of oil-wetting [47]. Buckman (2000) also noted spherical water droplets with contact angles greater than 90° over illite regions using ESEM, signifying oil-wet properties [48]. Consequently, the weak oil-wetting tendency of Sample C1 may be attributed to the presence of grain-coating illite. The oil-wetting nature of Sample C2, as evidenced by its well-developed grain-coating chlorite and oil films (Figure 10c,d), is consistent with the oil-wetting characteristics of grain-coating chlorite reported by Zhang et al. (2020) [46]. Samples C3 and C4 are characterized by the predominance of dispersed sheet-like chlorite and rosette chlorite as the primary clay minerals. These chlorite forms are relatively young, primarily resulting from the transformation of montmorillonite and illite, with some crystallized directly from pore fluids [49]. The chlorite formation potentially occurred post oil and gas charge, which could account for the typical water-wetting characteristics of dispersed sheet-like chlorite and rosette chlorite. The presence of these chlorite morphologies may be a significant contributor for the water-wetting characteristics in samples C3 and C4.
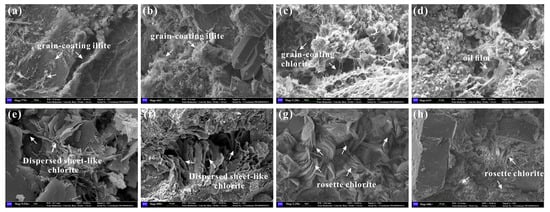
Figure 10.
SEM image illustrating microscopic mineral types and morphology. Images (a,b) from Sample C1 showing grain-coating illite; images (c,d) from Sample C2 showing grain-coating chlorite and associated oil film; images (e,f) from Sample C3 showing dispersed sheet-like chlorite; images (g,h) from Sample C4 showing the occurrence of rosette chlorite.
In order to investigate the effect of pore size on the wettability state, we calculated the percentage of pore volume in four typical tight sandstone samples with pore throat radii <0.1 μm, 0.1–1 μm, and >1 μm to the total volume and conducted a correlation analysis between different pore volume fractions and the oil/water wettability index (Figure 11). The results showed that the more developed the pores with radii less than 0.1 μm, the smaller their oil wettability index would be. The more developed the pores with radii of 0.1–1 μm and greater than 1 μm, the larger the oil wettability index would become. Pore sizes have a significant impact on the wetting state of tight sandstones, with larger pores being more likely to exhibit lipophilicity, while smaller pores tend to exhibit hydrophilicity.
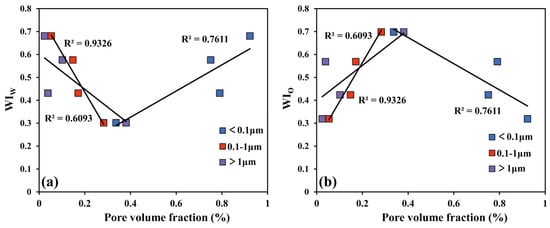
Figure 11.
Correlation diagram of pore volume fraction and wettability index (WI) for three pore radius ranges. (a) Pore volume fraction and water wettability index (WIw); (b) pore volume fraction and oil wettability index (WIo).
To characterize the wettability states of different pore sizes, a distribution model of wettability states across various pore sizes has been established (Figure 12). NMR measurements indicate that for the overall water-wetting samples, the pore size threshold between water-wet and oil-wet conditions is 1 μm, while for the overall oil-wet samples, this threshold is at 0.1 μm. The results indicate that, at the macroscopic scale, tight sandstone samples across different pore size ranges display a clear mixed wettability. This mixed wettability may be caused by the incursion of oil entering into an originally water-wet reservoir and causing wettability alteration, while the micropores remain water-filled due to high capillary forces [44,50]. Amphiphilic components in the crude oil (such as C0–C3 phenolic compounds) can interact directly with mineral surfaces through the water film, thereby providing an entryway for higher molecular weight components after the water film ruptures [51,52]. The adsorption of polar components in the crude oil on the pore walls alters the wettability of macropore, while micropores remain water-wet [53].
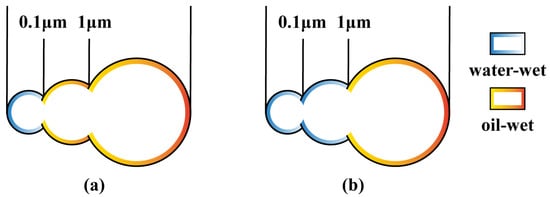
Figure 12.
Pore wettability and fluid distribution models. (a) The overall oil-wet sample; (b) the overall water-wetting sample (modified from Jiang et al. (2023) [20]).
6. Conclusions
On the basis of a comprehensive evaluation of the wettability of tight sandstone reservoirs in the lower-fourth member of the Shahejie Formation (Es4x), Bonan Sag, and Bohai Bay Basin, using a combination of ESEM, CA measurements, SI, and NMR experiments, the following conclusions can be drawn:
- (1)
- The comprehensive wettability investigation including ESEM, CA, SI, and NMR indicate that the four typical tight sandstone samples, C1, C2, C3, and C4, in the study area show weak oil wettability, strong oil wettability, water wettability, and strong water wettability, respectively. The ESEM analysis has revealed distinct wettability characteristics among the four tight sandstone samples, with samples displaying a spectrum of wettability at pore (micro) scales. The CA measurements indicate that at mesoscales only, Sample C2 exhibits intermediate wettability, while the other samples display water-wet characteristics. The SI experimenting results align with ESEM observations, confirming the wettability behavior observed at the micro-scale.
- (2)
- The SI and NMR experiments showed that pore sizes can significantly affect wettability, with a defined pore-size threshold between water-wet and oil-wet conditions. For the overall water-wet samples, the pore size threshold between water-wet and oil-wet conditions is 1 μm, while for the overall oil-wet samples, this threshold is at 0.1 μm. The wetting state of pore sizes in the range of 0.1 μm to 1 μm controls the overall wettability of the rock.
- (3)
- The morphology of clay minerals significantly influences wettability states. Grain-coating illite and grain-coating chlorite tend to exhibit oil-wet characteristics, while dispersed sheet-like chlorite and rosette chlorite are more likely to manifest as water-wet. The morphology of clay minerals is an important factor leading to the difference in wettability of different wells in the Bonan Sag.
- (4)
- Our study demonstrates that any individual wettability measurement methods would struggle to fully reflect the true wettability of tight sandstone reservoir. In contrast, an integrated multi-scale wettability measurement approach can take full advantage of the strengths of each technique, thereby enhancing the accuracy and reliability of wettability assessments, providing deeper insights into fluid behavior within the tight sandstone pore network.
Author Contributions
Conceptualization, J.C., K.L., G.L. and T.M.; Data curation, H.L., X.F. and X.H.; Formal analysis, J.C. and K.L.; Funding acquisition, K.L. and G.L.; Investigation, J.C. and L.Y.; Methodology, K.L. and Z.G.; Project administration, G.L., H.L. and T.M.; Resources, K.L. and H.L.; Software, Z.G.; Supervision, K.L.; Validation, J.C., K.L., L.Y. and T.M.; Visualization, X.F.; Writing—original draft, J.C.; Writing—review & editing, K.L. All authors have read and agreed to the published version of the manuscript.
Funding
This project is funded by a project from the Shandong Provincial government (No. 2020ZLYS08), a research-service project from the Shengli Oilfield Company, SINOPEC (No. 30200027-23-ZC0613-0010), and by the NSFC Innovation Group (No. 41821002).
Institutional Review Board Statement
Not applicable.
Informed Consent Statement
Not applicable.
Data Availability Statement
The data presented in this study are available on request from the corresponding author. The data are not publicly available due to privacy.
Acknowledgments
The Shengli Oilfield Company, SINOPEC, provided core and oil samples used for the experiments and various analyses, as well as regional geological data. Most of the analyses were carried out in the State Key Laboratory of Deep Oil and Gas, China University of Petroleum.
Conflicts of Interest
Authors Huimin Liu, Xuqing Fang, Xingzhong Hu, and Tao Meng were employed by the Shengli Oilfield Company. Author Lingjie Yu was employed by the Wuxi Institute of Petroleum Geology, SINOPEC. The remaining authors declare that the research was conducted in the absence of any commercial or financial relationships that could be construed as a potential conflict of interest.
References
- Sun, L.; Zou, C.; Jia, A.; Wei, Y.; Zhu, R.; Wu, S.; Guo, Z. Development Characteristics and Orientation of Tight Oil and Gas in China. Pet. Explor. Dev. 2019, 46, 1073–1087. [Google Scholar] [CrossRef]
- Zou, C.; Zhu, R.; Wu, S.; Yang, Z.; Tao, S.; Yuan, X.; Hou, L.; Yang, H.; Xu, C.; Li, D.; et al. Types, characteristics, genesis and prospects of conventional and unconventional hydrocarbon accumulations: Taking tight oil and tight gas in China as an instance. Acta Pet. Sin. 2012, 33, 173–187, (In Chinese with English Abstract). [Google Scholar]
- Cheng, Y.; Luo, X.; Hou, B.; Zhang, S.; Tan, C.; Xiao, H. Pore Structure and Permeability Characterization of Tight Sandstone Reservoirs: From a Multiscale Perspective. Energy Fuels 2023, 37, 9185–9196. [Google Scholar] [CrossRef]
- Aguilera, R. Flow Units: From Conventional to Tight-Gas to Shale-Gas to Tight-Oil to Shale-Oil Reservoirs. SPE Reserv. Eval. Eng. 2014, 17, 190–208. [Google Scholar] [CrossRef]
- Jia, C.; Zheng, M.; Zhang, Y. Unconventional Hydrocarbon Resources in China and the Prospect of Exploration and Development. Pet. Explor. Dev. 2012, 39, 139–146, (In Chinese with English Abstract). [Google Scholar] [CrossRef]
- Peng, S.; Ren, B.; Meng, M. Quantifying the Influence of Fractures for More-Accurate Laboratory Measurement of Shale Matrix Permeability Using a Modified Gas-Expansion Method. SPE Reserv. Eval. Eng. 2019, 22, 1293–1304. [Google Scholar] [CrossRef]
- Washburn, E.W. Note on a Method of Determining the Distribution of Pore Sizes in a Porous Material. Proc. Natl. Acad. Sci. USA 1921, 7, 115–116. [Google Scholar] [CrossRef]
- Jia, K.; Zeng, J.; Wang, X.; Li, B.; Gao, X.; Wang, K. Wettability of Tight Sandstone Reservoir and Its Impacts on the Oil Migration and Accumulation: A Case Study of Shahejie Formation in Dongying Depression, Bohai Bay Basin. Energies 2022, 15, 4267. [Google Scholar] [CrossRef]
- Afrapoli, M.S.; Crescente, C.; Alipour, S.; Torsaeter, O. The Effect of Bacterial Solution on the Wettability Index and Residual Oil Saturation in Sandstone. J. Pet. Sci. Eng. 2009, 69, 255–260. [Google Scholar] [CrossRef]
- Zhang, Y. The Wettability in Tight Sandstone Formations and Its Effects on Oil Migration and Accumulation. Ph.D. Thesis, China University of Petroleum, Beijing, China, 2019. (In Chinese with English Abstract). [Google Scholar]
- Ju, B.; Fan, T. Wettability Alteration and Its Effects on Production in Water Flooding. Pet. Sci. Technol. 2012, 30, 1692–1703. [Google Scholar] [CrossRef]
- Liu, G.; Wang, H.; Tang, J.; Liu, Z.; Yang, D. Effect of Wettability on Oil and Water Distribution and Production Performance in a Tight Sandstone Reservoir. Fuel 2023, 341, 127680. [Google Scholar] [CrossRef]
- Wang, Z.; Luo, X.; Liu, K.; Fan, Y.; Wang, X. Impact of Chlorites on the Wettability of Tight Oil Sandstone Reservoirs in the Upper Triassic Yanchang Formation, Ordos Basin, China. Sci. China Earth Sci. 2021, 64, 951–961. [Google Scholar] [CrossRef]
- Song, X.; Qin, Y.; Ma, H.; Waters, K.E.; Wang, Z.; Li, G. A New Method To Determine Wettability of Tight Sandstone: Water Imbibition Evaporation Rate Ratio Measurements. Energy Fuels 2019, 33, 1998–2007. [Google Scholar] [CrossRef]
- Habibi, A.; Dehghanpour, H.; Binazadeh, M.; Bryan, D.; Uswak, G. Advances in Understanding Wettability of Tight Oil Formations: A Montney Case Study. SPE Reserv. Eval. Eng. 2016, 19, 583–603. [Google Scholar] [CrossRef]
- Sharifigaliuk, H.; Mahmood, S.M.; Rezaee, R.; Saeedi, A. Conventional Methods for Wettability Determination of Shales: A Comprehensive Review of Challenges, Lessons Learned, and Way Forward. Mar. Pet. Geol. 2021, 133, 105288. [Google Scholar] [CrossRef]
- Siddiqui, M.A.Q.; Chen, X.; Iglauer, S.; Roshan, H. A Multiscale Study on Shale Wettability: Spontaneous Imbibition Versus Contact Angle. Water Resour. Res. 2019, 55, 5012–5032. [Google Scholar] [CrossRef]
- Mason, G.; Morrow, N.R. Developments in Spontaneous Imbibition and Possibilities for Future Work. J. Pet. Sci. Eng. 2013, 110, 268–293. [Google Scholar] [CrossRef]
- Yan, W.; Sun, J.; Golsanami, N.; Li, M.; Cui, L.; Dong, H.; Sun, Y. Evaluation of Wettabilities and Pores in Tight Oil Reservoirs by a New Experimental Design. Fuel 2019, 252, 272–280. [Google Scholar] [CrossRef]
- Jiang, Z.; Li, G.; Zhao, P.; Zhou, Y.; Mao, Z.; Liu, Z. Study on Spontaneous Imbibition and Displacement Characteristics of Mixed-Wet Tight Sandstone Reservoir Based on High-Precision Balance and NMR Method. Fuel 2023, 345, 128247. [Google Scholar] [CrossRef]
- Robin, M.; Combes, R.; Rosenberg, E. Cryo-SEM and ESEM: New Techniques to Investigate Phase Interactions within Reservoir Rocks. In Proceedings of the SPE Annual Technical Conference and Exhibition, Houston, TX, USA, 3–6 October 1999; SPE: Houston, TX, USA, 1999; Volume I, p. SPE-56829-MS. [Google Scholar]
- Robin, M.; Combes, R.; Degreve, F.; Cuiec, L. Wettability of Porous Media From Environmental Scanning Electron Microscopy: From Model To Reservoir Rocks. In Proceedings of the International Symposium on Oilfield Chemistry, Houston, TX, USA, 18–21 February 1997; SPE: Houston, TX, USA, 1997; p. SPE-37235-MS. [Google Scholar]
- Wang, Z. An Innovative Method for Quantitatively Measuring Mixed-Wettability States of Unconventional Reservoirs Based on Environmental Scanning Electron Microscope. In Proceedings of the GSA, Phoenix, AZ, USA, 22–26 September 2019. [Google Scholar]
- Hua, Y.; Guo, X.; Tao, Z.; He, S.; Dong, T.; Han, Y.; Yang, R. Mechanisms for Overpressure Generation in the Bonan Sag of Zhanhua Depression, Bohai Bay Basin, China. Mar. Pet. Geol. 2021, 128, 105032. [Google Scholar] [CrossRef]
- Lu, S.; Chen, G.; Wu, K.; Feng, D. Tectonic feature and evolution mechanism of central anticline belt of Dongying Sag, Bohai Bay Basin. Pet. Geol. Exp. 2013, 35, 274–279, (In Chinese with English Abstract). [Google Scholar]
- Ma, L.; Zheng, H. Structural Characteristics of the Central Uplift Belt in Dongying Sag, Bohai Bay Basin. Pet. Geol. Exp. 2006, 28, 103–108, (In Chinese with English Abstract). [Google Scholar]
- Qi, J. Two tectonic systems in the Cenozoic Bohai Bay basin and their genetic interpretation. Geol. China 2004, 31, 15–22, (In Chinese with English Abstract). [Google Scholar]
- Zhang, P.; Liu, J.; Meng, T.; Jiang, C.; Peng, P. Restoration of ancient structures in complex fault areas of faulted basins: Taking the lower section of the fourth member of Shahejie Formation in the Bonan Sag of Jiyang Depression of Bohai Bay Basin as an example. Nat. Gas Geosci. 2024, 35, 1973–1982, (In Chinese with English Abstract). [Google Scholar]
- Wang, M.; Wilkins, R.W.T.; Song, G.; Zhang, L.; Xu, X.; Li, Z.; Chen, G. Geochemical and Geological Characteristics of the Es3L Lacustrine Shale in the Bonan Sag, Bohai Bay Basin, China. Int. J. Coal Geol. 2015, 138, 16–29. [Google Scholar] [CrossRef]
- Yang, T. Genesis of High-Quality Reservoirs of Fan Delta Frontin Lower Part of the Fourth Member of Shahejie Formation in Bonan Subsag. Earth Sci.-J. China Univ. Geosci. 2015, 40, 2067, (In Chinese with English Abstract). [Google Scholar]
- Zhu, X.; Liu, Q.; Ge, J.; Dong, Y.; Zhu, S.; Tan, M.; Yang, Y. Reconstruction of Sediment-Dispersal Patterns Using Seismic Sedimentology in the Southeastern Zhanhua Sag, Bohai Bay Basin, China. J. Pet. Sci. Eng. 2019, 182, 106335. [Google Scholar]
- Fawad, N.; Liu, T.; Fan, D.; Ahmed, Q.A.; Kamran, M.; Ayub, G. Sequence Stratigraphic Divisions and Correlation of the Middle Sub-Member of Eocene Shahejie Formation in the Bonan Sag of Bohai Bay Basin (China): Implication for Facies and Reservoir Heterogeneities. Geoenergy Sci. Eng. 2023, 225, 211622. [Google Scholar] [CrossRef]
- Ren, S. Study on Reservoir Characteristics of the Lower Fourth Member of Shahejie Formation in Bonan Subsag. Master’s Thesis, China University of Petroleum (East China), Qingdao, China, 2021. (In Chinese with English Abstract). [Google Scholar]
- Wang, Z.; Luo, X.; Liu, K.; Lei, Y.; Zhang, L.; Cheng, M.; Wang, X. Evaluation of Pore-Scale Wettability in the Tight Sandstone Reservoirs of the Upper Triassic Yanchang Formation, Ordos Basin, China. Mar. Pet. Geol. 2022, 138, 105528. [Google Scholar] [CrossRef]
- Al-Naimi, K.; Arif, M.; Aboushanab, M.; Anjum, D.; Al Kobaisi, M.; Rahman, M.M.; Mahmoud, M.; Iglauer, S. Micro-Scale Wettability of Carbonate Rocks via High-Resolution ESEM Imaging. Results Phys. 2023, 52, 106871. [Google Scholar] [CrossRef]
- Treiber, L.E.; Owens, W.W. A Laboratory Evaluation of the Wettability of Fifty Oil-Producing Reservoirs. Soc. Pet. Eng. J. 1972, 12, 531–540. [Google Scholar] [CrossRef]
- Lan, Q.; Dehghanpour, H.; Wood, J.; Sanei, H. Wettability of the Montney Tight Gas Formation. SPE Reserv. Eval. Eng. 2015, 18, 417–431. [Google Scholar] [CrossRef]
- Lu, Y.; Liu, K.; Wang, Y. Applying NMR T2 Spectral Parameters in Pore Structure Evaluation—An Example from an Eocene Low-Permeability Sandstone Reservoir. Appl. Sci. 2021, 11, 8027. [Google Scholar] [CrossRef]
- Li, A.; Ren, X.; Wang, G.; Wang, Y.; Jiang, K. Characterization of Pore Structure of Low Permeability Reservoirs Using a Nuclear Magnetic Resonance Method. J. China Univ. Pet. Nat. Sci. 2015, 39, 92–98, (In Chinese with English Abstract). [Google Scholar]
- Deglint, H.J.; Clarkson, C.R.; DeBuhr, C.; Ghanizadeh, A. Live Imaging of Micro-Wettability Experiments Performed for Low-Permeability Oil Reservoirs. Sci. Rep. 2009, 7, 4347. [Google Scholar] [CrossRef]
- Li, P.; Zhang, J.; Rezaee, R.; Dang, W.; Li, X.; Fauziah, C.A.; Nie, H.; Tang, X. Effects of Swelling-Clay and Surface Roughness on the Wettability of Transitional Shale. J. Pet. Sci. Eng. 2021, 196, 108007. [Google Scholar] [CrossRef]
- Xue, H.; Dong, Z.; Tian, S.; Lu, S.; An, C.; Zhou, Y.; Li, B.; Xin, X. Characteristics of Shale Wettability by Contact Angle and Its Influencing Factors: A Case Study in Songliao. Front. Earth Sci. 2021, 9, 736938. [Google Scholar] [CrossRef]
- Anderson, W. Wettability Literature Survey- Part 2: Wettability Measurement. J. Pet. Technol. 1986, 38, 1246–1262. [Google Scholar] [CrossRef]
- Peng, S.; Shevchenko, P.; Ko, L.T. Shale Wettability: Untangling the Elusive Property with an Integrated Imbibition and Imaging Technique and a New Hypothetical Theory. SPE Reserv. Eval. Eng. 2023, 26, 40–50. [Google Scholar] [CrossRef]
- Sulucarnain, I.; Sondergeld, C.H.; Rai, C.S. An NMR Study of Shale Wettability and Effective Surface Relaxivity. In Proceedings of the SPE Canada Unconventional Resources Conference, Calgary, AB, Canada, 30 October–1 November 2012; SPE: Calgary, AB, Canada, 2012; p. SPE-162236-MS. [Google Scholar]
- Zhang, L.; Pan, B.; Wang, Y.; Guo, Y.; Li, W.; Wang, M. Relationship between pore-lining chlorite and wettability of rocks, and rock electrical parameters of sandstone. Geophys. Prospect. Pet. 2020, 59, 647–654. [Google Scholar]
- Durand, C.; Rosenberg, E. Fluid Distribution in Kaolinite- or Illite-Bearing Cores: Cryo-SEM Observations versus Bulk Measurements. J. Pet. Sci. Eng. 1998, 19, 65–72. [Google Scholar] [CrossRef]
- Buckman, J.O. Wettability Studies of Petroleum Reservoir Rocks. ESEM Appl. Note 2000, 10. [Google Scholar] [CrossRef]
- Tian, J.; Chen, Z.; Fan, Y.; Li, P.; Song, L. The occurrence growth mechanism and distribution of authigenic chlorite in sandstone. Bull. Mineral. Petrol. Geochem. 2008, 27, 200–206. [Google Scholar]
- Anderson, W.G. Wettability Literature Survey-Part 3: The Effects of Wettability on the Electrical Properties of Porous Media. J. Pet. Technol. 1986, 38, 1371–1378. [Google Scholar] [CrossRef]
- Bennett, B.; Buckman, J.O.; Bowler, B.F.J.; Larter, S.R. Wettability Alteration in Petroleum Systems: The Role of Polar Non-Hydrocarbons. Earth Sci.-J. China Univ. Geosci. 2015, 40, 2067. [Google Scholar]
- Taylor, P.; Larter, S.; Jones, M.; Dale, J.; Horstad, I. The Effect of Oil-Water-Rock Partitioning on the Occurrence of Alkylphenols in Petroleum Systems. Geochim. Cosmochim. Acta 1997, 61, 1899–1910. [Google Scholar] [CrossRef]
- Buckley, J.S. Effective Wettability of Minerals Exposed to Crude Oil. Curr. Opin. Colloid Interface Sci. 2001, 6, 191–196. [Google Scholar] [CrossRef]
Disclaimer/Publisher’s Note: The statements, opinions and data contained in all publications are solely those of the individual author(s) and contributor(s) and not of MDPI and/or the editor(s). MDPI and/or the editor(s) disclaim responsibility for any injury to people or property resulting from any ideas, methods, instructions or products referred to in the content. |
© 2025 by the authors. Licensee MDPI, Basel, Switzerland. This article is an open access article distributed under the terms and conditions of the Creative Commons Attribution (CC BY) license (https://creativecommons.org/licenses/by/4.0/).