Article

Numerical Investigation of Disturbance Characteristics of Surrounding Rock in Ultra-Close Coal Seams Mining Based on Particle Flow

1
Key Laboratory of Deep Coal Resource Mining, Ministry of Education, School of Mines, China University of Mining and Technology, Xuzhou 221116, China
2
School of Mines, Guizhou Institute of Technology, Guiyang 550003, China
*
Author to whom correspondence should be addressed.
Appl. Sci. 2025, 15(6), 3063; https://doi.org/10.3390/app15063063
Submission received: 22 February 2025 / Revised: 10 March 2025 / Accepted: 10 March 2025 / Published: 12 March 2025

Abstract

:
To reveal the influence of ultra-close coal seams mining on surrounding rock disturbance, PFC2D is introduced to establish a simplified particle flow model of strata in the deeply buried mine, the damage and stress evolution characteristics of the surrounding rock were studied based on double coal seam mining. The results show that after the model excavation, the fracture length of the rock strata reached an accuracy of 97% compared with the theoretical calculation results, showing a good match with the theoretical calculations and the initial stress level obtained by the subsequent model monitoring is consistent with the measured value. The primary and secondary key layers are broken as a result of mining the higher coal seam, the siltstone interlayer is unaffected while the bottom coal seam is partially harmed, and there is noticeable extrusion damage between the rocks. Meanwhile, the damage to the rocks inside the gob is only becoming worse as a result of mining the lower coal seam. While the surrounding rock of the upper coal seam mining exhibits clear stress redistribution features in three zones, the lower coal seam mining creates a local and multi-point high-stress distribution. The siltstone interlayer’s stress variation is essentially identical to that of the surrounding rock. The extrusion state among rocks is related to the porosity of the shattered surrounding rock area. The siltstone interlayer is pressured during the upper coal seam mining, but it maintains its integrity, only collapsing during the lower coal seam mining. Though the siltstone interlayer can retain the necessary integrity of support before the lower coal seam mining, its internal stress is unstable which should be paid attention to when designing the support scheme during the mining period.

1. Introduction

The structure of the 3rd coal seam in the Shanxi Formation of the Permian System in the western wing of the Dongtan mining area is highly complex, splitting into two distinct layers: the upper 3rd coal seam (3upper) and the lower 3rd coal seam (3lower). These seams are separated by a 4 m siltstone interlayer, which represents an ultra-close coal seam with significant implications for mining activities. In the global coal mining process, multi-seam mining is extremely common, and the spacing between coal seams and the mining sequence has a significant impact on the stability of the surrounding rock. This can easily lead to issues such as roof subsidence, rib spalling, and stress concentration, which contribute to rock layer damage and pose challenges to the safety of coal mine production. In the later stage of lower seam mining in the Dongtan mining area, roof support can only be limited to a 4 m layer of siltstone. Therefore, it is necessary to study the damaging effects of mining the 3upper and 3lower coal seams on the surrounding rock. In particular, the integrity of the thin sandstone layer and its associated stress distribution should be thoroughly examined. Understanding the damage characteristics of these layers provides crucial insights for supporting the surrounding rock during the mining of the lower 3lower coal seam. The mining of multiple coal seams, particularly in close proximity, is inherently more complex than the extraction of a single seam. Numerous studies, both domestic and international, have explored these challenges through field monitoring, theoretical analysis, physical modeling, and numerical simulation.
Some researchers have attempted to establish observation stations on the surface to monitor long-term strata movement, analyzing the influence of mining speed and distance on the displacement of overlying strata at different stages of coal seam extraction [1]. Other studies have utilized boreholes that penetrate multiple coal seams to monitor the induced strata subsidence and interlayer shear during mining activities [2,3,4]. However, field monitoring data alone can only provide a superficial understanding of the phenomena. To more accurately characterize the fracturing behavior induced by multi-coal seam mining, theoretical models have been proposed for calculation [5,6], with analytical solutions or computational criteria derived from mathematical and mechanical theories. In addition, to assess the specific structural evolution, stress redistribution, and strata movement caused by multi-coal seam mining, physical models are employed for similarity simulations [7,8,9]. Nevertheless, with the increasing complexity of these issues, both approaches face certain limitations. The complexity of theoretical models often leads to cumbersome analytical processes, while physical model construction can be challenging, as it is difficult to replicate the exact field conditions.
Compared to theoretical analysis, numerical simulation offers higher levels of visualization and more intuitive results. Moreover, numerical simulations provide better engineering compatibility and greater ease of variable control and monitoring than physical models. For these types of engineering challenges, finite element method (FEM) and discrete element method (DEM) are commonly used for modeling and analysis. FLAC3D, a widely employed numerical simulation software based on the finite difference method, is particularly effective for simulating stress and deformation in the surrounding rock induced by multi-coal seam mining [10,11,12,13,14,15,16]. FLAC3D has been used to analyze the impacts of multi-layer mining on strata stability [17], stress unloading [18], and the nonlinear superposition of stress [19]. While finite element-based simulations focus primarily on stress and deformation [20], discrete element methods more effectively visualize the evolution of rock mass structures during mining [21,22,23,24,25]. In particular, The Particle Flow Code (PFC) can not only be combined with finite element methods to study energy release and the fracture development process in surrounding rock [26,27] but also accurately characterize the entire process of mining-induced rock mass damage and fracture, including initiation, propagation, and coalescence [28,29,30,31,32], while also enabling real-time monitoring of pore evolution in damaged areas.
While substantial research has been conducted on the disturbance effects of ultra-close double coal seam mining on surrounding rocks, relatively few studies focus on cases where extremely thin siltstone interlayer—critical for roof support during the mining of lower coal seams—exist between closely spaced coal seams with relatively deep burial. This specific condition has significant implications for mining safety. This paper aims to develop a PFC2D-based particle flow model to investigate the damage and failure evolution of the surrounding rock and siltstone interlayer before and after two mining activities. The findings are intended to provide valuable insights for the design of subsequent roadway support systems.

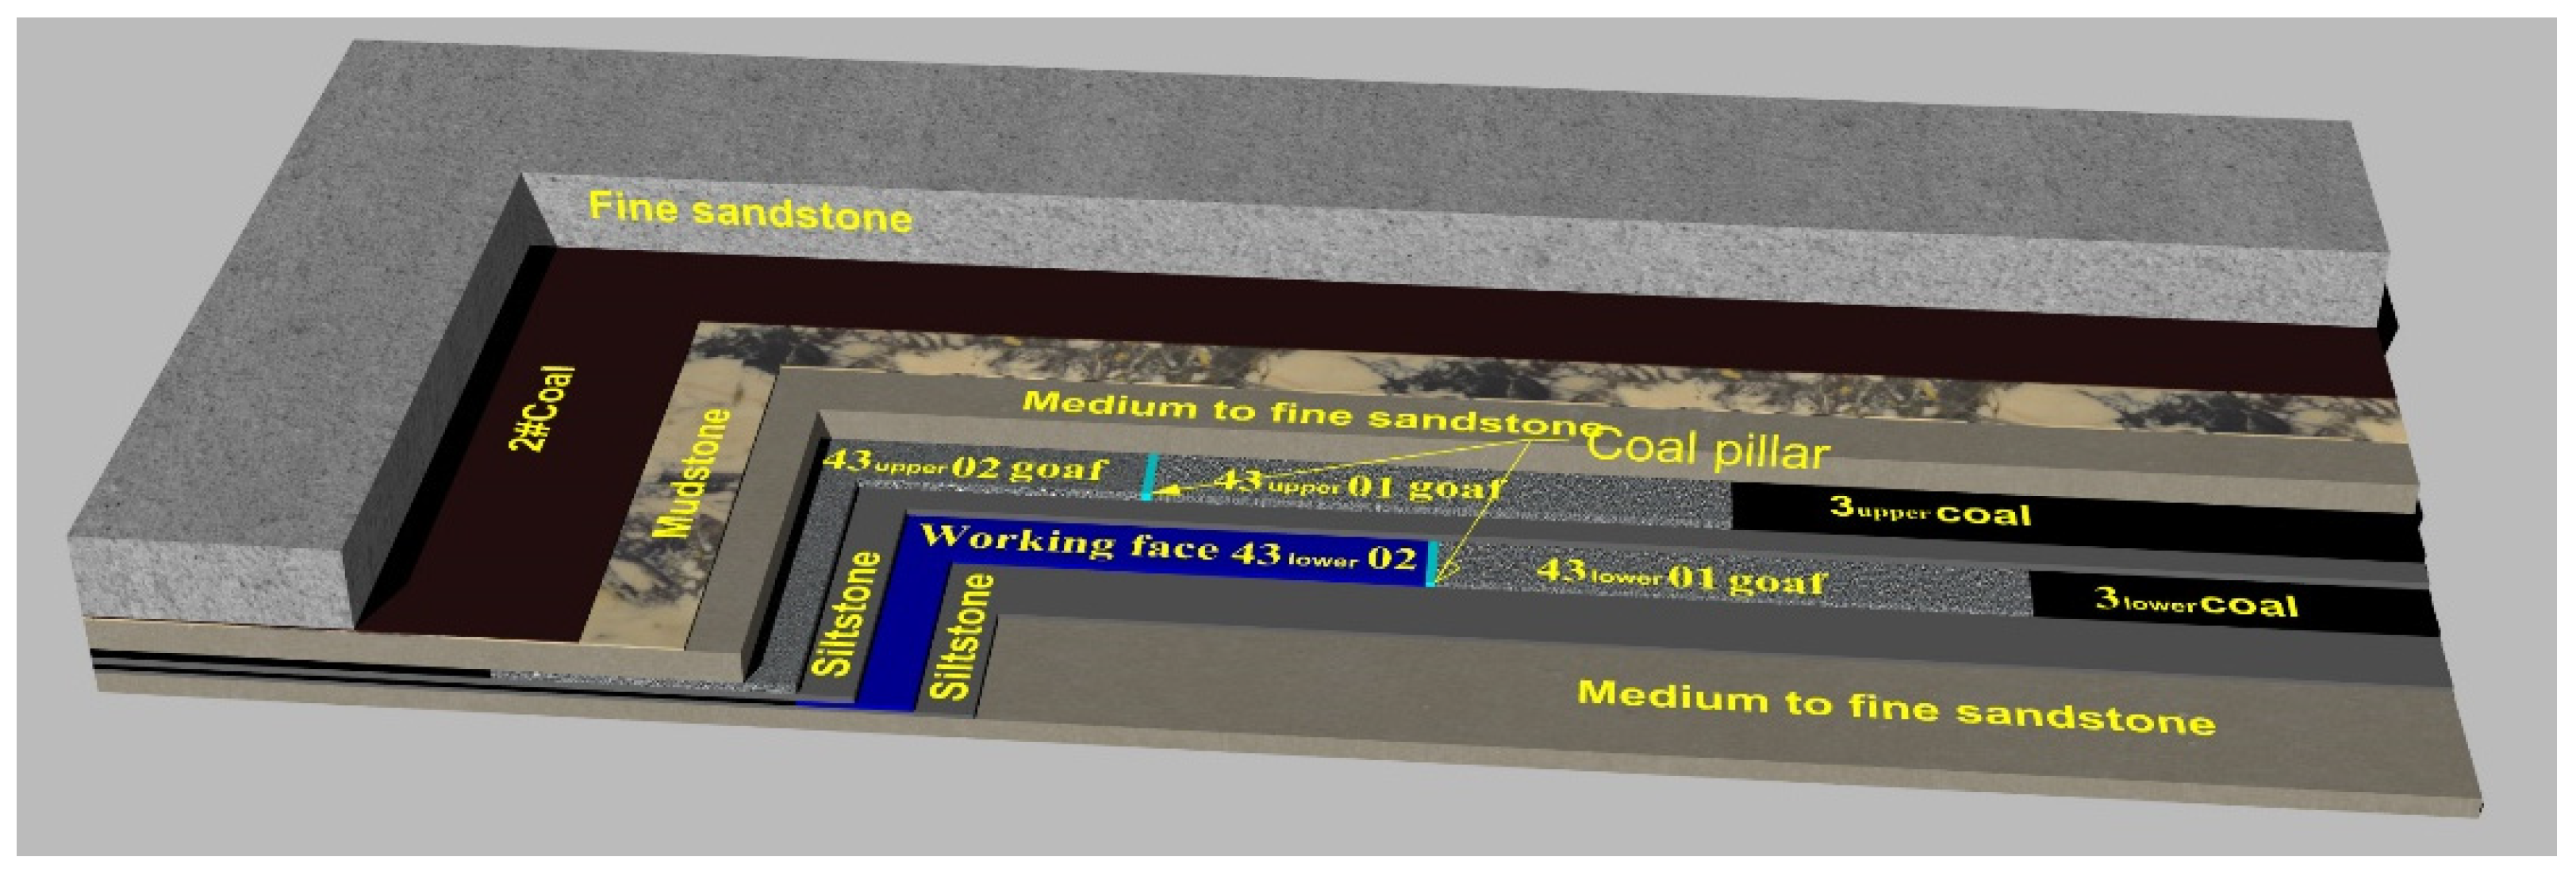
2. Engineering Conditions

In the Dongtan Coal Mine, the 3rd coal seam in Mining District 4 is subdivided into two distinct layers: the 3upper and 3lower coal seams. The depth of the 3lower coal seam varies from 605.31 m to 700.31 m, with an average depth exceeding 650 m. A siltstone interlayer, ranging in thickness from 2.35 m to 6.05 m (with an average thickness of 4 m), separates the two coal seams. This study focuses on the 43lower01 and 43lower02 working faces, as well as the overlying 43upper01 and 43upper02 working faces. The 43lower02 working face is bordered by the mined-out areas of the 43lower04 (north) and 43lower03 working faces on either side, with the 43upper01 and 43upper02 longwall mining faces above and their associated mined-out areas. The design length of the working face is 300 m, and the advance length exceeds 1500 m. The layout of the working faces and the surrounding strata conditions are shown in Figure 1, while the physical and mechanical parameters of the adjacent rock layers are provided in Table 1. In-situ stress measurement results for the 3lower coal seam, as supplied by the mine, are presented in Table 2.

3. Numerical Simulation Model Development and Testing

3.1. Research Approach

A deep mining working face model is developed using the Particle Flow Code 2D (PFC2D). Due to the complexity of the strata and the extensive area of the mining face, the model would require a significantly large overall size, a high number of particles, and substantial computational resources. As a result, simulations for deep mining faces using PFC2D are relatively scarce. Therefore, it is essential to simplify the numerical model within reasonable bounds. The approach for model simplification is outlined as follows:
  • Reduction in the number of strata in the vertical direction: In the simulation process, the strata directly related to the immediate roof and the coal seam play an important role. Therefore, only the portions directly related to these strata are selected. To eliminate the influence of other strata and ensure the accuracy of the model, the remaining overlying strata are replaced by a single flexible cluster with equivalent weight, based on the results of the in-situ stress test. For this study, only the layers from the 3upper coal seam to the second thick hard roof, and from the 3lower coal seam to the first thick hard floor, are retained. This results in a total of nine layers of rock, with a height of 94.66 m.
  • Reduction in the lateral dimensions of the working face: A stress model for the main roof is developed, and the breakage length of the roof strata is determined through limit analysis. Based on these results, the width of the working face is reduced, which in turn minimizes the overall model length.
  • Adjustment of particle size: Given that the study focuses on the macro-scale structural evolution and its impact, the size of the particles is increased accordingly.
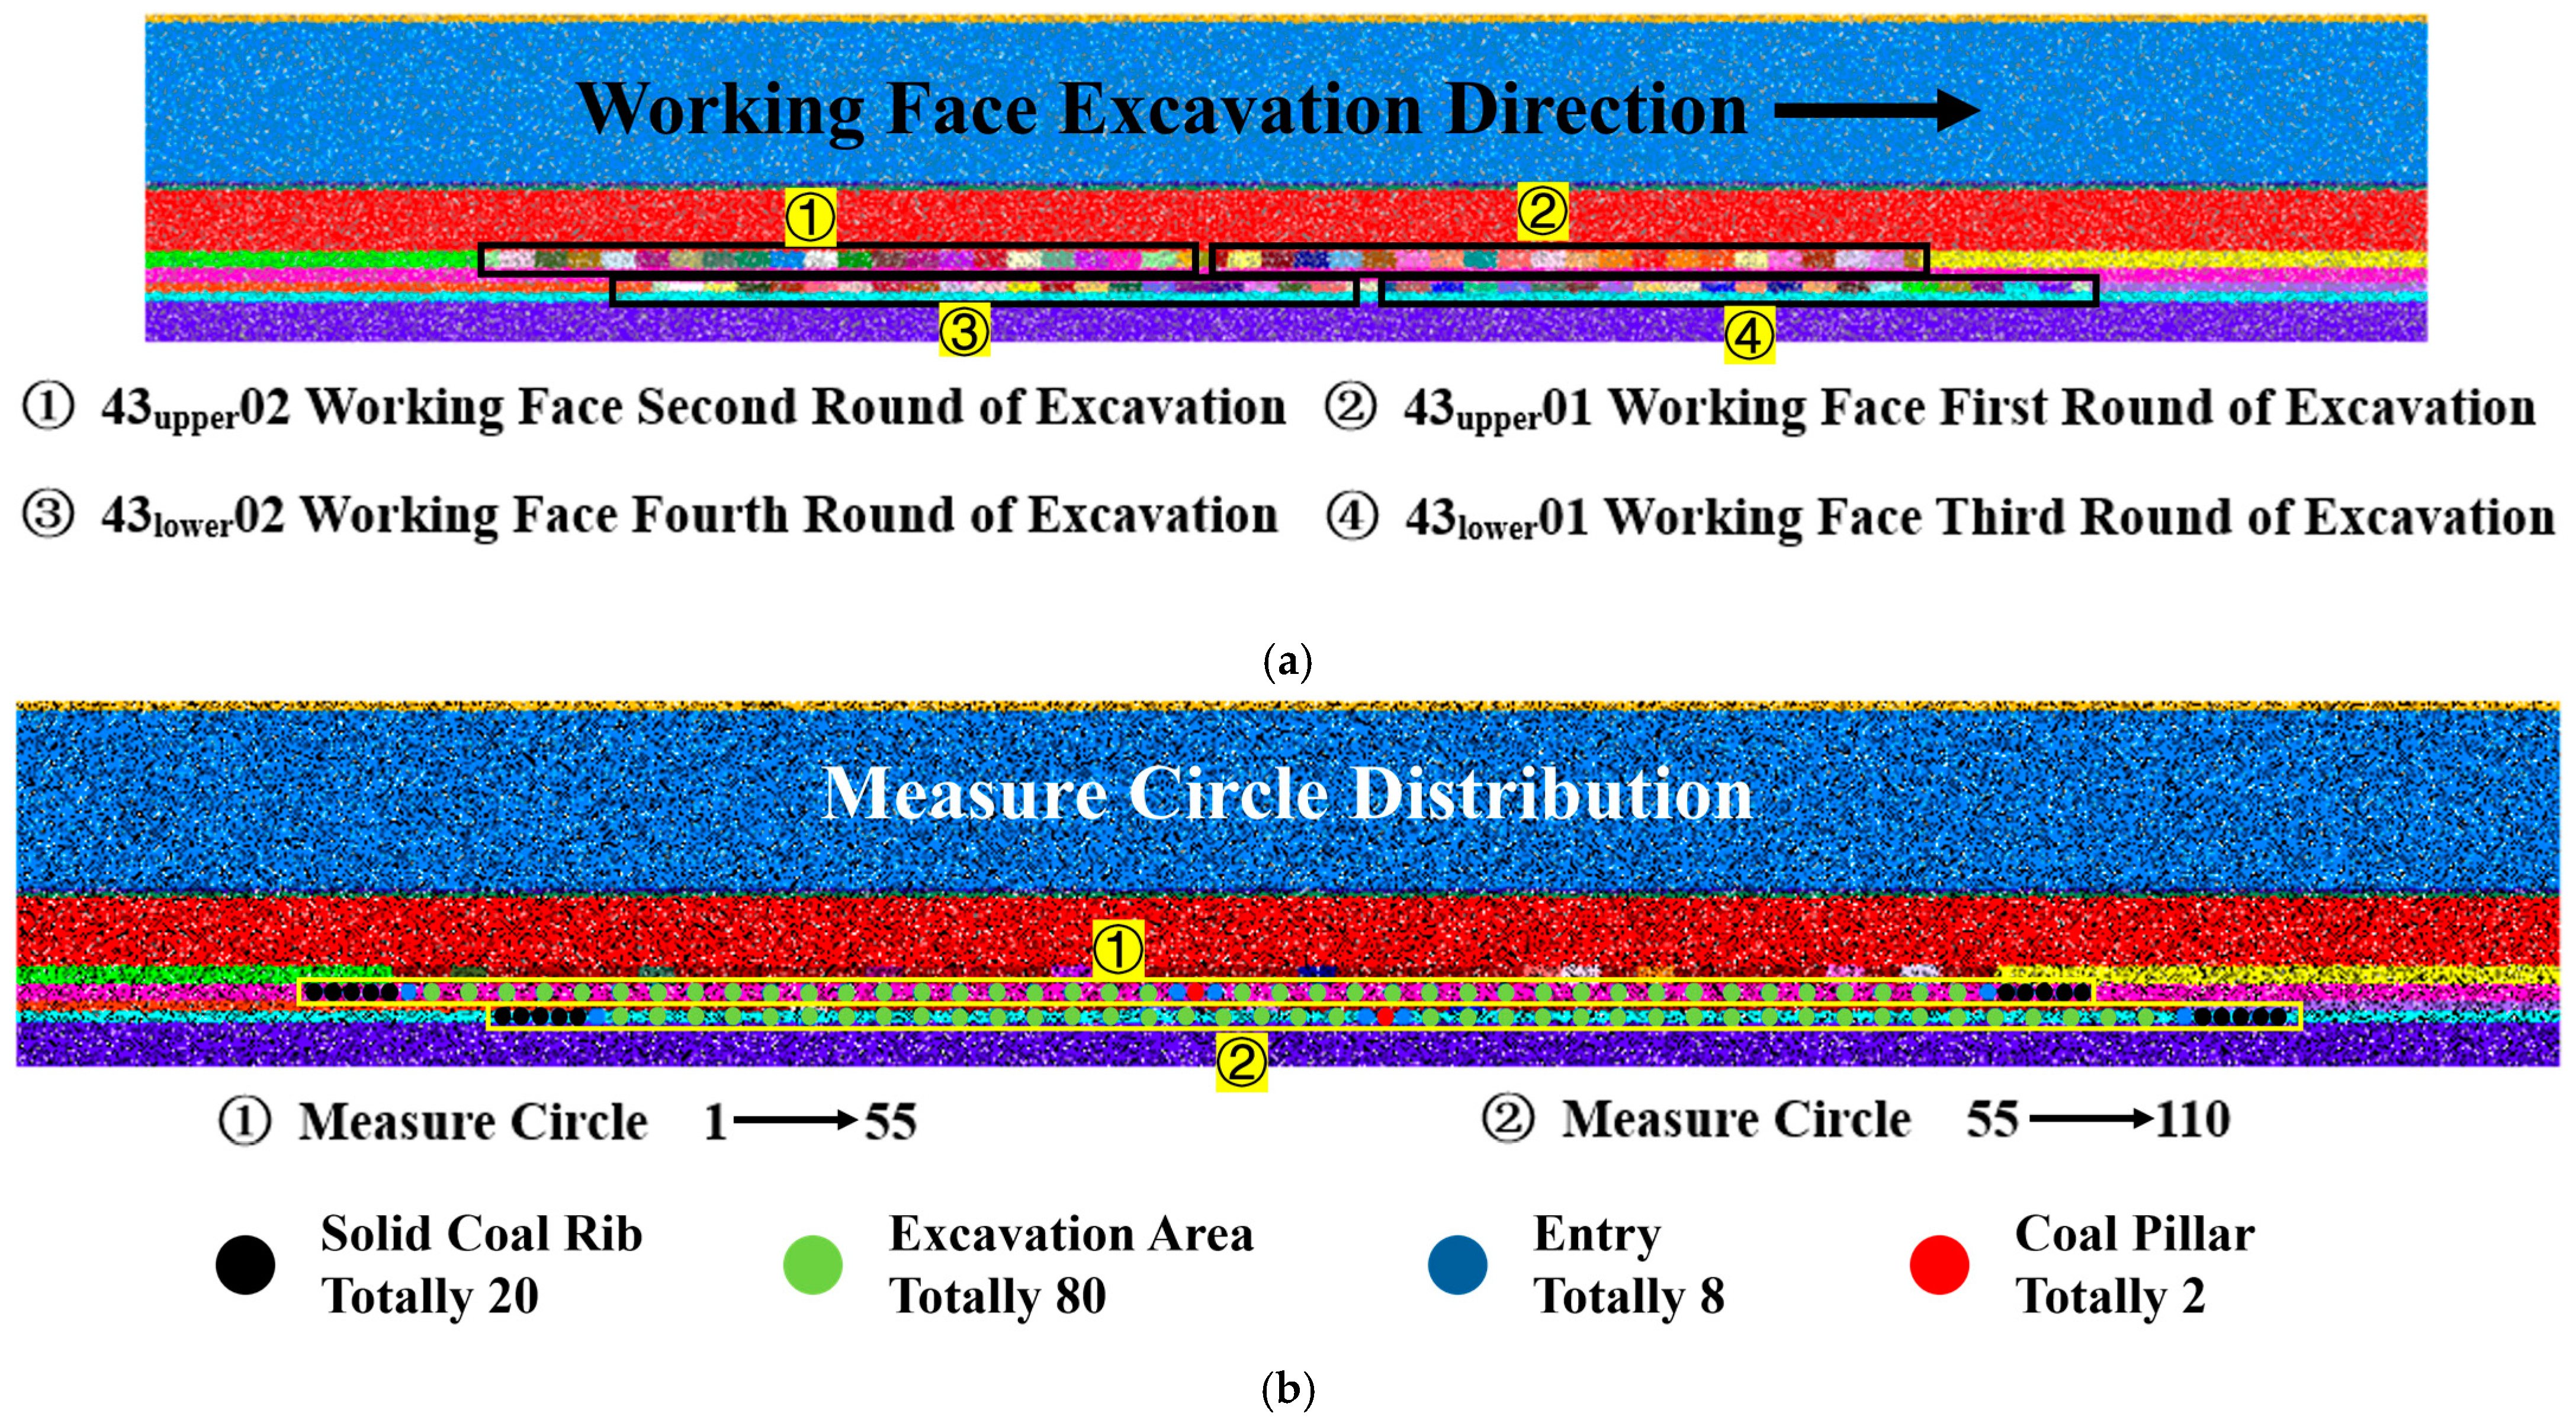
Based on the limit analysis of a simply supported beam [33], the minimum working face length required to induce failure in the critical strata is determined.
L B = 2 h 2 σ t 3 q
The parameter LB represents the ultimate breakage length, or minimum breakage length, of the critical layer (m); h is the thickness of the critical layer (m); σt is the tensile strength (MPa); and q denotes the self-load of the strata (kN). All these parameters can be obtained directly or indirectly from Table 1.
Based on the calculations, the theoretical breakage length of the first fine sandstone layer, under the influence of its self-weight, is determined to be 99.7 m, while the theoretical breakage length of the fourth fine sandstone layer is 90.01 m.
The theoretical results indicate that the breakage length of the two thick hard roof layers above the 3rd coal seam does not exceed 100 m under their respective gravitational forces. Moreover, the 3upper coal seam is essentially in a mined-out state, where the impact of the remaining coal pillars is negligible. Consequently, the length of the working face can be reduced to 200 m, and the lateral extent of the model can be reduced to 675 m.
The corrected parameters are assigned to each layer in the model. Measurement circles are placed, and data recording types are designed. Real-time evolution images of crack propagation, stress, and porosity changes are automatically generated to analyze the damage evolution characteristics. The model is then initiated, with excavation distributed across the working face in 10 m steps, continuing until completion.

3.2. Model Design

To minimize boundary effects, at least 100 m of solid coal is retained between the mined-out area and the model boundary. The model dimensions are set to 675 m × 97 m, including nine layers of strata and one cluster layer. The initial porosity is set at 0.05, and the particle radius ranges from 0.36 m to 0.54 m. A parallel bond model is employed between particles, while a linear bond model is applied between the particles and the walls. The particles reach equilibrium under an initial gravitational setting of 9.81 m/sec2. After removing excess particles, different groups are assigned and parameters specified. The model is considered stable when the unbalanced force is reduced to below 10−5.
The mining process involves two coal seams (3upper and 3lower) and four working faces, with their spatial distribution shown in Figure 2a. Four measurement circles, each with a diameter of 2 m, are placed at the roof of the 3upper coal seam and within the siltstone interlayer between the two coal seams, totaling 110 points, as illustrated in Figure 2b.
Prior to the simulation, a trial-and-error iterative method was employed to calibrate the mesoscopic parameters of each rock layer. Through this iterative process, the microscopic mechanical parameters were continuously adjusted to achieve the best possible match between the macroscopic parameters—such as the elastic modulus, peak stress, and Poisson’s ratio—derived from the numerical simulations and those obtained from laboratory experiments. The calibration results are presented in Table 3.

4. Simulation Results and Analysis

4.1. Formatting of Mathematical Components

After the mining of the 43upper01 working face, as shown in Figure 3, significant bending, subsidence, and fracturing of the overlying strata were observed. The simulation results indicate that the initial fracture lengths of the primary and secondary key strata were 97 m and 87.2 m, respectively, which are in close agreement with theoretical calculations. Following the initial fracturing of the secondary key stratum, the subsequent collapse length shortened with ongoing mining but generally remained stable. At this point, the fractures were primarily macroscopic and distributed within the primary and secondary key strata above the 43upper01 working face.
After mining of the 43upper02 working face, as depicted in Figure 4, it was observed that the overlying strata of the 43upper01 working face had largely collapsed to the floor. The A and B regions within the primary and secondary key strata showed a significant increase in damage-induced fractures due to tensile and compressive effects, which were easily distinguishable. In contrast, only a small number of fractures developed in the overlying strata of the 43upper02 working face, which exhibited an overall tilting state. At location C, distinct layer misalignment and extrusion were observed. It is noteworthy that due to mining activities in the coal seam above, the 3lower coal seam had already been affected, with prominent damage fractures developed in the D and E sections, while the interbedded rock layer between the two coal seams remained largely unaffected.
Upon completion of mining at the 43lower01 working face, as shown in Figure 5, the siltstone interlayer between the two coal seams was largely in a state of continuous collapse due to ongoing mining. The overlying primary and secondary key strata showed significantly increased damage levels from secondary mining, with a notable reduction in their integrity. Subsidence effects from the overlying strata induced by fracturing in the previous coal seam were evident. After mining of the 43lower02 working face, aside from slight enhancement of fracturing in the primary and secondary key strata, the siltstone interlayer maintained its integrity.
After the mining of the 43lower02 working face, as shown in Figure 6, the damage to the overlying strata from multiple mining activities was evident, with a high degree of rock fragmentation. However, the damage to the surrounding rock was largely confined to the overlying strata, and the integrity of the side and floor rocks of the mining area was scarcely affected.

4.2. Stress Analysis of the Surrounding Rock Induced by Mining Activities

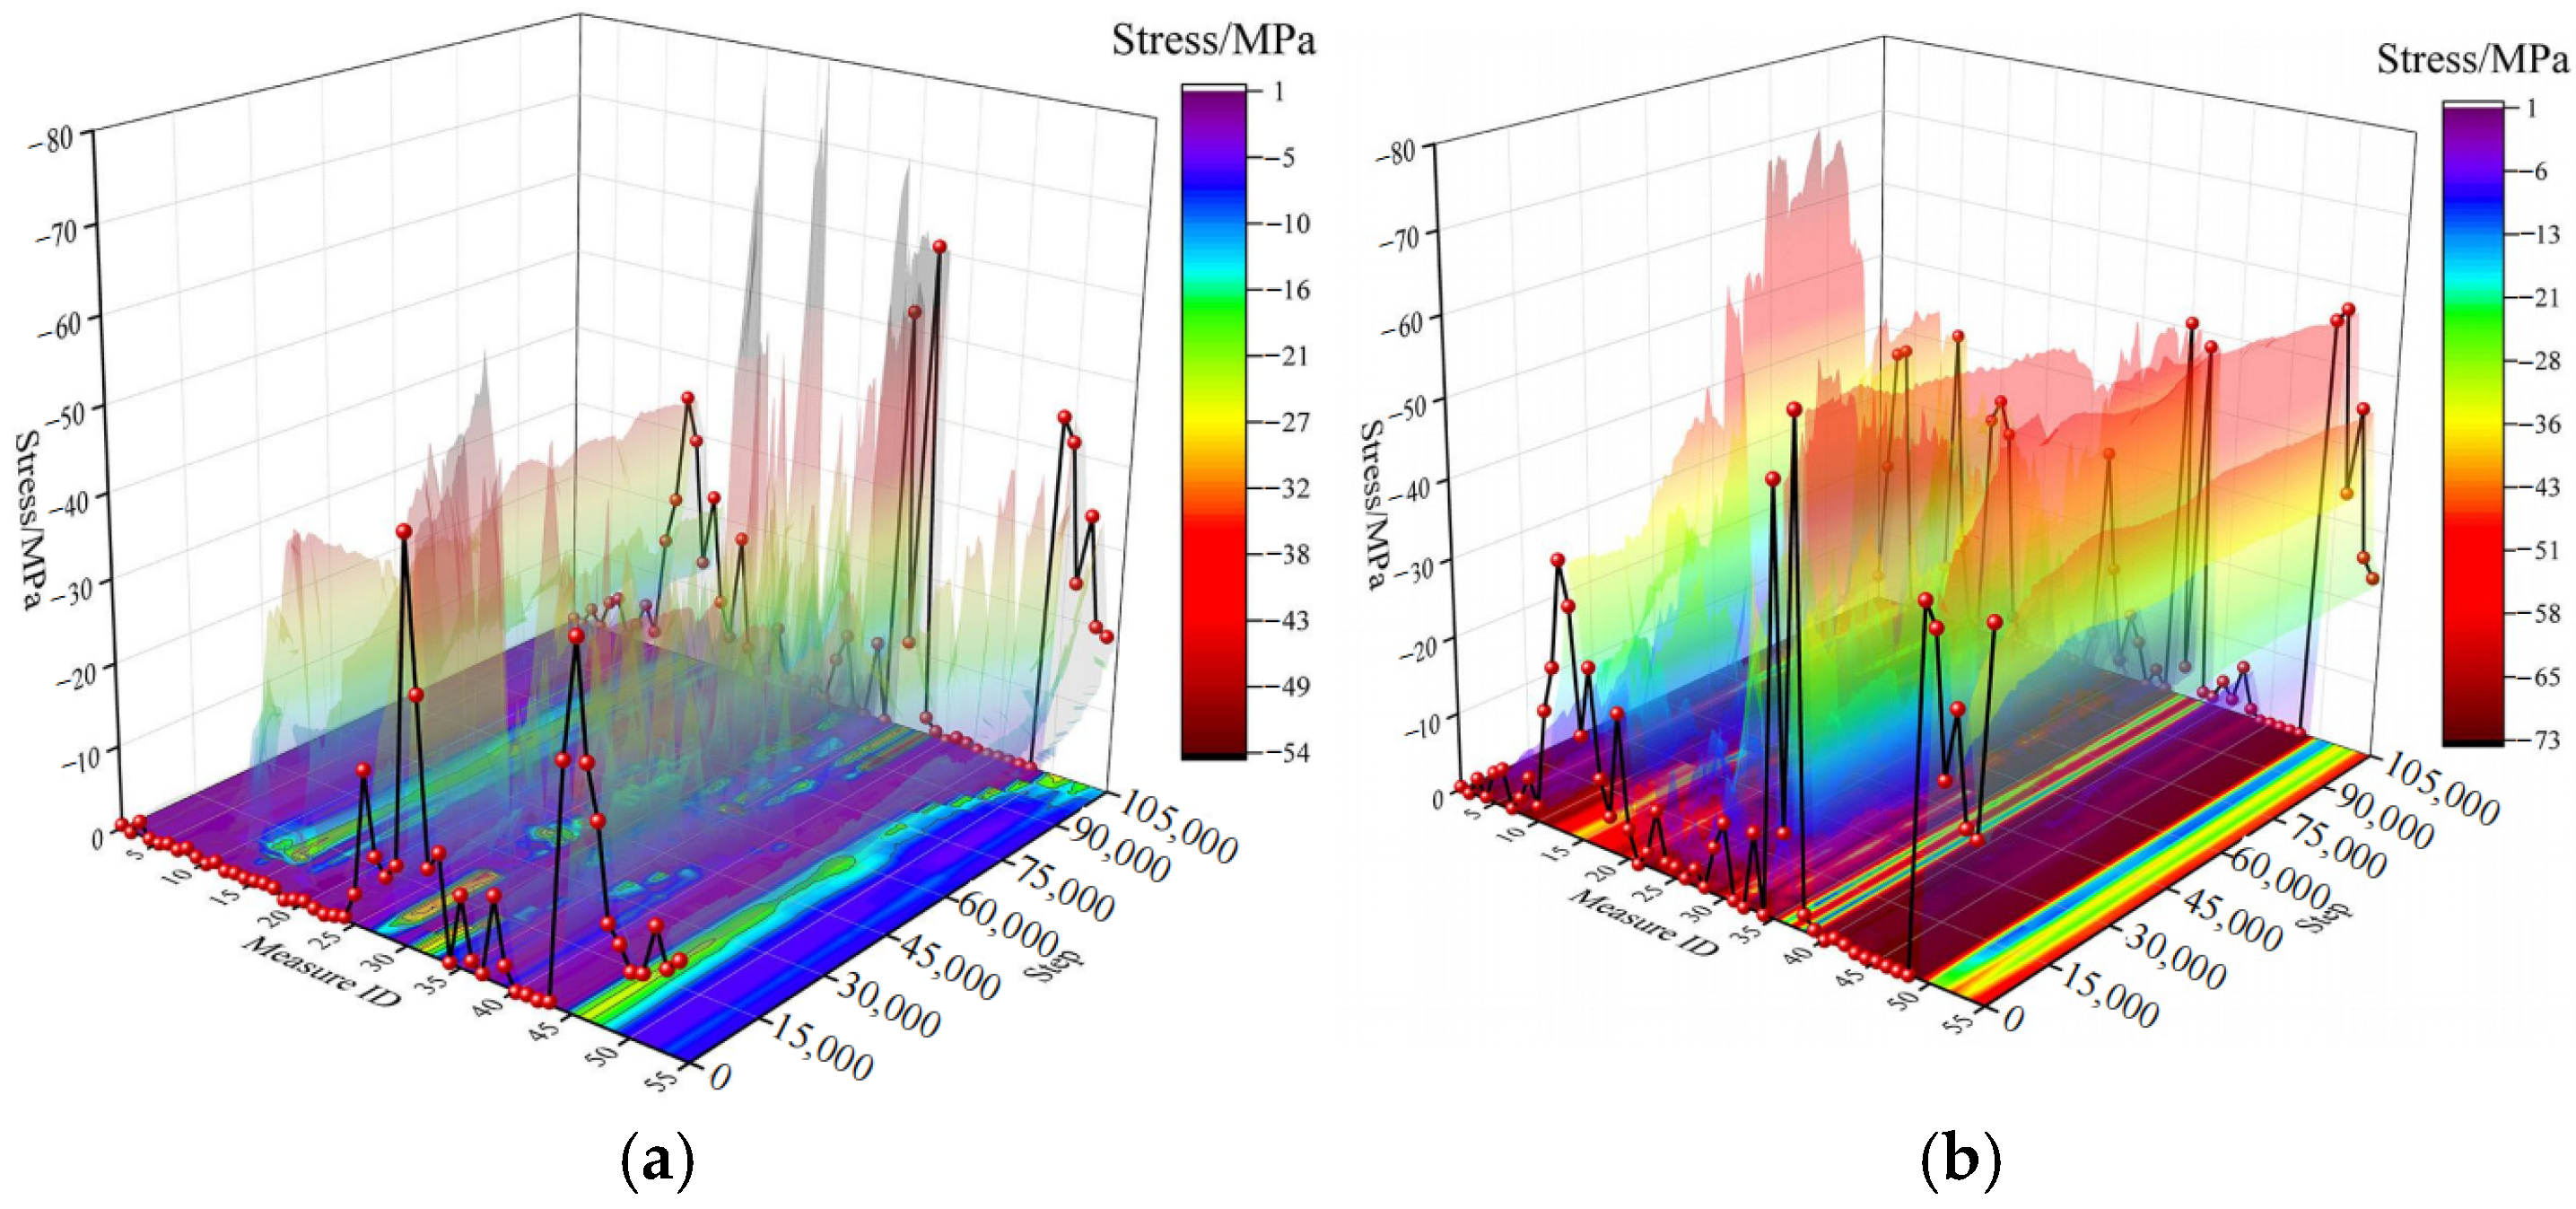
4.2.1. Global Stress Distribution of the Surrounding Rock

As shown in Figure 7, each excavation phase induced significant stress redistribution. After the excavation of the 43lower01 working face, a dramatic change in surrounding rock stress was observed, with a distinct high-stress zone located at the edge of the mined-out area. Local stress in this area could exceed 70 MPa, though it remained largely outside the range of excavation activities. The stress in the surrounding rock beneath the mined-out area generally decreased, with values ranging from −0.8 MPa to 1 MPa. Moving from the edge of the mined-out area toward unmined strata, stress gradually transitioned from high to initial levels.
Upon completion of mining at the 43upper02 working face, the stress redistribution followed a similar pattern to that of the 43lower01 working face. However, by this stage, the fractured rock from the 43upper01 mined-out area had largely collapsed, causing irregular rock block contact, which induced localized stress concentration primarily in the secondary key strata and siltstone interlayer, with stress levels exceeding 56 MPa.
By the completion of mining at the 43lower01 working face, it became difficult to distinguish the stress redistribution characteristics typical of individual coal seam extractions. Local and multi-point stress concentrations, resulting from rock collapses and irregular block contacts, led to an overall stress state in the coal seam range, with the highest stress remaining below 30 MPa.
After the 43lower02 working face was mined, localized, multi-point stress concentrations in the mined-out area persisted. It is noteworthy that the stress distribution at the edge of the mined-out area varied due to the different collapse states of the primary and secondary key strata. On the 43lower02 side, where the primary and secondary key strata had completely collapsed, rock block contact maintained a high-stress transmission state, and the stress concentration was primarily found at the fracture zones above the mined-out area. On the 43lower01 side, where the primary and secondary key strata remained in a cantilevered state, a significant stress concentration was observed at the edge of the mined-out area.
Comparing the fracture state diagrams for each excavation stage, it is evident that the high-stress regions are typically located at the edges of the mined-out area, with high-stress zones within the mined-out area found between relatively intact rock blocks or at the contact points between rock blocks and surrounding strata.

4.2.2. Stress Evolution of the Siltstone Interlayer

After the mining of the 43upper01 working face, the stress of the top and floor strata is shown in Figure 8a,b. As mining continued, the extent of the mined-out area increased, and the stress of the surrounding rock near the edge of the mined-out area showed a fluctuating rise, with edge stress reaching between 57 and 60 MPa. The stress at the floor edge remained in the range of 45 to 55 MPa. Within a small distance from the edge of the mined-out area, the surrounding rock stress sharply decreased below the initial level, with top and floor stress dropping to approximately 10 MPa. Thereafter, the stress of the top and floor strata remained close to the initial level. Overall, the final mining stress exhibited distinct stress zoning characteristics: an elevated stress zone, a reduced stress zone, and an initial rock stress zone.
After mining at the 43upper02 working face, the stress of the top and floor strata followed a similar trend, as shown in Figure 9a,b. After mining of the 43upper02 working face, the stress in the top and floor strata remained at a near-zero level, while the previous top and floor stress in the 43upper01 working face transitioned to a non-uniform multi-peak stress state, with maximum stress levels of 70 MPa at the roof and 47 MPa at the floor. The mining of the 3lower coal seam, influenced by initial mining activities, caused the top and floor strata to exhibit nearly identical characteristics, apart from differing stress levels.
As shown in Figure 10a,b, prior to the mining of the 3lower coal seam, the siltstone interlayer did not display the initial rock stress level observed in the 3upper coal seam, nor the stress zonation characteristic seen after mining. Instead, the originally non-uniform multi-peak stress state became more chaotic, with a significant increase in the number of stress peak points. It is worth noting that, although the stress in the interbedded rock layer after secondary mining exhibited a chaotic multi-peak state, the overall stress range remained almost consistent with the pre-mining state, with only localized stress values showing a marked increase.

4.3. Dynamic Evolution of Rock Layer Porosity

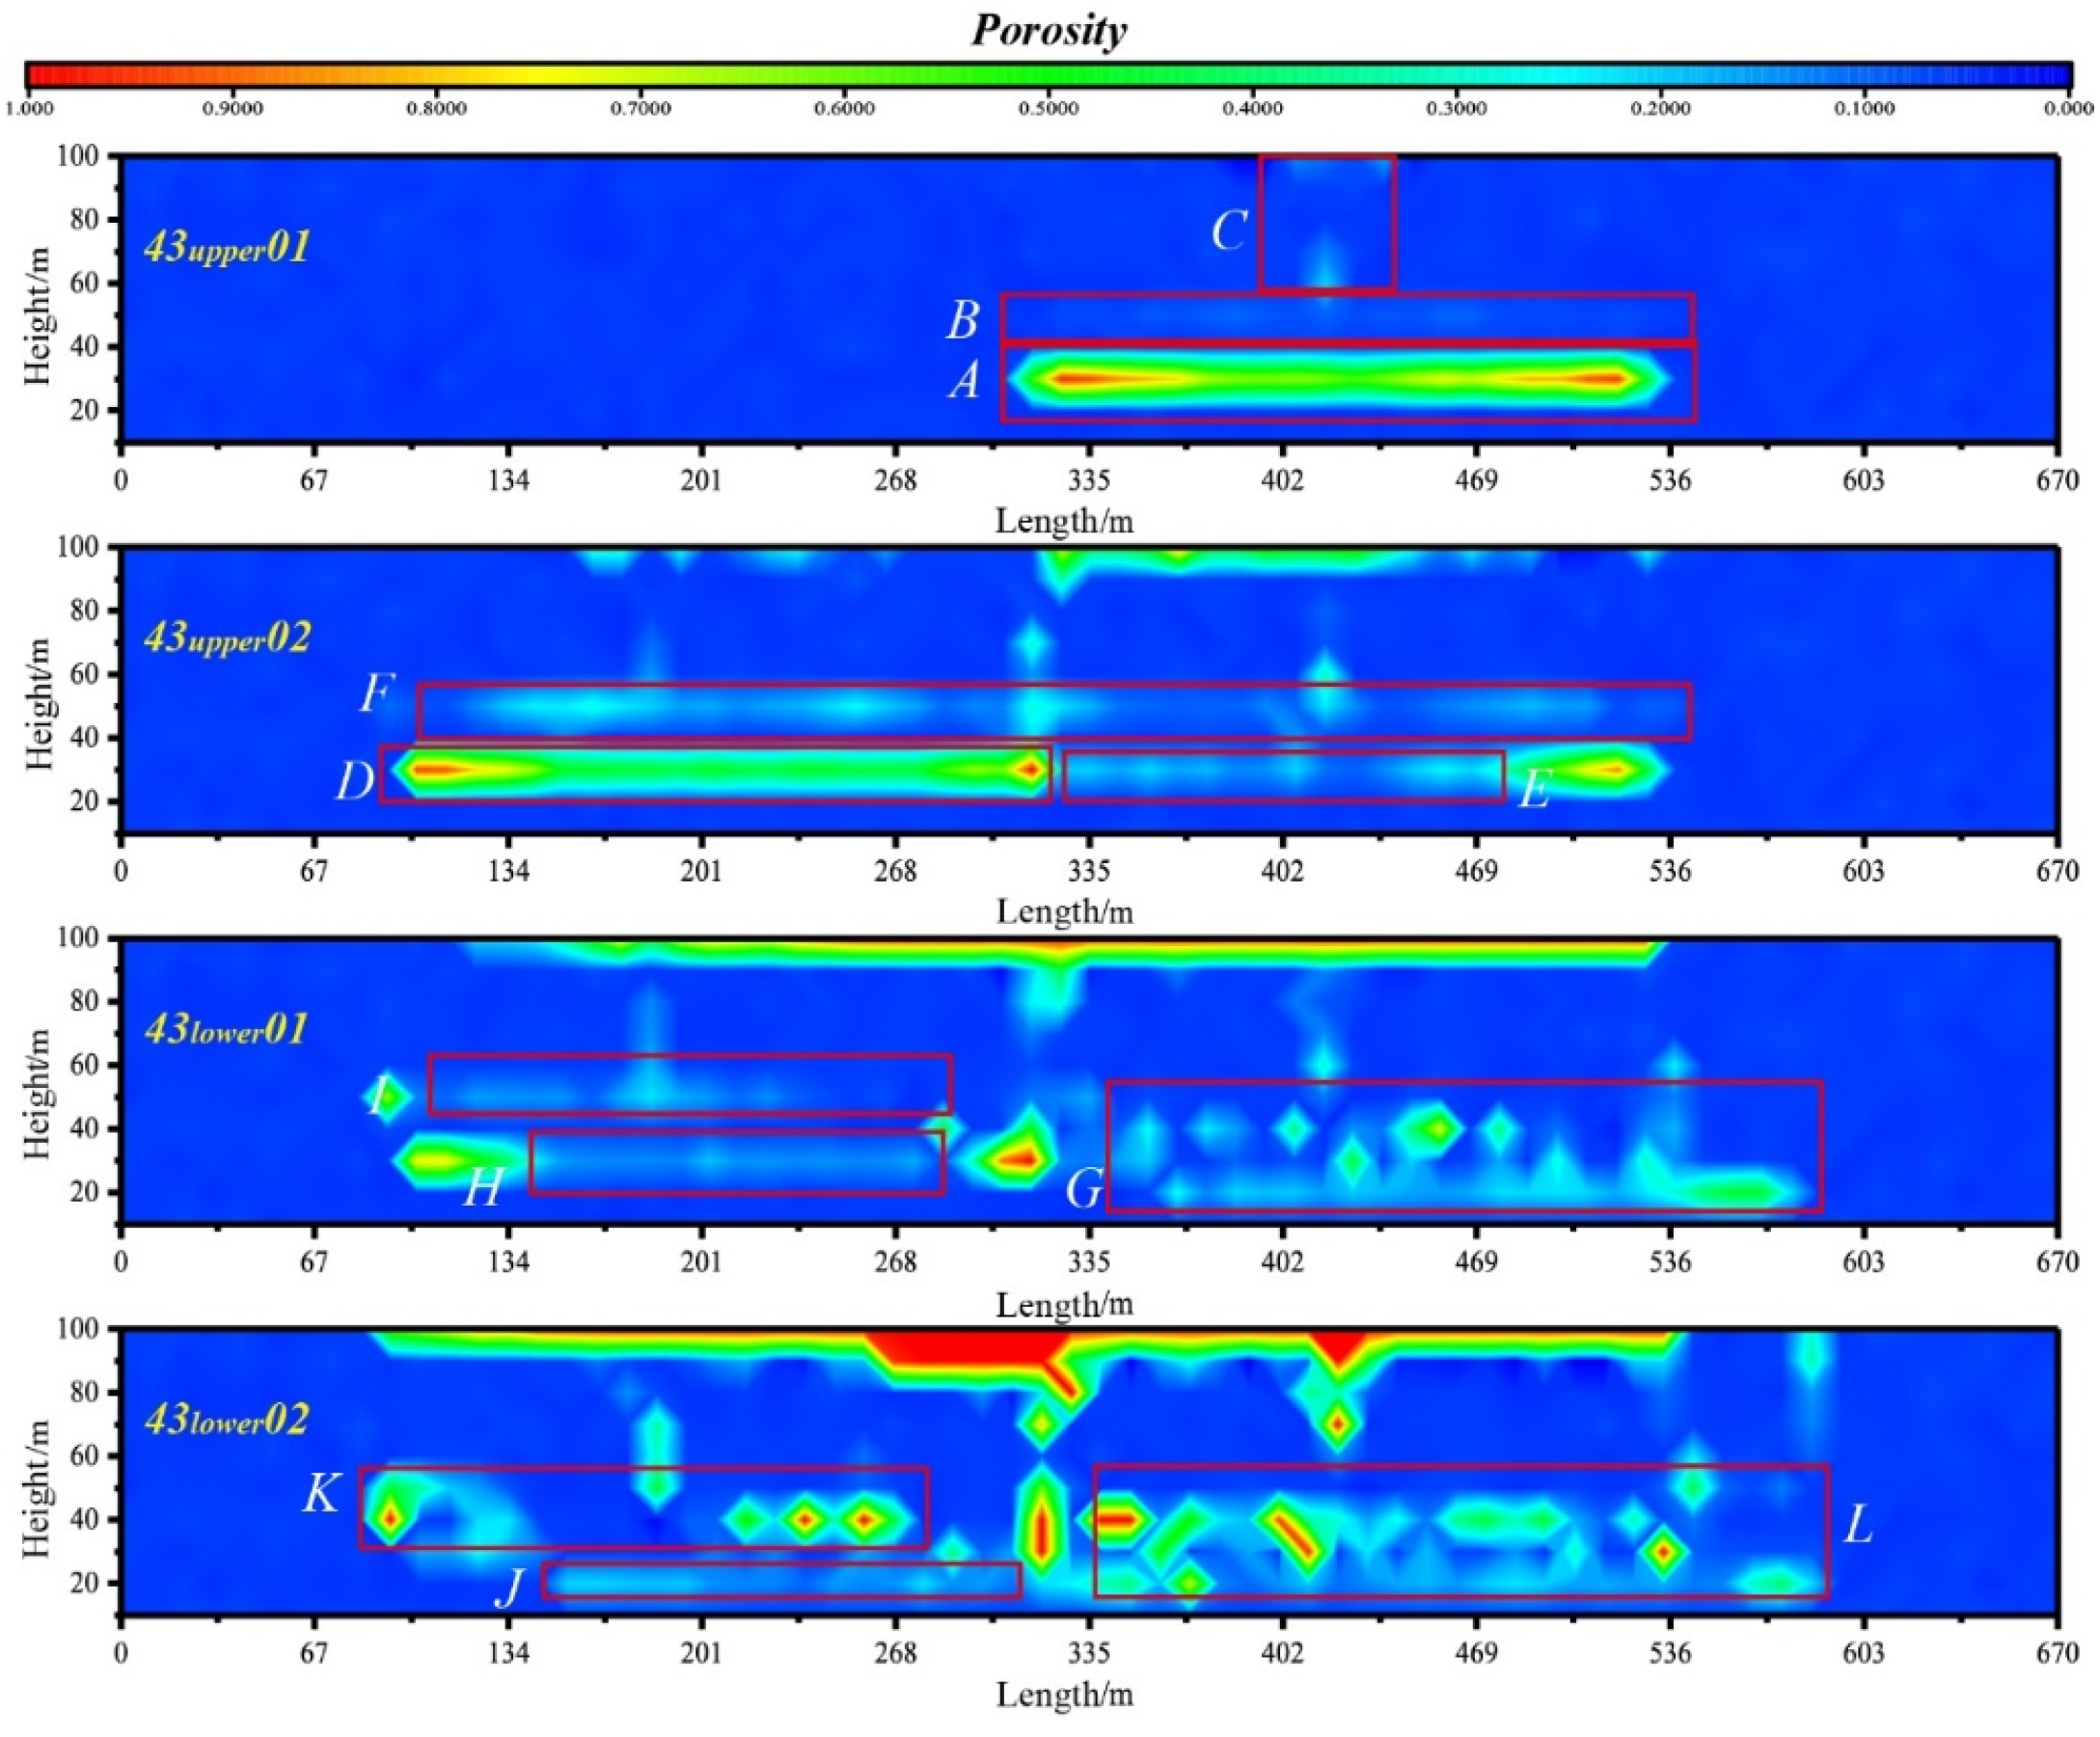
4.3.1. Global Porosity of the Surrounding Rock

As shown in Figure 11, the global porosity measurements at various excavation stages correspond well with the fracture states of the surrounding rock layers. A comparison with the global stress distribution in Figure 7 reveals that, in fractured surrounding rock regions, high-stress zones do not fully align with high-porosity areas. In fact, they exhibit an inverse correlation. The stress level reflects the interaction intensity between rock blocks. Therefore, the distribution of macroscopic damage fractures provides an intuitive assessment of surrounding rock integrity. By combining the observed changes in rock mass porosity, it is possible to gain deeper insights into the interaction state between fractured rock blocks.
Following the excavation of the 43upper01 working face, the overlying rock in the mined-out area did not fully collapse, resulting in a pronounced high-porosity region in Area A. At this stage, the porosity between the main and secondary key layers showed a slight increase, as seen in Area B, where delamination between the layers was evident. Area C experienced a localized rise in porosity, primarily due to the bending and failure of the main key layer.
After the excavation of the 43upper02 working face, the porosity changes in the mined-out area mirrored those observed after the 43upper01 excavation. Specifically, high porosity in Area D was caused by the incomplete collapse of the overlying rock layers. Meanwhile, extensive collapse of the overlying rock in the 43upper01 mined-out area led to a significant decrease in porosity, as shown in Area E. Mining of the 3upper Coal Seam caused more pronounced fault slip and delamination between the main and secondary key layers, resulting in a noticeable increase in porosity in Area F, as indicated in the figure.
After excavation of the 43lower01 working face, the mined-out area did not exhibit the same characteristics as Areas A and D. Instead of a significant increase in porosity, a widespread increase in porosity was observed in the surrounding rock mass, as shown in Area G. Simultaneously, the collapse of the overlying rock in the 43upper02 mined-out area led to a decrease in porosity in Area H. The movement of fractured rock blocks brought the main and secondary key layers into closer contact, eliminating the delamination, as seen in Area I.
Following the excavation of the 43lower02 working face, porosity within the mined-out area showed a slight increase, as illustrated in Area J. However, with the expansion of the vertical mining range, fracture damage to the main and secondary key layers was intensified, leading to a significant increase in porosity in the damaged areas, as shown in Areas K and L.

4.3.2. Porosity of Siltstone Interlayer

To further clarify the integrity and specific damage state changes of siltstone interlayer during multiple mining cycles of the 3upper and 3lower Coal Seams, the dynamic monitoring results of thin rock layer porosity are presented in Figure 12.
As shown in Figure 12, the mining of the 3upper coal seam has a very limited impact on the siltstone interlayer, with almost no change in porosity, maintaining consistency with the initial state, the average porosity remains stable at the initial level of 0.05, and the maximum value stays fixed at 0.08. After the mining of the 43lower01 face, significant effects on the roof began to occur, with the porosity of the siltstone interlayer rising sharply. The average value increased to 0.11, an approximately 117.4% increase compared to the upper seam mining, while the maximum value rose to 0.46, an increase of approximately 445.3 percent. However, this effect was limited to the area above the face, with no significant change in the porosity of the siltstone interlayer outside this range, which remained at levels similar to the initial state. After the mining of the 43lower02 face, the interlayer gangue above it also experienced significant damage, with porosity rapidly increasing. The average value rose to 0.26, an increase of approximately 122.8% compared to the 43lower01 face, and the maximum value reached 1.00, an increase of approximately 113.7% compared to the 43lower01 face. Meanwhile, the surrounding interlayer gangue remained unaffected, and the siltstone interlayer outside the mining area stayed at the initial state.
High-stress regions typically depend on the compression and contact between relatively intact rock blocks or strata. Even within fractured regions, interactions between fractured rocks occur, with compressed fractured rocks alleviating excessive stress. This leads to the phenomenon where regions with low porosity exhibit higher stress, while regions with high porosity exhibit lower stress.

5. Conclusions

(1)
The simplified particle flow model successfully replicates the theoretical fracturing lengths of the strata, with the initial stress levels observed in subsequent model monitoring being in good agreement with experimental measurements. This indicates that the model effectively simulates deep mining conditions, and the approach of simplifying the particle flow model is both practical and valid.
(2)
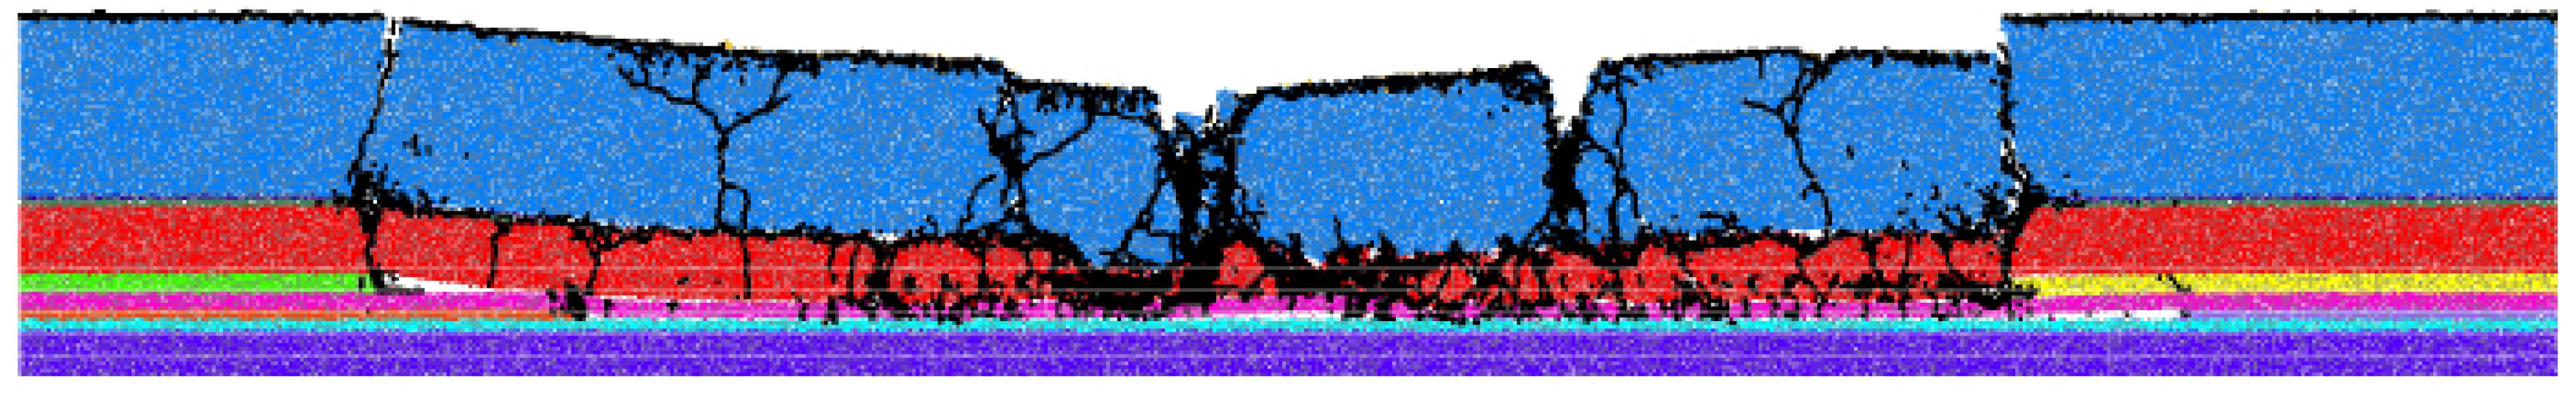
Mining of the 3upper coal seam primarily induces fracture propagation within the primary and secondary key strata, as well as compressive damage between rock blocks. The integrity of the siltstone interlayer layer remains largely unaffected by mining of the overlying coal seams. The mining of the 3lower coal seam leads to limited damage, primarily deepening the collapse of the overlying strata in the mined-out area and increasing the fragmentation of rock blocks, with minimal damage occurring to the surrounding rocks.
(3)
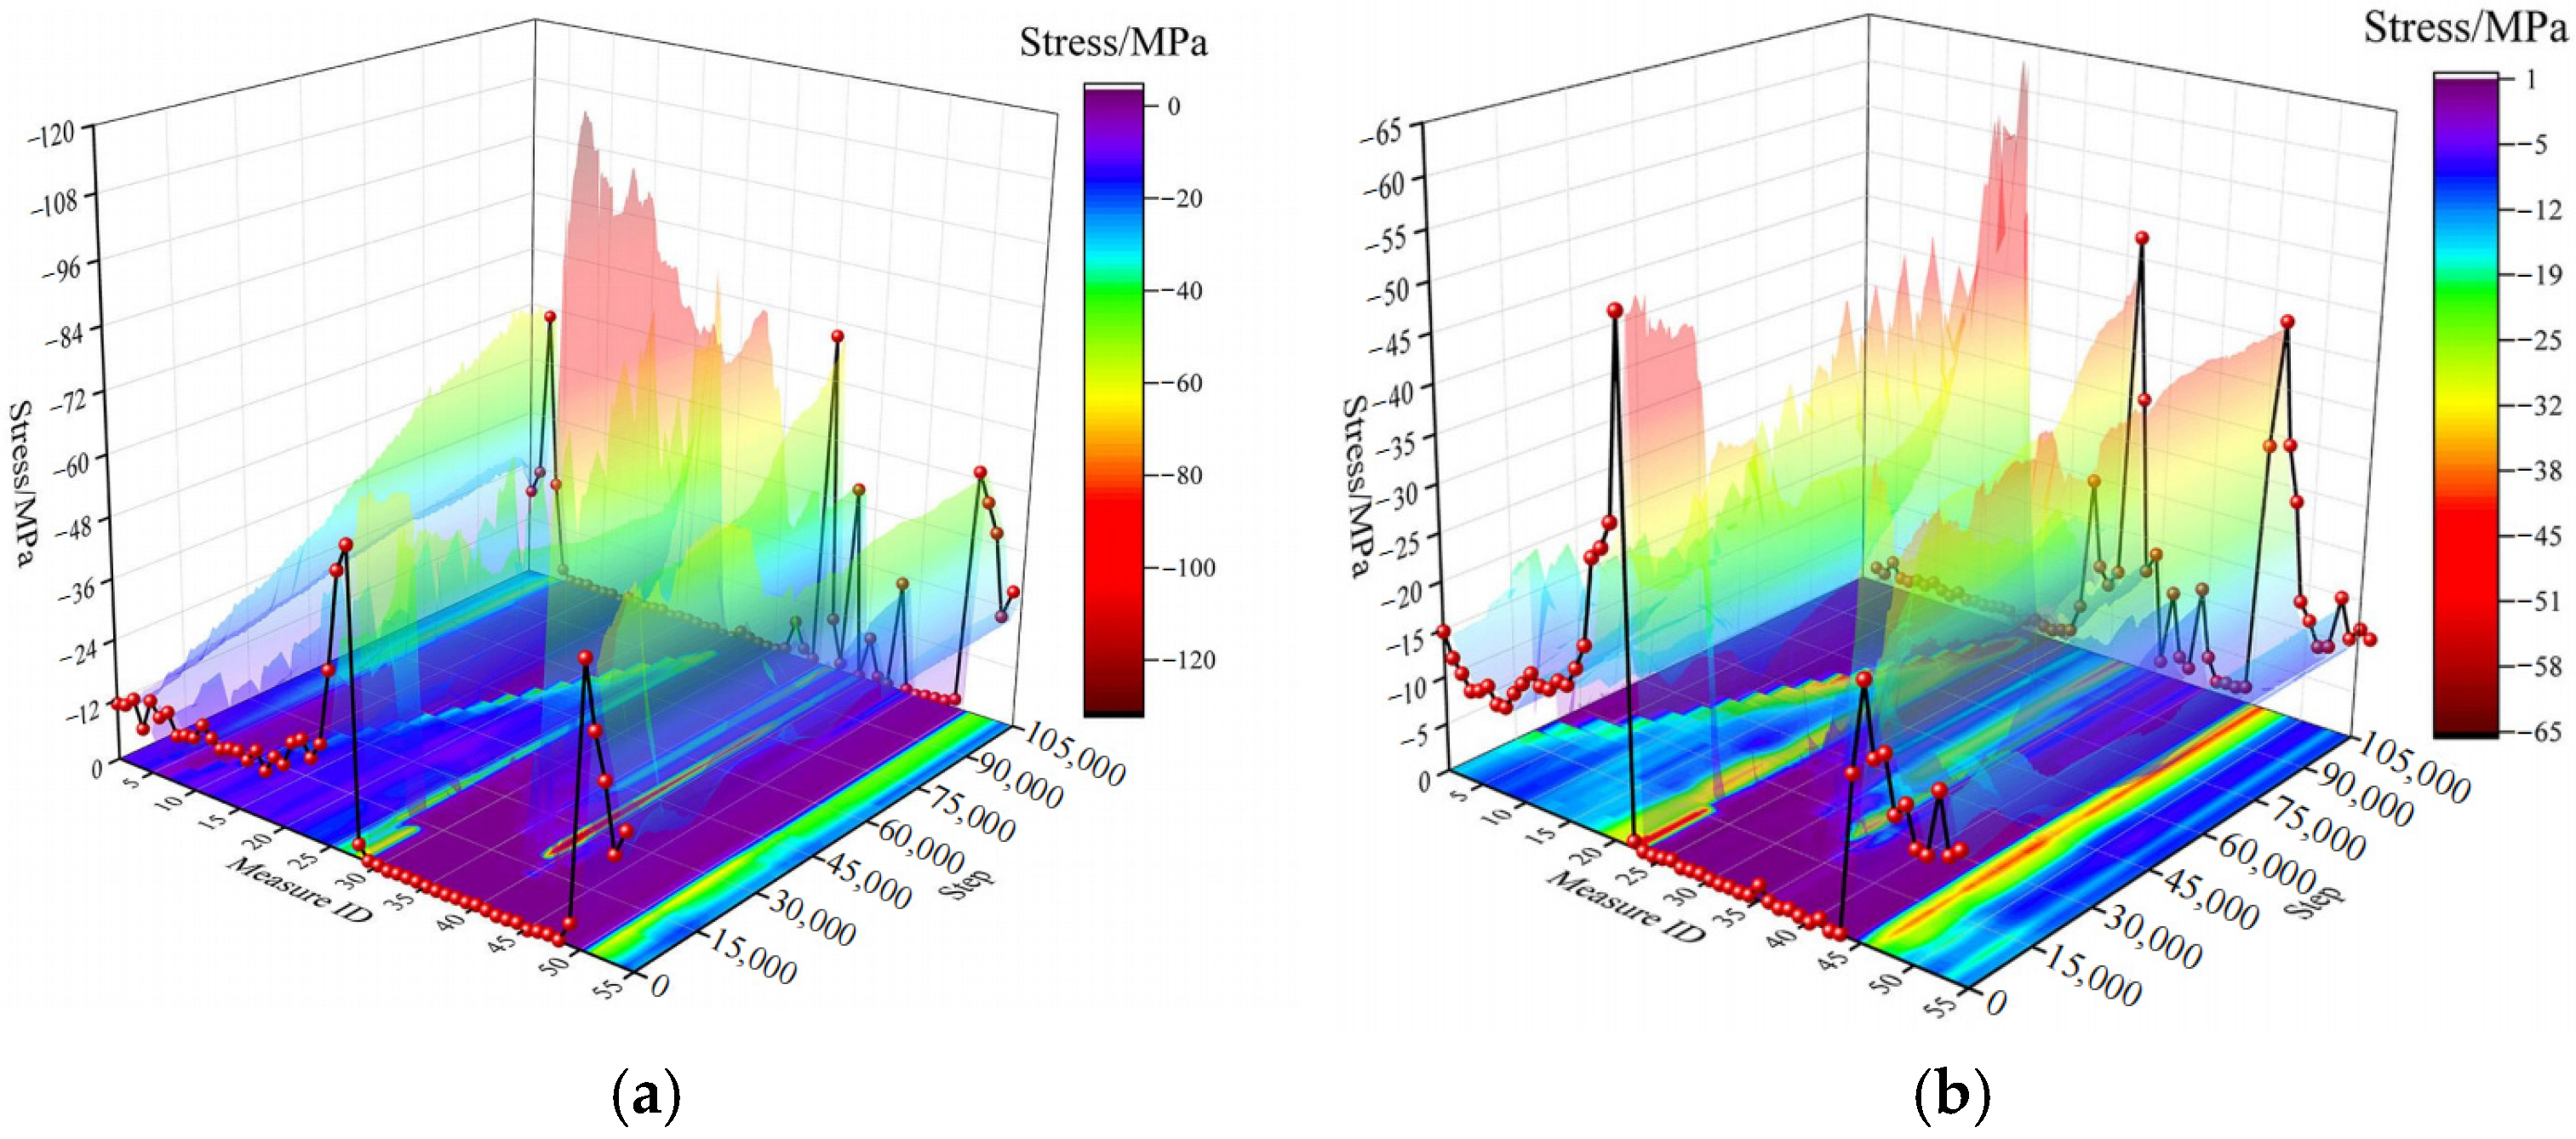
Mining of the 3upper coal seam results in significant stress redistribution within the surrounding rock, allowing clear differentiation between high-stress zones, low-stress zones, and areas exhibiting original rock stress levels. Mining of the 3lower coal seam generates a localized, multi-point high-stress distribution, and the stress patterns in the siltstone interlayer largely mirror the global stress behavior in the surrounding rock.
(4)
The porosity in fractured surrounding rock regions correlates with the compressive interactions between rock blocks. In areas with severe surrounding rock damage, an inverse relationship between stress and porosity is observed. Monitoring of the siltstone interlayer’s porosity further confirms that its integrity remains unaffected by the mining of the 3upper coal seam, with damage occurring only as a result of mining activities in the 3lower coal seam.

Author Contributions

Conceptualization and methodology, J.X., G.L. and C.S.; software, J.X., B.T. and H.R.; chart design, J.X. and B.T.; writing—original draft preparation, all authors; writing—review and editing, J.X., G.L. and B.T. All authors have read and agreed to the published version of the manuscript.

Funding

This study was supported by the National Natural Science Foundation of China (U22A20165); Special Project Support for Key Research and Development Tasks of Xinjiang Uygur Autonomous Region (2023B01010-1); Key R&D Program of Shandong Province (2024CXGC010322) and National Science and Technology Major Project (2024ZD1004104).

Data Availability Statement

The original contributions presented in the study are included in the article; further inquiries can be directed to the corresponding authors.

Conflicts of Interest

The authors declare that they have no known competing financial interests or personal relationships that could have appeared to influence the work reported in this paper.

Abbreviations

The following abbreviations are used in this manuscript:
PFC2DParticle Flow Code 2D

References

  1. Yang, X.; Wen, G.; Dai, L.; Sun, H.; Li, X. Ground Subsidence and Surface Cracks Evolution from Shallow-Buried Close-Distance Multi-seam Mining: A Case Study in Bulianta Coal Mine. Rock Mech. Rock Eng. 2019, 52, 2835–2852. [Google Scholar] [CrossRef]
  2. Rajabi, M.; Ziegler, M.; Heidbach, O.; Mukherjee, S.; Esterle, J. Contribution of mine borehole data toward high-resolution stress mapping: An example from northern Bowen Basin, Australia. Int. J. Rock Mech. Min. Sci. 2024, 173, 105630. [Google Scholar] [CrossRef]
  3. Xu, H.; Zhai, C.; Xia, J.; Sun, Y.; Dong, X.; Lai, Y.; Xu, Y.; Xu, Z.; Cong, Y. Coal and rock interface imaging based on finite element method of through—Seam drilling acoustic wave far detection. Coal Field Geol. Explor. 2024, 52, 118–129. [Google Scholar]
  4. Qu, Q.D.; Guo, H.; Khanal, M. Monitoring and analysis of ground movement from multi-seam mining. Int. J. Rock Mech. Min. Sci. 2021, 148, 104949. [Google Scholar] [CrossRef]
  5. Burtan, Z.; Chlebowski, D. The Effect of Mining Remnants on Elastic Strain Energy Arising in the Tremor-Inducing Layer. Energies 2022, 15, 6031. [Google Scholar] [CrossRef]
  6. Feng, J.F.; Zhou, Y.; Zhang, K.Z.; Xu, Y.L.; Li, H.G. Fracture characteristics of thick key stratum and calculation of shield workload under multiple coal seam mining gobs with shallow depth. J. Min. Saf. Eng. 2018, 35, 332–338. [Google Scholar]
  7. Ghabraie, B.; Ren, G.; Smith, J.V. Characterising the multi-seam subsidence due to varying mining configuration, insights from physical modelling. Int. J. Rock Mech. Min. Sci. 2017, 93, 269–279. [Google Scholar] [CrossRef]
  8. Qin, Y.; Xu, N.; Zhang, Z.; Zhang, B. Failure Process of Rock Strata Due to Multi-seam Coal Mining: Insights from Physical Modelling. Rock Mech. Rock Eng. 2021, 54, 2219–2232. [Google Scholar] [CrossRef]
  9. Xie, S.; Pan, H.; Chen, D.; Gao, M.; He, S.; Song, B. The structure and activity laws of interlayer equivalent basic roof in multi-seam mining. J. China Univ. Min. Technol. 2017, 46, 1218–1225. [Google Scholar]
  10. Suchowersk Iwanec, A.M.; Carter, J.P.; Hambleton, J.P. Geomechanics of subsidence above single and multi-seam coal mining. J. Rock Mech. Geotech. Eng. 2016, 8, 304–313. [Google Scholar] [CrossRef]
  11. Kumar, A.; Roy, L.B. Analysis of Slope Failure in Ostapal Open Pit Chromite Mine Using Numerical Modelling in FLAC—A Case Study. Indian Geotech. J. 2025, 1–12. [Google Scholar] [CrossRef]
  12. Zhang, Z.; Deng, M.; Wang, X.; Yu, W.; Zhang, F.; Dao, V.D. Field and numerical investigations on the lower coal seam entry failure analysis under the remnant pillar. Eng. Fail. Anal. 2020, 115, 104638. [Google Scholar] [CrossRef]
  13. Shi, Z.; Wang, Q.; Wang, P.; He, D.; Bai, Y.; You, H. Time Series Effect on Surface Deformation above Goaf Area with Multiple-Seam Mining. Symmetry 2020, 12, 1428. [Google Scholar] [CrossRef]
  14. Xie, S.R.; Guo, F.F.; Wu, Y.Y. Control Techniques for Gob-Side Entry Driving in an Extra-Thick Coal Seam with the Influence of Upper Residual Coal Pillar: A Case Study. Energies 2022, 15, 3620. [Google Scholar] [CrossRef]
  15. Pongpanya, P.; Sasaoka, T.; Shimada, H. Prediction of multi-seam mining-induced surface subsidence in underground coal mine in Indonesia. Asean Eng. J. 2022, 12, 169–183. [Google Scholar] [CrossRef]
  16. Sun, X.Y.; Lu, M.J.; Li, C.; Miao, L.T. Optimal selection of staggered distance mining in double seams and its influence on water-resisting key strata. J. Min. Saf. Eng. 2021, 38, 51–57. [Google Scholar]
  17. Liu, Y.; Cheng, J.; Jiao, J.; Meng, X. Feasibility study on multi-seam upward mining of multi-layer soft–hard alternate complex roof. Environ. Earth Sci. 2022, 81, 424. [Google Scholar] [CrossRef]
  18. Thakur, V.; Jain, S.C. Mapping & Analysis of Roof Stress Distribution in An Underground Coal Mine Using FLAC 3D Software. J. Sci. Res. Technol. 2024, 2, 45–52. [Google Scholar]
  19. Yang, K.; Fu, Q.; Liu, Q.; He, X.; Lyu, X. Evolution of Mining-Induced Stress in Downward Mining of Short-Distance Multiseam. Geofluids 2022, 2022, 1–14. [Google Scholar] [CrossRef]
  20. Babets, D.; Sdvyzhkova, O.; Hapieiev, S.; Shashenko, O.; Prykhodchenko, V. Multifactorial analysis of a gateroad stability at goaf interface during longwall coal mining—A case study. Min. Miner. Depos. 2023, 17, 9–19. [Google Scholar] [CrossRef]
  21. Vu, T.T.; Do, S.A. Determination of the rock mass displacement zone by numerical modeling method when exploiting the longwall at the Nui Beo Coal Mine, Vietnam. Min. Miner. Depos. 2023, 17, 59–66. [Google Scholar] [CrossRef]
  22. Wang, J.; Ning, J.G.; Tan, Y.L.; Hu, S.C.; Guo, W.Y. Deformation and failure laws of roadway surrounding rock and support optimization during shallow-buried multi-seam mining. Geomat. Nat. Hazards Risk 2020, 11, 191–211. [Google Scholar] [CrossRef]
  23. Zou, Q.; Zhang, T.; Cheng, Z.; Jiang, Z.; Tian, S. A method for selection rationality evaluation of the first-mining seam in multi-seam mining. Geomech. Geophys. Geo-Energy Geo-Resour. 2022, 8, 17. [Google Scholar] [CrossRef]
  24. Cheng, Z.; Ouyang, Z.; Zou, Q.; Lu, Y.; Zhao, X.; Li, M. Characteristics of fracture field in different stress zones during multi-seam mining: Quantification based on theoretical analysis and BBM-DEM accurate simulation method. Energy Sci. Eng. 2020, 8, 1620–1633. [Google Scholar] [CrossRef]
  25. Liu, Y.; Yang, T.; Ye, Q.; Hou, X.; Zhao, Y.; Wei, L. Characteristics of surface deformation under repeated mining in mountainous area. J. Min. Saf. Eng. 2022, 39, 507–516. [Google Scholar]
  26. Parichehr, T.; Reza, C.J.; Meghdad, P. PFC/FLAC 3D coupled numerical modeling of shallow foundations seated on reinforced granular fill overlying clay with square void. Comput. Geotech. 2023, 161, 105574. [Google Scholar]
  27. Dedecker, F.; Emam, S.; Katsaga, T.; Ergun, S.; Williams, C.; Potter, J. Modeling slope failure from initiation to runout geometry with FLAC3D and PFC3D: A back analysis of the Leo Failure event. Appl. Numer. Model. Geomech. 2024, 15, 4. [Google Scholar]
  28. Fatah, T.A.; Zhang, R.; Miao, Y.; Mastoi, A.K.; Huang, X.S.; Wurie, N.N. Strength and leaching behavior of tailing-based paste backfill at high water content amended with lime activated ground granulated blast furnace slag and flocculant. Environ. Sci. Pollut. Res. 2024, 31, 11115–11127. [Google Scholar] [CrossRef]
  29. Qin, Z.; Yuan, Y.; Mao, Z.; Xu, X.; Li, Y.; Li, L.; Chen, Z.; Li, B. Research on coal gangue transport and shield beam bearing pressure law based on FLAC3D-PFC3D coupled simulation and physical similar simulation. Comput. Part. Mech. 2025, 1–21. [Google Scholar] [CrossRef]
  30. Zhou, L.; Sarfarazi, V.; Haeri, H.; Shahbazian, A.; Moayedi Far, A.; Fatehi Marji, M. Rock joint filling breakage under three different instant loading conditions; physical test and PFC simulation. Comput. Part. Mech. 2024, 12, 183–204. [Google Scholar] [CrossRef]
  31. Pan, R.; Cao, S.; Li, Y.; Li, G. Development of overburden fractures for shallow double thick seams mining. J. China Coal Soc. 2018, 43, 2261–2268. [Google Scholar]
  32. Enke, H.O.U.; Tong, C.O.N.G.; Xiaoshen, X.I.E.; Jiangbo, W.E.I. Ground surface fracture development characteristics of shallow double coal seam staggered mining based on particle flow. J. Min. Strat. Control Eng. 2020, 2, 20–28. [Google Scholar]
  33. Xu, J.L.; Qian, M.G.; Shi, P.W. Ground Pressure in Mine and Ground Control; China University of Mining and Technology Press: Xuzhou, China, 2010. [Google Scholar]
Figure 1. Strata structure and layout scheme of working face.
Applsci 15 03063 g001
Figure 2. Basic information of the model: (a) Distribution and Direction Diagram of the Mining Area, and (b) Measurement Circular Distribution Information.
Applsci 15 03063 g002
Figure 3. Broken status after finishing 43upper01 working face excavation.
Applsci 15 03063 g003
Figure 4. Broken status after finishing 43upper02 working face excavation.
Applsci 15 03063 g004
Figure 5. Broken status after finishing 43lower01 working face excavation.
Applsci 15 03063 g005
Figure 6. Broken status after finishing 43lower02 working face excavation.
Applsci 15 03063 g006
Figure 7. Stress distribution of surrounding rock after each excavation period.
Applsci 15 03063 g007
Figure 8. Stress evolution in immediate roof and floor with 43upper01 working face excavation: (a) Stress evolution of the roof, and (b) Stress evolution of siltstone interlayer.
Applsci 15 03063 g008
Figure 9. Stress evolution in immediate roof and floor with 43upper02 working face excavation: (a) Stress evolution of the roof, and (b) Stress evolution of siltstone interlayer.
Applsci 15 03063 g009
Figure 10. Stress evolution in siltstone interlayer with 43lower01 and 43lower02 working face excavation: (a) 43lower01 working face, and (b) 43lower02 working face.
Applsci 15 03063 g010
Figure 11. Porosity distribution of surrounding rock after each excavation period.
Applsci 15 03063 g011
Figure 12. Porosity variety of the siltstone interlayer after each excavation period.
Applsci 15 03063 g012
Table 1. Stratigraphic physical and mechanical parameters.
LayerThickness
(m)
Bulk Density (kN·m−3)Compressive Strength
(MPa)
Tensile Strength
(MPa)
Cohesion
(MPa)
Internal Friction Angle (°)Elastic Modulus
(GPa)
Serial NumberRock Type
1Fine sandstone47.4023.737.893.984.842412.26
22# coal seam0.901.526.741.212.423810.72
3Alumina mudstone1.4125.3228.442.745.741915
4Medium to fine sandstone17.9725.4390.258.6113.842736.63
53upper coal seam5.001.529.52.982.4522.113.5
6Siltstone4.2025.3372.247.1711.641921.29
73Lower coal seam3.001.529.52.982.4522.113.5
8Siltstone2.7825.5270.884.147.622120.61
9Medium to fine sandstone12.0023.9260.063.938.483420.79
Table 2. In-situ stress test results in coal seam.
Principal StressStress (MPa)Azimuth Angle (°)Dip Angle (°)
σ122.8490.30−19.02
σ210.8512.51−63.10
σ310.62186.84−18.29
σv15.09
Table 3. Calibration results of mesoscopic parameters.
LayerMicromechanical Parameters
Serial Number Rock Type E (GPa)kn/ks σ c (MPa) c (MPa) μ
1Fine sandstone3.051.13115.50.5
22# coal seam3.501.4023.411.70.5
3Alumina mudstone3.881.4022110.5
4Medium to fine sandstone8.621.334321.40.5
53upper coal seam3.501.4023.411.70.5
6Siltstone5.31.257.828.90.5
73lower coal seam3.501.4023.411.70.5
8Siltstone5.11.4056.827.80.5
9Medium to fine sandstone5.151.4048240.5
Disclaimer/Publisher’s Note: The statements, opinions and data contained in all publications are solely those of the individual author(s) and contributor(s) and not of MDPI and/or the editor(s). MDPI and/or the editor(s) disclaim responsibility for any injury to people or property resulting from any ideas, methods, instructions or products referred to in the content.

