Abstract
Button layout plays a crucial role in user–device interaction. An impractical layout can hinder user efficiency and satisfaction. Current joystick button designs lack systematic references, relying on common body measurements and subjective judgments, which makes it difficult to cope with diverse modes of operation. This paper introduces a basic grip state based on adult male hand size, defining three operational areas. We conducted experiments involving 15 participants at three hand length percentiles (10, 50, 90), revealing positive correlations of operation range with body dimensions. Further discussion analyzes the dynamic operating range and specific features in different areas. These findings inform an incremental design principle for joystick layouts, offering precise guidance for future designs.
1. Introduction
Buttons serve as a critical medium for user–device interaction, primarily facilitating control and input functions. They find widespread application in our daily lives, allowing us to remotely control various devices, such as adjusting television volume or setting refrigerator temperatures through electronic screens. Both virtual and physical buttons, as integral elements of a product, require careful consideration of their spatial placement and interrelationships within the product to meet user operational needs and enhance efficiency. The act of pressing buttons represents the direct form of user–product interactions. To enhance comfort and efficiency, button layout design should incorporate human hand size and movement patterns. This approach ensures that the buttons are easily accessible and user-friendly, optimizing the overall user experience with the product [1]. For virtual buttons, size and position significantly influence user preference [2].
Button layouts can be categorized as two-dimensional (2D) or three-dimensional (3D). Two-dimensional layouts are commonly found in touchscreens and control panels, and consideration of thumb reach on touchscreens can enhance user experience [3]. Control panel operation modes are determined by the product’s functionality and form, with extensive research in human-machine analysis based on static human torso sizes and dynamic joint movements to derive design references for specific applications [4]. For 3D layouts, which are in prolonged contact with the human body, ergonomic dimensions and aesthetics must be thoroughly considered. Due to their varied shapes and operational modes, creating a unified design principle for button layouts is challenging. Ergonomic methods are the primary basis for design, utilizing standard human body measurements to align with physiological characteristics. Research has identified optimal layouts for automotive electronic gear shift buttons among 12 options through ergonomic subjective evaluations [5]. In the case of split keyboards, adjustments like keyboard tilt angle and wrist rest height enhance overall button layout operability, improving user experience [6].
The joystick button layout is a typical example of the 3D button layout design. Joysticks convey user commands and are presented in standalone or fixed forms on large equipment as input devices. They are usually equipped with one or more buttons to transmit signals and also respond to joystick angles or directions. Joysticks are used extensively in engineering machinery, transportation, aerospace, medicine, and entertainment. Their operation mode remains stable and uniform, necessitating users to maintain a full-contact grip. Therefore, designing the joystick’s form and button configuration must comprehensively consider ergonomic factors. The joystick’s overall size [7], shape [8], and placement [9] are critical factors affecting operational performance, user physical load, and psychological assessment. Early studies employed reverse modeling of human grip to create joysticks that fit the gripping action [10,11]. Handheld devices and handles share similar hand operation requirements with joysticks, and their button layouts significantly affect user experience. Research on the Switch game controller found that smaller button distances can reduce comfort and gaming experience [12]. Another study [13] developed an ergonomic handle for medical surgery scenarios based on tool gripping posture, designing two operational buttons according to finger distribution and dynamic actions during gripping.
While extensive research has applied ergonomic methods to design and optimize button layouts for complex 3D models, joystick button layout design still faces limitations. On the one hand, many button layouts are still based on confirmed shapes. Although the overall shape and size of joysticks have been scientifically validated, button placement often relies on subjective designer judgments, resembling arbitrary placement rather than quantitative assessment. On the other hand, even if designers intend to use ergonomic methods quantitatively in layout arrangements, limited dimension references are challenging to apply in diverse and precision-demanding scenarios. Human fingers possess independent motion capabilities [14], with the thumb exhibiting unique movement characteristics [15]. However, due to inherent biomechanical constraints, the motion of individual fingers is subject to interference from adjacent digits [16], thus creating a restricted movement space. These limitations become particularly pronounced under fixed hand postures, as demonstrated in studies by Paul Arauz [17] and Ian M. Bulock [18], who investigated the workspace characteristics of the two- and three-fingered manipulation during pinch gestures. Similarly, in gripping configurations, each finger should exhibit distinct movement patterns and ranges, which significantly influence the layout of joystick buttons.
Another challenge is the increasing operational complexity led by button innovation. The trends toward intelligent and multimodal product operations are shifting interaction from traditional physical buttons to complex touchscreen inputs, contactless gestures, voice inputs, and other multimodal inputs. These new interaction modes introduce fresh operation patterns. Touchscreen technology has enabled natural writing and abstract gestures as new modes. Innovations like trackballs [19] have further diversified finger operation patterns. These innovations demand increased ergonomic comfort and operational efficiency in handheld devices. Another significant innovation is the integration and multifunctionality of buttons. BMW’s iDrive button design [20] integrated multiple operations, including flexion, pressing, pushing, and pulling. Researchers have developed an intelligent button [21] that combines pressing and rotating actions. As the complexity of joystick operation grows, the frequency and intensity of finger keystrokes increase, which results in greater fatigue [22]. This highlights the need for a more rational key layout.
Gender differences in anthropometry are crucial gradients in ergonomic design. Given that, principles and guidance of equipment for male and female design ought to be researched respectively. In this study, we explored the dynamic data and operation characteristics of the male hand during gripping to ensure sample homogeneity and establish a baseline for future female research. Our research proposed two hypotheses before the following experiment:
- There are different operation areas for fingers when gripping.
- Finger operations in different areas have generalizable features and predictable trends.
The research process unfolds as follows: Firstly, we analyze grip movements and operations, identifying three distinct operational areas for hypothesis A. Then, we devised experiments focused on button operational characteristics and loads based on two primary operation fingers, thumb and index finger, for hypothesis B. Additional operational analysis was conducted for the thumb, due to its uniqueness. Fifteen participants were recruited across three hand length percentiles (P10, P50, P90) in these experiments. Finally, the study discusses the operating range and characteristics of the different areas in the grip state.
2. Method and Material
2.1. Related Works
Significant research efforts have been dedicated to investigating finger movements, particularly on understanding their biomechanical and functional characteristics. Brian J. Conway et al. [23] conducted a comprehensive study employing a data glove equipped with strain gauges to measure finger angular displacements. Their experimental setup instructed participants to flex the designated finger to its maximum extent while maintaining the other fingers stationary, thereby isolating individual finger capabilities. Additionally, they implemented a fixed resting position to ensure consistent starting conditions across trials, enhancing the reliability of their measurements. Paul Arauz et al. [17] developed a quantitative thumb-index finger motion model to analyze operational ellipsoids under three pinch angles. Their findings identified an optimal postural range that resulted in more uniform spatial manipulation characteristics for thumb-index finger pinching, which is particularly beneficial for tip-pinching tasks performed by surgeons. Furthermore, Ian M. Bullock et al. [18] expanded the scope of finger movement analysis by investigating the workspace of two-finger (thumb-index) and three-finger (thumb-index-middle) pinching while manipulating objects. Their study examined characteristics such as shape, size, and center position, as well as the differences between two-finger and three-finger operations. While these studies have significantly advanced our understanding of finger movements, our study aims to extend this body of knowledge by investigating the operation characteristics of fingers in the grip state.
2.2. Establishment of Basic Grip State
Diameter of the handle. Human gripping is classified into three categories: spherical, cylindrical, and pinch grips [24], with joystick manipulation typically involving a cylindrical grip. For cylindrical handles, a diameter of 30 mm results in higher performance and reduced physical stress compared to a 40 mm diameter [7,25]. Pheasant and O’Neill reported that supination torque on knurled cylinders increases with diameters ranging from 10 to 50 mm, and decreases for diameters exceeding 50 mm [26]. Similarly, other researchers have found a rise in wrist flexion/extension (F/E) torque strength with increasing handle diameter from 25 mm to 50 mm [27,28]. Overall, there is apparently a bell-shaped relationship between handle diameter and maximum torque exertions. In our research, the handle diameter was set at 35 mm, shown in Figure 1, considering that this dimension offers greater torque and grip strength, thereby providing an appropriate operational environment.
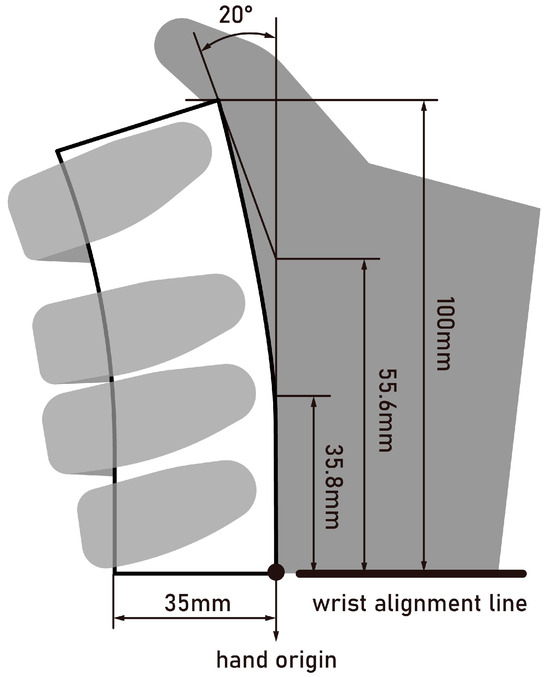
Figure 1.
Ergonomic parameters for basic joystick. The bottom plane of the model is the origin of dimensions. The positioning of hands is based on a wrist reference line, which is located at the intersection of the bottom plane and the model’s symmetry axis.
Angle offset. To accommodate the natural curvature of the hand and the thumb’s angle during gripping [13,29], we designed the upper end of the grip with a 20° angle offset, shown in Figure 1.
Other parameters. Our research adopts the P50 of anthropometric data to minimize the cross-influence of multiple variables of users and, consequently, to establish a basic grip state for the joystick. Table 1 presents anthropometric data and corresponding regression equations for Chinese adult males aged 18–70 years.

Table 1.
Anthropometric data for Chinese adult males aged 18–70 years. These data are referenced to GB/T 10000-2023 [30], GB/T 16252-2023 [31], ISO/TR 7250 [32], and ANSI/HFES 100-2007 [33].
The P50 for adult male hand breadth is 88 mm, and thumb length is 60.6 mm. Considering operational margin and comfort, the appropriate grip height was set at 100 mm. The connector part’s shape was formed automatically by a rail sweep operation (third-order continuity) in Rhino 7 software, utilizing Bezier curves to connect two endpoints. The starting height of the connecting curve was set at 35.8 mm, and the height of the Bezier control point at 55.6 mm, based on the P50 widths of the ring, little, and middle finger. All parameter settings are shown in Figure 1. In this study, the state in which the user holds this handle is regarded as the basic grip state.
While there is no strict guideline for hand posture in cylindrical gripping, setting operational norms was necessary to prevent users from exerting excessive effort to achieve unreasonable operational goals [34]. Grip operations in work scenarios are expected to be common and stable. In order to present a uniform characterization of the grip operation, we propose the following operational specifications:
- Button operation in the grip state should be limited to single-finger use.
- While engaging a single finger for operational tasks, the remaining fingers must stay relaxed and maintain contact with the joystick.
- The basic grip state requires the bases of the four fingers, excluding the thumb, to remain in contact with the joystick.
- The elbow and wrist should be at the same height.
- Elbow and shoulder joints should be relaxed to avoid assistance.
2.3. Operation Area Division
Joystick button operation often depends on individual habits and specific joystick designs. Notably, the index finger and thumb, having higher dexterity [35], are predominantly utilized in most joystick designs for the effortless manipulation of buttons on the top and shaft. The middle, ring, and little fingers typically do not engage in button operations, serving instead to support and stabilize the joystick.
A preliminary experiment was conducted to observe and analyze potential areas of operation based on index finger and thumb movements among users. Fifty-four participants were invited to explore the range of motion of their finger within the basic grip state, without any specific instructions, aside from a requirement to maintain comfort. The entire process was recorded on camera for comparative analyses of common features.
The preliminary results exhibit some similar operational patterns, as depicted in Figure 2. These indicate a notable tilt of the thumb’s fingertip, with participants reporting a variation in the thumb’s exerted force during movement, and an independent area for the index finger. Drawing on these observations, we propose a division of the 2D button operation area for the right hand based on the thumb offset angle (illustrated in Figure 3): The main operation area (MOA), situated directly opposite the thumb’s fingertip, aligns with the thumb’s natural vertical position as the vertical baseline axis. In this area, the thumb presses buttons with a left flexion angle of less than 25° and a right flexion angle of less than 15°. The area requiring a left thumb flexion exceeding 25° is defined as the thumb deflection operation area (TDOA). The area accessible by the index finger is defined as the index finger operation area (IFOA).
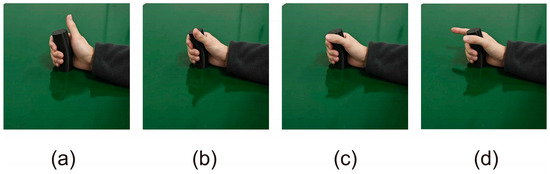
Figure 2.
Experimenter’s thumb and index finger operation pattern in BGS: (a) right limit of thumb main operation area; (b) left limit of thumb main operation area; (c) thumb deflection operation (d) index finger operation.
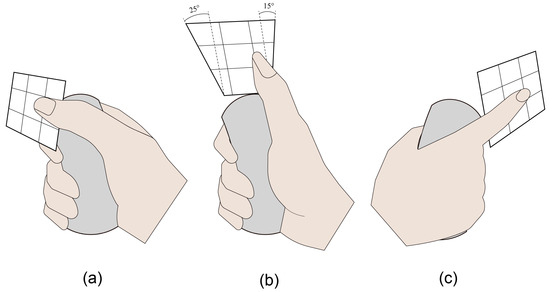
Figure 3.
The 2D operation area of different fingers: (a) TDOA—thumb deflection operation area, (b) MOA—main operation area and (c) IFOA—index finger operation area.
2.4. Grip Operation Experiment
2.4.1. Experimental Setup
In order to collect dynamic human data within the MOA, our study incorporated an additional panel into the basic grip model. The panel’s extent was defined by the thumb’s deflection angle, positioned at the upper end of the grip’s cut surface. We equipped the experimental model with two sludge sections to simulate human–machine interfaces within TDOA and IFOA. This approach was adopted to avoid the influence of form while simulating the operational force feedback during the experimental task. Before the experiment, premade molds were used to maintain the sludge’s shape during model construction, ensuring consistency in the model’s form. The experimental model design and proposed operational areas for detailed analysis are shown in Figure 4b.
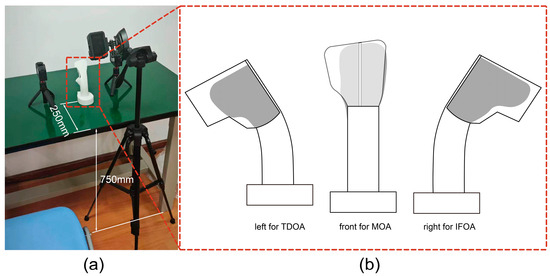
Figure 4.
(a) Experimental test rig; (b) experimental model for collecting grip manipulation data. “Front” means directly in front of the right-hand palm, and it is related to the MOA. Thus, “left” is related to the TDOA and “right” is related to the IFOA. The oil sludge is arranged on both sides (gray). The partitions are arranged so that operations in different areas do not affect each other.
The experimental model was fixed in a specific position before the experiment to simulate a realistic joystick operation scenario, as shown in Figure 4a. The height of the operation table was set at 715 mm, in alignment with the standards for Chinese adult body size. The model was positioned 250 mm from the table’s edge. The experimental setup included three strategically placed cameras to capture diverse data points: Camera 1 was positioned horizontally on the left of the TDOA; Camera 2 was angled at 20° vertically, parallel to the MOA; and Camera 3 was set horizontally on the right of the TDOA.
2.4.2. Experimental Task
The complexity of different operational tasks significantly influences the comfort of finger activities, affecting the range of operations. The trajectory for basic button operations is either a linear (switch) or a curve (knob) imposing low workload and enabling easy use. However, the trajectory of integrated buttons or touchscreens is complex and uncertain, which causes high workload. This leads to fatigue in the human hand, consequently decreasing finger dexterity [36,37]. Therefore, the range of comfortable operation can be viewed as an extension of the range under high load. Our experiment was set to explore the basic operation range of the fingers.
In order to reflect the dynamic operating range of users under high load, the experiment designed a repetitive traveling operation task (see Figure 5): participants were asked to finish the task without watching. They needed to start from any limit position (where operating fingers feel resistance) and draw the boundary of the polygon area in a spiral manner. Participants were instructed to maintain the sense of resistance while drawing to ensure that the boundaries represented the maximum range. The polygon boundaries are not fixed, and this is to provide participants with guidance for boundary exploration.
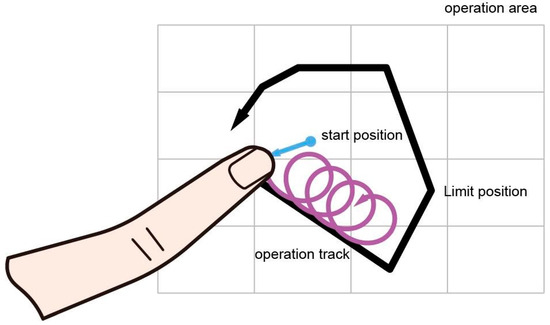
Figure 5.
The blue line indicates that the operating finger moves from the default position to any limit position; the black line indicates the operating limit position, depending on the participants; the purple curve indicates the trajectory of the participant’s finger.
2.4.3. Participants
Finger movements in the basic grip state are closely linked to the hand’s anthropometric dimensions. According to hand length data for Chinese adult males, three percentiles—P10 (174 ± 5 mm), P50 (184 ± 5 mm), and P90 (195 ± 5 mm)—were selected for grouping. The ANOVA analysis was employed in this study primarily to explore the differences in the operational ranges among these three groups. Regarding calculated results of ANOVA (α = 0.05, β = 0.8), 5 participants for each group were invited (power = 0.746, large). All participants were invited according to their self-reported biological gender of male, and they were all right-handed to ensure consistency in joystick operation. Before the experiment commenced, participants’ general health and history of hand diseases were confirmed to avoid potential influence.
2.4.4. Procedure
This experimental study involves testing the operational range in three different areas, and the participants’ operation range is recorded by the dyeing method (red for MOA, blue for IFOA, purple for TDOA). Before the experiment, participants needed to wear finger covers with corresponding dye. As the experiment commenced, we informed participants about the experimental content and operational specifications. Once participants signed the informed consent, they entered the experimental environment and familiarized themselves with the experimental model. Subsequently, each participant was asked to perform the experimental task. In each experiment, participants were instructed to use their thumb or index finger to perform the designated tasks in the predetermined operation areas while gripping the joystick. Their finger movements were recorded by cameras (DJI Action 4 (DJI, Shenzhen, China), 4K/60fps/Full color RGB/155° wide-angle lens). Each task was repeated three times to enhance data reliability, then the color coverage was photographed and recorded. At the end of each experiment, the range data were measured by a triaxial measurement device and collected. Informed consent was obtained from each participant, following the research protocol approved by Sichuan University.
3. Results
3.1. Main Operation Area
All 15 sets of experimental results are presented in the Figure 6a (P10×5, P50×5, P90×5). Distinct from the model’s base color, the painted areas have a clear boundary line and cover the bottom of the panel, indicating there is an upper limit of the thumb’s touch range in the MOA.
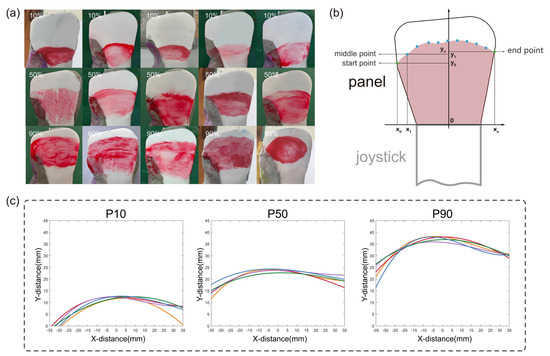
Figure 6.
(a) Experimental results of MOA; (b) normalized analysis based on Cartesian coordinate system established using the midpoint of the diameter as the origin. Commencing from the starting point, points are uniformly sampled along the positive x-axis at intervals of 50 pixels. (c) Fifteen sets of experimental data were collected. Different colors are used to distinguish the results of different participant operations.
The paint-marked upper edge was irregular and rough, likely influenced by individual habits, physical condition, and the interaction between the paint and materials, which could cause operational resistance. To extract the universal features of the upper edge curves of each experimental result, the study involved sampling feature points from the images and then performing polynomial fitting (see Figure 6b).
In Figure 6c, boundary curves in the same hand length percentile group are in roughly similar positions. With the increase of hand length, the boundary curves are waving up. The 15 boundary curves exhibit a similar trend, reaching the peak of the operable range near the origin. The curve on the origin’s right side descends more slowly than the left.
3.2. Index Finger Operation Area
All 15 sets of experimental results are provided in the Figure 7a (P10*5, P50*5, P90*5). The shape of dying areas does not present an apparent similar feature, but it indicates that there are thresholds in both vertical and depth directions for the index finger operation, as shown in Figure 7b. The Shapiro–Wilk normality test was performed before using ANOVA analysis, and the results were consistent with normality. Table 2 shows the ANOVA results of the index finger. There are statistical significances in the upper limit and maximum depth across different percentiles, while the lower limit and minimum depth do not show statistical significance.
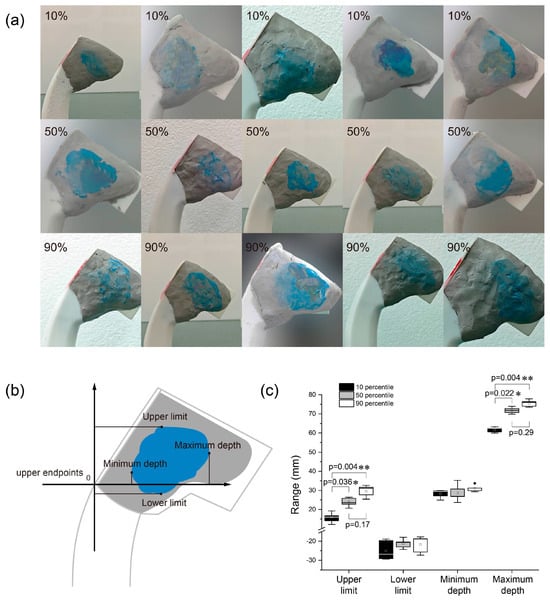
Figure 7.
(a) Experimental results of IFOA; (b) results in IFOA. The upper endpoint of the joystick was set as the origin, based on which a Cartesian coordinate system was established. (c) Results distributions are shown through box-and-line plots with significant differences labelled. * indicates p < 0.05; ** indicates p < 0.01.
Table 2.
ANOVA results for different finger dimensions (upper limit, lower limit, minimum depth, maximum depth) with respect to different human body size percentiles.
Based on the ANOVA results, we conducted post hoc Tukey HSD tests with different percentile groupings for variables that showed significant differences, as the results illustrated in Figure 7c. Specifically, for the upper limit, there is a statistical significance between P10 and P50 (p < 0.05) and a higher level of significance between P10 and P90 (p < 0.01), whereas there is only a low assumption for the difference between P50 and P90 percentile (p < 0.1). Regarding the maximum depth, there is a similar significance trend to the upper limit across different percentiles with a statistical significance between P10 and P50 (p < 0.05), a higher level of significance between P10 and P90 (p < 0.01), and a trifle significance between P50 and P90 (p < 0.1).
3.3. Thumb Deflection Operation Area
All 15 sets of experimental results are presented in Figure 8a (P10*5, P50*5, P90*5). There are thresholds in both vertical and depth directions for the thumb operation in this area. However, noteworthily, the minimum depth of every dye result is adjacent to the panel (see Figure 8b). Therefore, we exclude it in our following analysis. The Shapiro–Wilk normality test results were consistent with normality. As indicated in Table 2, statistical significances are found in the upper limit and maximum depth across different percentiles, while the lower limit does not show statistical significance.
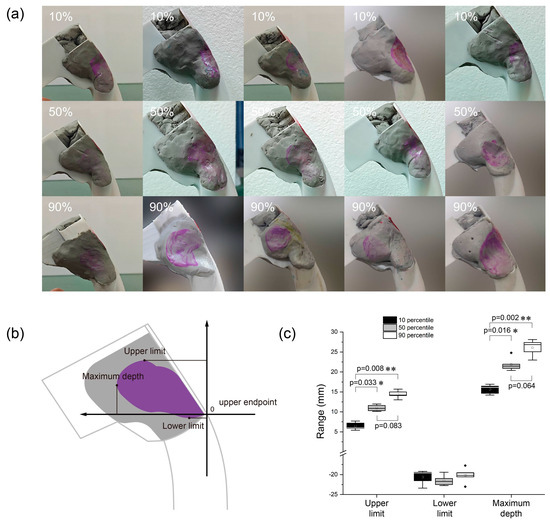
Figure 8.
(a) Experimental results of TDOA; (b) results in TDOA. The upper endpoint of the joystick was set as the origin, based on which a Cartesian coordinate system was established. (c) Results distributions are shown through box-and-line plots with significant difference labeled. * indicates p < 0.05, ** indicates p < 0.01.
Post hoc Tukey HSD results are shown in Figure 8c. Regarding the upper limit, there is a statistical significance between P10 and P50 (p < 0.05) and a higher level of significance between P10 and P90 (p < 0.01), whereas there is only a low assumption for the difference between P50 and P90 percentile (p < 0.1). And for the maximum depth, there is a statistical significance between P10 and P50 (p < 0.05), a higher level of significance between P10 and P90 (p < 0.01), and a slight significance between P50 and P90 (p < 0.1). With increasing hand length, the upper limit and the maximum depth increase, but its rate decreases.
We set the minimum depth as 0 mm for all groups based on our measurement principle and marked it with an endnote. Measurement data in IFOA and TDOA are stated in Table 3.
Table 3.
Thresholds with significant differences are indicated as the mean value for each percentile, respectively, while thresholds with none are indicated as the average value of the total independently.
4. Discussion
4.1. Features of MOA
Similar positions of boundary curves in the same percentile group indicate that there is a common and stable operation range for participants with similar hand lengths, which supports our hypothesis B. The point data of the upper edge from each percentile were combined into one dataset for overall curve fitting. Figure 9 indicates the results of each percentile. There are apparent differences in the operational ranges among the three percentiles, with an expanding trend. This suggests that the operational range of the MOA positively correlates with hand length.
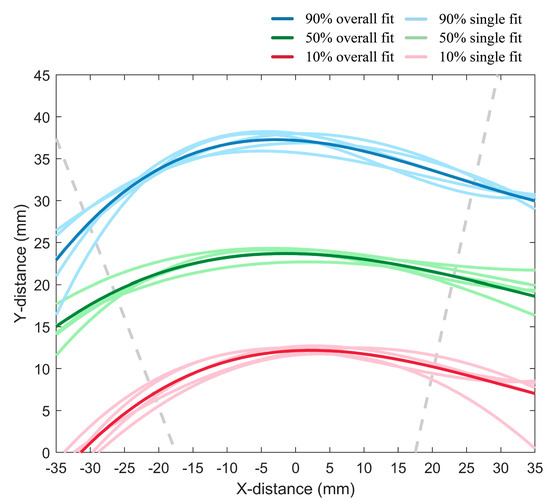
Figure 9.
Results of overall fit to the P10, P50, and P90 percentile data. The gray dashed lines present the boundaries of both sides of the MOA, with 25° of vertical deflection on the left and 15° of vertical deflection on the right. The lighter lines present the results of the single fit for each percentile.
Curves obtained from the overall fitting results for each percentile are shown below. The footnote of the function represents the percentile to which the curve belongs. We have calculated the distances between two adjacent boundary curves, and the results are quite stable. Inside the panel, the mean distance between the P10 and P50 is 12.1 mm, and the mean distance between the P50 and P90 is 12.9 mm. This could be a further consideration for button layout.
The universal asymmetric curve shape suggests that, during thumb operation, the operational range on the left side of the origin of MOA is more sensitive to angle and distance changes. This might be related to the physiological structure of the right hand, as the right thumb’s flexion or movement toward the left aligns more closely with common operational habits. This finding supports our hypothesis A, which posits greater flexibility in leftward movements, leading to the difference between MOA and TDOA.
The overall coverage on the bottom of the panel indicates that there are overlaps of operational areas at different percentiles. Participants of all percentiles can reach the area below the P10 percentile curve, while the area above this boundary is effectively operable only by the other P90. The same applies to the P50 and P90. This suggests an incremental feature for thumb operation range in this area.
4.2. Features of IFOA
The upper limit and the maximum depth increase with hand length, indicating that the overall range of index finger operation expands with body dimension. However, no statistical significances were found between the lower limit and between the minimum depth across percentiles. This suggests the same incremental feature for operation range in this area as in MOA with overlap coverage.
Although the vertical and depth range of index finger operation increases with percentile, the significance of the differences decreases. There is a non-linear relationship between the range and body dimension, with the expanding rate gradually slowing down.
The similar trend of vertical and depth range demonstrates a specific extension for the operation range. To quantify the geometric characterization of this range change, linear regression analysis was employed, with maximum depth as the independent variable and upper limit as the dependent variable. Based on our statistical results, the extension angle is close to 44.1° (R2 = 0.98), as shown in Figure 10.
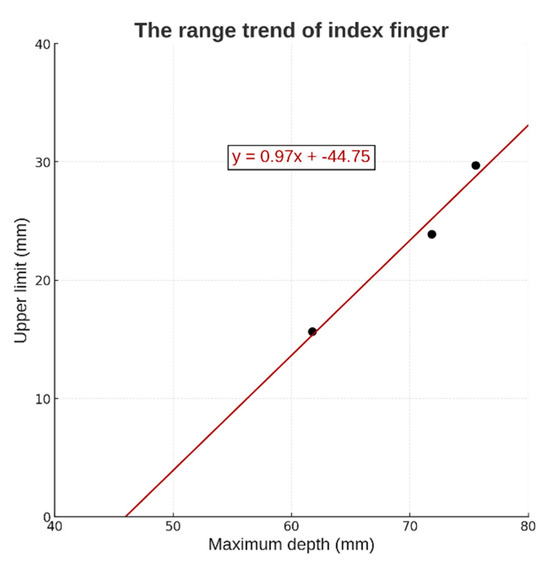
Figure 10.
Linear regression analysis of range trend in IFOA. The black dots show the limit distances in both directions for one percentile.
4.3. Features of TDOA
There is a same non-linear positive relativity between the operation range and body dimension in this area based on our measurement. The lower limit showed no significant difference across percentiles. Meanwhile, every participant has a 0 mm minimum depth as we set. These two fixed boundaries indicate another same incremental feature for operation range in TDOA.
Also, an extension angle is calculated through linear regression analysis as a similar increasing trend of maximum depth (independent variable) and upper limit (dependent variable), which is close to 36.5° (R2 = 0.99) (see Figure 11).
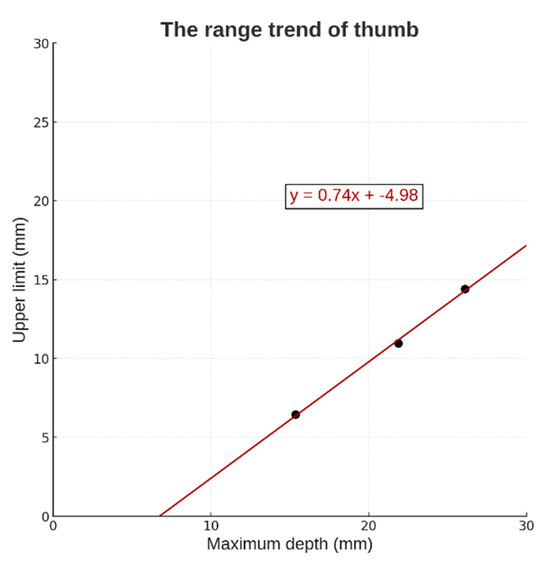
Figure 11.
Linear regression analysis of range trend in TDOA. The black dots show the limit distances in both directions for one percentile.
4.4. Incremental Design Guidelines for Joystick
There are three common operation areas while users operate with their index finger or thumb when gripping. Each area has its operation features including dimensions, trends, and orientation. These should be taken into serious consideration.
Based on the overall findings of incremental feature, the operation boundary of each percentile provides a graded reference for designing the joystick button layout in each operation area (see Figure 12): buttons that are complex in operation mode and require stability and safety should be prioritized within the area below the P10 boundary; button placement should progressively expand from the area of lower percentile to higher percentile based on the importance of functions and frequency of use; the P90 boundary curve should serve as the cutoff for button layout, as finger operations beyond this range will be difficult to achieve.
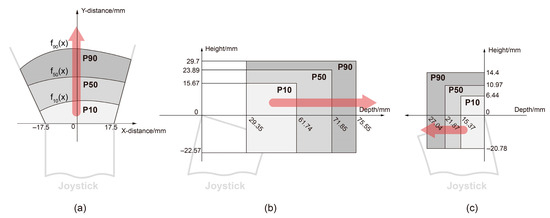
Figure 12.
Incremental design reference. Red arrows indicate the direction of increasing difficulty of operation. (a) MOA incremental range; (b) IFOA incremental range; (c) TDOA incremental range.
4.5. Limitation
This study has several limitations that should be carefully considered. First, only one group of parameters was used in the experimental grip handle design. Due to variations in hand size, a single handle size may not be suitable for all users, particularly concerning diameter. Different handle sizes can influence finger movement. Second, the finger movements required in the experimental task differ from those used in the comfortable operation of actual buttons. The operation ranges obtained from our experiment provide limited design guidance. Third, our research is based on adult male size data. Further research is still needed for joystick button layout references tailored to the female.
To advance the field and enhance the practical relevance of these findings, future investigations should focus on examining the effect of different handle sizes on finger movement and considering operation that relates to practical work.
5. Conclusions
We constructed and analyzed a basic grip state based on adult male body sizes, proposing an operation area division based on the index finger and thumb: MOA, IFOA, and TDOA. Three further experiments on different operation areas revealed the operational characteristics of users using their right-hand thumb or index finger for complex tasks in a basic grip state. The operation range in MOA has an upper boundary curve increasing with the body percentile, revealing the asymmetry of thumb movement and its greater flexibility when moving to the left. The IFOA and TDOA both have an expanded operation range as the body size increases. However, there is a fixed vertical lower limit for IFOA and TDOA and a fixed horizontal minimum depth for IFOA, which should be noticed. Based on the experimental results, our study proposes incremental design guidelines for joystick button layout. Further investigation is needed, as factors like joystick size, operational tasks, and gender could lead to different results. Future studies should also focus on the impact of the interface’s form, making the design references more rigorous and systematic.
Author Contributions
Conceptualization, T.Y., M.W. and J.R.; Methodology, T.Y.; Validation, T.Y., X.D. and S.Z.; Formal analysis, T.Y.; Investigation, T.Y., X.D., X.L. and S.Z.; Resources, M.W. and J.R.; Writing—original draft, T.Y.; Supervision, M.W.; Project administration, M.W.; Funding acquisition, M.W. and J.R. All authors have read and agreed to the published version of the manuscript.
Funding
This work was supported by the Provincial Science and Technology Project of Sichuan, China (2022ZHCG0043-LH).
Institutional Review Board Statement
Ethical approval was waived in accordance with China’s Ethical Review Measures for Biomedical Research Involving Humans (Article 39) due to the use of irreversibly anonymized data.
Informed Consent Statement
Informed consent was obtained from all participants prior to data collection.
Data Availability Statement
The original contributions presented in this study are included in the article. Further inquiries can be directed to the corresponding author.
Conflicts of Interest
No potential conflict of interest was reported by the authors.
Correction Statement
This article has been republished with a minor correction to the existing affiliation information. This change does not affect the scientific content of the article.
References
- Xiong, J.; Muraki, S. An Ergonomics Study of Thumb Movements on Smartphone Touch Screen. Ergonomics 2014, 57, 943–955. [Google Scholar] [CrossRef] [PubMed]
- Park, Y.S.; Han, S.H.; Park, J.; Cho, Y. Touch Key Design for Target Selection on a Mobile Phone. In Proceedings of the 10th International Conference on Human Computer Interaction With Mobile Devices and Services, Amsterdam, the Netherlands, 2–5 September 2008; Association for Computing Machinery: New York, NY, USA, 2008; pp. 423–426. [Google Scholar]
- Campos, A.; Neto, C.F.; Cansian, M.; Reis, A.; Borges, N. Touchscreen Device Layout Based on Thumb Comfort and Precision. In Proceedings of the 5th IEEE RAS/EMBS International Conference on Biomedical Robotics and Biomechatronics, Sao Paulo, Brazil, 12–15 August 2014; IEEE: Sao Paulo, Brazil, 2014; pp. 975–980. [Google Scholar]
- Qian, J.Y.; Xue, Q.; Huang, S.S. The Control Panel Configuration Design of Spiral Juice Machine Based on the Ergonomics. Packag. Eng. 2018, 3, 193–199. [Google Scholar] [CrossRef]
- Choi, G.; Kim, H.; Jeong, Y.; Son, M.; Beck, D. A Study on Ergonomic Layout of Automotive Electronic Shift Buttons. Appl. Sci. 2022, 12, 9222. [Google Scholar] [CrossRef]
- McLoone, H.E.; Jacobson, M.; Hegg, C.; Johnson, P.W. User-Centered Design and Evaluation of a next Generation Fixed-Split Ergonomic Keyboard. Work 2010, 37, 445–456. [Google Scholar] [CrossRef]
- Huysmans, M.A.; De Looze, M.P.; Hoozemans, M.J.M.; Van Der Beek, A.J.; Van Dieën, J.H. The Effect of Joystick Handle Size and Gain at Two Levels of Required Precision on Performance and Physical Load on Crane Operators. Ergonomics 2006, 49, 1021–1035. [Google Scholar] [CrossRef] [PubMed]
- Koyama, S.; Tatemoto, T.; Kumazawa, N.; Tanabe, S.; Nakagawa, Y.; Otaka, Y. The Effect of Differences in Powered Wheelchair Joystick Shape on Subjective and Objective Operability. Appl. Erg. 2023, 107, 103920. [Google Scholar] [CrossRef]
- Cooper, R.A.; Jones, D.K.; Fitzgerald, S.; Boninger, M.L.; Albright, S.J. Analysis of Position and Isometric Joysticks for Powered Wheelchair Driving. IEEE Trans. Biomed. Eng. 2000, 47, 902–910. [Google Scholar] [CrossRef]
- Bassoli, E.; Gatto, A.; Iuliano, L.; Marchiandi, G. Reverse Engineering Approach for a Joystick Handgrip Re-Styling with Ergonomic Features. In Proceedings of the 3D Modelling 2003, Paris, France, 23–24 April 2003. [Google Scholar]
- Bassoli, E.; Gatto, A.; Iuliano, L.; Leali, F. Design for Manufacturing of an Ergonomic Joystick Handgrip. In Proceedings of the World Automation Congress, Seville, Spain, 28 June–1 July 2004; IEEE: Piscataway, NJ, USA, 2004; Volume 18, pp. 461–466. Available online: https://ieeexplore.ieee.org/abstract/document/1441084 (accessed on 20 June 2005).
- Lo, C.-H.; Ko, Y.-C. A Study of the Difference in Operating Performance Due to a Gaming Joystick’s Styling and Button Locations. In Proceedings of the 2017 International Conference on Organizational Innovation (ICOI 2017), Weihai, China, 18–20 July 2017; Atlantis Press: Dordrecht, The Netherlands, 2017; pp. 267–271. [Google Scholar]
- Alkemade, J. LapaJoy: A 3D-Printed Ergonomic Handle Design for a Steerable Laparoscopic Instrument with Minimised Part Assembly; TU Delft Repository: Delft, The Netherlands, 2021. [Google Scholar]
- van den Noort, J.C.; van Beek, N.; van der Kraan, T.; Veeger, D.H.E.J.; Stegeman, D.F.; Veltink, P.H.; Maas, H. Variable and Asymmetric Range of Enslaving: Fingers Can Act Independently over Small Range of Flexion. PLoS ONE 2016, 11, e0168636. [Google Scholar] [CrossRef]
- Rachaveti, D.; Chakrabhavi, N.; Shankar, V.; Skm, V. Thumbs up: Movements Made by the Thumb Are Smoother and Larger than Fingers in Finger-Thumb Opposition Tasks. PeerJ 2018, 6, e5763. [Google Scholar] [CrossRef]
- Xu, J.; Mawase, F.; Schieber, M.H. Evolution, Biomechanics, and Neurobiology Converge to Explain Selective Finger Motor Control. Physiol. Rev. 2024, 104, 983–1020. [Google Scholar] [CrossRef]
- Arauz, P.; Sisto, S.A.; Kao, I. Experimental Study of the Optimal Angle for Arthrodesis of Fingers Based on Kinematic Analysis with Tip-Pinch Manipulation. J. Biomech. 2016, 49, 4009–4015. [Google Scholar] [CrossRef] [PubMed]
- Bullock, I.M.; Feix, T.; Dollar, A.M. Workspace Shape and Characteristics for Human Two- and Three-Fingered Precision Manipulation. IEEE Trans. Biomed. Eng. 2015, 62, 2196–2207. [Google Scholar] [CrossRef] [PubMed]
- Chia, A.; Balash, C. Towards an Improved Intuitive Interface for Remotely Operated Vehicles. J. Ocean Eng. Sci. 2020, 5, 346–357. [Google Scholar] [CrossRef]
- Rommel, B. TOP 8 Hidden BMW iDrive Features—Revealed|BimmerTech. Available online: https://www.bimmer-tech.net/blog/item/128-idrive-hidden-features (accessed on 20 December 2023).[Green Version]
- Bezek, S. GitHub—Scottbez1/Smartknob: Haptic Input Knob with Software-Defined Endstops and Virtual Detents. Available online: https://github.com/scottbez1/smartknob (accessed on 20 December 2023).[Green Version]
- Ekşioğlu, M.; İşeri, A. An Estimation of Finger-Tapping Rates and Load Capacities and the Effects of Various Factors. Hum. Factors 2015, 57, 634–648. [Google Scholar] [CrossRef]
- Conway, B.J.; Taquet, L.; Boerger, T.F.; Young, S.C.; Krucoff, K.B.; Schmit, B.D.; Krucoff, M.O. Quantitative Assessments of Finger Individuation with an Instrumented Glove. J. NeuroEng. Rehabil. 2023, 20, 48. [Google Scholar] [CrossRef]
- Pylatiuk, C.; Kargov, A.; Schulz, S.; Döderlein, L. Distribution of Grip Force in Three Different Functional Prehension Patterns. J. Med. Eng. Technol. 2006, 30, 176–182. [Google Scholar] [CrossRef]
- Maleki-Ghahfarokhi, A.; Dianat, I.; Azghani, M.; Asghari-Jafarabadi, M.; Parnianpour, M. T-Shaped Handle Set-up: Effects of Handle Diameter, between-Handle Distance, Workpiece Orientation, Working Height, and Exertion Direction on Two-Handed Torque Strength, Usability, Comfort, and Discomfort. Ergonomics 2023, 66, 1015–1030. [Google Scholar] [CrossRef] [PubMed]
- Pheasant, S.; O’neill, D. Performance in Gripping and Turning—A Study in Hand/Handle Effectiveness. Appl. Ergon. 1975, 6, 205–208. [Google Scholar] [CrossRef]
- Dianat, I.; Rahimi, S.; Nedaei, M.; Jafarabadi, M.A.; Oskouei, A.E. Effects of Tool Handle Dimension and Workpiece Orientation and Size on Wrist Ulnar/Radial Torque Strength, Usability and Discomfort in a Wrench Task. Appl. Ergon. 2017, 59, 422–430. [Google Scholar] [CrossRef]
- Kong, Y.-K.; Lowe, B.D. Evaluation of Handle Diameters and Orientations in a Maximum Torque Task. Int. J. Ind. Ergon. 2005, 35, 1073–1084. [Google Scholar] [CrossRef]
- Manasnayakorn, S.; Cuschieri, A.; Hanna, G.B. Ideal Manipulation Angle and Instrument Length in Hand-Assisted Laparoscopic Surgery. Surg. Endosc. 2008, 22, 924–929. [Google Scholar] [CrossRef] [PubMed]
- 30 GB/T 10000-2023; Human Dimensions of Chinese Adults. National Standards of the People’s Republic of China: Beijing, China, 2023.[Green Version]
- 31 GB/T 16252-2023; Hand Sizing System of Adults. National Standards of the People’s Republic of China: Beijing, China, 2023.[Green Version]
- ISO/TR 7250; Basic Human Body Measurements for Technological Design. Part 2: Statistical Summaries of Body Measurements from National Populations. ISO: Geneva, Switzerland, 2024.[Green Version]
- ANSI/HFES 100-2007; Human Factors Engineering of Computer Workstations. Human Factors and Ergonomics Society: Santa Monica, CA, USA, 2007.[Green Version]
- McCambridge, J.; De Bruin, M.; Witton, J. The Effects of Demand Characteristics on Research Participant Behaviours in Non-Laboratory Settings: A Systematic Review. PLoS ONE 2012, 7, e39116. [Google Scholar] [CrossRef] [PubMed]
- Lachnit, H.; Pieper, W. Speed and Accuracy Effects of Fingers and Dexterity in 5-Choice Reaction Tasks. Ergonomics 1990, 33, 1443–1454. [Google Scholar] [CrossRef] [PubMed]
- Kruger, E.S.; Hoopes, J.A.; Cordial, R.J.; Li, S. Error Compensation during Finger Force Production after One- and Four-Finger Voluntarily Fatiguing Exercise. Exp. Brain Res. 2007, 181, 461–468. [Google Scholar] [CrossRef]
- Avanzino, L.; Tacchino, A.; Abbruzzese, G.; Quartarone, A.; Ghilardi, M.F.; Bonzano, L.; Ruggeri, P.; Bove, M. Recovery of Motor Performance Deterioration Induced by a Demanding Finger Motor Task Does Not Follow Cortical Excitability Dynamics. Neuroscience 2011, 174, 84–90. [Google Scholar] [CrossRef]
Disclaimer/Publisher’s Note: The statements, opinions and data contained in all publications are solely those of the individual author(s) and contributor(s) and not of MDPI and/or the editor(s). MDPI and/or the editor(s) disclaim responsibility for any injury to people or property resulting from any ideas, methods, instructions or products referred to in the content. |
© 2025 by the authors. Licensee MDPI, Basel, Switzerland. This article is an open access article distributed under the terms and conditions of the Creative Commons Attribution (CC BY) license (https://creativecommons.org/licenses/by/4.0/).