Article

Ferry Electrification Energy Demand and Particle Swarm Optimization Charging Scheduling Model Parameters Analysis

1
Faculty of Maritime Studies, University of Split, Ulica Ruđera Boškovića 31, 21000 Split, Croatia
2
Naval Studies, University of Split, Ulica Ruđera Boškovića 31, 21000 Split, Croatia
*
Author to whom correspondence should be addressed.
Appl. Sci. 2025, 15(6), 3002; https://doi.org/10.3390/app15063002
Submission received: 30 January 2025 / Revised: 3 March 2025 / Accepted: 8 March 2025 / Published: 10 March 2025
(This article belongs to the Section Marine Science and Engineering)

Abstract

:
Maritime transportation significantly contributes to air pollution, especially in coastal cities. Air pollution represents the greatest health risk related to the environment in the European Union. Therefore, the European Commission published the European Green Deal, which introduces the rule of zero-emission requirements for ships at berths with the mandatory use of power supply from shore or alternative technologies without emissions. The electrification of ferries has proven to be a key approach in reducing the negative impact on the environment; hence, it is necessary to provide adequate infrastructure for charging electric ferries. To determine the energy needs of the shore connection, a daily energy profile of the ferry fleet was created. Due to the sailing schedule, daily energy needs may be non-periodic. By optimizing the charging process, a reduction in peak charging power can be achieved. The charging process was optimized using particle swarm optimization. To improve the function goal, the parameters of the model were analyzed and optimized. It was found that the correct selection of population size and inertia weight factor can significantly enhance the optimization effect. The proposed model can be applied to other ports of interest, considering the specifics of the exploitation of the fleet of ships.

1. Introduction

Transportation significantly contributes to air pollution and the emission of harmful gases in the territory of the European Union (EU). According to [1], transportation is responsible for the total emissions of particulate matter PM2.5 (PM smaller than 2.5 μm) in certain cities, namely Malmö, 39% of overall PM; Brescia, 28%; Parma, 27%; and Angers and Verona, 26%. Maritime transport also contributes to air pollution, especially in the area of coastal cities such as Valletta, 33%; Palermo, 29%; Palma de Mallorca, 26%; Athens, 24%; and Bari, 21%. In the territory of the Republic of Croatia, as much as 95.1% of the population has been exposed to PM10 (PM smaller than 10 μm) at a concentration higher than EU standards [2]. Air pollution is the main cause of premature death and disease and, as such, represents the greatest health risk related to the environment in the European Union. According to data from the European Environment Agency observed on an annual basis, in 2019 alone, acute exposure to PM caused 307,000 premature deaths in 27 EU member states [3]. The above has significant implications for reduced life expectancy, increased costs of the health care system, and reduced productivity. Therefore, in July 2023, the International Maritime Organization (IMO) revised the strategy to reduce greenhouse gases compared to the ambitions of 2018. Thus, the final goal for reducing GHG emissions in 2050, which was 50% compared to emissions in 2008, was reduced to 0 emissions [4]. In March 2023, the European Commission published the European Green Deal [5], which introduces a zero-emission requirement for ships at berths with the mandatory use of power supply from land or alternative technologies without emissions. The main goal of this agreement is to reduce air pollution in ports, often located near densely populated areas. The Fuel EU maritime initiative [6] is an interim agreement reached in March 2023 that promotes the systematic use of renewable energy sources and low-carbon fuels. However, the forecast for assessing the use of a certain type of fuel in shipping is quite uncertain [7]. Due to technical limitations, the decarbonization of maritime transport will increase total costs by 70% to 110%. According to [8], the gradual introduction of renewable fuels is foreseen, as shown in Figure 1.
The European Union’s current goal is to increase the share of renewable energy sources (RES) in energy consumption by 32% by 2030. In the Republic of Croatia, in 2023, 50% of the total electricity produced was produced by hydroelectric power plants alone [9].
In accordance with the energy needs of ships and the capabilities of the shore electrical system, the design of a battery charging station is proposed. The charging station can be performed in different ways; however, it is most often designed in one of the following configurations:
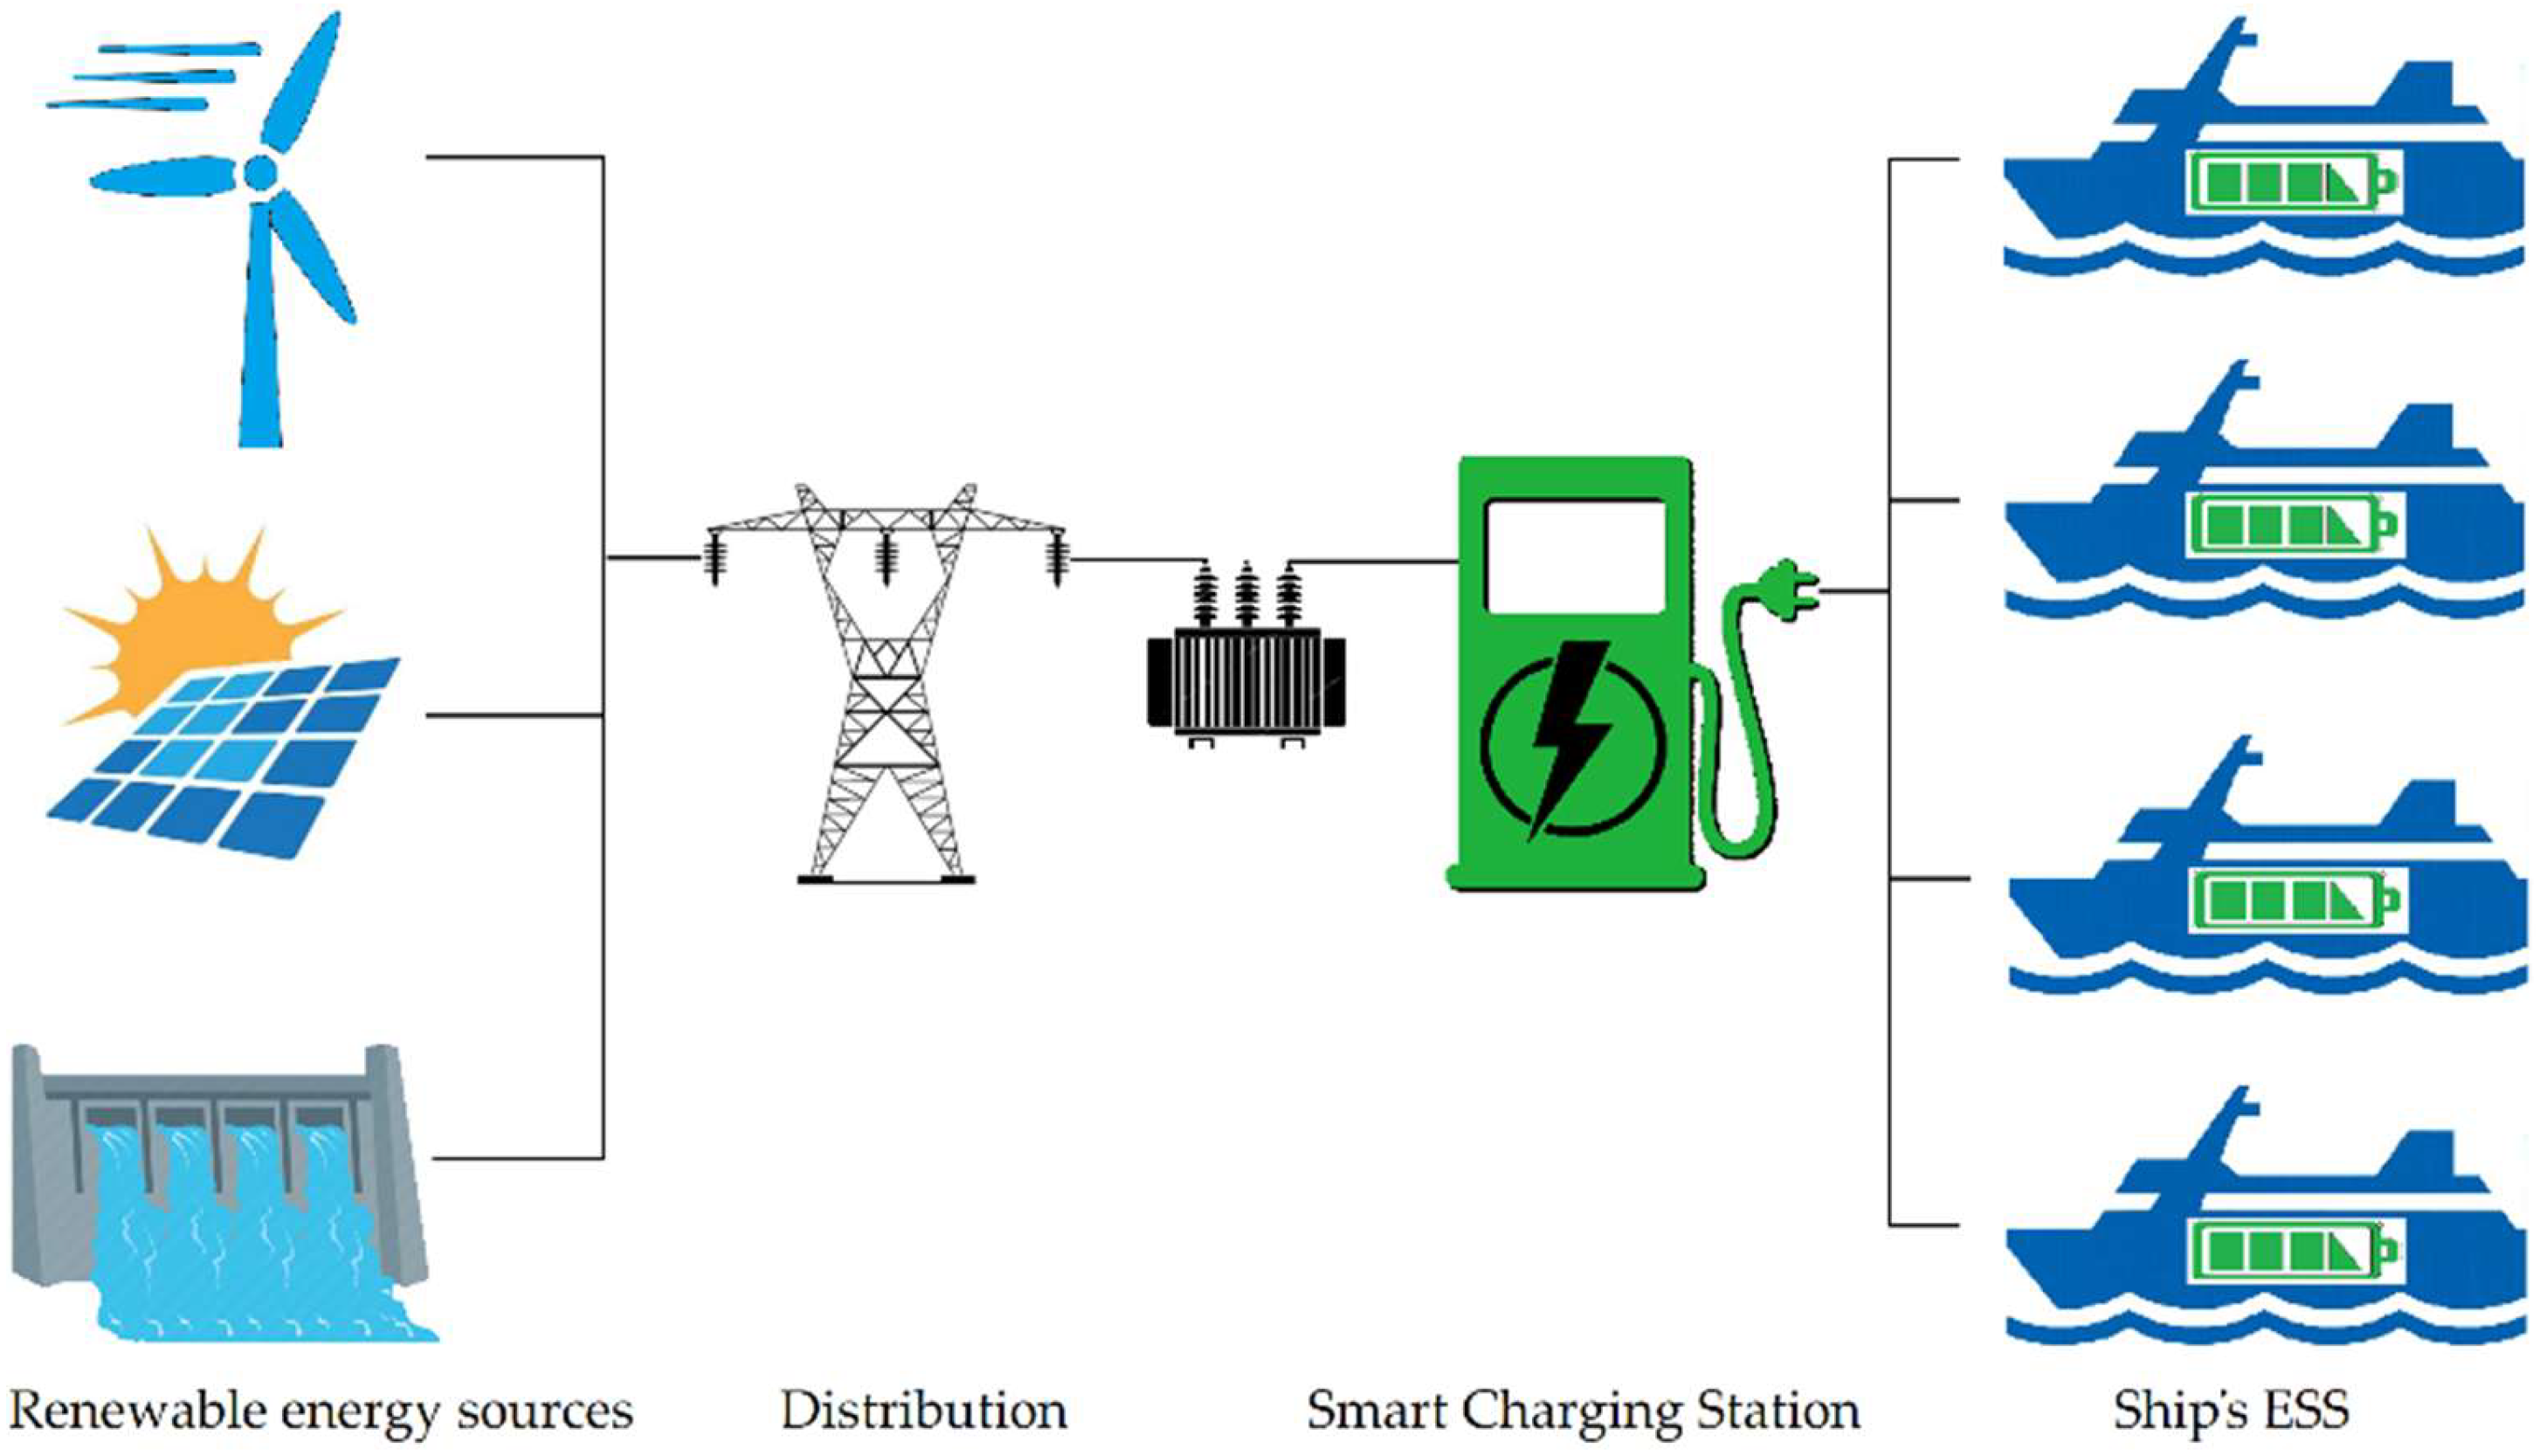
Direct charging from the shore network (AC or DC);
Combined charging using own diesel generators (DG) and shore network;
Combined charging using a shore energy storage system (ESS) and power supply from the shore.
Direct charging from shore is the most acceptable solution if the energy infrastructure fulfills the needs of the battery charging station. The possibility of the connection is usually feasible only in large seaports with a developed energy infrastructure. The charging station can be connected to low-voltage, medium-voltage, or high-voltage levels. However, in practice, ferry docks are often located in sheltered ports without an available infrastructure that adequately meets the requirements of the charging station. Therefore, simultaneous charging using the ship’s generators and a connection from shore is often applied. In this case, when ship generators are used, it is a hybrid system.
If the shore connection does not enable sufficient power, an electrical ESS can be used, which is charged when the ship is not connected to the charging station. When the ship is connected to the charging station, the energy from the shore-based ESS and the connection from the shore grid for charging the ship’s ESS are simultaneously used. In this case, investment costs are higher. Additionally, there are losses due to the charging and discharging of the terrestrial battery storage [10].
Based on the created daily profile of energy needs, optimization was carried out with the aim of reducing the peak load. In accordance with the defined problem and the subject of the research, a basic and auxiliary scientific hypothesis was set.
Hypothesis 0 (H0):
In the case of electrification of the ferry fleet, the energy needs exceed the capacities of the shore-based power infrastructure. The profile of daily energy needs is non-periodic and, therefore, not suitable for charging from a shore infrastructure.
Hypothesis 1 (H1):
Proper model parameters selection and adjustment can additionally reduce the required installed power during the optimization process.

2. Literature Review

In order to reduce the emission of harmful gases and the negative impact on the environment, it is necessary to use a comprehensive approach in the design, construction, and exploitation of ships. According to [11], by applying diesel/electric propulsion compared to standard propulsion, significant savings in harmful gas emissions are possible, as well as economic savings on an annual level in the amount of 22%. Electric energy sources for ship propulsion have multiple advantages. Significant savings can be achieved by optimal hull design, which reduces the ship’s hydrodynamic resistance. The use of advanced protective coatings reduces the ship’s resistance [12]. Additionally, during the exploitation of the ship, the overgrowth of the hull significantly affects fuel consumption [13].
The design and efficiency of the propeller contribute to the reduction of fuel consumption [14]. By choosing the optimal route and sailing speed, savings in fuel consumption are achieved [15]. With the observed type of maritime transport, the navigation route is pre-defined and can be slightly influenced. On the other hand, the speed of the ship significantly affects fuel consumption. Figure 2 shows the relationship between changes in ship speed, which affects the required power of the propulsion engine and, consequently, fuel consumption. For example, as a result of reducing the maximum speed of a ship by 20%, the power consumption and fuel consumption are reduced by 60%. Fuel consumption depends on the type of vessel and its features, but it can be generalized that the power used is proportional to the cubic speed of the vessel. As the ferry sailing routes are relatively short, reducing the peak speed does not significantly affect the length of the journey, as part of the time is spent on maneuvering when entering and leaving the port.
The aforementioned technologies and efforts are aimed at increasing the energy efficiency of fossil fuel-powered ships. Of course, the contributions are significant, but the source of energy needed to propel the ship should be renewable with as little environmental impact as possible. In this research, the use of electric energy to propel a ship, more precisely a group of ferries, is proposed.
In article [17], a model of a multi-energy ship network with combined power, thermal, hydrogen, and freshwater flows is proposed. By applying the coordinated planning model, the flexibility and practicality of the planning process is increased. Based on the case study, multiple comparative analyses confirmed the effectiveness of the method. In the research [18], energy management and voyage scheduling were modeled with the aim of increasing energy efficiency and reducing greenhouse gas emissions. Unlike previous research, this also took into account the underwater radiated noise generated by the action of the ship’s propeller. The model has been verified in real conditions and shows efficiency.
Table 1 shows examples of the application of RES on electrically powered ferries. Although there are earlier examples of the use of electric ferries, vessels launched in the period from 2012 to 2023 were taken into consideration.
Table 1 shows 21 ferries that were designed for electric propulsion or were retrofitted for electric propulsion during their lifetime. Analyzing the data from the table, certain conclusions can be drawn to predict the trend in the case of the electrification of the observed ferry fleet that uses the port of Split. Thus, the average length of the vessel is 91.5 m, the average passenger capacity is 553, the average vehicle capacity is 139.5, the average speed is 12.8 kt, the average power is 3328 kW, and the average battery capacity is 2177 kWh.

Comparison with Other Recent Research

The PSO method is used for energy management of the hybrid system of an electric vehicle charging station [40]. In this paper, the PSO method of energy management has been developed, taking into account active power loss, reactive power loss operation cost, power flow, and voltage deviation. Although the research is applicable to smart grid applications, the primary function of the goal is to reduce operating costs. In the study [41], PSO was used to optimally coordinate the charging schedule of electric vehicles, considering the habits of users. In this paper, the function of the goal is to minimize power loss. The results show that coordinated charging can optimize the load and reduce energy network losses. Article [42] uses an improved PSO aiming to increase the energy efficiency of the ship. The microgrid model minimizes system costs and improves system management with proper scheduling. Research [43] based on the Swarm Exchange Particle Swarm Optimization Algorithm reconfigures the power grid of a circular power system with the aim of extending the lifespan of a ship’s power station. The simulation model reduces the time required for reconfiguration and improves the performance of the ship’s power system. As the ports are important consumers of electricity, their energy efficiency is attracting more and more attention. For ports to comply with increasingly stringent regulations, it is crucial to apply new technologies of renewable energy sources and alternative fuels with the aim of optimizing operations or, for example, reducing peak shavings [44]. In the research [45], a mixed linear programming model was proposed with the aim of energy management considering the uncertainty of energy generation through renewable sources. The study shows that by using a smart grid, significant economic savings are possible compared to conventional settings. In most research, the goal is to reduce economic costs. However, in this study, the goal is to reduce the peak power required for charging groups of ferries. Given the research gap, this research represents a novelty.

3. Materials and Methods

3.1. Split City Port Features

The Republic of Croatia is a maritime country with a thousand-year tradition. Due to the extremely indented coast with a length of 6278 km and 1244 islands, islets, rocks, and reefs, maritime transport is of particular importance for the coastal and island populations [46].
Split is the second-largest city in the Republic of Croatia and the largest Croatian city on the eastern coast of the Adriatic Sea [46]. Split is an important cultural and traffic center, the second-largest Croatian port, and the third-largest passenger port in the Mediterranean. In 2024, the city of Split was visited by 1,040,300 tourists and had 3,130,060 overnight stays [47]. The port of Split is the most important passenger port in Croatia; it connects the large islands of the Croatian coast. Moreover, it also takes part in international passenger traffic from Italy. In addition, the port has a cargo port with a relatively modest local hinterland consisting of the Dalmatia region and parts of Bosnia and Herzegovina. The port of Split is a port open to international public traffic, and according to its size and significance, it is a port of special (international) economic interest for the Republic of Croatia [48]. Figure 3 shows the plan of the City Port of Split. The land area of responsibility of the Split Port Authority is marked in gray.
Emissions of harmful gases into the environment in the Split waterway are generated by vessels that maintain state ferry lines, high-speed shipping lines, and long-shore and international lines. Furthermore, large cruise ships, fast private and public ships, and recreational vessels that use the nautical port within the City Port of Split also contribute to emissions of harmful gases. Figure 4 shows the type of vessels that sail into the City Port of Split [50]. Ferry transport accounts for one part of the emissions of harmful gases generated in the Split waterway. Observing the planned quotas for fuel procurement of the state operator Jadrolinija in 2023 [51], it is evident that the analyzed ferry fleet accounts for 60.8%. The remaining part of the procurement refers to high-speed shipping lines and international lines. In the case of electrification of all vessels entering the City Port of Split, an analysis of energy needs should be performed for each group of vessels separately.
The study [52] analyzes the inventory of pollutants generated by line vessels during the maneuvering and hoteling phase in the area of the City Port of Split. The total inventory of harmful effects on the environment in the observed three-year period is as follows: non-methane volatile organic compounds (NMVOC) 38.31 (t), PM 33.97 (t), CO2 38,908.95 (t), NOX 675.17 (t), SO2 368.15 (t). In the case of a transition to fully electric propulsion, where ESS is charged via RES, there would be zero emissions.

3.2. Split City Port Study Case—Ferry Fleet Energy Demand Analysis

Split is connected by state ferry lines with ports on the central Dalmatian islands, as shown in Table 2 [53,54]. The ferry lines connecting Split with international ports are not taken into consideration in this work. The table shows the average annual number of passengers and vehicles, the duration of sailing in one direction, the number of sailings, and the number of sailing hours on an annual basis. The presented statistical data take into account the period from 2019 to 2022.
In order to determine the requirements that must be met by the shore-based power grid, it is necessary to determine the energy needs of ships that use the City Port of Split as one of their base ports. Different approaches can be applied in the analysis of the energy needs of the ferry fleet. The most reliable way would be to analyze the total annual consumption of diesel fuel of the observed fleet.
In the observed period, due to the introduction of new vessels, the needs of the operator, and the operational status of the vessel, there were minor changes in the navigation schedule. However, using the list of ships of the Jadrolinija fleet in national and international navigation, in which the annual fuel quotes are listed, the total annual fuel consumption can be determined [51]. The planned annual consumption of diesel fuel by the ferry fleet of the Split waterway for ships that maintain the lines is 15,717,041 L of diesel fuel. Table 3 lists all the ferries of the Split waterway that maintain the observed state ferry lines [53]. The overall length, maximum speed, passenger and vehicle capacity, the line served by the ferry, and the annual fuel consumption rate are shown.
First, it is necessary to determine how much useful work can be generated by the fuel used. Modern medium-speed diesel engines have a high degree of useful action, which amounts to about 50% of the energy contained in the fuel [55]. However, in real conditions, only 30–45% of energy is used for useful work [56]. The reason for this is mainly the unfavorable exploitation of the propulsion system. When sailing short distances, a significant part of the time is spent on maneuvering the vessel, which is a mode in which the efficiency of the engine is considerably reduced. Furthermore, it is necessary to consider the average age of the propulsion system of the observed fleet, which is over 23 years [53].
Diesel fuel compliant with EN 590:2013 (Automotive fuels—Diesel—Requirements and test methods) is used as fuel. The specific density of diesel fuel, according to the EN590 norm, is between 820 and 845 kg/m3 at 15 °C, while the typical average value is 835 kg/m3 [57]. The mass of loaded fuel is calculated according to the formula:
m = ρ × V
where ρ is the specific density and V is the volume of the loaded fuel. Therefore, 16,805,374 L of diesel fuel has a mass of 13,123,729 kg. The upper heating power Hg, i.e., the maximum possible energy that can be obtained by burning the fuel used is 45 MJ/kg [58]. The total heating power H is calculated according to the formula:
H = H g × m
The total heating power of the fuel used on an annual basis is 590,567 GJ. Therefore, the total heating power is the equivalent of 164 GWh. In accordance with the efficiency of the diesel engines observed in this analysis, a lower efficiency limit of 30% was taken for calculation according to the formula; annual energy needs are calculated according to:
E A N N U A L   N E E D S = P E N E R G Y   D E L I V E R E D   T O   T H E   S H A F T   L I N E P T O T A L   E N E R G Y   C O N T A I N E D   I N   F U E L  
Based on a previous formula, the annual energy needs amount to 49.2 GW/h. Furthermore, the question arises whether the required power of an electrified fleet of ferries would be equal to the needs of the existing fleet. First of all, it depends on the design requirements and the specifics of the waterway. However, observing the maximum speed of the electrified ferries from Table 1 in comparison with the existing ferries that maintain the considered lines, a decrease in the average peak speed can be observed from 14.13 to 12.8 kt (the difference is 1.33 kt). The regression curve connecting the required propulsive power Pp and the speed of the ship v can be defined as a power function with added estimated parameters of the thrust functions a and c.
P p = a × v c
Using data from the World Register of Ships database for ferries sailing on the Croatian side of the Adriatic Sea, parameter a is 0.0757, parameter c is equal to 3.987, while the correlation factor R2 = 0.91 [59]. Considering the correlation factor, it can be concluded that there is a strong connection, i.e., that the model is representative. However, the almost insignificant reduction in peak speed in the amount of 9.5% results in a reduction of the required propulsive power by 32.6%. The mentioned saving is not only reflected in fuel consumption but also in the reduction of the required installed power of the propulsion system, which significantly reduces investment costs. Furthermore, the introduction of new technologies in the optimization of the hull and ship’s propeller and the use of ship coatings contribute to the reduction of fuel consumption. Certainly, in the case of electrification of ferries, all the mentioned methods of reducing energy consumption would be applied. However, for the sake of objectivity, in this energy analysis, possible savings in energy consumption will not be considered in order to make the analysis as objective as possible. Losses of the shaft line and propeller were not considered because they are common to both versions of the propulsion system.
As with internal combustion engines, losses also occur with electromotive systems. The chemical energy contained in the batteries needs to be converted into electricity, and then the electricity into mechanical work, which is transferred to the shaft transmission line. The efficiency of modern high-voltage electric motor drives in favorable conditions can be over 98% [60]. Losses of the battery system depend on the state of charge, the technology used, and other different parameters. Losses occur during charging, storage, and discharging of the battery. According to a study [61], the efficiency of the entire process of the battery system is 81%.
The amount of energy required to drive the state ferry fleet on the shaft line is 49.2 GW/h. Considering the efficiency of the electric drive and the battery, the required energy delivered from the shore connection to the ship is calculated according to the formula:
E S C = P E N E R G Y   D E L I V E R E D   T O   T H E   S H A F   L I N E + L o s s e s B A T T E R Y + E L E C T R O M O T I V E   S Y S T E M
where ESC is shore connection required energy.
Therefore, the required energy delivered from the shore connection to the ship is 62 GWh. In this research, the losses of the charger, which can be performed in different ways, were not considered.
If the batteries of the observed ferry fleet were charged under ideal conditions at constant power, the current load of the connection from the mainland would amount to 294 kW, which on a daily basis is 7.07 MWh. However, in practice, there are significant deviations because ferry transport is seasonal. In the summer months, there is an increase in the number of sailings and, therefore, an increase in the required energy. Figure 5 shows the number of departures per month for the state ferry line 604 Split—Vela Luka—Ubli in 2022.
In order to be able to determine the required installed power of the shore connection, it is necessary to know the peak daily load. According to [48], the highest daily number of sailings was achieved in July 2021 and August 2022. For the six observed state ferry lines, the daily maximum is 37 outbound and return trips. The peak load is 62% higher than the average daily load in the observed four-year period. Due to the non-periodic number of departure and return trips, a connection from the mainland with an installed power of 477 kW is required, which is 11.45 MWh on a daily basis. The required power is shown if the charging of the battery energy storage was continuous at a constant power throughout the day. However, this implies the availability of charging ferries at the optimal time, which is not feasible in practice.
Due to the sailing schedule, which is adapted to the needs of the island’s population, the sailing profile is extremely unfavorable in terms of the available time for charging electric batteries. Figure 6 shows the operational navigation profile for the observed ferry fleet. In the figure, the time the ship spends on navigation is marked blue, while the time the ship is available for charging in the City Port of Split is marked in green. The period that is not shaded refers to the rest of the ship outside the City Port of Split.
For example, if observing state line 636 maintained by the ferry Biokovo and connecting the island of Šolta with the City Port of Split, it is evident that the only available time for charging is between 2:00 p.m. and 4:15 p.m. The remaining time the ship sails, maintaining the line with a break of 15 min, which is necessary for the operation of disembarking and loading passengers and vehicles. At night, the ship is stationed at the port of Rogač (Šolta island).
The availability of an individual ferry for charging is an important factor from the aspect of optimizing the charging process. However, an even more important factor is the amount of energy needed in the time available to charge the ship’s battery storage of electricity. Table 4 shows the daily energy needs of the ferry fleet, the percentage share of each ship in total consumption, the available time for charging, and the necessary continuous power of the connection for each ship during the charging process.
In relation to the land-based power system, the energy needs of the ferry fleet are represented as a variable consumer of electricity in a 24-h time interval, which is called a daily energy load diagram. The amount of energy consumed by the ECON is defined by the expression:
E C O N = t 1 t 2 P C O N t d t = t 1 t 2 u t · i t d t
where PCON indicates the instantaneous power with which the consumer group loads the network, u(t) the instantaneous network voltage, and i(t) the instantaneous current of the consumer group, while t represents time. The average load value refers to the power value in the case of charging the electrical ESS on ships with constant power and is defined by the expression:
P A V G = D a i l y   e n e r g y   n e e d s 24 - h o u r   i n t e r v a l
The amount of peak or maximum power PMAX is defined by the expression:
P M A X = t n 1 t n 2 u M A X t · i M A X t d t
where PMAX indicates the maximum power with which the group of consumers loads the network, uMAX is the maximum voltage of the network, and iMAX is the maximum current of the group of consumers, while t represents time.
Considering the energy needs of each individual ship in accordance with the available charging time, maximum charging power is estimated. The peak power required to charge a group of ferries in the most demanding moment amounts to 2.594 MW. Compared to the average annual energy needs of 0.477 MW, this represents an increase of almost 5.5 times, which significantly exceeds the capacity of the port infrastructure. Therefore, it is concluded that the energy needs of electric ferries in this particular case are extremely non-seasonal, i.e., non-periodic.

3.3. Optimization Methods and Methodology

Optimal network load can be achieved in different ways. In the case of a transition to electric propulsion, each of the solutions proposed below would probably be used to a greater or lesser extent depending on the specifics of a particular ferry line:
Change of navigational schedule,
The introduction of additional vessels on certain lines;
Installation of diesel generators;
Application of a battery ESS on the shore;
Construction of electric energy charging stations on island piers;
Charging optimization.
By changing the navigational schedule, the ship’s available time for battery charging can be optimized. However, the sailing schedule is designed to meet the needs of the island’s population first and foremost. Furthermore, the sailing schedule considers the availability of ships, the workload of the crew, and the possibility of docking ships in the City Port of Split. By introducing additional ships that maintain certain lines, it is possible to charge one ship while another sail maintains the line. Consequently, this represents additional investment and operating costs. By installing diesel generators, it is possible to charge the ship’s battery ESS when the ship is not available for charging from shore. However, the use of diesel generators ultimately has a negative impact on the environment, which is exactly what should be avoided by electrifying ferries. If the infrastructure on shore does not meet the energy needs of ship charging stations, electricity storage facilities on land are used. If the needs are of low intensity, the shore ESS is charged. When the ship is connected to the charging station, energy is used from the shore connection as well as from the shore ESS. At night, most of the fleet of ships are stationed at the island’s docks. The shore energy infrastructure of the City Port of Split can be alleviated in such a way that the ship’s ESS is charged at night while they are docked on the islands. Considering the limitations in the capacity of the electrical infrastructure on the islands, this model is difficult to implement.
The scientific research is divided into three phases: the restriction stage, the problem formulation stage, and finally, the optimization stage. Due to legal restrictions caused by the negative impact on the environment, a transition to RES is necessary. In accordance with the availability of a certain type of RES, the most suitable solution is selected. After choosing the electrification of ferries, it is necessary to analyze the energy needs of the fleet of ships and create a daily energy profile. After that, the creation of a model is approached. In this way, the transition to RES is achieved with the aim of fulfilling legal regulations and reducing emissions on the environment.
The most important part of the presented methodology is the creation of an optimization model based on PSO and a greedy algorithm. A greedy algorithm was introduced to narrow the search area when it comes to a situation where there is a ferry with dominant charging needs, as shown in Figure 7. In an imaginary multidimensional space, using a greedy algorithm, the search area is narrowed down to a specific area (rectangle shaded blue in the figure). In this way, the required number of search particles is reduced, as well as the number of iterations required to reach the global optimum solution. Search particles vectors are displayed as black arrows defined by speed and direction of movement.
The description of the programming code is presented in the following paragraph, as shown in Figure 8. When generating the initial population, three classes of units were used: an individual generated by a greedy algorithm, a special individual generated by the initial schedule, and individuals generated by Poisson distribution.
The specific steps in the process of population initialization are as follows:
(1)
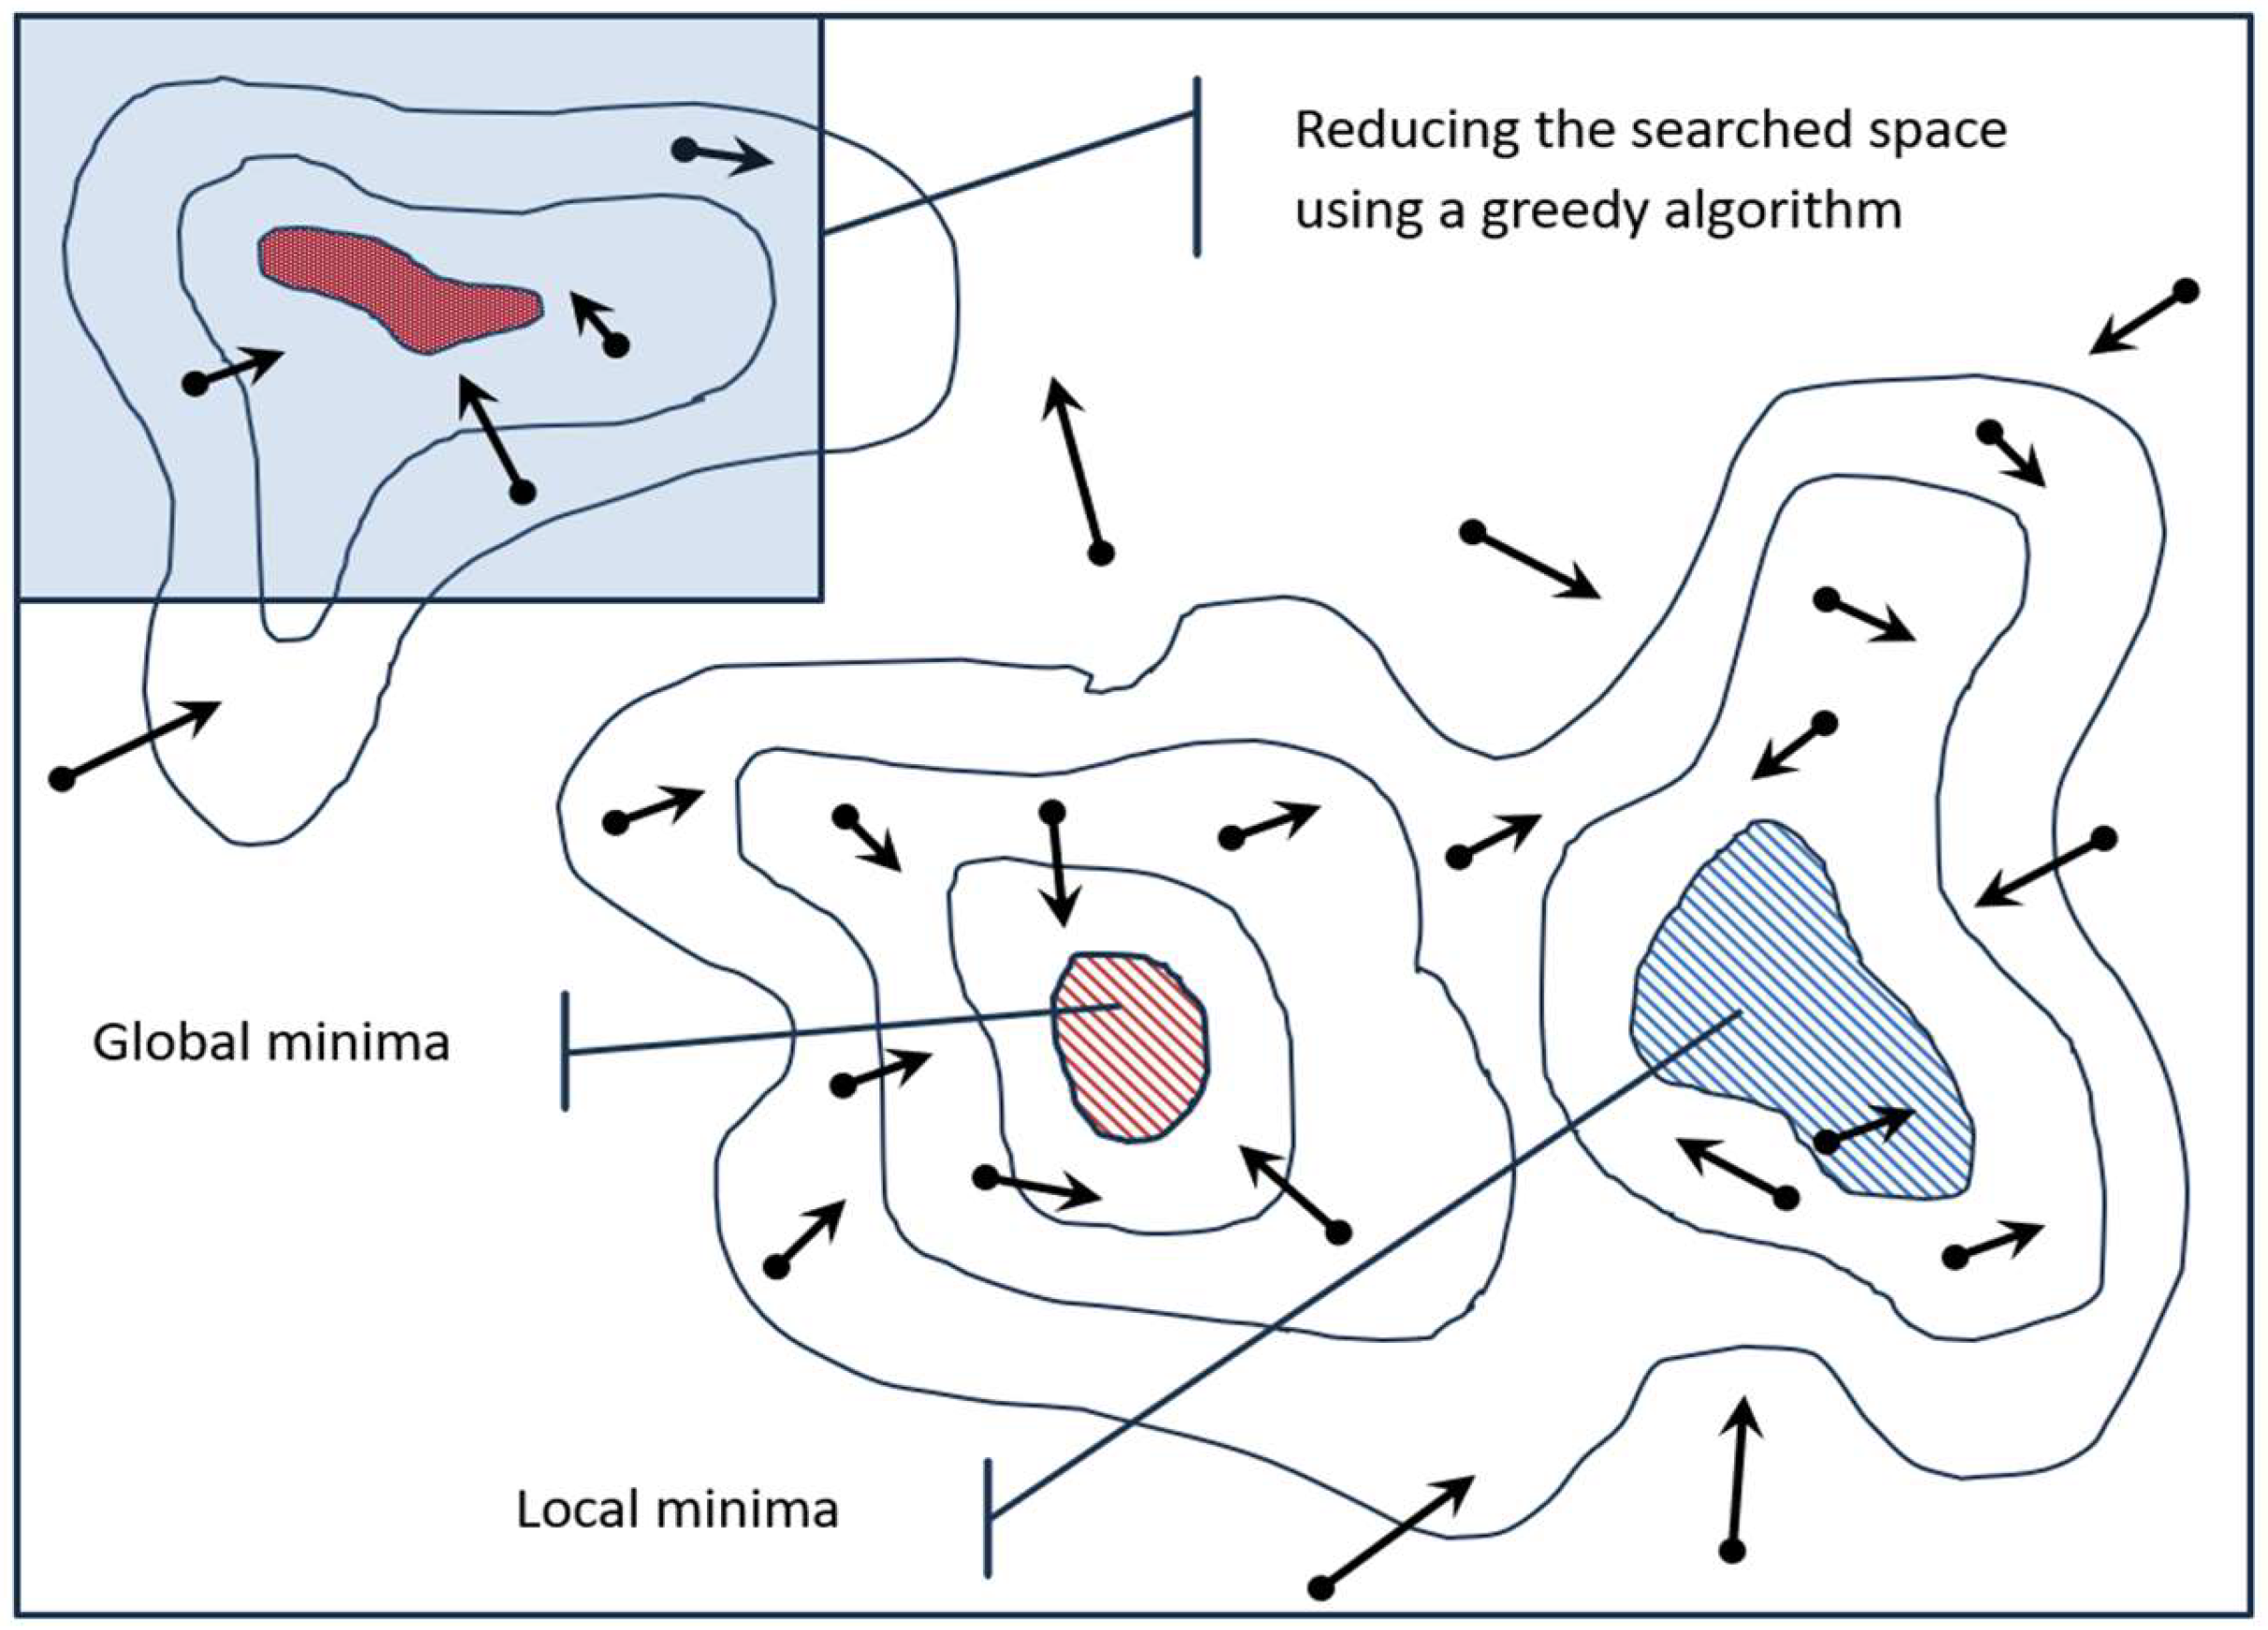
Creating initial solution particles using a greedy algorithm;
(2)
Creating reference initial solution particle used as a control dataset;
(3)
Creating random initial solution particles used for testing different scenarios;
(4)
The above particles are combined to create the initial population.
The specific steps in the process of creation of particle are as follows:
(1)
The charging schedule should be generated according to the sailing schedule and daily energy needs, considering constraints;
(2)
Discrete coding of input sailing schedule table into charge schedule;
(3)
Decoding of the repaired charging schedule due to overnight charging;
(4)
Combining created particles into the initial population;
(5)
Calculating new max power and preparing data for the Gantt chart;
(6)
Processing data for chart display;
(7)
Combining results of previous steps into single particle structure.
The specific steps of particle swarm movement are as follows:
(1)
The difference in the particle’s current position vector is calculated concerning the local and global minima;
(2)
The velocity vector and the new location of the particle are calculated;
(3)
The particle is moved to a new location based on the obtained values;
(4)
The particle’s movement affects the charge schedule, so the coded schedule is repaired, and then a new schedule is created;
(5)
The maximum power is calculated based on the new schedule. Data is prepared and processed to create Gantt charts;
(6)
In each new iteration, the particle is updated;
(7)
The next particle is processed;
(8)
When all initially defined particles have been processed, the algorithm stops.
Figure 9 schematically shows the energy flow of the proposed smart system for optimizing the maximum charging power.

4. Results and Discussion

Due to the limited power of the shore infrastructure, it is necessary to minimize the peak load. Moreover, for some electricity suppliers, a fee is charged for the installed power. Thus, this kind of analysis can also have economic benefits. Furthermore, when carrying out the optimization of the peak load in accordance with the repetitive navigation profile of the ships, technical aspects and limitations are not considered. Namely, in order for charging the entire fleet of ships to be feasible, all docks should have connections of appropriate power. However, this research starts from the assumption that the mentioned requirement is fulfilled. The optimization is achieved in such a way that at the moment of connection of high-power ships, ships that are available for a longer period of the day are disconnected from the network.
The proposed model is applied to optimize the sailing schedule of the analyzed ferry fleet. The optimization model achieves a 24% [62] reduction in the required charging power of the electric ESS of the group of ferries. Savings were achieved by properly scheduling charging, i.e., by disconnecting less energy-intensive ships from the shore energy infrastructure. The problem arises when several ships with similar energy needs are connected to the network at the same time. In this case, a reduction of only 0.76% was achieved. The described schedule is shown in Figure 10 when the energy needs of the most demanding ship are reduced to 0.48 MW daily.

4.1. Population Size Analysis

In order for the model to be effective, it is necessary to perform the optimal setting of the model parameters. The topology of the population affects the speed of propagation, i.e., the effect of optimization [63]. An adequate selection of the population size is an important factor in the performance of this metaheuristic optimization method. According to [64], the optimal number of particles varies between 70 and 500 for the most complex optimization problems, although it is necessary to analyze the influence of the number of particles on the optimization efficiency for each individual optimization problem.
In this research, special emphasis is placed on determining the size of the population needed for the exploration of searched space. The optimal number of particles that search the area is the one where the results of the function objective are the best. Therefore, the influence of the number of particles on the optimization results was analyzed. However, due to the use of a greedy algorithm, it is not possible to examine the influence of the number of particles on the first test performed. Namely, the greedy algorithm prioritizes the most energy-demanding consumer. Therefore, the test was carried out when several ships with similar energy needs were connected to the shore-based power infrastructure. The distribution of sampling, i.e., determining the size of the population, is performed according to the exponential function f(x) = ex with the addition of one intermediate point with the aim of increasing the resolution, as shown in Figure 11. It can be seen from the figure that the greatest reduction in peak power is achieved when the number of particles is set to 256. Compared to the initial reduction of 0.76% when the number of particles was 1024, a reduction in peak power in the amount of 13.47% was achieved. The relationship of the required number of particles to achieve a certain objective function cannot be generalized and must be analyzed and optimized for each individual problem [64].
Figure 12a shows the convergence history when the population size is 1024 particles and Figure 12b when the population size is 256 particles. Although the convergence history looks similar, there is a significant difference in the achieved reduction in the required charging power of the ESS group of ferries.
Figure 13 displays an optimized charging schedule when the particle count is 256.

4.2. Inertia Weight Factors Analysis

The inertia weight (global weight) is an important parameter in PSO because it affects the balance between global search and local search. A well-chosen value of inertia weight allows the algorithm to efficiently search the solution space and avoid getting stuck in local minima. When performing optimization, the inertia weight factor can be fixed or variable. The fixed factor is easy to apply and has a stable effect on most problems, while the biggest problem is that it is not variable during iterations. Therefore, the factor can be adjusted during optimization according to a certain criterion (linear, random, etc.). The weight factor can be adjusted depending on the performance of the swarm, i.e., the degree of improvement in function, and in this case, it is an adaptive weight factor [65].
The correct selection of inertia weighting factors improves the performance of the algorithm [66]. In the study [67], the influence of different inertia weight factors on the exploitation costs and lifetime of the battery ESS was analyzed. The use of an adaptive nonlinear approach to the determination of weight factors resulted in a reduction in operating costs and an extension of the lifespan of the battery energy storage system. In this research, the influence of choosing the proper size of the inertia weight on the function goal of this optimization task, which is the reduction of the peak charging power, was analyzed. There are different strategies when choosing inertia weight [68]. The usual setting is to select an initial value between [0.8 and 1.2]. However, in this optimization task, the local minimum was not reached in the interval of [0.6, 1.2]. In this research, the effect of the change in the magnitude of the inertia weight in the interval [0.2, 0.6] with a linear step of 0.05 was examined. The best result was achieved when the global weight was set to 0.55, and the number of particles was set to 2048. At such settings, the minimum amount of charging power is 0.9595 MW. With this optimization of parameters, a reduction of 16.2% was achieved in relation to the previously optimized charging power, which amounted to 1.14519 MW. Figure 14 shows the influence of the inertia weight factor on the optimization effect, i.e., on the reduction of the required peak charging power.
Finally, Figure 15 shows the optimized charging schedule of ships when a savings of 16.2% was achieved compared to the first optimization results.
Sensitivity analysis is carried out to ensure the smooth functioning of a system, such as an energy system in which energy sources are renewable [69]. The mentioned research analyzes the optimization method for selecting the calculation of the sensitivity of dynamic characteristics and the mode of operation of the energy system. The results show that by applying the PSO algorithm, it is possible to reduce network losses and increase computing efficiency. In this particular study, the impact of the number of ferries was observed and it was concluded that the number of ferries itself does not significantly affect the results of optimization. However, the daily energy needs of each ferry significantly affect the optimization results. This is best manifested through the optimization effect and the time required to achieve the local minimum of the function goal.

5. Conclusions

This scientific research presents an analysis of the energy needs of a ferry fleet that uses the City Port of Split as one of its ports. Energy needs are determined on the basis of equivalent fuel consumption. They are non-periodic and non-seasonal. On a daily basis, they are extremely non-periodic due to the specifics of the sailing schedule in the high season. Non-periodic energy needs create a challenge when designing energy infrastructure, as it should be designed for the most unfavorable conditions that can occur. In order to reduce the amount of peak charging power, an optimization model was created that uses the PSO and a greedy algorithm. The goal function of this optimization task is to reduce the peak charging power. Furthermore, the model was optimized in such a way that the number of particles needed to search the area, i.e., to find the global minimum, was analyzed. The number of particles is defined, at which the optimization result is improved by 13.47% compared to the initial settings. The influence of the global weighting factor on the optimization of the peak charging power was also analyzed. For example, with an inertia weight factor of 0.55 with a defined particle number of 2048, a reduction in the peak charging power of 16.2% was achieved.
Recommendation for future research: Based on the obtained daily profile of the energy needs of the ship fleet, it is possible to determine the available energy capacities of the ships’ ESS when the ships are not sailing. These ESS capacities can be used in the “ship-to-shore” system to reduce the load on the shore infrastructure when charging ferries that are priority for departure. Furthermore, the time a ferry spends in port is a significant parameter that affects the amount of charging power. Therefore, it is possible to optimize peak power by influencing the available charging time. It is also necessary to conduct a sensitivity analysis of the change in charging power in relation to the available charging time in future research.

Author Contributions

Conceptualization: T.P., M.K., G.K. and J.Š.; methodology: T.P., M.K., G.K. and J.Š.; validation: T.P. and M.K. formal analysis: T.P., M.K. and J.Š.; investigation: T.P.; writing—original draft preparation: T.P. and G.K. visualization: T.P., M.K. and J.Š. All authors have read and agreed to the published version of the manuscript.

Funding

This research received no external funding.

Institutional Review Board Statement

Not applicable.

Informed Consent Statement

Not applicable.

Data Availability Statement

Dataset available on request from the authors.

Conflicts of Interest

The authors declare no conflicts of interest.

References

  1. European Commission, Atlas Maps Main Sources of Air Pollution for 150 European Cities. Available online: https://joint-research-centre.ec.europa.eu/jrc-news-and-updates/atlas-maps-main-sources-air-pollution-150-european-cities-2021-11-17_en#:~:text=In%202019%2C%20they%20were%20estimated%20to%20have%20caused,pollution%20vary%20greatly%20from%20one%20city%20to%20another (accessed on 10 May 2024).
  2. European Environment Agency, Croatia–Air Pollution Country Fact Sheet. Available online: https://www.eea.europa.eu/themes/air/country-fact-sheets/2022-country-fact-sheets/croatia-air-pollution-country (accessed on 5 June 2024).
  3. European Environment Agency. Available online: https://www.eea.europa.eu/publications/air-quality-in-europe-2021/health-impacts-of-air-pollution#:~:text=In%202019%2C%20air%20pollution%20continued%20to%20drive%20a,premature%20deaths%20were%20attributed%20to%20acute%20ozone%20exposure (accessed on 19 May 2024).
  4. IMO, Revised GHG Reduction Strategy for Global Shipping Adopted. Available online: https://www.imo.org/en/MediaCentre/PressBriefings/pages/Revised-GHG-reduction-strategy-for-global-shipping-adopted-.aspx (accessed on 25 November 2024).
  5. European Commission, European Green Deal: Agreement Reached on Cutting Maritime Transport Emissions by Promoting Sustainable Fuels for Shipping. Available online: https://malta.representation.ec.europa.eu/news/european-green-deal-agreement-reached-cutting-maritime-transport-emissions-promoting-sustainable-2023-03-23_en (accessed on 29 November 2024).
  6. European Council, Fuel EU Maritime Initiative. Available online: https://www.consilium.europa.eu/en/press/press-releases/2023/07/25/fueleu-maritime-initiative-council-adopts-new-law-to-decarbonise-the-maritime-sector/ (accessed on 25 October 2024).
  7. DNV Energy Transition Outlook 2024. Available online: https://www.dnv.com/publications/energy-transition-outlook-2024/ (accessed on 19 November 2024).
  8. World Energy Investment 2024. Available online: https://www.iea.org/data-and-statistics/data-product/world-energy-investment-2024-datafile (accessed on 21 October 2024).
  9. Hrvatska Elektropriveda, Izvješće o Poslovanju i Održivosti Grupe za 2023. Godinu. Available online: https://www.hep.hr/UserDocsImages//dokumenti/Izvjesce%20o%20odrzivosti//HEP_Izvjesce_poslovanje_odrzivost_2023.pdf (accessed on 24 January 2025).
  10. Kirkaldy, N.; Samieian, M.A.; Offer, G.J.; Marinescu, M.; Patel, Y. Lithium-ion battery degradation: Measuring rapid loss of active silicon in silicon–graphite composite electrodes. ACS Appl. Energy Mater. 2022, 5, 13367–13376. [Google Scholar] [CrossRef] [PubMed]
  11. Elkafas, A.G.; Shouman, M.R. A Study of the Performance of Ship Diesel-Electric Propulsion Systems From an Environmental, Energy Efficiency, and Economic Perspective. Mar. Technol. Soc. J. 2022, 56, 52–58. [Google Scholar] [CrossRef]
  12. Harris, T.; Kennedy, A. Low Friction Recoating Performance Improvements Aboard A Passenger Ferry. In Proceedings of the SNAME Maritime Convention, Providence, RI, USA, 27–29 October 2021. Paper Number: SNAME-SMC-2021-056. [Google Scholar] [CrossRef]
  13. Adland, R.; Cariou, P.; Jia, H.; Wolff, F.-C. The energy efficiency effects of periodic ship hull cleaning. J. Clean. Prod. 2018, 178, 1–13. [Google Scholar] [CrossRef]
  14. Tadros, M.; Ventura, M.; Guedes Soares, C. Design of Propeller Series Optimizing Fuel Consumption and Propeller Efficiency. J. Mar. Sci. Eng. 2021, 9, 1226. [Google Scholar] [CrossRef]
  15. Lashgari, M.; Akbari, A.A.; Nasersarraf, S. A new model for simultaneously optimizing ship route, sailing speed, and fuel consumption in a shipping problem under different price scenarios. Appl. Ocean. Res. 2021, 113, 102725. [Google Scholar] [CrossRef]
  16. Wartsila Technical Journal. Available online: https://www.wartsila.com/docs/default-source/Service-catalogue-files/Engine-Services---2-stroke/slow-steaming-a-viable-long-term-option.pdf (accessed on 2 January 2024).
  17. Yang, N.; Xu, G.; Fei, Z.; Li, Z.; Du, L.; Guerrero, J.M.; Huang, Y.; Yan, J.; Xing, C.; Li, Z. Two-Stage Coordinated Robust Planning of Multi-Energy Ship Microgrids Considering Thermal Inertia and Ship Navigation. IEEE Trans. Smart Grid 2025, 16, 1100–1111. [Google Scholar] [CrossRef]
  18. Fei, Z.; Yang, H.; Du, L.; Guerrero, J.M.; Meng, K.; Li, Z. Two-stage coordinated operation of A green multi-energy ship microgrid with underwater radiated noise by distributed stochastic approach. IEEE Trans. Smart Grid 2024, 16, 1062–1074. [Google Scholar] [CrossRef]
  19. MV Hallaig Scoltland. Available online: https://www.cmassets.co.uk/project/mv-hallaig/ (accessed on 7 May 2024).
  20. MV Lochinvar Scotland. Available online: https://www.cmassets.co.uk/project/mv-lochinvar/ (accessed on 7 May 2024).
  21. Ampere Norway. Available online: https://www.ship-technology.com/projects/norled-zerocat-electric-powered-ferry/ (accessed on 16 May 2024).
  22. M/F Deutschland—Scandlines Deutschland GmbH. Available online: https://www.scandlines.com/media/wt4nq2oe/datasheet_sh_deu_2020_eng.pdf?func=proxy (accessed on 3 May 2024).
  23. MV Prins Richard—Hybrid Ferry. Available online: https://corvusenergy.com/projects/prins-richard/ (accessed on 7 May 2024).
  24. M/V Prinsesse Benedikte-Hybrid Ferry. Available online: https://www.scandlines.com/about-us/our-ferries-and-harbours/ (accessed on 7 May 2024).
  25. MV Catriona—Caledonian Maritime Assets Ltd. Available online: https://www.cmassets.co.uk/ferry/mv-catriona/ (accessed on 7 May 2024).
  26. MF Tycho Brahe—Battery-Electric Car-Ferry. Available online: https://wikizero.com/www/MF_Tycho_Brahe (accessed on 7 May 2024).
  27. Elektra—Hybrid-Electric Ferry. Available online: https://shift-cleanenergy.com/2017/10/22/elektra-hybrid-electric-ferry/ (accessed on 15 May 2024).
  28. Aurora Electric Ferry. Available online: https://shift-cleanenergy.com/2017/10/21/electric-ferry-aurora/ (accessed on 9 May 2024).
  29. MS Color—Hybrid Ferry. Available online: https://corvusenergy.com/projects/herjolfur-iv/ (accessed on 7 May 2024).
  30. Herjólfur IV–Corvus Energy. Available online: https://www.ship-technology.com/projects/color-hybrid-ferry/ (accessed on 7 May 2024).
  31. Ellen E-ferry Danmark. Available online: https://www.danfoss.com/en/about-danfoss/news/cf/world-s-most-powerful-fully-electric-ferry-got-her-name-and-is-getting-ready-for-danish-waters/ (accessed on 10 May 2024).
  32. Island Discovery Canada. Available online: https://res.cloudinary.com/damen-shipyards2/image/upload/v1640261475/catalogue/ferries/road-ferry/product-sheet-road-ferry-8117E3.pdf (accessed on 24 May 2024).
  33. Basto Electric Norway. Available online: https://sefine.com.tr/projects/project_detail/20 (accessed on 9 May 2024).
  34. Wolfe Islander IV Canada. Available online: https://www.damen.com/catalogue/ferries/roro-ferries (accessed on 10 May 2024).
  35. MV Amherst Islander, II. Available online: https://www.bairdmaritime.com/passenger/ro-pax/vessel-review-amherst-islander-ii-hybrid-electric-ro-pax-debuts-on-lake-ontario (accessed on 7 May 2024).
  36. Grotte ferry Danmark. Available online: https://www.bairdmaritime.com/work-boat-world/passenger-vessel-world/ro-pax/vessel-review-grotte-battery-powered-double-ended-ro-pax-for-denmarks-fanolinjen (accessed on 24 May 2024).
  37. MF Hella–Corvus Energy. Available online: https://corvusenergy.com/projects/hella/ (accessed on 20 May 2024).
  38. MF Dragsvik–Corvus Energy. Available online: https://corvusenergy.com/projects/dragsvik/ (accessed on 18 May 2024).
  39. MF Leikanger–Corvus Energy. Available online: https://corvusenergy.com/projects/leikanger/ (accessed on 5 May 2024).
  40. Adenuga, O.T. Particle Swarm Optimization Method for Energy Management of the Hybrid System of an Electric Vehicle Charging Station. Doctoral Dissertation, Cape Peninsula University of Technology, Cape Town, South Africa, 2024. [Google Scholar]
  41. Mohamad, H.; Isa, A.I.M.; Zaharuddin, M.A.H.; Naidu, K.; Salim, N.A.; Yasin, Z.M. Optimal Charging Coordination of Electric Vehicles Considering Users Charging Behavior Using Particle Swarm Optimization (PSO). In Proceedings of the 2024 IEEE 4th International Conference in Power Engineering Applications (ICPEA), Penang Island, Malaysia, 4–5 March 2024; IEEE: New York, NY, USA, 2024; pp. 13–18. [Google Scholar]
  42. Xiao, B.; Ma, W. Research on Distributed Microgrid Group Optimization for Ships Based on Optimized Particle Swarm Algorithm. In Proceedings of the 2024 IEEE 2nd International Conference on Sensors, Electronics and Computer Engineering (ICSECE), Jinzhou, China, 29–31 August 2024; IEEE: New York, NY, USA, 2024; pp. 1749–1757. [Google Scholar]
  43. Meng, K.; Zhang, J.; Xu, Z.; Zhou, A.; Wu, S.; Zhu, Q.; Pang, J. Ship Power System Network Reconfiguration Based on Swarm Exchange Particle Swarm Optimization Algorithm. Appl. Sci. 2024, 14, 9960. [Google Scholar] [CrossRef]
  44. Iris, Ç.; Lam, J.S.L. A review of energy efficiency in ports: Operational strategies, technologies and energy management systems. Renew. Sustain. Energy Rev. 2019, 112, 170–182. [Google Scholar] [CrossRef]
  45. Iris, Ç.; Lam, J.S.L. Optimal energy management and operations planning in seaports with smart grid while harnessing renewable energy under uncertainty. Omega 2021, 103, 102445. [Google Scholar] [CrossRef]
  46. Tourist Board of Split Official Website. Available online: https://visitsplit.com/hr/6608/2024-godina (accessed on 28 January 2025).
  47. Grad Split. Available online: https://split.hr/kategorije/o-splitu/o-gradu (accessed on 28 January 2024).
  48. Port of Split. Available online: https://portsplit.hr/en/port-of-split/ (accessed on 2 January 2024).
  49. Split Port Authority. Available online: https://portsplit.hr/luka-split/lucka-podrucja/bazen-gradska-luka/ (accessed on 8 January 2024).
  50. Petković, M.; Vujović, I.; Lušić, Z.; Šoda, J. Image Dataset for Neural Network Performance Estimation with Application to Maritime Ports. J. Mar. Sci. Eng. 2023, 11, 578. [Google Scholar] [CrossRef]
  51. Jadrolinija. Tender Documentation, Popis Brodova Jadrolinija Gorivo Natječaj Splitsko Plovno Područje; Available on Request; Jadrolinija: Rijeka, Croatia, 2023. [Google Scholar]
  52. Bacalja, B.; Krčum, M.; Slišković, M. A Line Ship Emissions while Manoeuvring and Hotelling—A Case Study of Port Split. J. Mar. Sci. Eng. 2020, 8, 953. [Google Scholar] [CrossRef]
  53. Jadrolinija Shipping Transport Company—Sailing Schedules. Available online: https://www.jadrolinija.hr/redovi-plovidbe-i-cijene/lokalne-linije-2022 (accessed on 15 October 2022).
  54. Croatian Agency for Coastal Maritime Traffic. Statistical Data for 2019–2022; Internal Communication, Available on Request; Croatian Agency for Coastal Maritime Traffic: Split, Croatia, 2022.
  55. Wartsila 31SG. Available online: https://www.wartsila.com/insights/article/wartsila-31sg-the-worlds-most-efficient-4-stroke-engine (accessed on 4 October 2024).
  56. Dikkumbura, R.; Wijewardane, A. Waste Heat Recovery from Marine Engines Using Absorption Chillers for Comfort Application: A Case Study Based on Hamilton and Saryu Ship Classes. In Proceedings of the 2024 Moratuwa Engineering Research Conference (MERCon), Moratuwa, Sri Lanka, 8–10 August 2024; IEEE: New York, NY, USA, 2024; pp. 25–30. [Google Scholar]
  57. EN 590 Diesel. Available online: https://www.linkedin.com/pulse/en-590-diesel-density-specifications-price-morteza-hashemi (accessed on 4 November 2024).
  58. National Institute of Standards and Technology. Available online: https://www.nist.gov/ (accessed on 21 November 2024).
  59. Vujnović, I. Uporaba Alternativnih Goriva u Brodskim Enegretskim Sustavima, University of Zagreb, Faculty of Mechanical Engineering and Naval Architecture. 2020. Available online: https://urn.nsk.hr/urn:nbn:hr:235:136824 (accessed on 12 December 2024).
  60. Norwegian Ship Design—The World’s Largest Electric Ferry Delivered. Available online: https://www.norwegianshipdesign.no/archive/basto-electric-has-been-delivered (accessed on 4 October 2024).
  61. Amoussou, I.; Tanyi, E.; Fatma, L.; Agajie, T.F.; Boulkaibet, I.; Khezami, N.; Ali, A.; Khan, B. The Optimal Design of a Hybrid Solar PV/Wind/Hydrogen/Lithium Battery for the Replacement of a Heavy Fuel Oil Thermal Power Plant. Sustainability 2023, 15, 11510. [Google Scholar] [CrossRef]
  62. Peša, T.; Krčum, M.; Kero, G.; Šoda, J. Electric Ferry Fleet Peak Charging Power Schedule Optimization Considering the Timetable and Daily Energy Profile. Appl. Sci. 2025, 15, 235. [Google Scholar] [CrossRef]
  63. Peng, J.; Li, Y.; Kang, H.; Shen, Y.; Sun, X.; Chen, Q. Impact of population topology on particle swarm optimization and its variants: An information propagation perspective. Swarm Evol. Comput. 2022, 69, 100990. [Google Scholar] [CrossRef]
  64. Piotrowski, A.P.; Napiorkowski, J.J.; Piotrowska, A.E. Population size in particle swarm optimization. Swarm Evol. Comput. 2020, 58, 100718. [Google Scholar] [CrossRef]
  65. Nickabadi, A.; Ebadzadeh, M.M.; Safabakhsh, R. A novel particle swarm optimization algorithm with adaptive inertia weight. Appl. Soft Comput. 2011, 11, 3658–3670. [Google Scholar] [CrossRef]
  66. Ha, M.P.; Nazari-Heris, M.; Mohammadi-Ivatloo, B.; Seyedi, H. A hybrid genetic particle swarm optimization for distributed generation allocation in power distribution networks. Energy 2020, 209, 118218. [Google Scholar]
  67. Premkumar, M.; Sowmya, R.; Ramakrishnan, C.; Jangir, P.; Houssein, E.H.; Deb, S.; Kumar, N.M. An efficient and reliable scheduling algorithm for unit commitment scheme in microgrid systems using enhanced mixed integer particle swarm optimizer considering uncertainties. Energy Rep. 2023, 9, 1029–1053. [Google Scholar] [CrossRef]
  68. Zdiri, S.; Chrouta, J.; Zaafouri, A. Inertia weight strategies in Multiswarm Particle swarm Optimization. In Proceedings of the 2020 4th International Conference on Advanced Systems and Emergent Technologies (IC_ASET), Hammamet, Tunisia, 15–18 December 2020; IEEE: New York, NY, USA, 2020; pp. 266–271. [Google Scholar]
  69. Bao, L.; Yinsheng, S.; Xin, Z.; Ligang, Z.; Hongyue, Z.; Hefeng, Z. Research on Optimization Methods for Power System Slice Sensitivity Calculation and Presentation. In Proceedings of the 2024 International Conference on Artificial Intelligence, Deep Learning and Neural Networks (AIDLNN), Guangzhou, China, 20–22 September 2024; IEEE: New York, NY, USA, 2024; pp. 88–92. [Google Scholar]
Figure 1. Review of the use of energy for ships in operation and projection for future exploitation (units: EJ/yr, natural gas includes LNG and LPG).
Applsci 15 03002 g001
Figure 2. Relationship between ship speed, required power, and fuel consumption [16].
Applsci 15 03002 g002
Figure 3. Plan of the City Port of Split [49].
Applsci 15 03002 g003
Figure 4. Types of vessels using the City Port of Split [48].
Applsci 15 03002 g004
Figure 5. The average annual number of sailings by month on line 604 [48].
Applsci 15 03002 g005
Figure 6. Daily operational profile of the observed fleet of ships.
Applsci 15 03002 g006
Figure 7. Applying a greedy algorithm with the aim of reducing searched space.
Applsci 15 03002 g007
Figure 8. Algorithm flow chart.
Applsci 15 03002 g008
Figure 9. Schematic representation of electricity flow.
Applsci 15 03002 g009
Figure 10. Optimized charging when several similar ships are connected to the shore network.
Applsci 15 03002 g010
Figure 11. The influence of the selection of the number of particles on the reduction of the peak charging power.
Applsci 15 03002 g011
Figure 12. Convergence history (a) No. of particles = 1024 (b) No. of particles = 256.
Applsci 15 03002 g012
Figure 13. Optimized charging schedule when the number of iterations is set to 256.
Applsci 15 03002 g013
Figure 14. Influence of the inertia weight factor on the reduction of the peak charging power.
Applsci 15 03002 g014
Figure 15. Optimized charging schedule when inertia weight factor is set to 0.55 while number of particles is set to 2048.
Applsci 15 03002 g015
Table 1. Examples of electric ferries.
Ref. No.Ship NameYearLength Overall (m)Passengers No.Vehicle No.Speed (kt)Power (kW)Battery Capacity (kWh)
[19]MV Hallaig
Scotland
201243150239750700
[20]MV Lochinvar Scotland201343150239750700
[21]Ampere Norway201480360120109001000
[22]M/F Deutschland Germany *2014142120036418.812,0002600
[23]Prins Richard Denmark *2014142114036418.512,0001600
[24]Prinsesse Benedikte Denmark *2015142114036418.512,0001600
[25]MV Catriona Scotland201643150239750700
[26]MF Tycho Brahe Denmark *2017111125024014.560004160
[27]Elektra Finland201798375901118001060
[28]Aurora Electric Ferry Denmark *2017238375901160004160
[29]MS Color Hybrid Norway2019160200050017-5000
[30]Herjólfur IV ferry Iceland201971.785407012.8-2983
[31]Ellen E-ferry Danmark201959.41983115.515004300
[32]Island Discovery Canada202080.8045047141800800
[33]Basto electric Norway2021139.26002001548004000
[34]Wolfe Islander IV Canada202199.30399751220804500
[35]MV Amherst Islander II Canada2021683004212.3--
[36]Grotte ferry Danmark202149.930323117501107
[37]MF Hella202284.2300801020001582
[38]MF Dragsvik202284.2300801020001582
[39]MF Leikanger202384.2300801020001582
Average 91.5553139.512.833282177
* Retrofitted vessel.
Table 2. State ferry lines of the Split waterway that use the City Port of Split.
Line No.DestinationPassengers No.Vehicles No.Sailing
Duration (min)
Sailings
No.
Sailings
Total (h)
631Supetar (Brač)1,684,035399,3295036643053
635Stari Grad (Hvar)620,665169,71912014852970
636Rogač (Šolta)341,12886,7976016111611
602Vis (Vis)244,18561,3581407801820
604Vela Luka (Korčula)—Ubli (Lastovo)203,71255,4472408803520
Total on an annual basis3,093,725772,650 842012,974
Table 3. List of ferries maintaining state ferry lines that use the city port of Split.
No.Ship NameLength (m)Max. Speed (kt)Passenger No.Vehicles No.Line No.Fuel 2023.
(L)
1M/V Biokovo87.6131200138636984,713
2M/V Faros105146501706351,072,720
3M/V Hrvat87.6131200138631674,235
4M/V Korčula101.4166851506044,064,960
5M/V Marjan87.612.31200130631663,506
6M/V Petar Hektorović91.815.510801206022,183,173
7M/V Tin Ujević98.31410002006311,100,000
8M/V Valun81.21373060631866,232
9M/V Zadar11617.511092806354,107,502
Average/Total92.1314.13935.4143 15,717,041
Table 4. Energy needs of the ferry fleet.
ShipDaily Energy Needs
(MWh)
Percentage Share (%)Time Available (h)Constant Power (MW)
M/V Biokovo0.717376.265262.250.318831964
M/V Faros0.781496.825230.260495259
M/V Hrvat0.491194.2898317.660.027813478
M/V Korčula2.9613625.86341.51.974238959
M/V Marjan0.483374.2215715.170.031863536
M/V Petar Hektorović1.5904613.89052.50.636184148
M/V Tin Ujević0.801366.9987715.420.051968839
M/V Valun0.631065.5114215.60.040452403
M/V Zadar2.9923526.13415.750.520408809
Disclaimer/Publisher’s Note: The statements, opinions and data contained in all publications are solely those of the individual author(s) and contributor(s) and not of MDPI and/or the editor(s). MDPI and/or the editor(s) disclaim responsibility for any injury to people or property resulting from any ideas, methods, instructions or products referred to in the content.

