Abstract
(1) Background: Rapid urban growth in China has extended rail systems to neighboring cities to meet intercity travel needs, making it important to understand intercity travel patterns. (2) Methods: Taking the Changsha–Zhuzhou–Xiangtan Intercity Metro Xihuan Line as an example, intercity ridership patterns are analyzed. A Gaussian mixture model is applied to cluster ridership into groups based on travel time and stay time, respectively, and their travel patterns are examined. (3) Results: Weekdays display distinct commuting patterns with morning and evening peaks. On weekends, peak travel times are quite different. Based on travel time, intercity ridership is divided into two groups. The short-travel-time group primarily travels for residential demand, while the long-travel-time group is mainly for leisure. No significant differences were found in weekday and weekend patterns. Based on stay time, ridership is categorized into two groups. Most trips are round trips on the same day, but overnight ridership is higher on weekends. On weekends, the intercity ridership groups with tourism as their travel purpose on weekends have different stay modes, but their main travel destinations are similar. On weekdays, there are large differences in the distribution of main travel destinations between the short-stay-time group and the long-stay-time group, and their travel purposes are more diverse.
1. Introduction
With the rapid development of the social economy, intercity connections have become increasingly close. Building metropolitan areas has emerged as a global strategy for regional development, especially in China where dozens of metropolitan areas have been built in the past two decades. Transportation infrastructure, particularly railways, plays a pivotal role in this process. Based on the function, railways are divided into four types [1], as shown in Table 1, including the trunk railway serving long-distance travels, the intercity railway serving metropolitan travels, the intracity railway serving travels between the urban areas and suburbs of cities, and the urban rail transit (URT) serving travels in the urban areas of cities. Traditionally, intercity travel relied on trunk railways and intercity railways. However, a new trend has emerged: URT systems now extend across city boundaries. For example, China’s first intercity metro (Guangfo Metro) opened in 2010, followed by lines like Shanghai Metro Line 11 and Wuhan Metro Line 11. Compared to traditional railways, URTs have significant advantages [2] in terms of departure frequency, departure intervals, ticket, etc., which have effectively promoted connections between cities [3].

Table 1.
Main indicators of multi-level rail transit.
With the increasing demand for intercity travel, many scholars have studied the characteristics of intercity ridership [4,5]. Regarding the railway network, Zhong et al. [6] analyzed railway ticketing data in the Guangdong–Hong Kong–Macao Greater Bay Area, revealing a steady rise in intercity ridership from 2015 to 2019. The growing demand for station connectivity and the operation of the Guangzhou–Shenzhen–Hong Kong high-speed railway significantly strengthened ties between Guangzhou and Shenzhen. Aiming at the intercity URT, Wang et al. [7] conducted a questionnaire of the Guangfo intercity metro and analyzed its characteristics. The results showed that the intercity ridership had an unbalanced distribution in space.
Clustering is often adopted to identify travel patterns. And the clustering analysis in public transit based on the smart card data often consider two standpoints: a station-oriented point of view and a ridership-focused operational one [8]. From the station-oriented point of view, Zhao et al. [9] used the smart card data of the metro in Nanjing, China, and proposed a similarity-based k-medoids clustering approach to reveal the ridership patterns. Then, the correlation analysis between the clustering results of metro stations and surrounding land uses was used to identify land use surrounding the stations. From the ridership-focused point of view [10,11], Zhang et al. [12] proposed a ridership forecasting method based on metro ridership clustering as well, which used the hierarchical clustering algorithm, and proved its effectiveness. Considering the clustering method, K-means and hierarchical clustering algorithms have been widely used in clustering, but it is difficult to cluster data with special structures [13]. In this regard, a feasible way to cluster data distribution is to adopt a finite mixture model. The Gaussian mixture model (GMM) [14] is a widely used clustering method. It divides data into several groups with different Gaussian distributions [15,16]. And many studies have demonstrated that the GMM outperforms some traditional clustering methods [17,18].
While traditional travel survey data have significantly contributed to understanding travel patterns, they have notable limitations such as being prone to errors, lacking cost-efficiency, and lacking detailed intermediate trip information [19]. In the age of big data, all kinds of innovative data have been applied to supplement or even replace traditional survey data in travel patterns research, which mainly include GPS data, smart card data [20,21], and mobile phone data. Among them, the smart data in transportation are widely deployed for automatic fare collection systems in public transits [22], such as bus [23] and metro [24]. Wu et al. [25] proposed a data-driven methodological framework based on smart card data for estimating transfer ridership, and through the case of the Shenzhen metro network, it verified its effectiveness. All of these empirical studies have shown that smart card data are feasible in travel patterns research. With the popularization of the intercity metro, the travel patterns of intercity metro ridership can be analyzed based on smart card data. Therefore, this paper is based on Changsha metro smart card data to explore the travel patterns.
In general, although numerous studies have discussed the travel patterns of intercity railway ridership, there are still some weaknesses. Firstly, most existing studies focus on trunk or intercity railways, with limited research on intercity URTs, which have very different technical features. However, considering the intercity URT system has increased quickly in the past decade in China, it is time to conduct the specific research on their performance now. Secondly, the existing research on intercity travel mainly relies on data from questionnaires, mobile signaling data, etc., which cannot collect the precise time and space information of travelers. However, the AFC data have the precise travel information of passengers, which can be used to figure out their travel patterns clearly and efficiently. Finally, most existing studies cluster intercity passengers from single dimensions, and few of them consider the stay time modes of intercity passengers. But the unique characteristics of stay time modes are important to fully understand the intercity travel patterns.
Aiming at these issues, this study is designed to comprehensively and precisely explore the travel patterns of intercity URT passengers to further optimize their services and efficiency. Specifically, it focuses on analyzing the differences between weekday and weekend travel patterns, addressing the gap in understanding intercity URT travel behaviors that currently limits service optimization. Therefore, using smart card data from the Changsha–Zhuzhou–Xiangtan (CZT) Intercity Metro Xihuan Line in China, this study applies the GMM to cluster travel time and stay time. It analyzes ridership characteristics from two perspectives: metro travel behavior and urban stay patterns, providing more comprehensive decision support for metro operations and urban management. The following paper is organized as follows: Section 2 introduces materials adopted in this study; Section 3 introduces the methods adopted in this study; Section 4 further clusters intercity ridership with the GMM based on travel time and stay time; Section 5 gives conclusions.
2. Materials
2.1. Study Area and Data
The CZT metropolitan area is located in Hunan Province, China, and consists of three cities, i.e., Changsha, Zhuzhou, and Xiangtan, which are less than 40 km away from each other. Changsha is the capital city with more than 10 million people, whereas Zhuzhou and Xiangtan are smaller with 3.8 million and 2.7 million people, respectively. As of the end of May 2024, Changsha has opened 7 metro lines with a total mileage of 226.6 km, namely Line 1, Line 2, Line 3, Line 4, Line 5, Line 6, and the Xihuan Line (Figure 1). The Xihuan Line was the only intercity metro line and opened on June 28, 2023. It connects Changsha and Xiangtan with 8 stations from south to north, i.e., Xiangtan North Railway Station, Chuanxingshan Station, Huangjiawan Station, Shuanghu Station, Pingtang Station, Hongqiao Station, Tongxi Station, Dawangshan Station, and Shantang Station. The first 3 stations are located in Xiangtan, and the other 5 are located in Changsha. The Xihuan Line connects with Line 3 at Shantang Station, and thus, passengers from Xiangtan can access the whole metro network of Changsha.

Figure 1.
The URT network in Changsha and Xiangtan.
To analyze the travel patterns of intercity metro ridership, this study collected the smart card data of the Changsha metro on Sept 6th (Wednesday), 7th (Thursday), 9th (Saturday), and 10th (Sunday), 2023, from the metro company. As shown in Table 2, all data contain the unique passenger ID, boarding time, boarding line, boarding station, alighting time, alighting line, alighting line, alighting station, etc. Here, trips entering one city and leaving from another city are taken as intercity travels. Finally, 36,670 intercity trips were obtained.
Table 2.
A screenshot of the Changsha metro smart card data.
2.2. Ridership Characteristics
Ridership is the primary indicator of travel patterns. Table 3 shows the distributions of the intercity ridership of the Changsha metro by direction and day of the week. On weekdays, the daily intercity metro ridership averages 3078 from Xiangtan to Changsha and 3125 in the reverse direction. On weekends, it rises to 5794 and 6338, respectively. It can be found that the intercity ridership on weekends is much higher than that on weekdays, which might be attributed to the fact that Changsha is one of the most popular cities in China and attracts a huge number of tourists. In addition, there is little difference between weekday and weekend intercity boarding and alighting ridership.
Table 3.
Distribution of intercity metro trips by direction and day of week.
Using single-day intercity ridership data on weekdays and weekends as the analysis units and a 30 min interval as the time granularity, the differences in intercity ridership patterns were examined through a Pearson correlation matrix (Figure 2). The absolute value of the Pearson coefficient ranges from 0 to 1, with values closer to 1 indicating stronger correlations. In this study, a threshold of 0.7 was adopted: coefficients greater than 0.7 are considered strongly correlated, while those below are weakly correlated. The analysis results show that the Pearson coefficients between weekdays and weekends are all below 0.7, whereas those within weekdays or weekends exceed 0.7. The results reveal significant differences between weekday and weekend intercity ridership, while patterns within weekdays or within weekends show strong similarities.

Figure 2.
Intercity ridership correlation matrix. Note: * indicates passing the 5% significance level test; ** indicates passing the 1% significance level test; *** indicates passing the significance level test of 0.1%.
In order to reduce the influence of ridership imbalance, the boarding and alighting intercity ridership on weekends and weekdays are calculated separately, as shown in Figure 3. On weekdays, intercity ridership exhibits clear commuting patterns, with peaks in the morning and evening. On weekends, the peak travel time from Xiangtan to Changsha occurs between 9:00 and 11:00, while the return peak from Changsha to Xiangtan is from 17:00 to 21:00. This suggests that intercity ridership tends to travel from Xiangtan to Changsha in the morning and return in the evening, likely reflecting an increase in leisure travel on weekends.

Figure 3.
Boarding and alighting intercity ridership on weekends and weekdays.
Figure 4 presents histograms of the daily trip counts. The analysis shows an average of 1.87 daily trips on weekends and 2.18 on weekdays, with slightly higher intercity trips on weekends. Overall, intercity ridership making two trips accounts for the largest proportion (46.5%), followed by those making one trip (38.3%). The travel intensity distribution on weekends and weekdays is relatively similar.
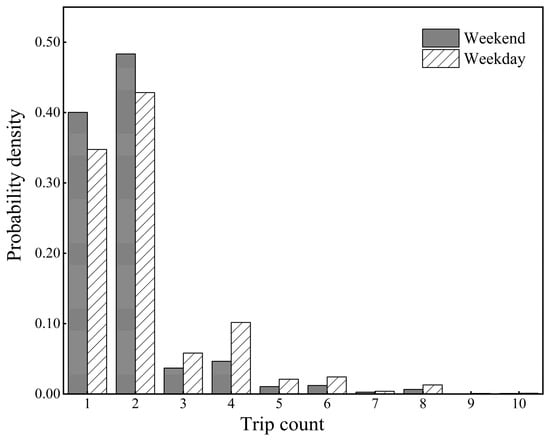
Figure 4.
Trip counts on weekends and weekdays.
3. Methods
Traditional clustering methods, such as K-means and hierarchical clustering, do not perform well in handling the data with some clear probability distribution features. Here, since both travel time and stay show clear Gaussian distribution trends, GMM is adopted in this study.
3.1. GMM
The GMM is a linear combination of multiple Gaussian distributions and also a typical finite mixture model [26,27]. Compared with traditional clustering methods, finite mixture models can cluster data based on their distributions. For a d-dimensional random variable , the GMM with K components is shown as follows:
where is the probability density function of the GMM, is the probability density function of the Kth component, and , and are its weight, mean, and covariance matrix.
3.2. Parameter Estimation
Parameter estimation is the process of estimating unknown parameters in the population distribution according to random samples extracted from the population. Assuming that follows the GMM distribution, the parameters of the GMM need to be estimated for clustering. For , the probability of belonging to the Kth Gaussian distribution is calculated as follows:
The Expectation–Maximization (EM) algorithm is often used to estimate the parameters of GMMs [28]. It has two steps: the E step obtains the probability of each component, and the M step estimates and updates parameters based on the results of the E step [14].
- (1)
- E-step: Obtain the probability :
- (2)
- M-step: Re-estimate the model parameters with the maximum likelihood estimation based on the probability of each Gaussian distribution calculated in step E.
Repeat the two steps until the algorithm converges.
4. Results and Discussion
4.1. GMM Clustering Based on Travel Time
4.1.1. Clustering Results Based on Travel Time
Here, travel time is defined as the difference between boarding time and alighting time in one trip, which also means a usually specified period of time spent in the metro system. It usually reflects the travel patterns of intercity ridership. The travel-time distributions of intercity ridership are shown in Figure 5. To examine differences in intercity travel time between boarding and alighting ridership as well as between weekend and weekday ridership, T-tests were conducted. The results indicated no significant differences, suggesting that travel time does not vary significantly between intercity boarding and alighting ridership or between weekends and weekdays. In addition, it can be found that there are two obvious peaks in the travel-time distribution of intercity ridership, showing mixed distribution characteristics. Based on this, intercity ridership is clustered based on travel time, and the GMM algorithm is adopted.

Figure 5.
Travel-time distribution of intercity ridership.
There are two Gaussian distributions identified. Table 4 shows their weights, means, and standard deviations. The weight of Gaussian distribution 1 is 18.5%, and the mean value is 32.9 min. The weight of Gaussian distribution 2 is 81.5%, and the mean is 68.9 min. That is, Gaussian distribution 1 and Gaussian distribution 2 correspond to the short-travel-time and long-travel-time intercity travels, respectively. Obviously, the short-travel-time group accounts for a small proportion and has a mean travel time of about half an hour, while the long-travel-time group accounts for a large proportion and has a longer travel time of about 70 min.
Table 4.
The estimated parameters of each travel-time clustering component.
4.1.2. Analysis of Travel-Time Cluster
As shown in Figure 6, the clustering results distinguished the distribution of intercity ridership on travel time greatly and effectively identified travel groups under different travel patterns. Among them, the short-travel-time group accounted for 20.1% and the long-travel-time group accounted for 79.9%. It can be seen that in intercity trips, the ridership of the long-travel-time group is the main group.

Figure 6.
The clusters of travel-time ridership.
Travel time can reflect the daily travel distance of intercity ridership and the scope of intercity activities somehow. In this regard, the differences in travel distance between different intercity ridership groups are analyzed, as shown in Figure 7. It is important to note that travel distance in this paper is defined as the distance in rail travel distance between the boarding and alighting stations. The average travel distance for the entire intercity ridership is calculated to be 32.2 km. Specifically, the short-travel-time group has an average travel distance of 18.7 km, while the long-travel-time group averages 35.6 km.

Figure 7.
Distance distributions of different travel-time groups.
To further investigate the differences in travel patterns between intercity ridership groups, the short-travel-time group and the long-travel-time group were compared based on travel purposes. Additionally, the top 10 destination stations with the highest proportions of intercity ridership were identified, as shown in Figure 8 and Figure 9. For the short-travel-time group, the primary destinations are Yanghu Wetland (34.9%), Yangguang (15.5%), and Yanghu ECO Town (12.4%). Yanghu Wetland and Yanghu ECO Town form a comprehensive area combining leisure and residential features, which is the closest well-developed community in Changsha to Xiangtan. And Yangguang Station is surrounded by numerous residential communities. This indicates that the main travel purpose for the short-travel-time group is driven by residential demand. For the long-travel-time group, the primary destinations are Wuyi Square (22.6%), Huangxing Square (12.0%), and the Railway Station (11.8%). Wuyi Square and Huangxing Square are well-known leisure hubs in Changsha, China, while the Railway Station serves as a major transportation hub. This suggests that the main travel purpose for the long-travel-time group is leisure.

Figure 8.
Travel destinations of the short-travel-time group.

Figure 9.
Travel destinations of the long-travel-time group.
4.2. GMM Clustering Based on Stay Time
4.2.1. Clustering Results Based on Stay Time
The stay time of intercity ridership is often related to their travel purpose, and different travel purposes will show different stay times. In this regard, there is obviously a big difference in the main travel purposes of different intercity ridership groups based on stay times, so the cluster analysis of intercity ridership is conducted. The boarding time and alighting time difference in the round trip is calculated to calculate the ridership’s stay time in Changsha. That is, for each passenger, the stay time is defined as the difference between the second boarding time and the first alighting time, which represents how long an individual stays in Changsha and is a comprehensive expression of travel patterns as well. To examine whether there is any difference in intercity stay time between weekend and weekday ridership, T-test results indicate significant differences between weekends and weekdays, and the 95% confidence interval is (2.869, 3.904). Figure 10 shows the stay-time distribution of intercity ridership. It can be seen that there are two peaks, which can be roughly divided into two categories. Since the stay time of the intercity metro ridership shows significant heterogeneities with multiple peaks, the GMM is adopted to identify the travel patterns of the different passenger groups.

Figure 10.
Stay-time distribution of intercity ridership.
There are two Gaussian distributions identified. Table 5 shows their weights, means, and standard deviations. The weight of Gaussian distribution 1 is 79.1%, and the mean value is 4.3 h. The weight of Gaussian distribution 2 is 20.9%, and the mean is 23.5 h. That is, Gaussian distribution 1 and Gaussian distribution 2 correspond to the short-stay-time and long-stay-time groups, respectively. Obviously, the short-stay-time group accounts for the highest proportion and the long-stay-time group has the lowest proportion. According to the length of stay time, these two groups correspond to two different stay patterns: a round trip on the same day and overnight stay. The differences between these two groups will be further explored below from a spatiotemporal perspective.
Table 5.
The estimated parameters of each stay-time clustering component.
4.2.2. Analysis of Weekday and Weekend Ridership
As shown in Figure 11, the clustering results distinguish the peak distribution of intercity ridership in terms of stay time and effectively identify travel groups under different travel patterns. A comparative analysis of the differences between the intercity ridership groups on weekends and weekdays shows that, on the whole, the daily intercity ridership on weekends is greater than that on weekdays. On weekends, the short-stay-time group accounts for 76.4% and the long-stay-time group accounts for 23.6%. On weekdays, the short-stay-time group accounts for 90.8% and the long-stay-time group accounts for 9.2%. It can be seen that whether it is on weekends or weekdays, the stay pattern of intercity ridership is mainly round trip on the same day, which is easy to understand. Especially for weekdays, the main travel purpose of the short-stay-time group is cross-city commuting (work, school, etc.) or service (medical, business, etc.). In addition, the proportion of overnight ridership on weekends is significantly higher than that on weekdays, which is related to the fact that more tourists on weekends are traveling, and their overnight demand is higher.
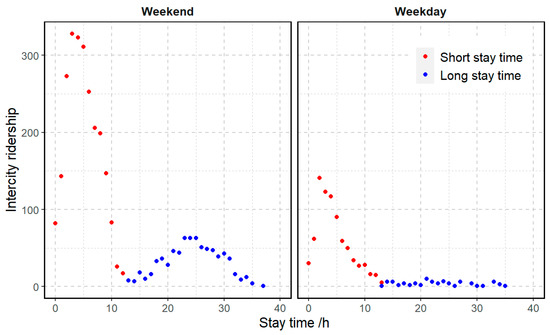
Figure 11.
The cluster of stay-time ridership on weekdays and weekends.
To further investigate the travel patterns of intercity ridership, the short-stay-time group and the long-stay-time group on weekends and weekdays were compared based on travel purposes. For intercity trips from Xiangtan to Changsha, the top 20 alighting ridership stations in Changsha are shown in Figure 12 and Figure 13, respectively. The following can be found:

Figure 12.
Travel destinations of different stay-time groups on weekends.

Figure 13.
Travel destinations of different stay-time groups on weekdays.
On weekends, the main travel destinations of the short-stay-time group and the long-stay-time group are similar, and their main travel destinations both are Wuyi Square, Yanghu Wetland, and Huangxing Square, respectively, reflecting that their main travel purpose is leisure. That is, the intercity ridership groups with tourism as their travel purpose on weekends have different stay patterns, but their main travel destinations are similar. However, for residential office-intensive areas, the long-stay-time group obviously has a higher stay time than the short-stay-time group, such as Yangguang and Xingsha. The travel demand of the ridership is more about residential demand or service demand, rather than leisure, so its overnight demand is significantly higher than the round trip on the same day.
On weekdays, there are large differences in the distribution of main travel destinations between the short-stay-time group and the long-stay-time group. For the short-stay-time group, the main travel destinations are Yanghu Wetland (11.7%), Wuyi Square (10.0%), and Yanghu ECO Town (4.6%). The Yanghu area consists mainly of many large-scale shopping centers (IKEA, Livat, etc.), scenic spots (park, museum, etc.), office buildings, residential areas, etc. And Wuyi Square and Huangxing Square form the business center of Changsha, featuring huge jobs, tourism, entertainment, shopping facilities, etc. The result reflects that the main travel purposes of round trips on the same day are work and leisure. For the long-stay-time group, the main travel destinations are Yanghu Wetland (6.2%), Houjiatang (4.9%), and Central South University (3.7%), which reflect the main commuting demand for overnight stay on weekdays (work, school, etc.). In addition, the proportion of intercity ridership groups traveling to hospitals (Xiangya Hospital, the Second Xiangya Hospital) on weekdays is significantly higher than on weekends. It can be seen that the travel purpose of intercity ridership on weekdays is more diversified, including leisure, commuting (work, school, etc.), and official services (medical care, etc.). On the other hand, the travel purpose of ridership on weekends is mainly leisure. This provides a micro-behavioral basis for intercity transportation planning in the background of rail development and has important reference value for promoting the optimization of functional space in metropolitan areas and the construction of cross-city living service systems.
5. Conclusions
With the fast development of the economy, many metropolitans have been built and connections between cities have become increasingly close in China. In response to this issue, many cities have extended their URT systems, which were initially built to serve passengers in urban areas only, to adjacent cities to meet the huge intercity travel demands in the past decade. Using the Xihuan Line of the Changsha metro, which connects Changsha and Xiangtan, as an example, this paper is designed to explore the travel patterns of intercity passengers by analyzing the real metro smart card data on typical weekdays and weekends. The main findings are shown as follows:
- (1)
- The intercity ridership shows clear commuting patterns with AM and PM peaks on weekdays for both directions. However, on weekends, the ridership from Xiangtan to Changsha peaks at 9 AM to 11 AM, whereas the ridership from Changsha to Xiangtan peaks at 5 PM to 9 PM, which shows a clear tourism pattern. That is, many passengers living in Xiangtan went to Changsha for sightseeing, shopping, etc., as Changsha is one of hottest tourist destinations in China. In addition, the intercity ridership on weekends is much higher than that on weekdays.
- (2)
- The travel time shows no significant differences by direction or day of the week. Based on travel time, the GMM classified intercity ridership into two groups, i.e., the short-travel-time group with the average travel time being 32.9 min, and the long-travel-time group with the average travel time being 68.93 min, with the latter being the majority. For ridership from Xiangtan to Changsha, the short-travel-time group mainly alights around the Yanghu area, which is the closest well-developed community in Changsha to Xiangtan, whereas the long-travel-time group mainly alights around the city center of Changsha.
- (3)
- The stay time shows significant differences between weekends and weekdays. Based on stay time in Changsha, the GMM divided intercity ridership into two categories as well. Most passengers stay around 4.3 h, whereas the rest stay around 23.47 h. On weekends, the intercity passengers for tourism have different stay modes, but their destinations are similar. On weekdays, there are large differences in travel destinations between the short-stay-time group and the long-stay-time group, and their travel purposes are more diverse, including commuting (work, school, etc.), leisure, and services (medical, etc.).
Based on the findings, some measures might be taken to further promote the integrated development of the metropolitan area. Firstly, according to the characteristics of intercity ridership in the Changsha–Zhuzhou–Xiangtan metropolitan area, its methods and conclusions can provide reference for other urban agglomerations with the intercity metro. Secondly, considering the spatial distribution of the primary destinations for different travel-time groups, it is recommended to optimize urban transportation connectivity and enhance the integration efficiency between rail transit and other transport modes. For metro operations, measures such as shortening train intervals during off-peak hours in core areas (e.g., Wuyi Square and Furong Square) and installing additional wayfinding facilities at transfer hubs should be prioritized. Finally, considering the differentiated stay patterns of intercity ridership, it is suggested that relevant departments launch joint promotional packages linking scenic spots and hotels to extend intercity passengers’ stay times and enhance urban attractiveness. These measures will further advance the integrated development of the Changsha–Zhuzhou–Xiangtan metropolitan area. In addition, at the theoretical level, our research comprehensively considers travel patterns from two dimensions of stay time and travel time and confirms that intercity passengers meet the Gaussian distribution, which can provide reference for related research. In addition, we confirm that there are different travel modes for intercity metro passengers which are obviously heterogeneous and can also provide references.
The findings demonstrate the presence of heterogeneities between intercity ridership and the potential for agencies to formulate customized countermeasures to better meet the intercity travel demands. Even so, this study has limitations. Firstly, the intercity metro is just one of the available intercity travel modes in the studied area, which also includes bus, taxi, private car, intercity railway, etc. It is important to compare the travel patterns of the metro and other travel modes to accurately figure out their strengths and weaknesses to build an efficient and resilient multi-mode transportation system. Secondly, due to the data limitations, only the smart card data of four days are analyzed here. However, with the expansion of the Changsha metro, its ridership has also been increasing, which means that the intercity ridership might also be increasing. In the future, to identify the development trend of the intercity metro ridership, it is important to analyze the long-term smart card data. Finally, to more accurately identify the travel patterns of passengers, it is important to figure out their whole travel trajectories, including origins and destinations, rather than just metro travel parts. Many studies have demonstrated that cellular signaling data could be used to track the travel trajectories of people. Therefore, future researchers might consider utilizing cellular signaling data to make such an analysis.
Author Contributions
Conceptualization, Y.X. and C.L.; methodology, Y.X.; software, Y.X.; validation, Y.X. and C.L.; formal analysis, Y.X.; investigation, Y.X.; resources, B.C., W.R., C.Z. and C.L.; data curation, C.L.; writing—original draft preparation, Y.X.; writing—review and editing, B.C., W.R., C.Z. and C.L.; visualization, Y.X.; supervision, C.L.; project administration, C.L.; funding acquisition, B.C., W.R., C.Z. and C.L. All authors have read and agreed to the published version of the manuscript.
Funding
This research was funded by the Open Topic of Hunan Engineering Research Center of Geographic information security and application (HNGISA2023003), the Open Topic of Hunan Geospatial Information Engineering and Technology Research Center (HNGIET2023002), and the Science and technology project of the Department of Natural Resources of Hunan Province (HBZ20240122).
Institutional Review Board Statement
Not applicable.
Informed Consent Statement
Not applicable.
Data Availability Statement
The datasets presented in this article are not readily available because the data are part of an ongoing study or due to technical. Requests to access the datasets should be directed to the corresponding author.
Conflicts of Interest
The authors declare no conflicts of interest.
References
- Pan, Z.; Zhang, T.; Tang, H.; Wang, Y. Research on the“Four-Network Integration”System of Multi-Level Rail Transit. J. Transp. Eng. 2020, 20, 1–8. [Google Scholar]
- Shanghai and Suzhou Subways Are Connected, Why Are There More and More Cross-City Lines? Available online: https://www.thepaper.cn/newsDetail_forward_22169506?commTag=true (accessed on 10 September 2024).
- Xiao, Y. Intercity Subways Should Not Be Widely Promoted. Rev. Econ. Res. 2013, 71, 37. [Google Scholar]
- Zhao, Z.; Zhao, S.; Han, Z.; Liu, L.; Jia, J.; Wang, S. The Impact Of The Covid-19 Pandemic On Intercity Travel During Chinese Festivals. Hum. Geogr. 2022, 37, 141–149+172. [Google Scholar]
- Zhan, W.; Xi, G.; Ju, Y.; Shi, F. Temporal Heterogeneity and Impact Mechanism of Intercity Travel Time in the Yangtze River Delta Region. Trop. Geogr. 2024, 44, 850–863. [Google Scholar]
- Zhong, J.; Deng, Q.; Zhou, J. Railway Passenger Flow Characteristics Between Shenzhen and Cities in the Guangdong Hong Kong Macao Greater Bay Area. Traffic Transp. 2024, 37, 152–155. [Google Scholar]
- Wang, S.; Zhao, M. Intercity Trips and Activities: The Case of Guangzhou and Foshan. Urban Plan. Forum 2012, 3, 23–29. [Google Scholar]
- El Mahrsi, M.K.; Come, E.; Oukhellou, L.; Verleysen, M. Clustering Smart Card Data for Urban Mobility Analysis. IEEE Trans. Intell. Transp. Syst. 2017, 18, 712–728. [Google Scholar] [CrossRef]
- Zhao, X.; Wu, Y.; Ren, G.; Ji, K.; Qian, W. Clustering Analysis of Ridership Patterns at Subway Stations: A Case in Nanjing, China. J. Urban Plan. Dev. 2019, 145, 04019005. [Google Scholar] [CrossRef]
- Zhang, S.; Huang, J.; Zhu, G.; Xu, X.; Zhang, Z. Passenger Flow Trajectory Prediction Model of Urban Rail Transit Based on Passenger Flow Category. Comput. Eng. Des. 2023, 44, 1829–1835. [Google Scholar]
- Yao, Z.; Gao, G.; Zheng, H.; Huang, Z. Time Distribution Types of Passenger Flow Between Urban Rail Transit Stations Based on Spectral Clustering. Urban Rapid Rail Transit 2022, 35, 99–104+116. [Google Scholar]
- Zhang, H.; Ma, W. Subway Passenger Flow Forecasting Model Based on Temporal and Spatial Characteristics. Comput. Sci. 2019, 46, 292–299. [Google Scholar]
- Zhu, Y.; Huang, D.; Zhang, B. Clustering with Distributional Factors Based on Gaussian Mixture Model. Stat. Res. 2024, 41, 147–160. [Google Scholar]
- McLachlan, G.J.; Lee, S.X.; Rathnayake, S.I. Finite Mixture Models. Annu. Rev. Stat. Its Appl. 2019, 6, 355–378. [Google Scholar] [CrossRef]
- Wang, Y.; Liu, H.; Peng, S.; Hu, Z.; Wu, L. Short-Term Power Forecasting Method of Wind Farm Based on Gaussian Mixture Model Clustering. Autom. Electr. Power Syst. 2021, 45, 37–43. [Google Scholar]
- Li, Z.; Tian, X.; Li, Z.; Zhou, W.; Zhou, Z.; Zhong, M. Risk Analysis of Metro Station Passenger Flow Based on Passenger Flow Patterns. J. Tsinghua Univ. (Sci. Technol.) 2019, 59, 854–860. [Google Scholar]
- Zhenhong, Y.; Feng, C.; Zijia, W.; Jianling, H.; Bo, W. Classifications of Metro Stations by Clustering Smart Card Data Using the Gaussian Mixture Model. Urban Rapid Rail Transit 2017, 30, 48–51+107. [Google Scholar]
- Mirzal, A. Statistical Analysis of Microarray Data Clustering Using NMF, Spectral Clustering, Kmeans, and GMM. IEEE-ACM Trans. Comput. Biol. Bioinform. 2022, 19, 1173–1192. [Google Scholar] [CrossRef]
- Yue, Y.; Lan, T.; Yeh, A.G.O.; Li, Q.Q. Zooming into Individuals to Understand the Collective: A Review of Trajectory-Based Travel Behaviour Studies. Travel Behav. Soc. 2014, 1, 69–78. [Google Scholar] [CrossRef]
- Yang, C.; Fu, X.; Dong, R. Investigating Spatial-Temporal Characteristics of Joint Activity/Travel Behaviour with Smart Card Data. Travel Behav. Soc. 2025, 38, 100899. [Google Scholar] [CrossRef]
- Arana, P.; Cabezudo, S.; Peñalba, M. Influence of Weather Conditions on Transit Ridership: A Statistical Study Using Data from Smartcards. Transp. Res. Part A Policy Pract. 2014, 59, 1–12. [Google Scholar] [CrossRef]
- Ali, A.; Kim, J.; Lee, S. Travel Behavior Analysis Using Smart Card Data. KSCE J. Civ. Eng. 2016, 20, 1532–1539. [Google Scholar] [CrossRef]
- Fang, Q.; Homma, R.; Inoue, T.; Liu, Q.; Zheng, Q. Spatio-Temporal Variation of Urban Bus Ridership Using Smart Card Data in a Compact City. Int. Rev. Spat. Plan. Sustain. Dev. 2023, 11, 192–207. [Google Scholar] [CrossRef] [PubMed]
- Zhang, Y.; Manley, E.; Martens, K.; Batty, M. A Metro Smart Card Data-Based Analysis of Group Travel Behaviour in Shanghai, China. J. Transp. Geogr. 2024, 114, 103764. [Google Scholar] [CrossRef]
- Wu, Y.; Liu, T.; Gong, L.; Luo, Q.; Du, B. Mining Smart Card Data to Estimate Transfer Passenger Flow in a Metro Network. IET Intell. Transp. Syst. 2024, 18, 1830–1846. [Google Scholar] [CrossRef]
- Redner, R.A.; Walker, H.F. Mixture Densities, Maximum Likelihood and the EM Algorithm. SIAM Rev. 1984, 26, 195–239. [Google Scholar] [CrossRef]
- Zhang, M.; Li, L.; Yang, X.; Sun, G.; Cai, Y. A Load Classification Method Based on Gaussian Mixture Model Clustering and Multi-Dimensional Scaling Analysis. Power Syst. Technol. 2020, 44, 4283–4296. [Google Scholar]
- Yu, J.; Qin, S.J. Multimode Process Monitoring with Bayesian Inference-Based Finite Gaussian Mixture Models. AIChE J. 2008, 54, 1811–1829. [Google Scholar] [CrossRef]
Disclaimer/Publisher’s Note: The statements, opinions and data contained in all publications are solely those of the individual author(s) and contributor(s) and not of MDPI and/or the editor(s). MDPI and/or the editor(s) disclaim responsibility for any injury to people or property resulting from any ideas, methods, instructions or products referred to in the content. |
© 2025 by the authors. Licensee MDPI, Basel, Switzerland. This article is an open access article distributed under the terms and conditions of the Creative Commons Attribution (CC BY) license (https://creativecommons.org/licenses/by/4.0/).