1. Introduction
With the rapid acceleration of urbanization, the scale of metro tunnel construction has expanded rapidly, and underground transportation networks have become increasingly complex, leading to a substantial number of existing metro tunnels. However, over time, tunnel structures are inevitably affected by factors such as geological changes, construction quality, environmental vibrations, and daily operations, resulting in horizontal convergence deformation, misalignment, and other structural issues. How to achieve precise and efficient comprehensive detection and monitoring of tunnel structures has become an urgent engineering and technical challenge.
Mobile three-dimensional laser scanning technology provides a novel approach to tunnel disease detection. The deformation detection method based on point cloud analysis enables non-contact high-precision measurement, facilitating tunnel health monitoring in complex environments [
1,
2]. Compared with traditional single-point monitoring methods, this technology significantly improves detection efficiency, promoting the transition from discrete-point monitoring to full-space digital monitoring [
3,
4]. However, to achieve practical engineering applications, further research is required to address three key technical challenges: (1) point cloud denoising in complex noise environments [
5,
6,
7]; (2) automated segmentation of the tunnel lining structure [
8]; (3) feature extraction of deformed tunnels [
9].
Point cloud denoising is the first step in improving data quality and reliability. In tunnel point cloud processing, noise primarily originates from measurement errors of scanning equipment, environmental interference, and the reflective characteristics of complex tunnel surfaces. Common denoising methods include filtering [
10,
11,
12], random sampling methods [
13,
14], and deep learning approaches [
15], among others. For example, Du, L et al. [
10] proposed a cross-section-based simulated filtering denoising method, which includes circumferential and longitudinal joint detection, point cloud denoising, and circumferential and longitudinal dislocation calculation. The experimental results show that the proposed method achieves high accuracy, with Root Mean Square Error (RMSE) values of 1.56 mm and 0.57 mm, outperforming existing methods. RMSE is a measure of the average magnitude of errors between predicted and observed values, with smaller values indicating higher accuracy. Moreover, it can intuitively display the displacement values at any location within the tunnel. Shi et al. [
12] proposed a cloth simulation filtering method based on a cylindrical projection of point clouds to improve the deformation detection accuracy of metro shield tunnels. This method separates lining point clouds from auxiliary structures through cylindrical projection and analyzes tunnel deformation using direct least-squares ellipse fitting. Experimental results showed that the repeatability of global and local deformation measurements was 0.41 mm and 0.66 mm, respectively, demonstrating that this method can efficiently extract lining point clouds while meeting the accuracy requirements for tunnel deformation detection. Kang et al. [
13] introduced an efficient method for continuously extracting metro tunnel cross-sections from ground point clouds. By applying the RANSAC algorithm to fit and optimize the designed tunnel axis, the method extracts cross-section points using the intersection of transverse planes and point clouds. Additionally, a BaySAC-based quadratic parametric surface fitting algorithm was introduced to process cross-section points that are difficult to extract directly. Shen et al. [
15] utilized PointNet++ for semantic segmentation of shield tunnels, extracting lining structure point clouds before performing denoising processing on the tunnel point cloud. Based on the principle of the minimum cross-sectional area within a cylinder, multiple iterations were then conducted to extract cross-sections.
The geometric morphology of tunnel cross-sections is a critical basis for analyzing tunnel deformation and detecting structural diseases. Through cross-section extraction, the local shape of the tunnel can be precisely described. For example, Zhang [
16] proposed a fast tunnel cross-section extraction algorithm based on an octree index. By defining a search range polygonal plane and combining it with node polygon intersection determination, this method quickly achieves cross-section positioning and extraction. The algorithm integrates equidistant segmentation of the designed tunnel cross-section contour, enabling accurate calculation of deformation in tunnels of arbitrary shapes. Similarly, Zhang et al. [
17] introduced a method for extracting shield tunnel cross-section deformation from 3D point cloud data. This approach fits segment outlines using Fourier functions and calculates the displacement field of mesh nodes, allowing for highly accurate lining deformation feature extraction. Experimental and simulation validation demonstrated the high reliability of this method, making it suitable for practical engineering deformation detection. Tang et al. [
18] proposed a tunnel cross-section fitting and extraction method based on grayscale maps, which was applied to Suzhou Metro tunnels. By extracting horizontal convergence values and ellipticity from specific cross-sections and comparing them with total station measurement results, the accuracy and efficiency of the method were verified. Compared to traditional measurement methods, 3D laser scanning significantly improves the efficiency and comparability of long-term tunnel monitoring, aiding in the assessment of tunnel operational status and long-term deformation trends.
However, the most commonly used cross-section extraction method still involves slicing the tunnel by taking normal vector planes along the designed tunnel axis and extracting point cloud data of a certain thickness. This method, however, requires highly accurate designed axis extraction. For this reason, many scientists have studied the extraction of the tunnel’s central axis. For example, Chen et al. [
19] proposed an automatic highway tunnel cross-section extraction method based on 3D laser scanning. The method estimates the tunnel centerline using control network registration, point cloud projection, and skeletonization, then generates cross-section planes at intervals. Wang et al. [
20] introduced a tunnel deformation measurement method based on 3D point cloud data. By extracting the designed tunnel axis using 3D invariant moments, the method enables tunnel pose correction and cross-section feature extraction. Experimental validation demonstrated an accuracy of up to 2 mm, making it suitable for tunnel 3D point cloud analysis and information extraction. Yi et al. [
21] proposed a denoising algorithm for inclined tunnel point cloud data based on irregular contour features. This algorithm combines DBSCAN clustering and polynomial curve fitting to obtain continuous point cloud slices perpendicular to the inclined tunnel centerline, enabling the extraction of irregular tunnel inner wall shapes. Yu et al. [
22] introduced an automatic tunnel centerline and cross-section extraction method based on 3D laser scanning data. By constructing a k-dimensional tree (k-d tree) index using horizontal projection, the method calculates centerline points and extracts cross-section parameters, ultimately generating a 3D tunnel model for deformation visualization analysis. Experimental results showed that the minimum horizontal centerline extraction error was 0.011 cm, demonstrating high accuracy and a significant reference value.
To achieve refined and intelligent tunnel management, relying solely on overall cross-section analysis is no longer sufficient to meet monitoring needs. There is an urgent need for precise segmentation of various tunnel lining structures to enable independent identification and monitoring of different lining units. This not only helps evaluate the structural health of the tunnel lining but also provides efficient and reliable technical support for localized disease detection, deformation analysis, and maintenance decision-making. Currently, segmentation is primarily performed through image and point cloud registration. For example, Song et al. [
23] proposed a layered modeling method for accurately modeling 3D shield tunnel structures. This method segments point cloud data based on design patterns, extracts tunnel segment fragments using intensity images, and constructs an accurate 3D model. The algorithm can robustly extract tunnel segments even in the presence of noise and occlusions. Zhang et al. [
24] introduced a new method that creates binary images from unfolded point clouds for segment-wise point cloud segmentation. Based on the extracted designed tunnel axis, the method applies image processing techniques to segment tunnel segments and constructs an as-built tunnel model in a BIM platform to complete tunnel deformation detection with high accuracy. Liu et al. [
25] proposed a novel and efficient deep learning model for disease detection using mobile laser scanning (MLS) point cloud intensity images. The model integrates a new residual network module (Res2Net) with a cascaded structure to form a unified framework for extracting multi-scale and discriminative features of tunnel diseases, significantly improving detection accuracy.
However, existing tunnel point cloud processing methods still have several limitations. First, many approaches rely on image segmentation and tunnel point cloud template matching for tunnel segmentation. However, this process is constrained by point cloud quality, lighting conditions, and image resolution, making it difficult to ensure segmentation accuracy and robustness. Therefore, in cases where image data are unavailable, it is particularly important to explore tunnel lining segmentation methods based solely on point cloud data. Second, traditional cross-section extraction methods based on the designed tunnel axis have certain limitations in tunnel positioning and detection, making them less adaptable to the structural characteristics of deformed tunnels. Therefore, introducing more precise and robust cross-section extraction techniques to improve the accuracy and applicability of tunnel structure analysis is a key research direction.
To address the aforementioned challenges, this study proposes two novel algorithms—GuSAC and TMatch—along with a ring-based cross-section extraction technique, to enhance the automated segmentation of tunnel point clouds using only point cloud coordinate data. First, the GuSAC algorithm, which integrates RANSAC, normal vector fitting, and sliding window fitting, effectively segments the designed tunnel axis, eliminates noise and non-tunnel structural Point Cloud in long tunnel sections, and reduces the reliance of traditional methods on manual intervention, thereby improving the overall efficiency of automated tunnel denoising. Second, the TMatch algorithm, combining clustering analysis and the Gaussian Mixture Model (GMM), enables the modular segmentation of tunnel point clouds solely based on point cloud coordinate data. This method accurately distinguishes different tunnel ring segments, providing precise point cloud data for further deformation analysis and structural assessment. Finally, the proposed ring plane fitting technology, based on plane fitting methods and utilizing the SVD algorithm, overcomes the dependency on spacing intervals in axis-based extraction methods, allowing for more flexible cross-section extraction of single-ring tunnels.
2. Materials and Methods
By combining the GuSAC algorithm and the TMatch algorithm, independent tunnel segment units can be automatically identified and separated under the premise of determining the designed tunnel axis. Subsequently, the ring-based plane fitting technique is used to extract tunnel cross-sections, enabling the analysis of tunnel structure deformation.
2.1. Application of the GuSAC Algorithm
During the mobile 3D laser scanning process, in addition to collecting tunnel lining structure point clouds, non-tunnel structural point clouds such as tunnel pipelines, grouting holes, tunnel lining joints, and some discrete noise generated by equipment vibrations are also collected. The GuSAC algorithm designed in this paper, compared to the traditional RANSAC fitting method, recognizes the regional geometric features of the tunnel, removes non-structural point clouds and noise, and outputs point cloud data that only contains the tunnel lining.
2.1.1. Designed Tunnel Axis Point Cloud Extraction
The designed tunnel axis, as the symmetrical centerline of the tunnel structure, provides a reference for precise tunnel positioning. It reflects the tunnel’s alignment and orientation, serving as the foundation for establishing the coordinate system used in subsequent analyses. The GuSAC algorithm is built upon this alignment-representative designed tunnel axis, forming the operational plane for the tunnel.
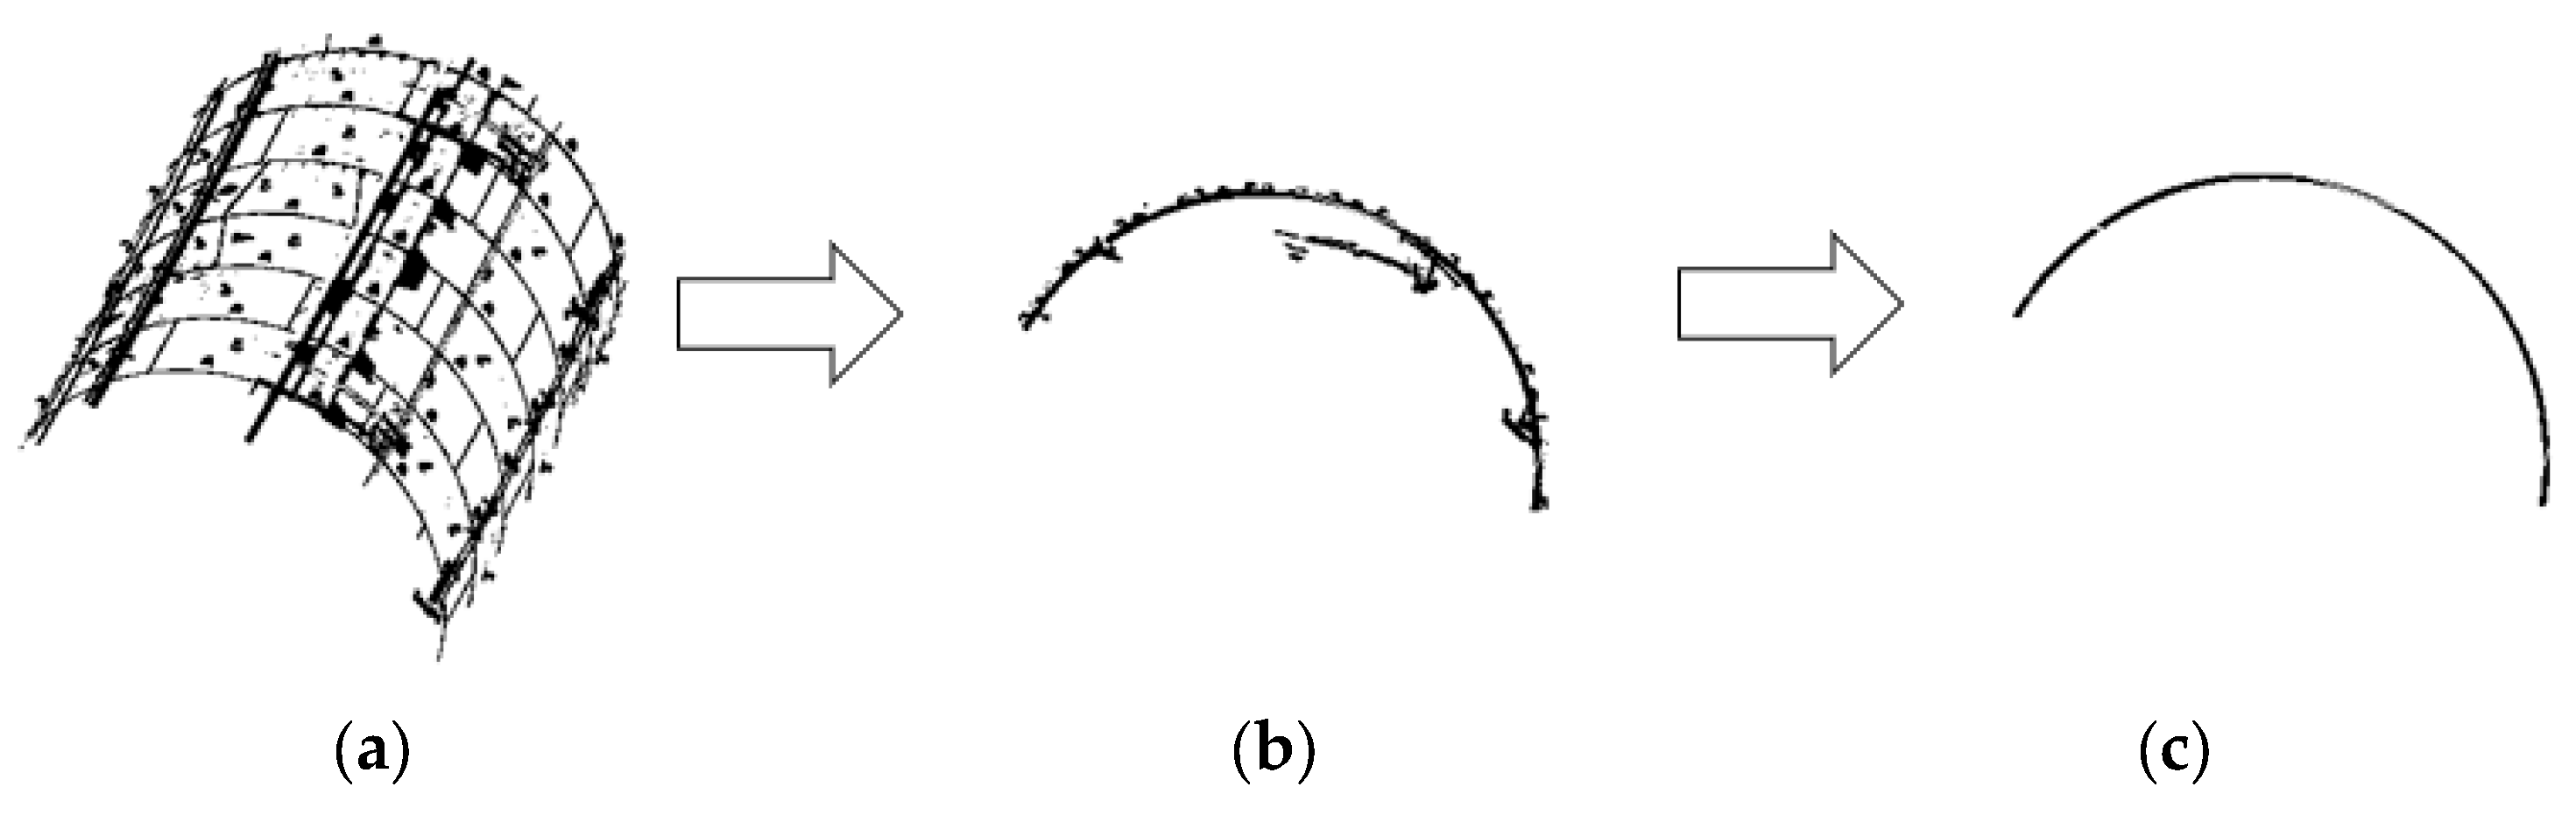
The extraction of the point cloud set representing the designed axis is typically obtained through coarse processing of vault point cloud data [
9]. First, the initial coordinate system of the tunnel is adjusted. Then, sampling slices are taken at fixed intervals of M, with the sampling baseline determined by the tunnel’s elevation values, and N slices are extracted. Finally, by calculating the centroid of the point cloud set within each slice, a smooth point cloud set of the designed axis is generated, laying a solid foundation for subsequent analyses.
2.1.2. Segmented Fitting of the Designed Axis
In subway tunnel design, directly fitting the entire designed tunnel axis can result in the loss of many critical features. This is particularly true in special cases where the alignment cannot be accurately represented by a single function. Therefore, dividing the tunnel axis into curved sections and straight sections and expressing them using piecewise functions can more precisely reflect the overall alignment of the tunnel. The specific steps for axis segmentation fitting are as follows:
The designed axis obtained in this experiment is illustrated in
Figure 1 below.
- 2.
The points in the tangent space coordinate system are processed using a sliding window method to identify turning points. Within the local neighborhood of each point, the tangent direction angle data are smoothed using a mean convolution kernel. In the smoothed data, the trend within the window range is analyzed to determine whether a change in trend occurs. The specific criteria for identifying changes are as follows:
If the angle values within the window gradually increase, the trend is identified as “increasing.”
If the angle values gradually decrease, the trend is identified as “decreasing.”
If the variation in angle values is smaller than a preset threshold, the trend is considered “unchanged.”
Points with significant changes in trend are marked as turning points. In this experiment, an effective segmentation of the tunnel axis is achieved by setting the sliding window size to 20 parameters and the threshold to 0.001. The threshold value should be appropriately adjusted for different axis data. The operational results under the above parameters are shown in
Figure 2.
- 3.
Repeat the above steps, performing reverse calculations starting from the tunnel endpoint as the initial point. For the boundary points obtained from the two runs, determine whether adjacent boundary points exist by checking if the difference in cumulative path lengths is smaller than a preset threshold. If adjacent boundary points are identified, their average value is taken as the optimized boundary point position. If no adjacent points are found, the original boundary point is retained to avoid misadjustments of significant boundary points.
- 4.
The turning points are mapped back to the original point cloud space, and the point cloud data are divided into multiple continuous segments. Finally, the segmented point cloud parts are saved as independent files. Then, the least squares curve fitting algorithm is applied to perform cubic curve fitting on each segment of point cloud data. The resulting graph, as shown in
Figure 3, gives the parametric equation for the tunnel crown design axis.
2.1.3. Non-Tunnel Structural Point Cloud Elimination Method
This paper proposes a GuSAC algorithm based on regional plane fitting, which is directly applied to tunnel point cloud data. Leveraging the high-density characteristics of the tunnel point cloud, the algorithm can independently fit each region of the tunnel, effectively removing redundant point cloud data without altering the tunnel’s original feature information. The specific steps are as follows:
The GuSAC algorithm uses a segmented axis line as the operating line and assigns different labels to the tunnel point cloud data within a specific distance and angle range from the operating line.
Using the labeled point cloud data, the GuSAC algorithm performs plane fitting to obtain the parameters of the plane model, denoted as a plane, whose mathematical expression is:
Since the density of tunnel lining joints is much lower than the total number of tunnel lining points, the RANSAC algorithm accurately captures the tunnel lining point cloud and treats it as a tunnel lining plane. Then, the normal vector is computed based on the inliers detected by RANSAC, and the vertical distance from each point
to the plane is calculated. By combining the normal vector and the vertical distance values, all non-tunnel structural point clouds within the tunnel can be removed. The formula is expressed as follows:
Create sets
Y and
N, and define thresholds
λ1 and
λ2.
λ1 is the actual depth of the tunnel lining joint divided by a certain normalization factor, and λ
2 is defined as the mean of the local point cloud’s overall normal vector minus 1.5 times the standard deviation. Using these two thresholds as denoising standards, the annular point cloud can be separated from the tunnel lining joints, tunnel pipelines, and other element point clouds. The specific process is as follows:
When the ring joint width H exceeds the minimum neighborhood parameter of the subsequent TMatch algorithm, the calculation is terminated. Otherwise, the parameter is reduced, and iterative calculations are performed until the condition is satisfied.
In this experiment, the tunnel is divided into 72 smaller regions by performing a 5° cut along the tunnel’s circumferential direction, with the central axis of the tunnel as the reference. At the same time, the track data within the tunnel are removed. For straight sections, the longitudinal width can be set according to the specific width of the ring segment, or it can be appropriately enlarged. For curved sections, the longitudinal width can be slightly reduced. The output of the tunnel is shown in
Figure 4. Using this method, most of the non-tunnel structural point cloud and noise points in the tunnel can be effectively removed, resulting in a smooth tunnel cross-section.
2.2. Cross-Section Segmentation and Segment Extraction
After removing the non-tunnel structural point cloud, the boundary features of the tunnel point cloud data become more distinct, prompting the development of the TMatch algorithm. This algorithm first identifies and removes tunnel lining joint features and then performs a preliminary classification of the tunnel segments. Subsequently, the Gaussian Mixture Model (GMM) is used to fit the coarsely classified scalar field, completing the inter-ring segmentation. Based on the Shield Tunnel Design Standard (GB/T51438-2021, in China) [
26], fine classification is carried out, ultimately achieving precise segmentation of the tunnel segments.
2.2.1. Preliminary Classification of Tunnel Segments
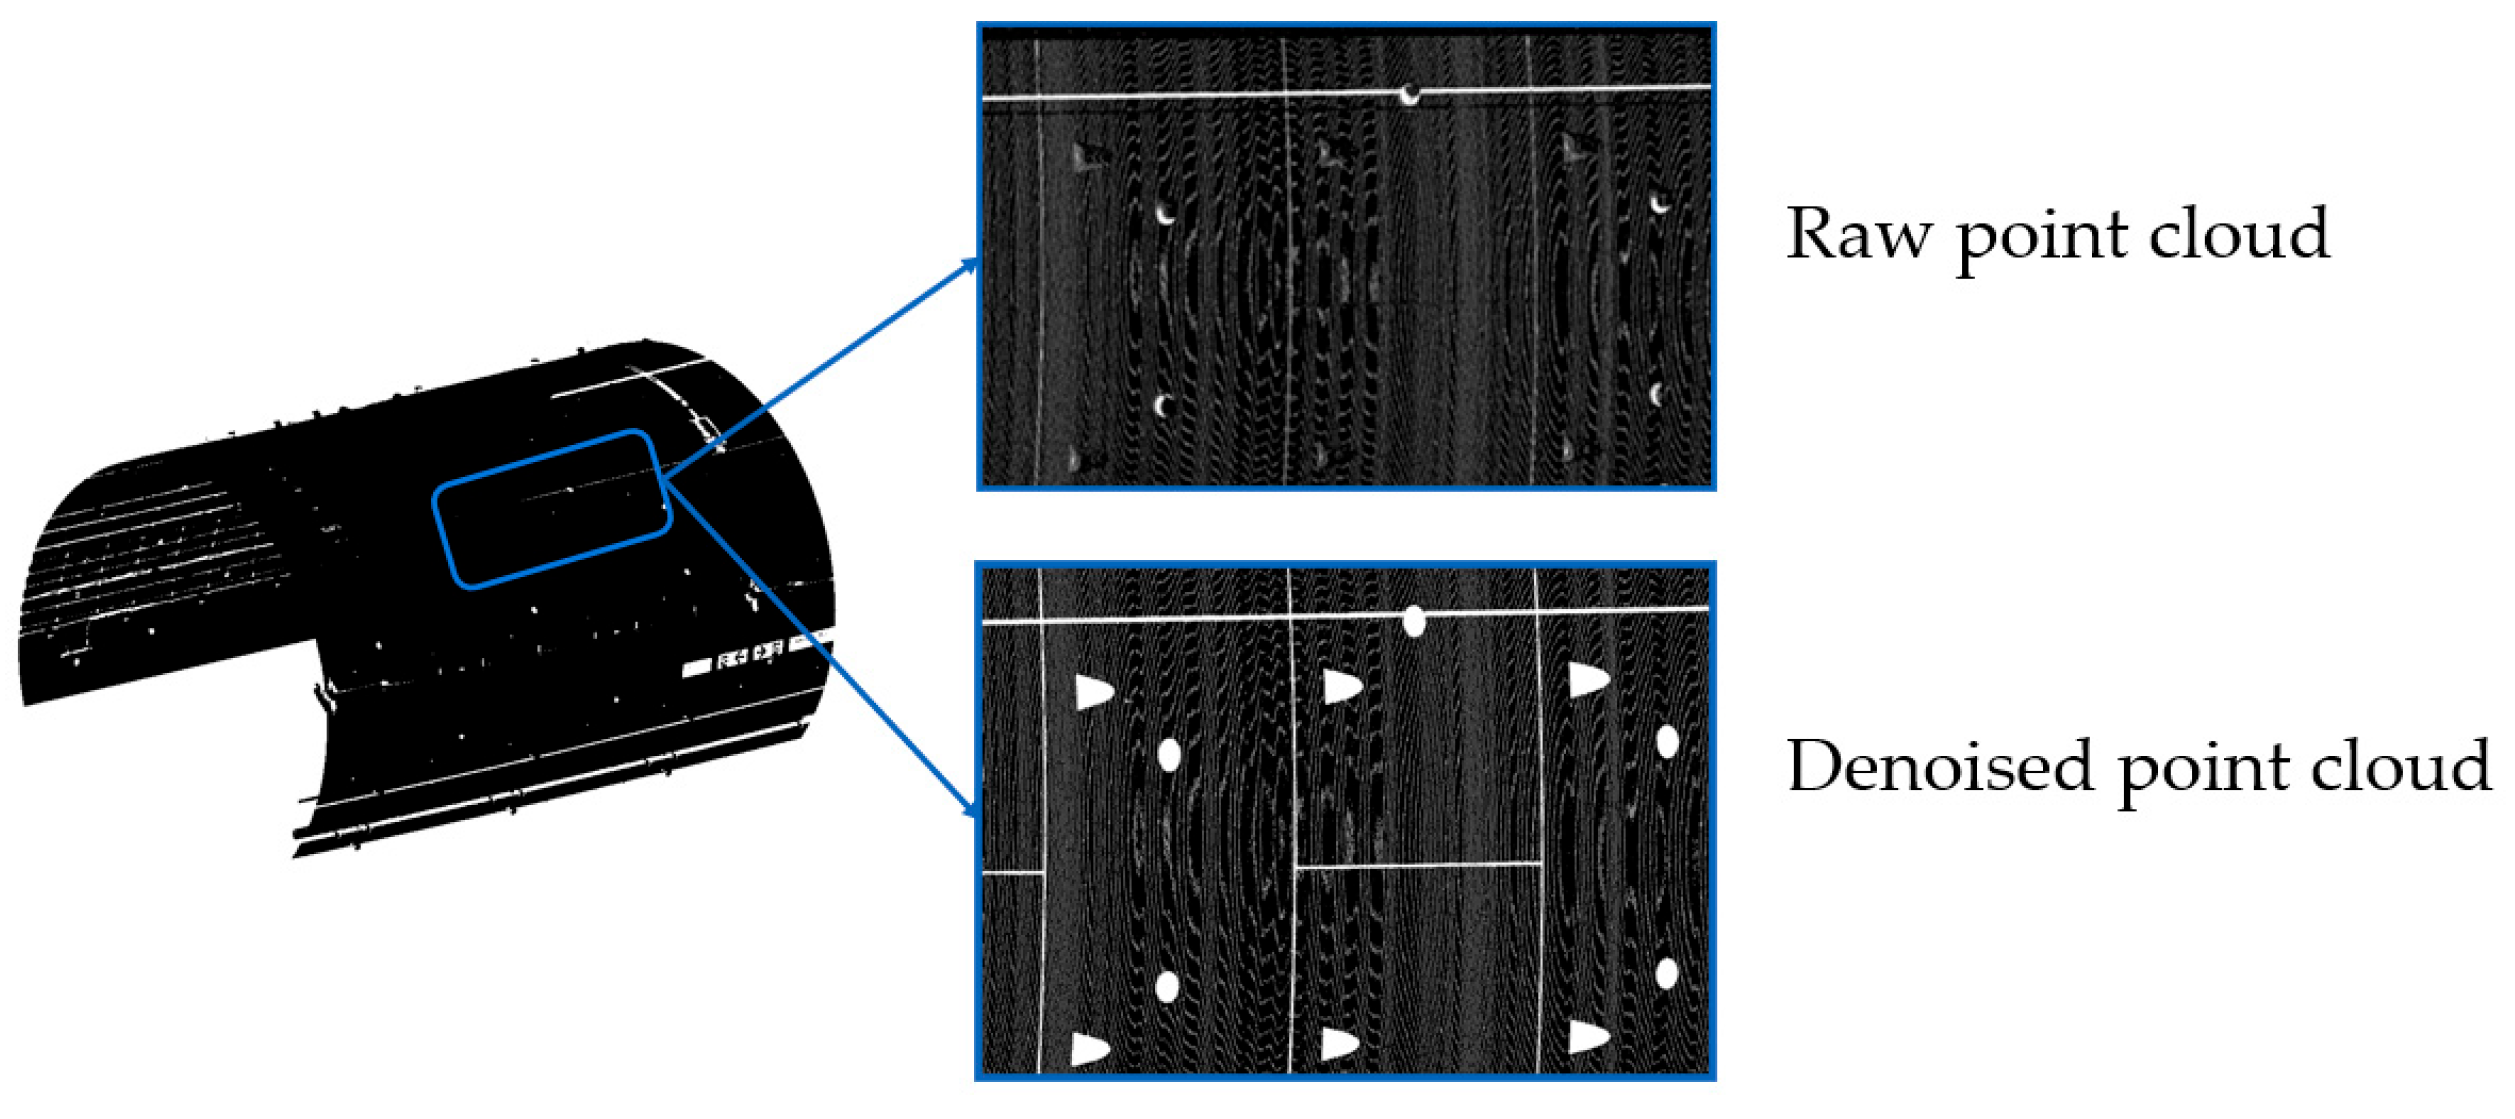
After the GuSAC algorithm removes tunnel lining joint features, the distinctions between tunnel segments become more apparent, as shown in
Figure 5. Consequently, the TMatch algorithm is designed to capture these features.
The first step of this algorithm is the preliminary classification of the tunnel point cloud, with two key parameters: the tunnel joint distance R and the minimum number of point clouds forming a segment N. These parameters jointly determine the algorithm’s ability to accurately identify dense regions. In this study, the optimal parameter combination was determined through experiments to ensure the algorithm effectively segments the point cloud data into meaningful clusters while suppressing the impact of noise and outliers.
The processed point cloud data output the coordinates of each point along with its corresponding classification label. Points not assigned to any cluster are labeled as 0, while other points are labeled with consecutive numbers starting from 1, ensuring the uniqueness and recognizability of each tunnel segment label. To visually demonstrate the clustering results, the processed data were visualized using CloudCompare v2.13.1 software. The visualization is shown in
Figure 6 below.
The visualization effect of the tunnel point cloud after processing with the TMatch algorithm is shown in
Figure 6, where regions in different colors represent different tunnel segments. The inter-ring lining and intra-ring lining are strictly differentiated. However, there are still some detail errors in the current classification, and a further improvement in classification accuracy is needed.
2.2.2. Tunnel Inter-Ring Segmentation
The second step of the TMatch algorithm is to perform fine classification of the tunnel point cloud. Fine classification primarily involves normalizing the previously assigned labels, enabling precise extraction of each tunnel ring and lining segment through label-based identification.
After TMatch processing, the tunnel point cloud shows distinct differentiation between tunnel rings, but the labels remain irregular. To further optimize label consistency, this study applies the Gaussian Mixture Model (GMM), a statistical model that assumes the data are generated by a mixture of several Gaussian distributions and are used for clustering and density estimation to fit the probability distribution of the tunnel scalar field. GMM calculates boundary points that divide the scalar field data into multiple intervals, from which point cloud data for each interval are extracted. Since the tunnel is arranged in a circular shape and the scalar field exhibits periodic characteristics, GMM fitting is particularly advantageous.
The GMM is a probabilistic model that assumes data are composed of multiple Gaussian distributions weighted together. Its parameters include weights, means, and variances, which are determined using maximum likelihood estimation (MLE). The goal of MLE is to optimize the model’s log-likelihood function to maximize the probability of generating the observed data. However, because GMM involves latent variables (i.e., the specific Gaussian component to which each data point belongs is unknown), directly optimizing the likelihood function is complex. Therefore, the expectation-maximization (EM) algorithm is employed for parameter optimization.
The EM algorithm iteratively updates parameters to achieve maximum likelihood estimation, including the following two steps:
E-step (expectation step): Calculate the probability (posterior probability) of each data point belonging to each Gaussian component.
M-step (maximization step): Update the model parameters, including the weights, means, and variances, based on the posterior probabilities calculated in the E-step.
Here, represents the weight of the i-th Gaussian component, is the mean, and is the variance.
The iterative process of the EM algorithm progressively approximates the maximum value of the log-likelihood function, yielding the optimal parameters for the GMM. GMM models the data distribution as a weighted sum of multiple Gaussian distributions, and its probability density function can be expressed as:
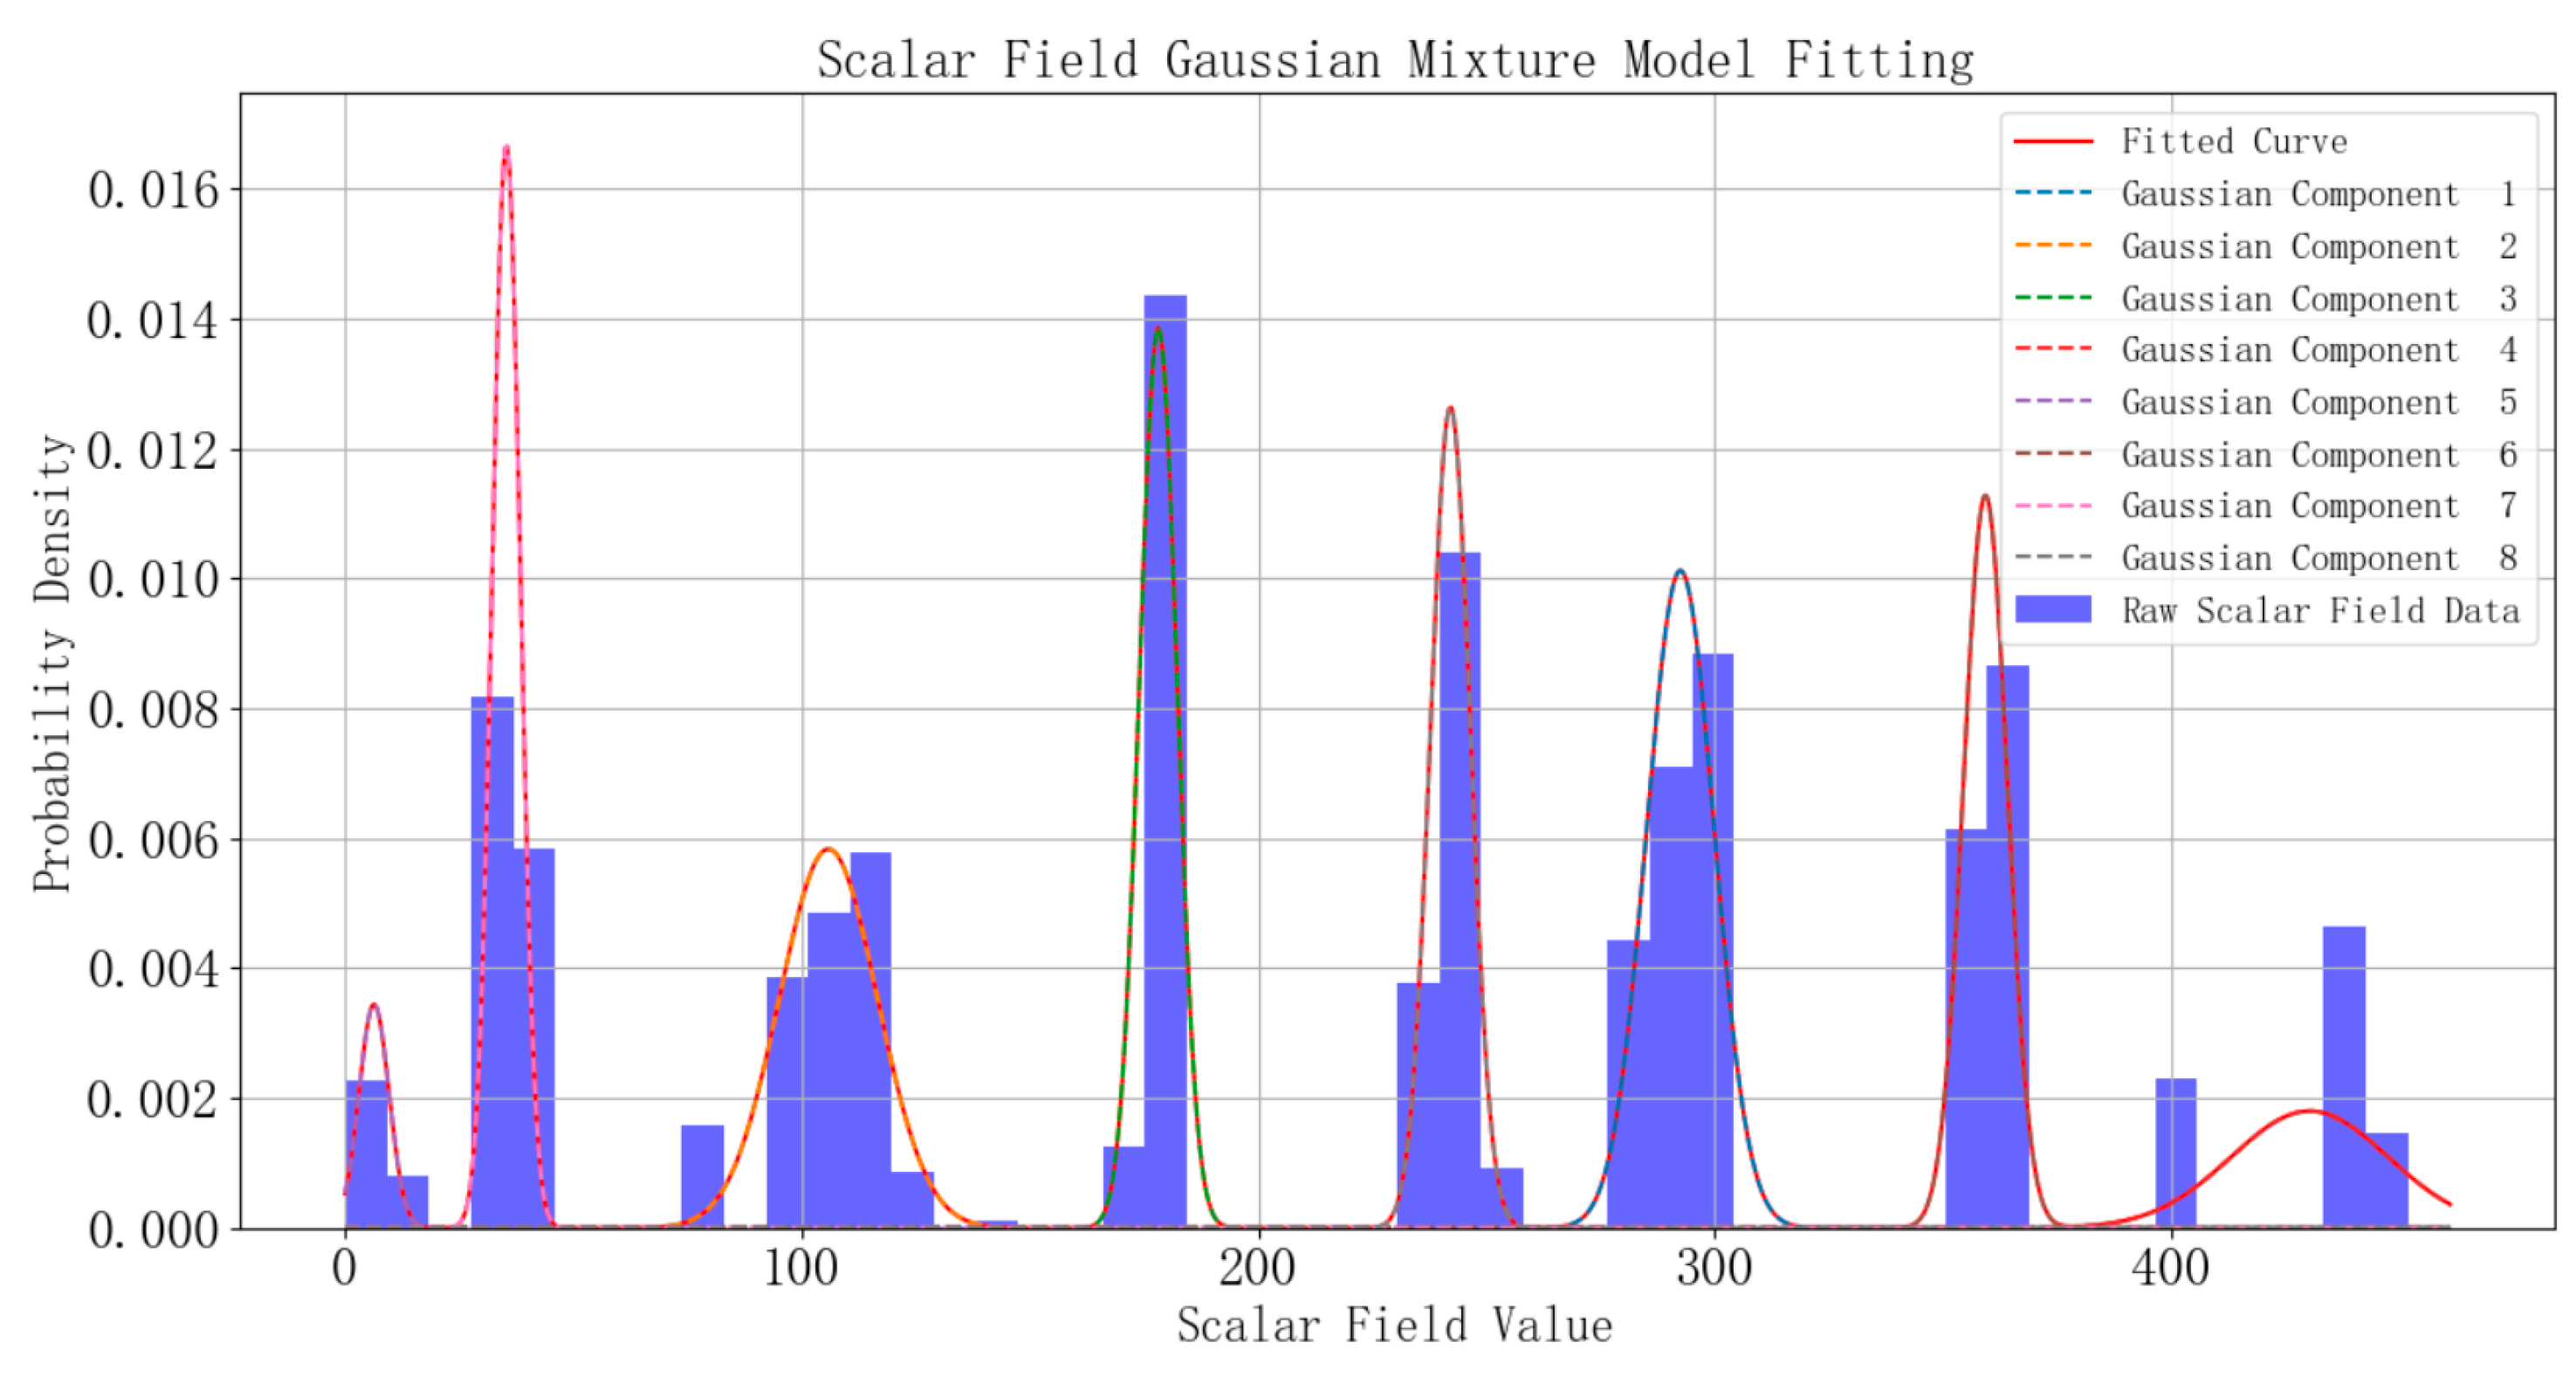
Using the above method, the tunnel point cloud data are precisely segmented into multiple intervals.
Figure 7 illustrates the segmentation intervals determined using the GMM.
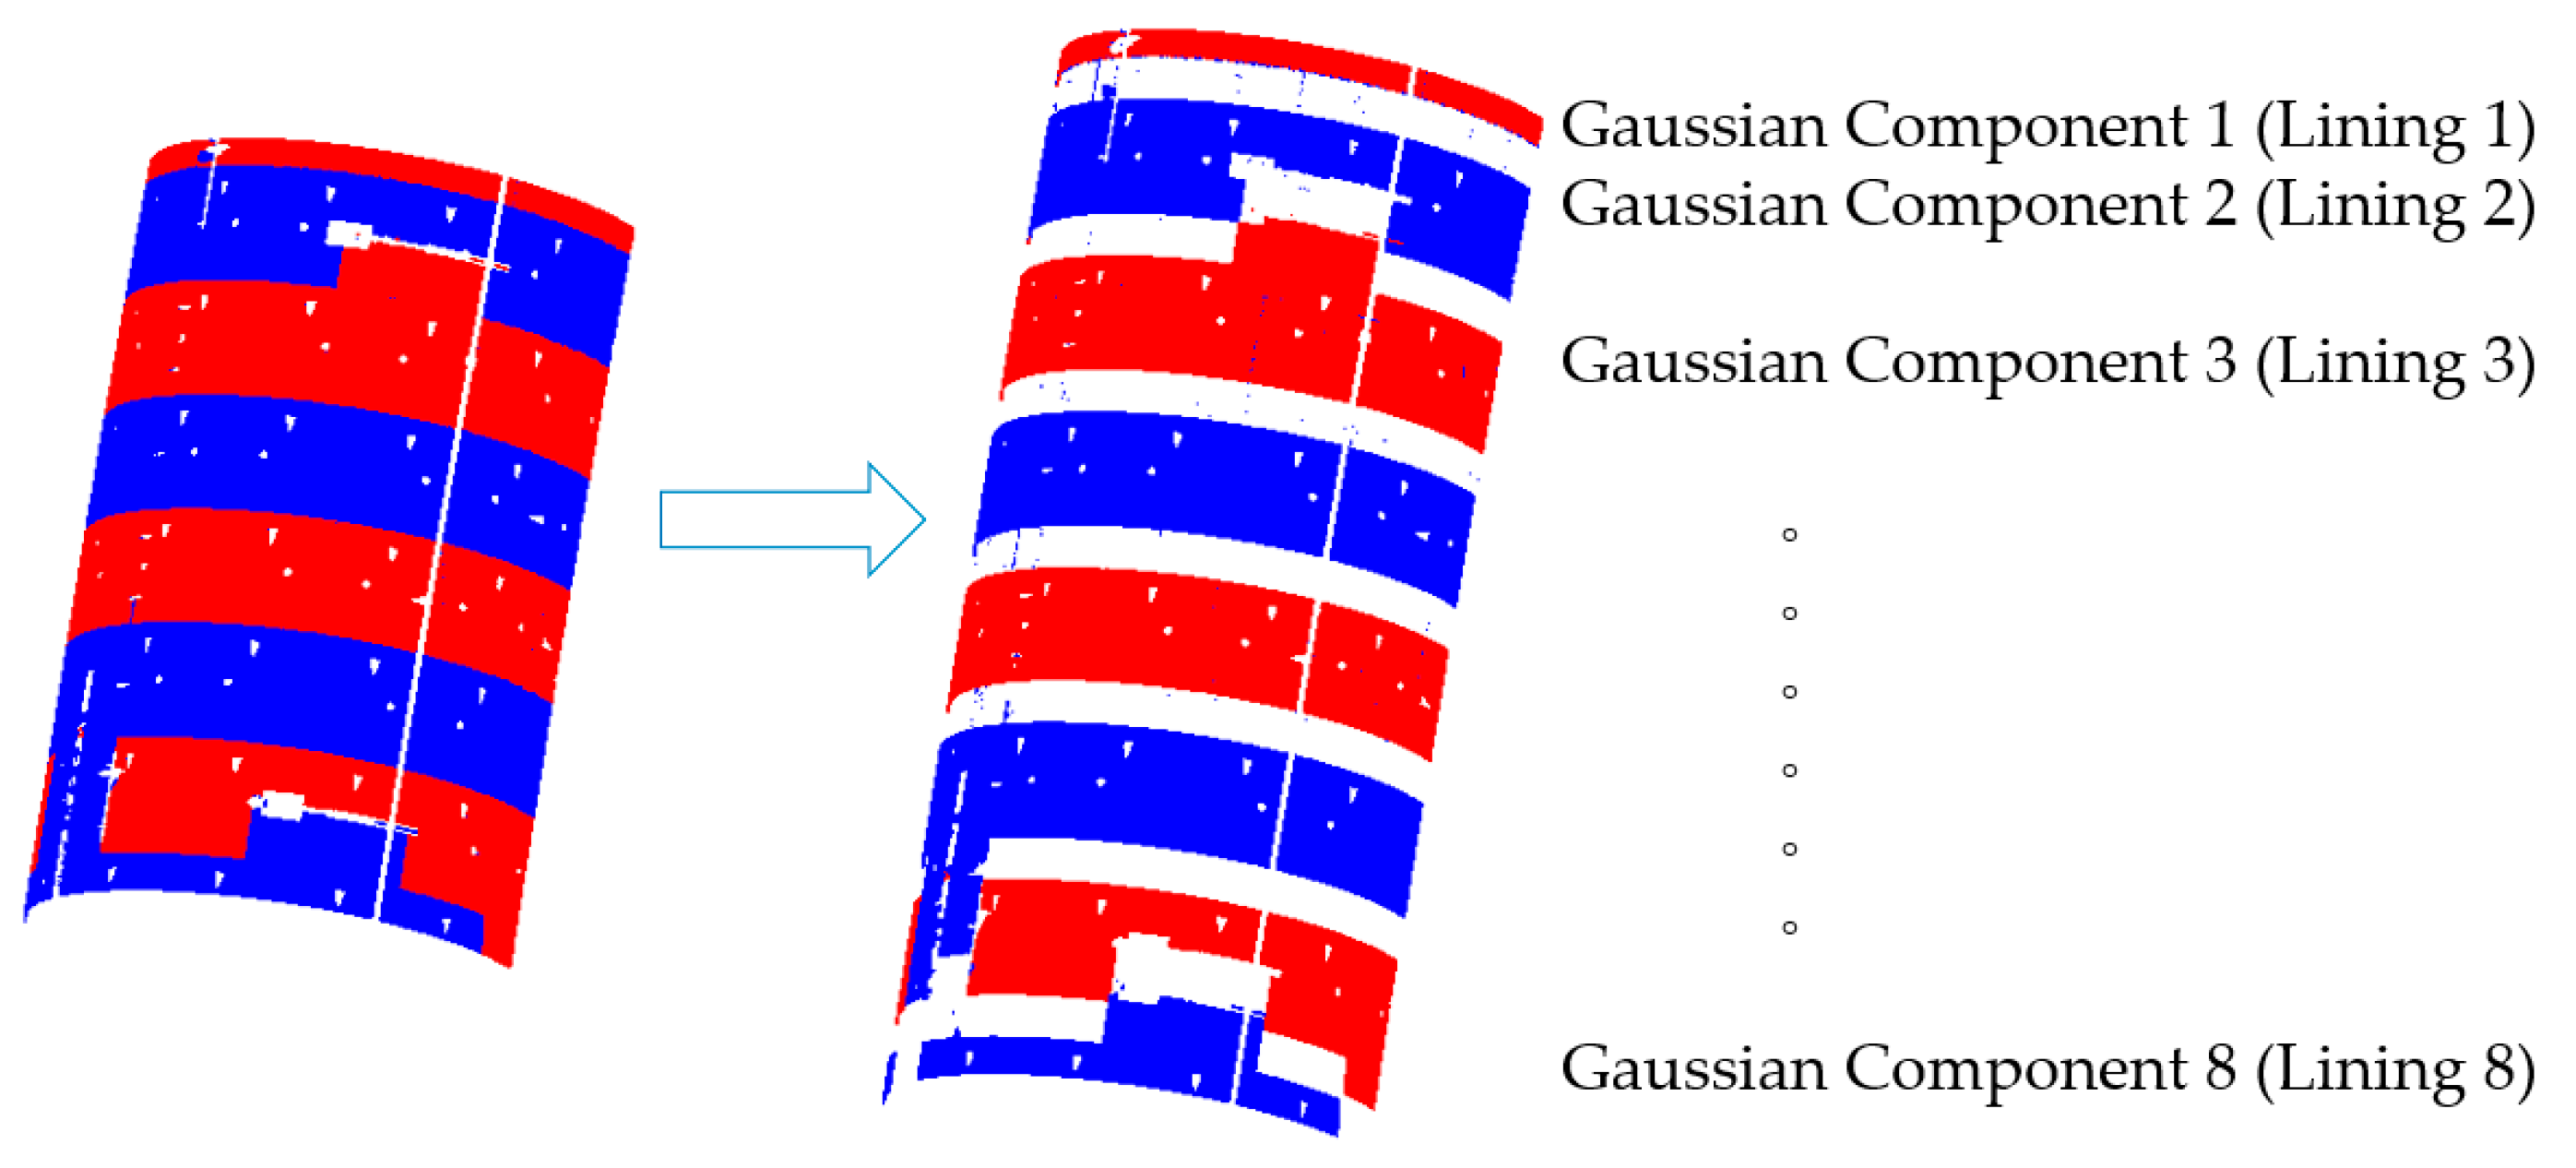
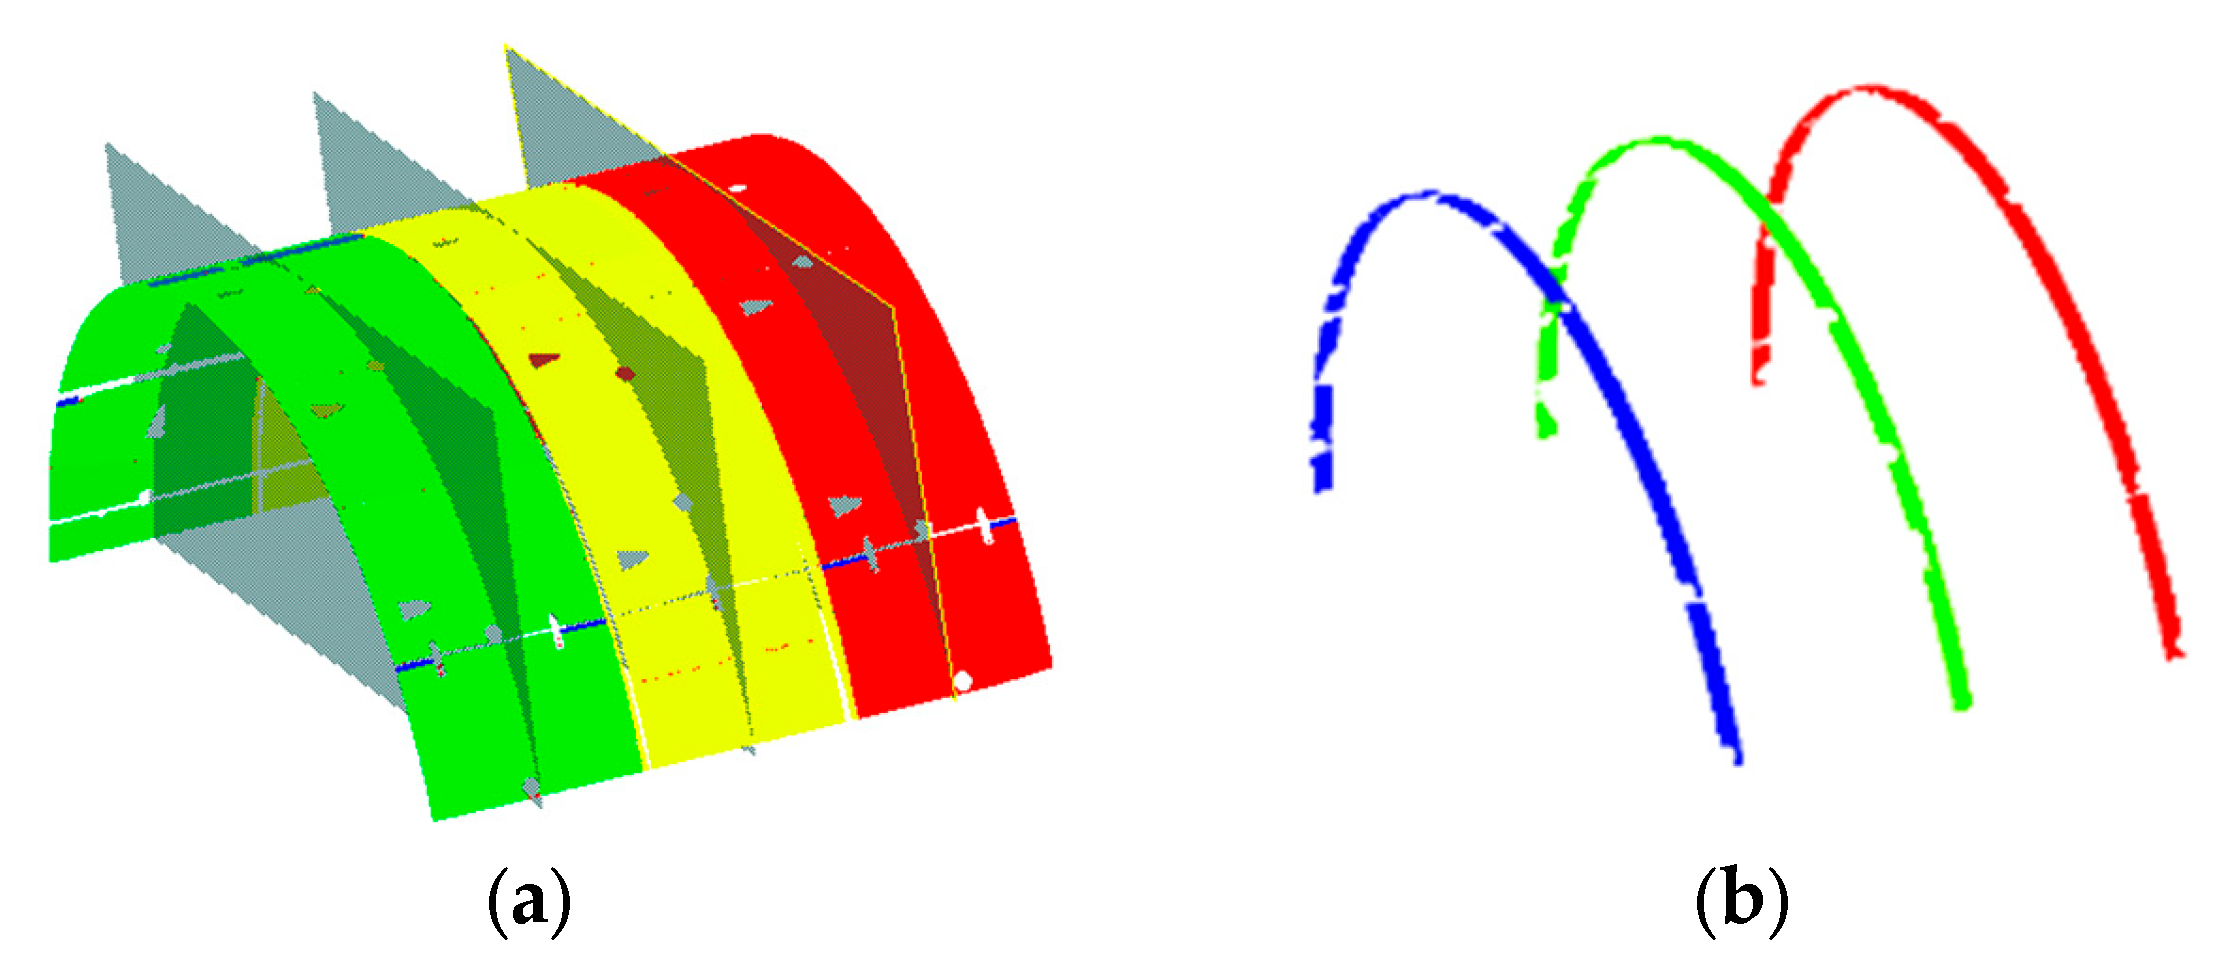
The intervals obtained through scalar field fitting are further used to extract the tunnel cross-sections, as shown in
Figure 8, where the tunnel cross-sections have been further subdivided.
As shown in
Figure 8, after the tunnel scalar field extraction method is completed, the majority of the tunnel segments have been accurately extracted. The point cloud files are assigned a second layer of labels, indicating different ring numbers and their corresponding interval point clouds.
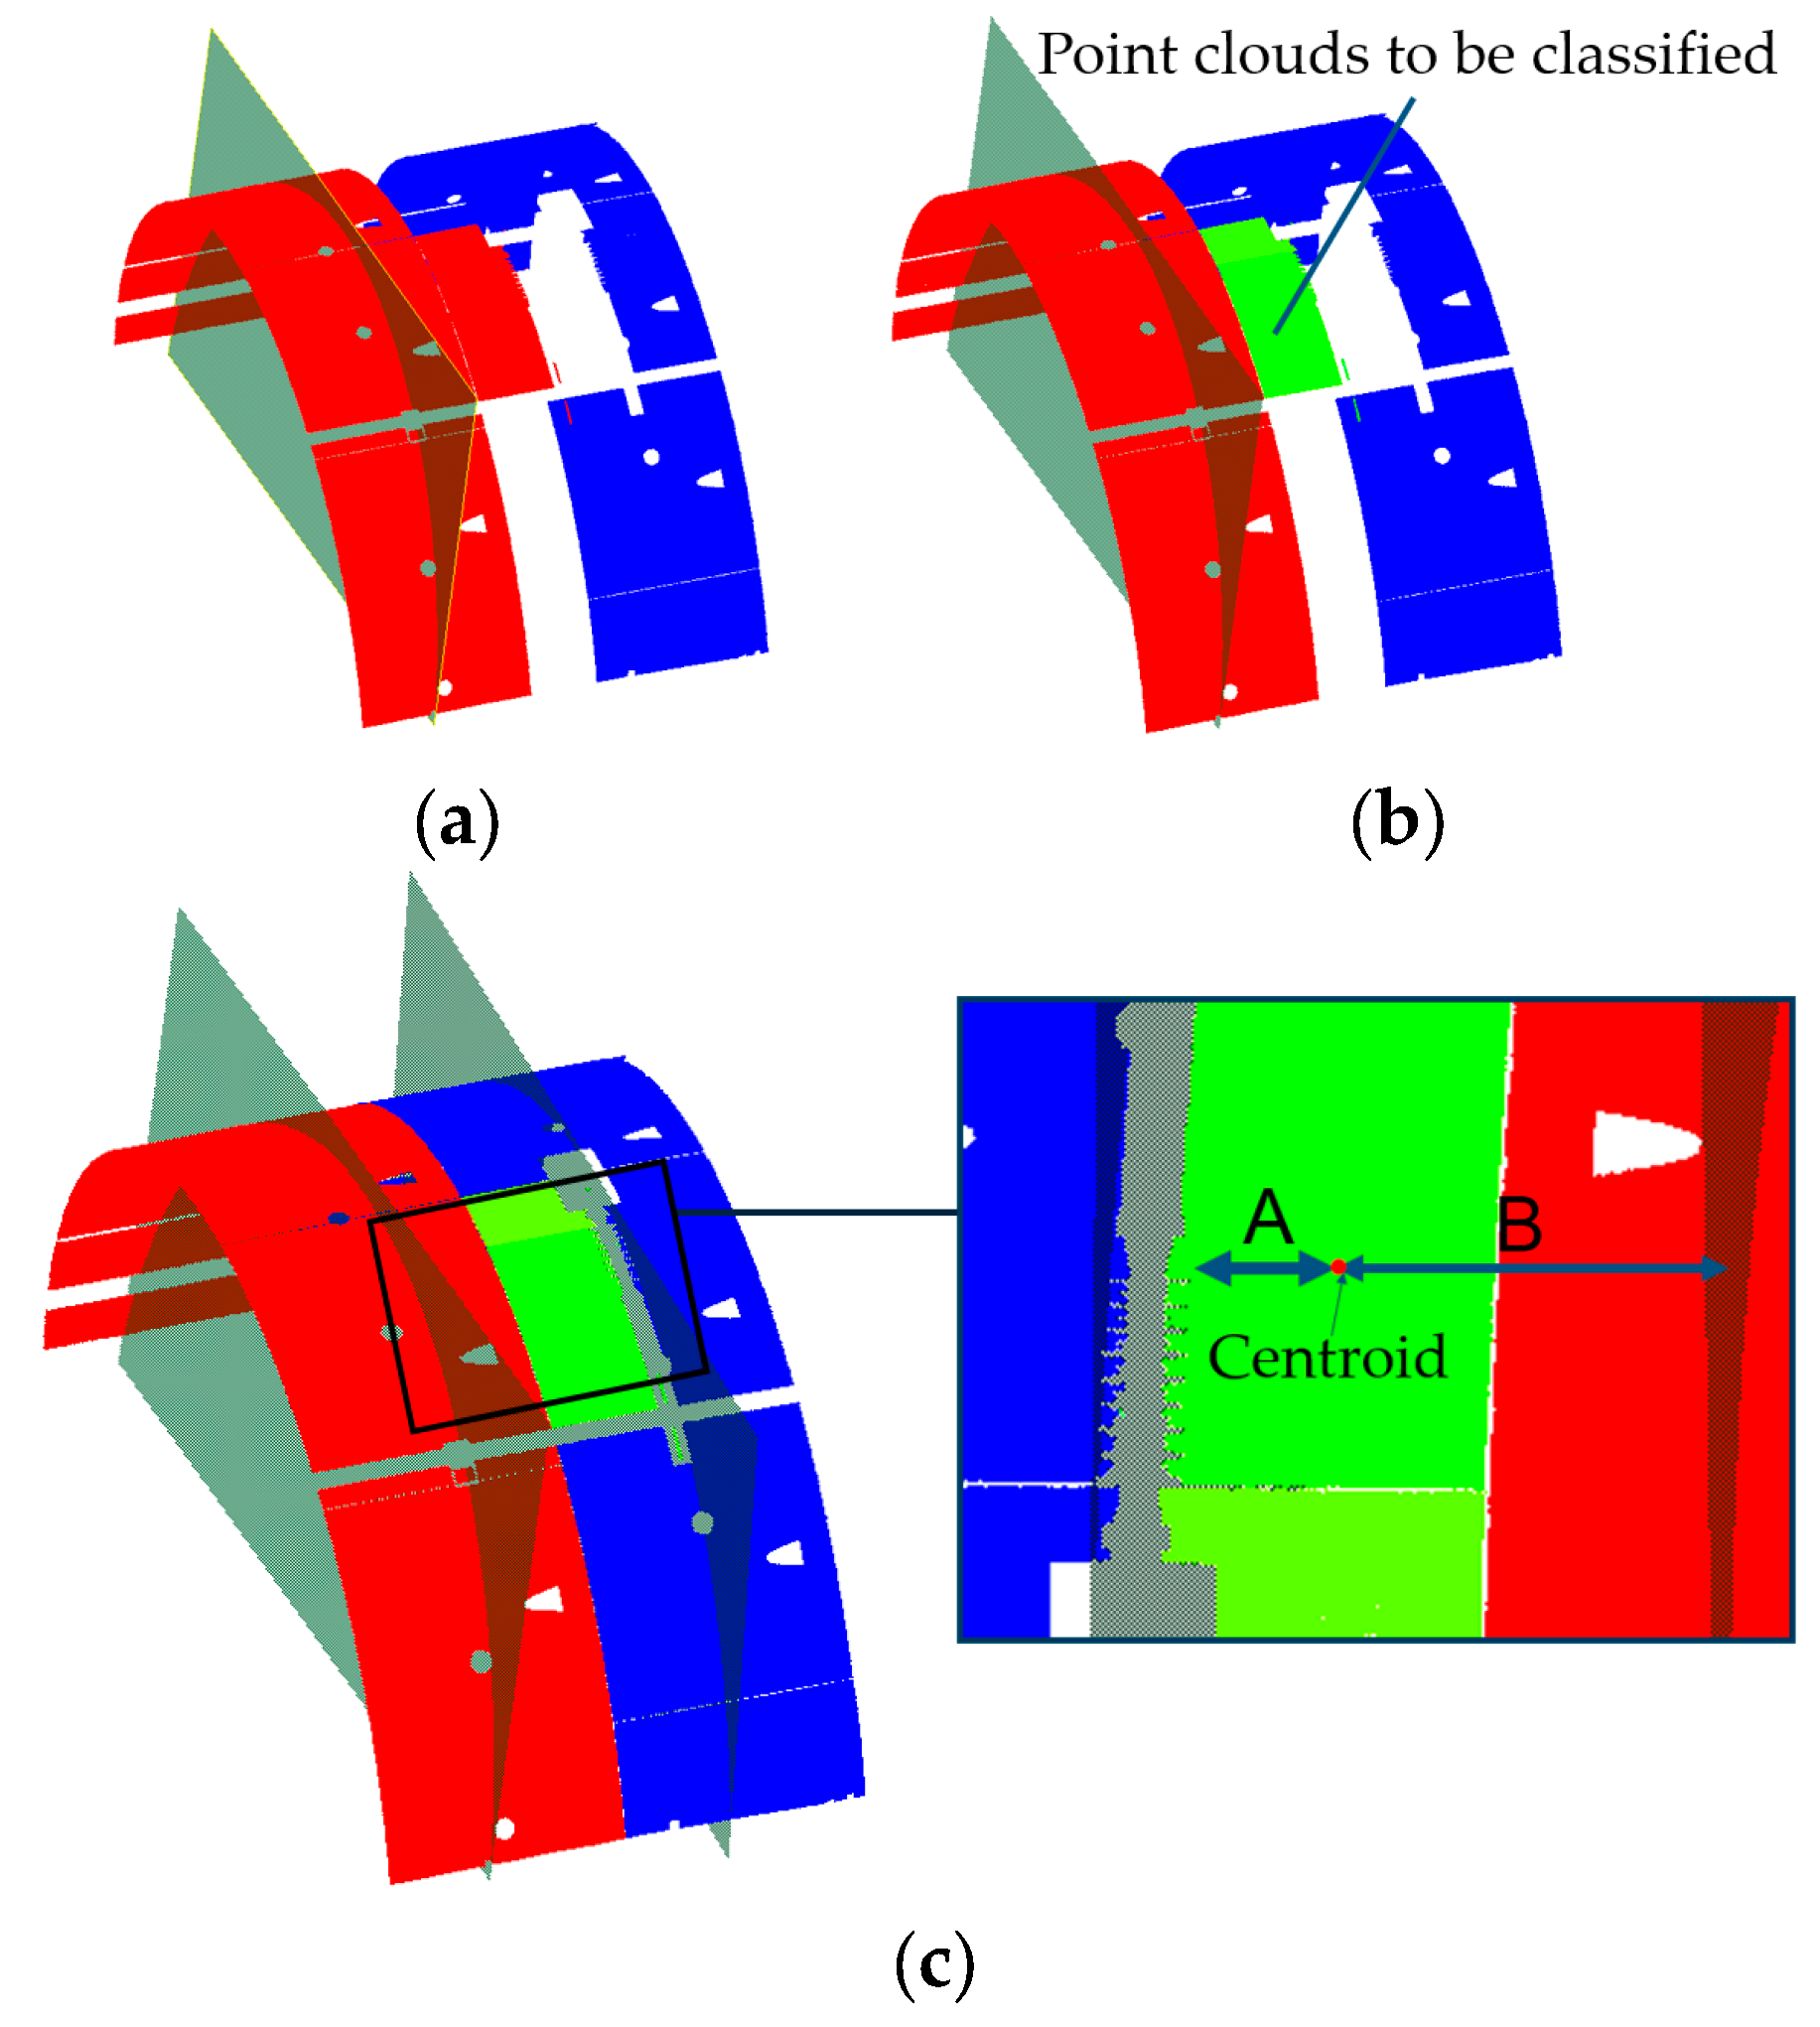
To improve the accuracy of tunnel classification, we adopted further optimization steps: First, the point cloud data of two adjacent labels are extracted, and priority is given to performing plane fitting for the intervals with more points. Through this method, the labels passing through the plane are regrouped. If the plane does not belong to a particular interval, the point cloud of that interval is assigned to another interval. Point clouds that do not pass through the plane are marked as to be classified. Next, the optimized point cloud undergoes plane fitting, and the distance from the centroid to the plane is calculated. The to-be-classified point cloud is then assigned to the nearest interval based on its distance from the plane.
As shown in
Figure 9, small groups of point clouds with small intervals are classified as to-be-classified point clouds. After this process, the to-be-classified point cloud is accurately assigned to the second interval. This method is also applicable when ring segment point clouds are incompletely collected, as seen with the first and last rings in
Figure 8.
2.2.3. Tunnel Ring Inner Segmentation
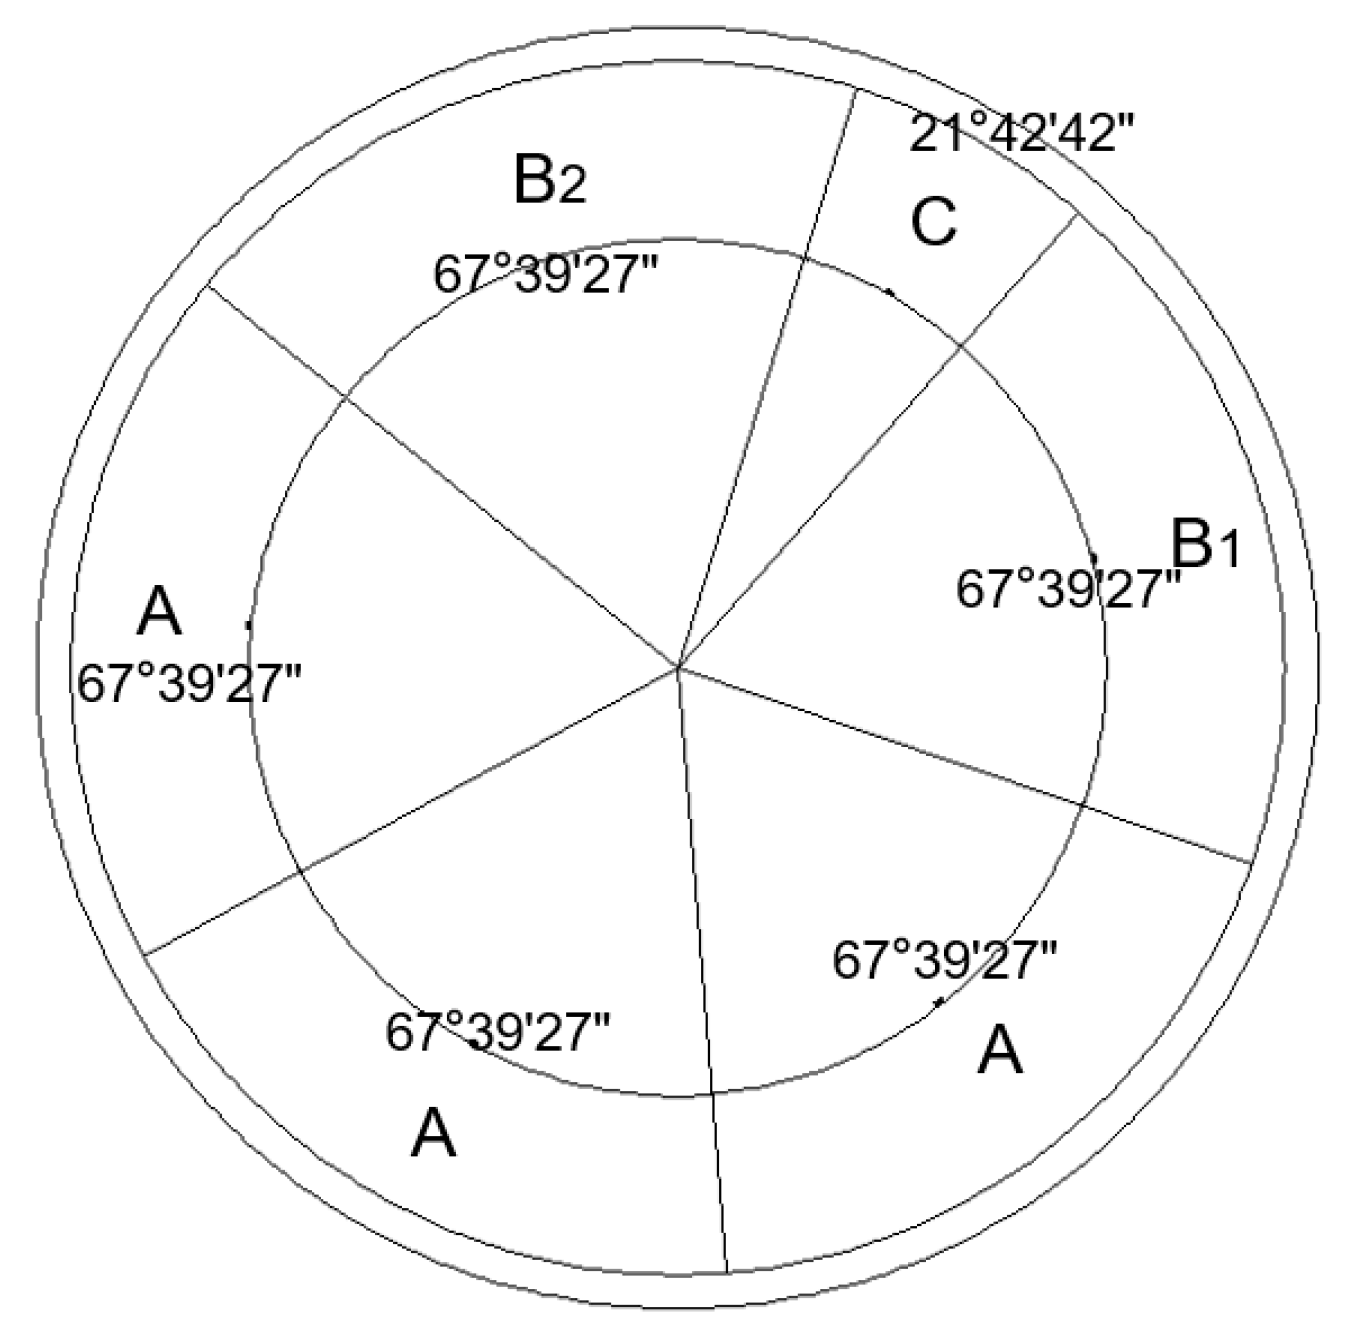
In tunnel construction, a segmented lining structure is often used, including capping blocks, crown blocks, side plates, and bottom plates. These lining segments are arranged and connected in a specific manner to form the overall tunnel structure, as shown in
Figure 10.
The TMatch algorithm transforms the tunnel structure into specific angular segments, as shown in
Figure 11. Using the least-squares method, an overall circular fitting is performed to determine the center of the circle. Taking this center as the reference, the number of point clouds with different labels is calculated within specific angles of the tunnel point cloud data. Since point cloud data typically consist of millions of points, defining angles around the tunnel lining joints allows for high-precision segmentation. For long, regular tunnels, this method can be applied directly for efficient processing.
2.3. Tunnel Cross-Section Extraction and Deformation Detection
To improve the accuracy of tunnel cross-section extraction, this study proposes a cross-section extraction method based on fitted plane centering, which offers higher precision compared to traditional axis-based slicing methods. This approach, referred to as the ring-based cross-section extraction technique, involves the following steps:
Assume the point cloud dataset is
, where each point P
i has coordinates (x
i, y
i, z
i). The general equation of a plane is expressed as Equation (1). First, the centroid
of the point cloud data is calculated as:
Next, the point cloud data are centralized, resulting in a new point set. A covariance matrix SSS of the centralized point cloud data is then constructed as:
Here, contains the eigenvectors of the covariance matrix, and is the singular value diagonal matrix.
The eigenvectors and singular value decomposition (SVD) of the covariance matrix are used to obtain the normal vector of the plane, where the normal vector corresponds to the eigenvector associated with the smallest singular value (last column of
). The offset is calculated using the centroid. Subsequently, the vertical distance from each point in the point cloud to the single-ring plane is computed, yielding the centered cross-section of the tunnel. The output of this method is shown in
Figure 12.
This approach does not rely on the designed tunnel axis and eliminates the need to define slicing intervals, thus avoiding positional deviations during extraction. It enables precise extraction of cross-sections at any location within the tunnel. The output effect is illustrated in
Figure 12.
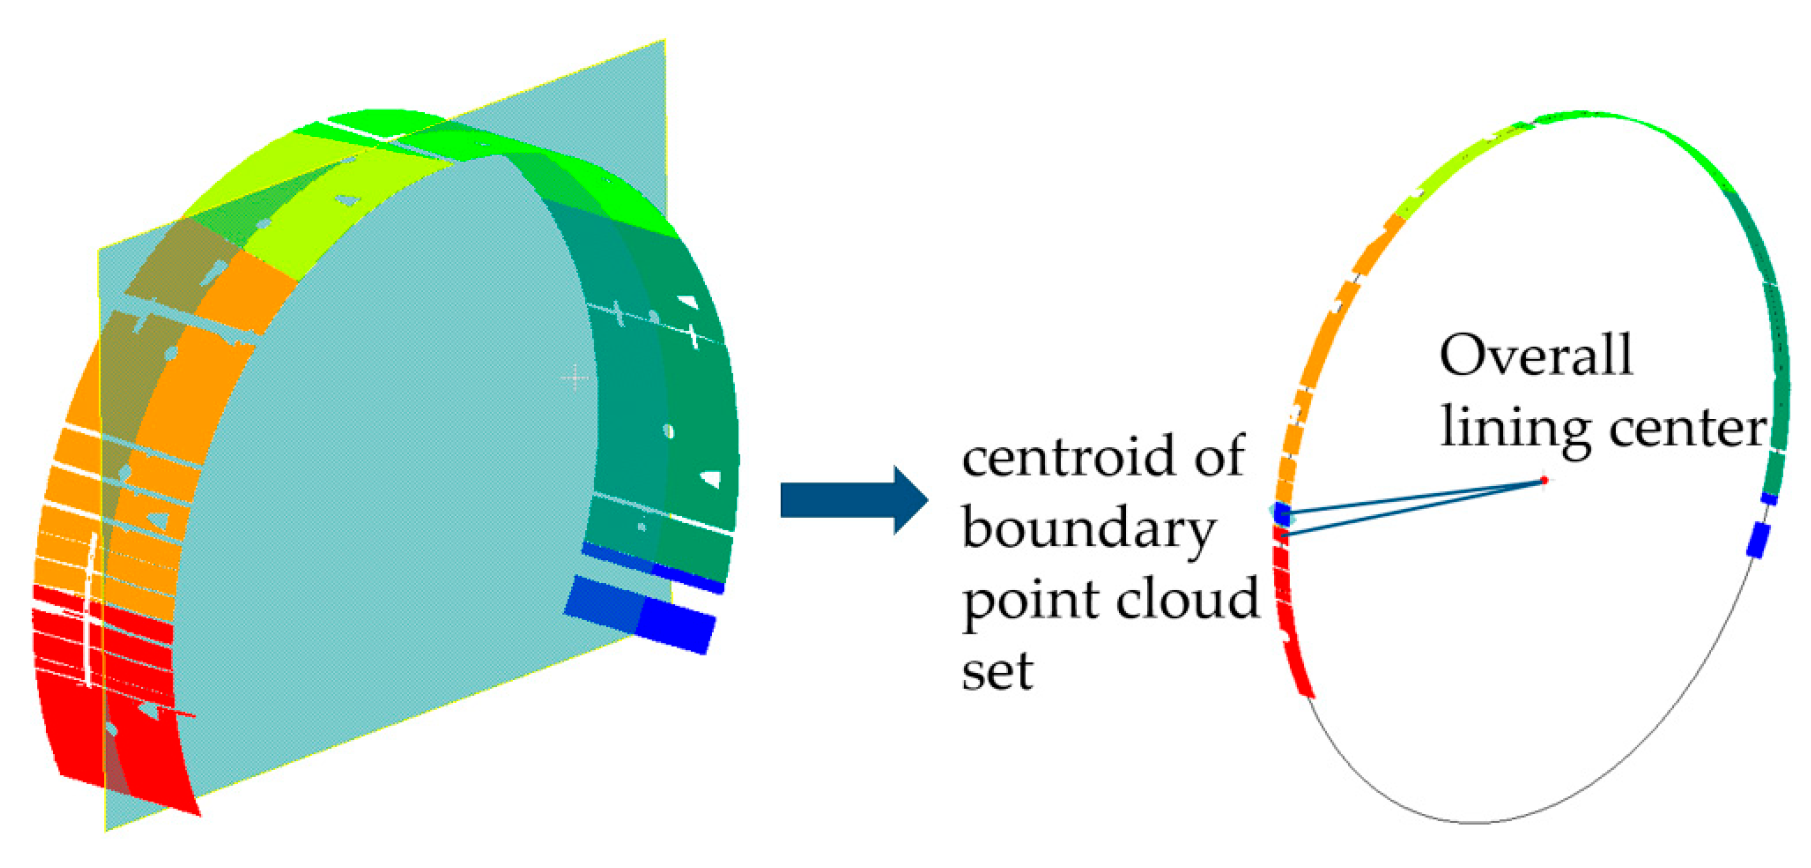
For tunnel structure deformation analysis, using B-spline curves or direct circular fitting often results in excessive errors and operational challenges. This study proposes an approach based on the geometric information of the tunnel to extract the point cloud set of each tunnel lining boundary point. The distance between the centroid of the point cloud set and the overall circle center is calculated. The misalignment of the tunnel is determined by analyzing the difference in distances between boundary points. The specific steps are illustrated in
Figure 13.
3. Engineering Application
The data used in this study were obtained from a GRP5000 laser scanning survey conducted in a subway tunnel in Hangzhou. The GRP5000 is a mobile tunnel laser scanning system developed by Amberg Technologies, a company based in Regensdorf, Switzerland. This system is primarily used for acceptance inspections of newly completed tunnels, geometric shape assessments during tunnel operation, detection and diagnosis of structural defects in existing tunnels, as well as digital management and documentation. A portion of the point cloud data acquired from the scan is shown in
Figure 14.
The main hardware components of the GRP5000 system include the following:
Track measurement trolley, used for measuring parameters such as mileage, track gauge, height and superelevation.
The Profiler 6012 high-speed laser scanner operates at a scanning rotation frequency of 200 Hz, with a sampling rate of 1 million points per second and an image resolution of 3 mm. For local measurements and short-range scanning, the system’s dynamic measurement accuracy can reach ±0.5 mm. However, the manufacturer specifies a contour accuracy of ±5 mm and a target point accuracy of ±2–4 cm, which takes into account larger-scale measurements and environmental factors encountered during field operations, such as vibration and temperature fluctuations.
The laser scanner performs full-section, high-density measurement of the tunnel using a helical scanning method. The data acquisition software analyzes the intensity of the emitted and received laser signals in real time, thereby obtaining both the image and point cloud data of the tunnel lining’s inner surface. Based on these data, further analysis and evaluation can be carried out to assess the structural condition, distribution of defects, clearance dimensions, deformation characteristics, and convergence of the tunnel. Considering the special resolution requirements of this experiment, the point cloud density during scanning must be maintained at no less than 50,000 points per square meter. This requires either reducing the scanning speed under standard mode or switching to a higher-frequency scanning mode.
3.1. Engineering Data Processing
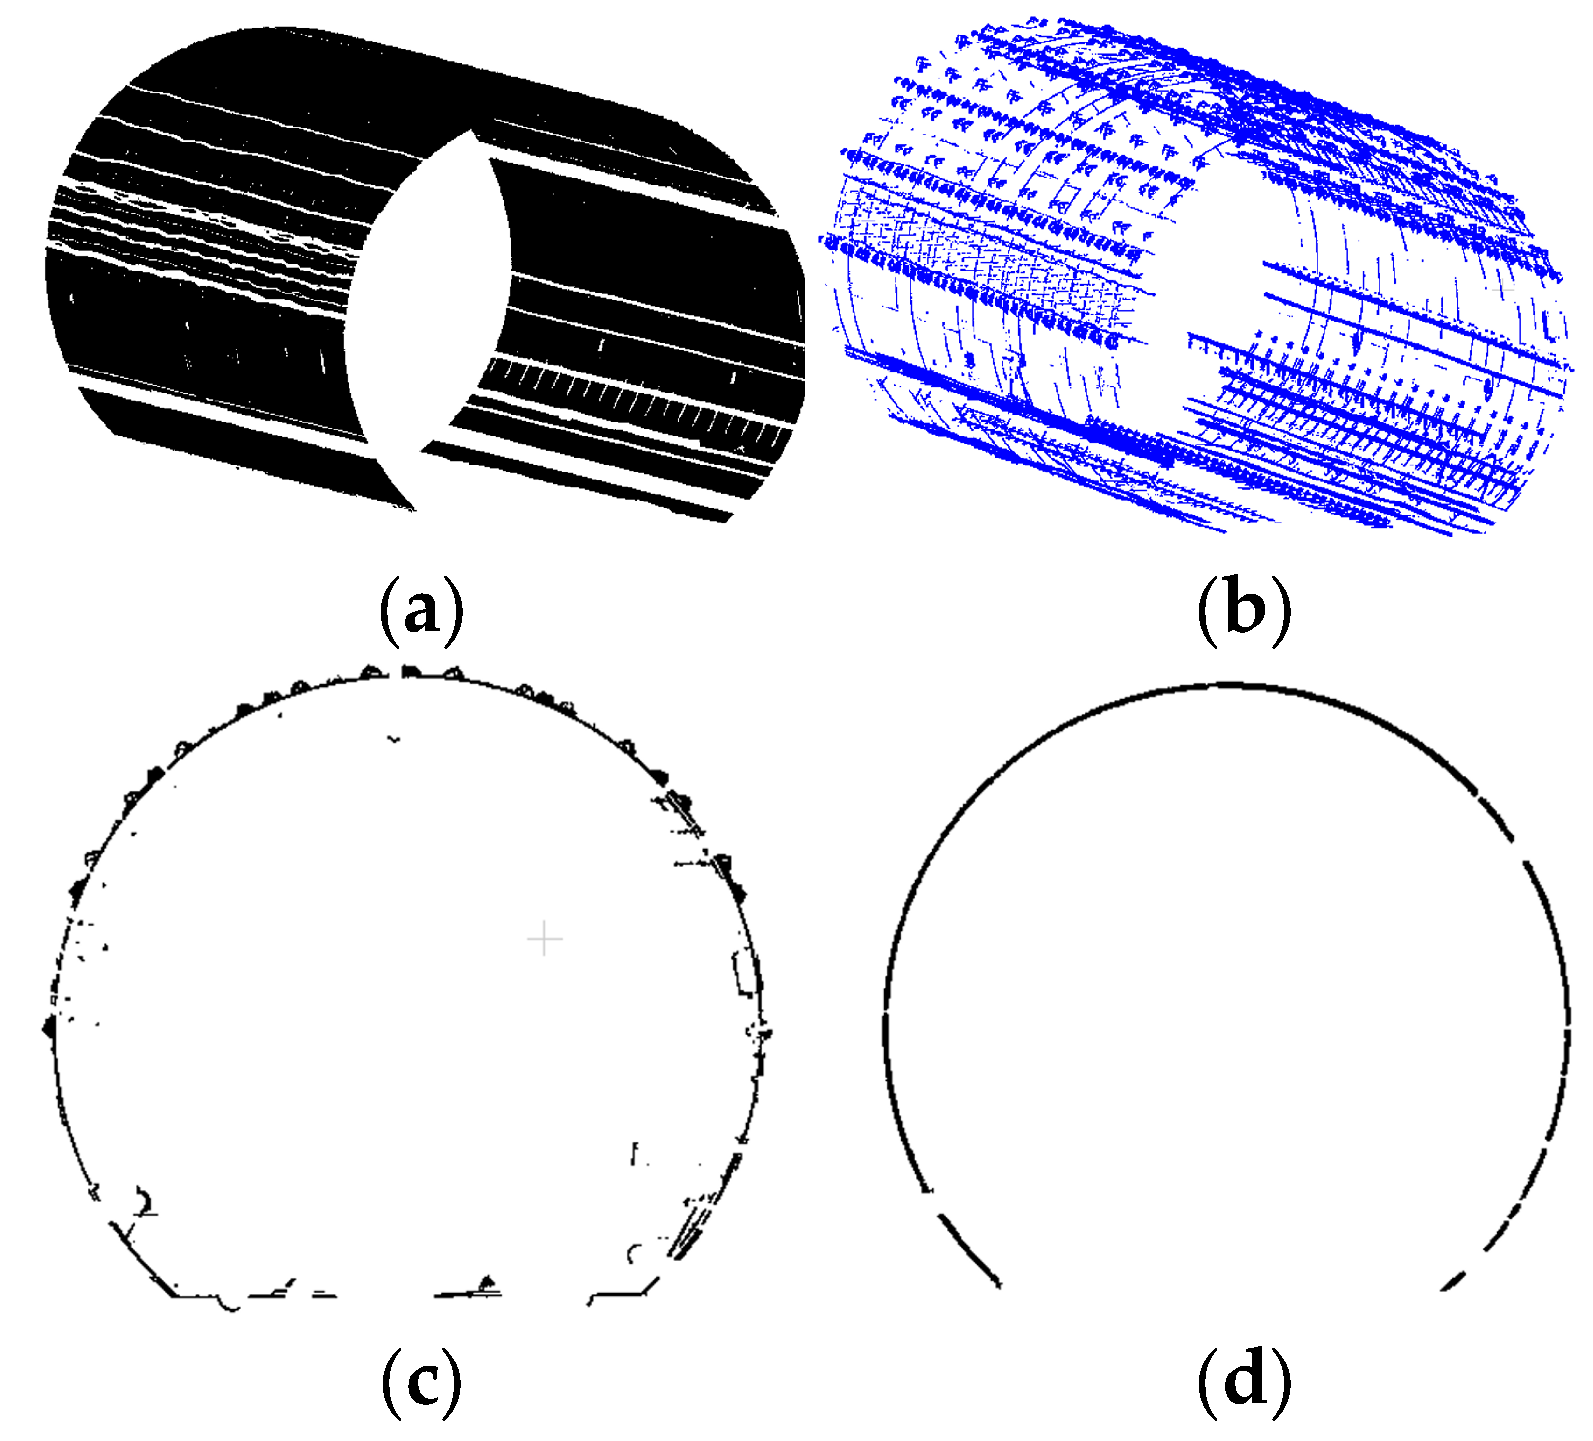
The tunnel arch point cloud is extracted using the arch point cloud extraction method, and the GuSAC algorithm is applied to denoising the point cloud data. After denoising, the tunnel lining and impurity point clouds are effectively distinguished, as shown in
Figure 15. In the figure, it can be observed that the denoised tunnel cross-section presents a regular circular shape, with most impurity point clouds removed. The experiment shows that, under the operation based on the segmented centerline, the GuSAC algorithm achieves an average denoising rate of over 95%, with the denoising process being both efficient and reliable.
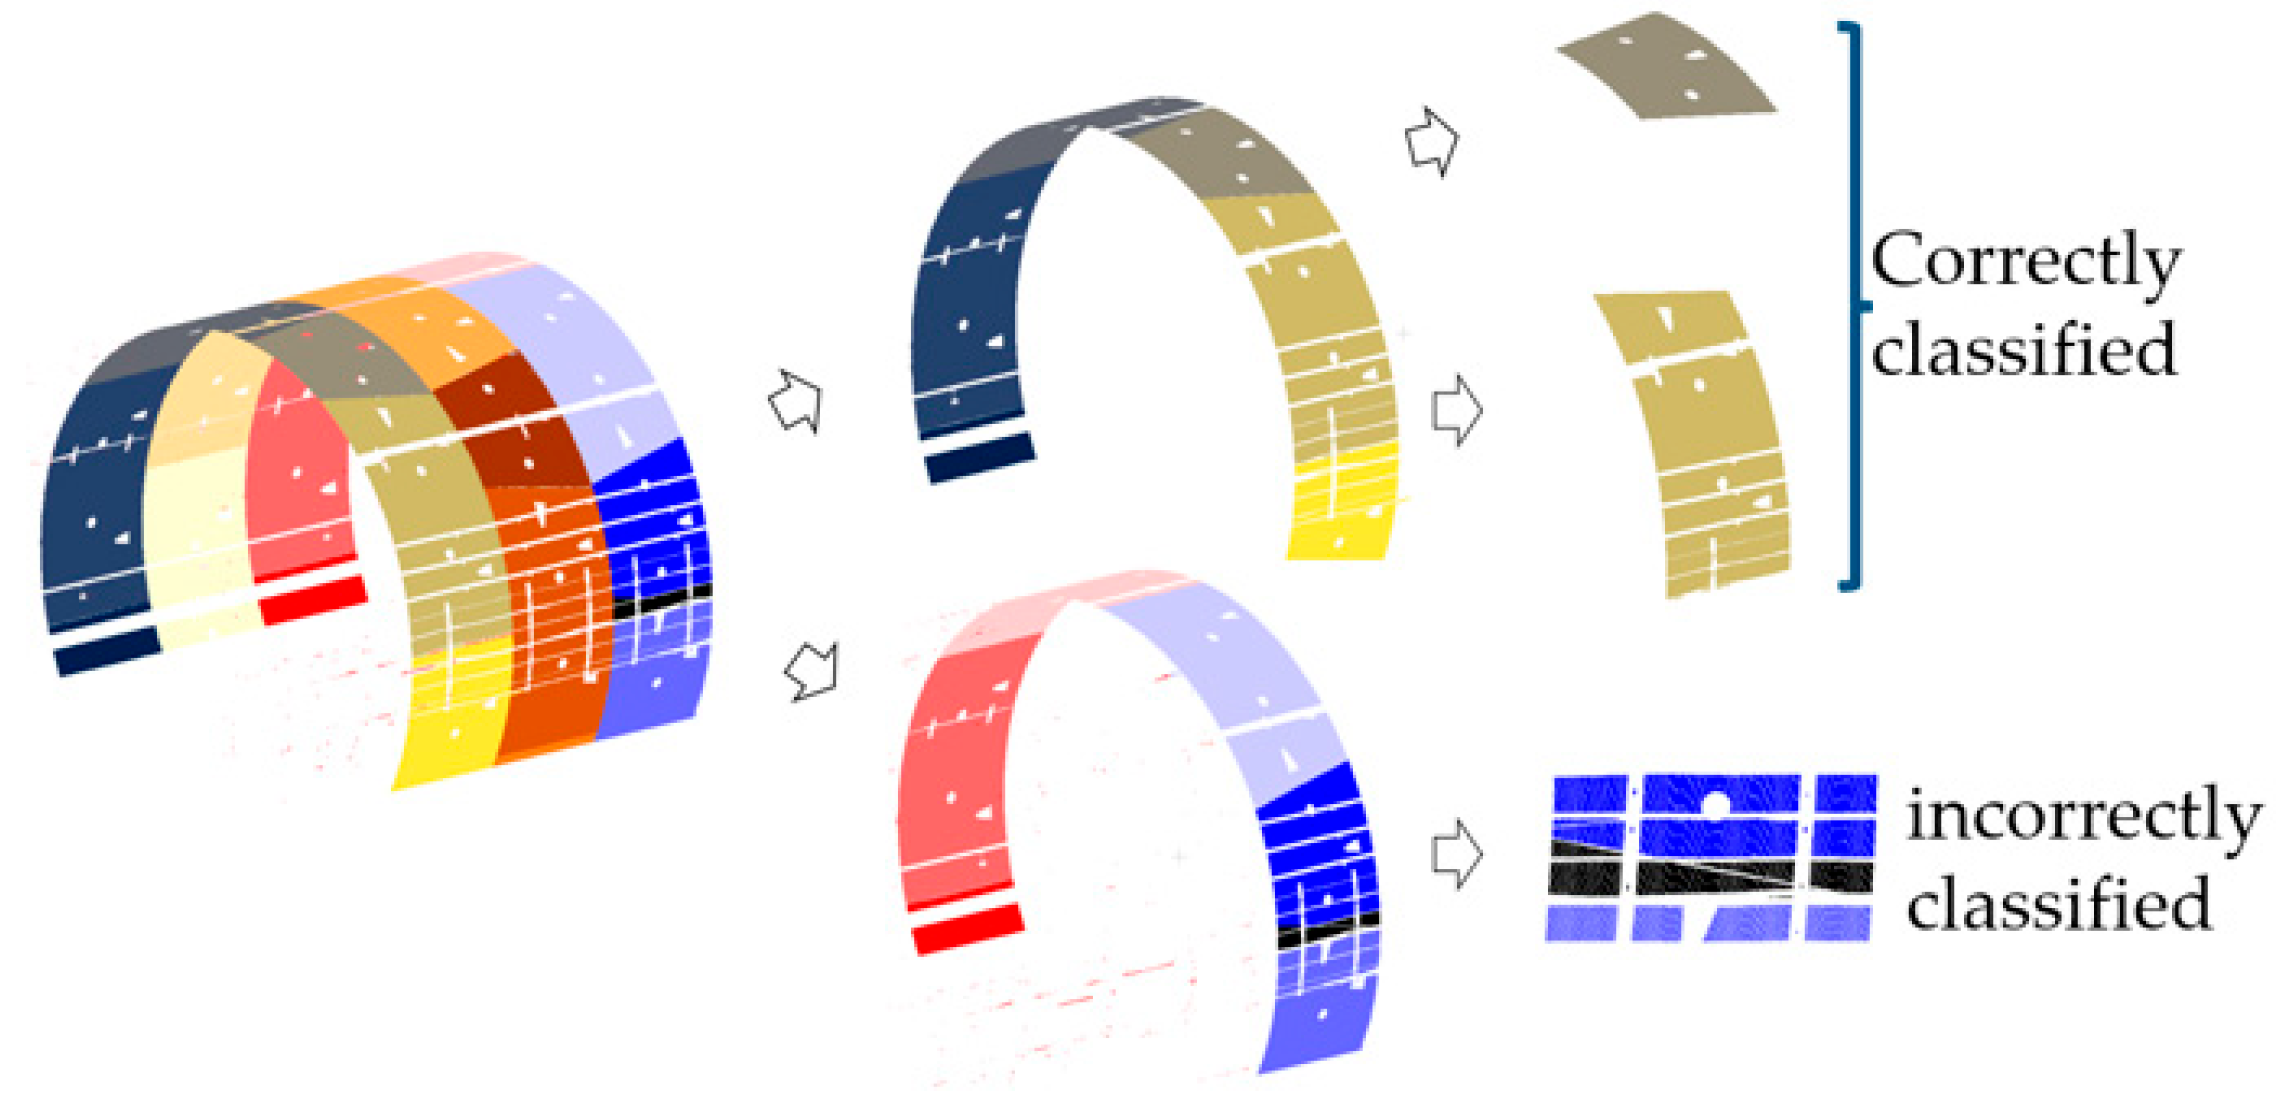
After denoising, the TMatch algorithm is applied to classify the tunnel point clouds into circumferential and inter-ring lining categories. The classification results indicate that the algorithm can accurately identify and segment the tunnel lining point clouds. By extracting the labels, it precisely divides the corresponding lining blocks. In the experiment, for a single ring, with an average of 1,965,348 points cloud data, 1,912,681 points were correctly classified, while only 1796 points remained unclassified on average. The number of misclassified points ranged from 50,000 to 100,000, and the misclassified point clouds only occurred in areas where the crown segment was located at the edge of the tunnel. The overall classification accuracy exceeded 95%. Unclassified point clouds accounted for less than 1‰ of the total data, having minimal impact on the structural deformation analysis. Additionally, the misclassified point clouds were concentrated in the regions where the tunnel’s crown segment was distributed along the pipeline concentration area. In this region, the tunnel was segmented into multiple small modules, resulting in poorer classification performance. However, the algorithm demonstrated high classification accuracy in areas with regular tunnel lining distribution, especially at the crown segment at the top.
The TMatch algorithm directly segments point cloud coordinates of individual elements, avoiding the complex processes of image detection and registration. Compared to traditional boundary detection algorithms [
27], which first segment images and then align and segment the corresponding point clouds, the TMatch algorithm achieves lower losses and errors while significantly improving the accuracy and efficiency of tunnel point cloud classification. The specific visualization is shown in
Figure 16.
In this study, the accuracy of tunnel lining segmentation results is quantified by calculating the F1 Score and Intersection over Union (IoU). The F1 Score, as the harmonic mean of precision and recall, provides a comprehensive evaluation of segmentation performance. Precision reflects the proportion of correctly predicted tunnel lining points among all predicted lining points, while recall measures the proportion of correctly identified lining points among all actual tunnel lining points. IoU is used to assess the overlap between the predicted region and the ground truth region. These metrics collectively contribute to a comprehensive evaluation of the algorithm’s performance in tunnel lining segmentation.
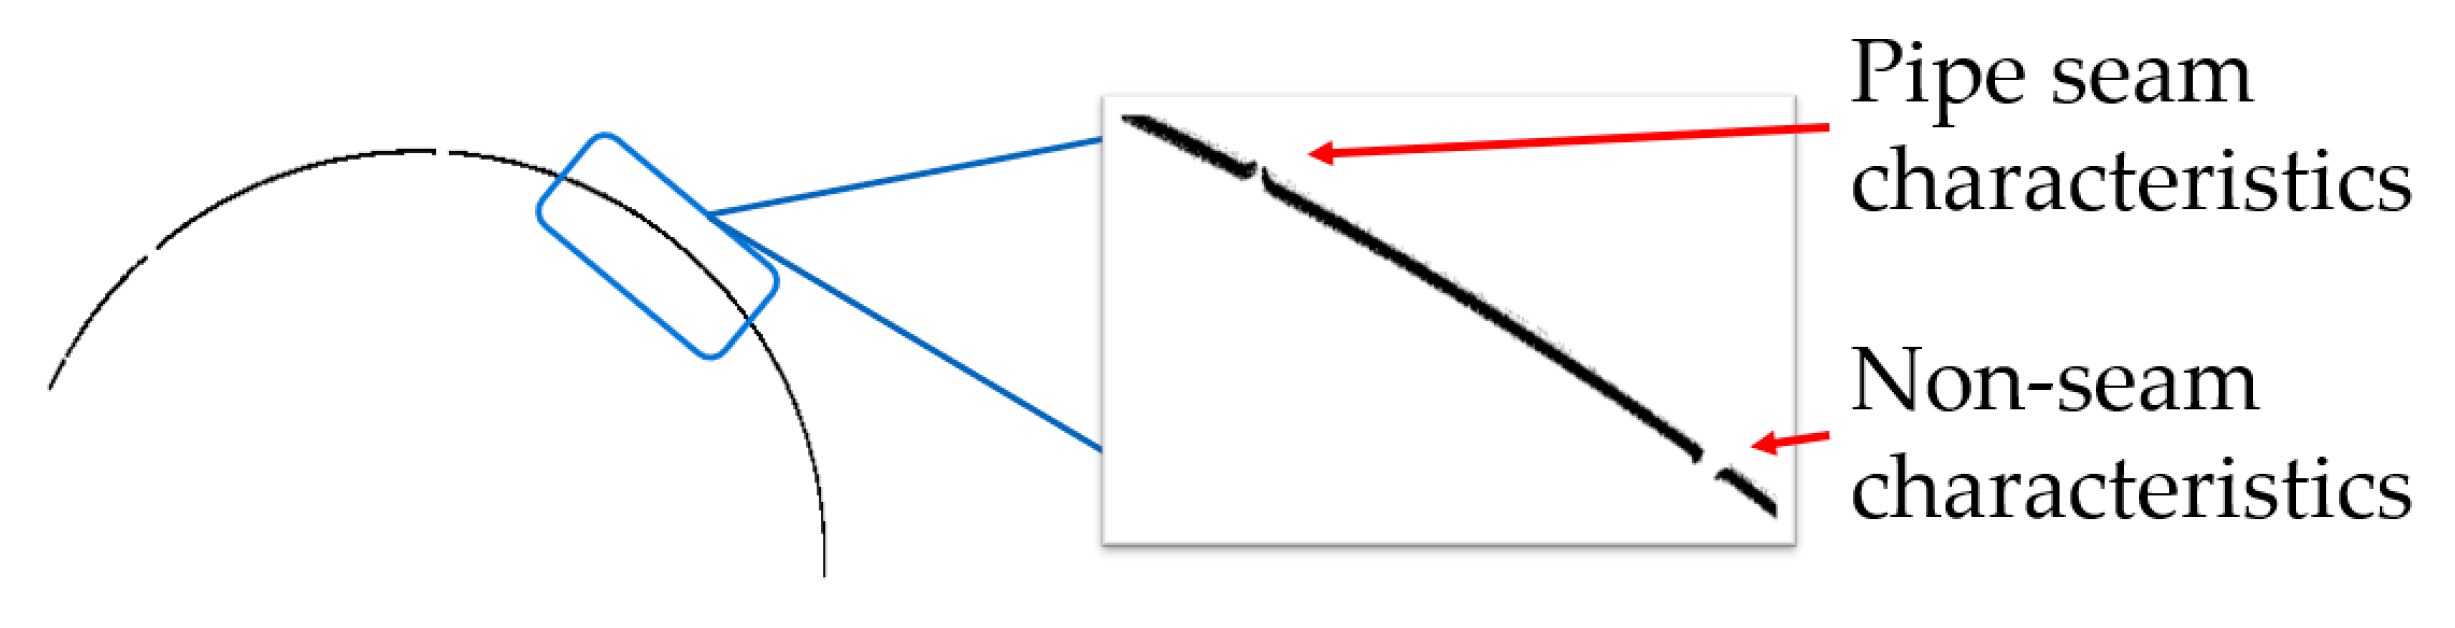
However, due to the lack of standardized segmented point cloud data, this study manually created standard data using CloudCompare software based on the results output by the GuSAC algorithm. The segmentation criteria for tunnel lining were primarily based on joint features. Since tunnel pipelines may introduce multiple erroneous boundary features during segmentation, as shown in
Figure 17, we manually determined the positions of tunnel joints in the original structure and adjusted the segmentation to reduce errors and ensure more accurate results.
By applying this method, the study effectively minimizes errors caused by tunnel structural irregularities or pipeline interference, thereby improving the accuracy of manual segmentation. A random sampling of 10 tunnel rings was conducted for verification, and the average values of tunnel segmentation statistical indicators are presented in
Table 1.
3.2. Analysis of Tunnel Convergence Deformation and Misalignment Deformation
Traditional methods for analyzing tunnel convergence deformation often use the designed axis normal vector plane to extract tunnel cross-sections of a specific thickness. However, the ring-based plane extraction technique proposed in this study can directly extract cross-sections based on the point cloud data of each tunnel ring, enabling precise extraction of tunnel segments and thickness. This method is also applicable to curved tunnels. The specific results are shown in
Figure 18.
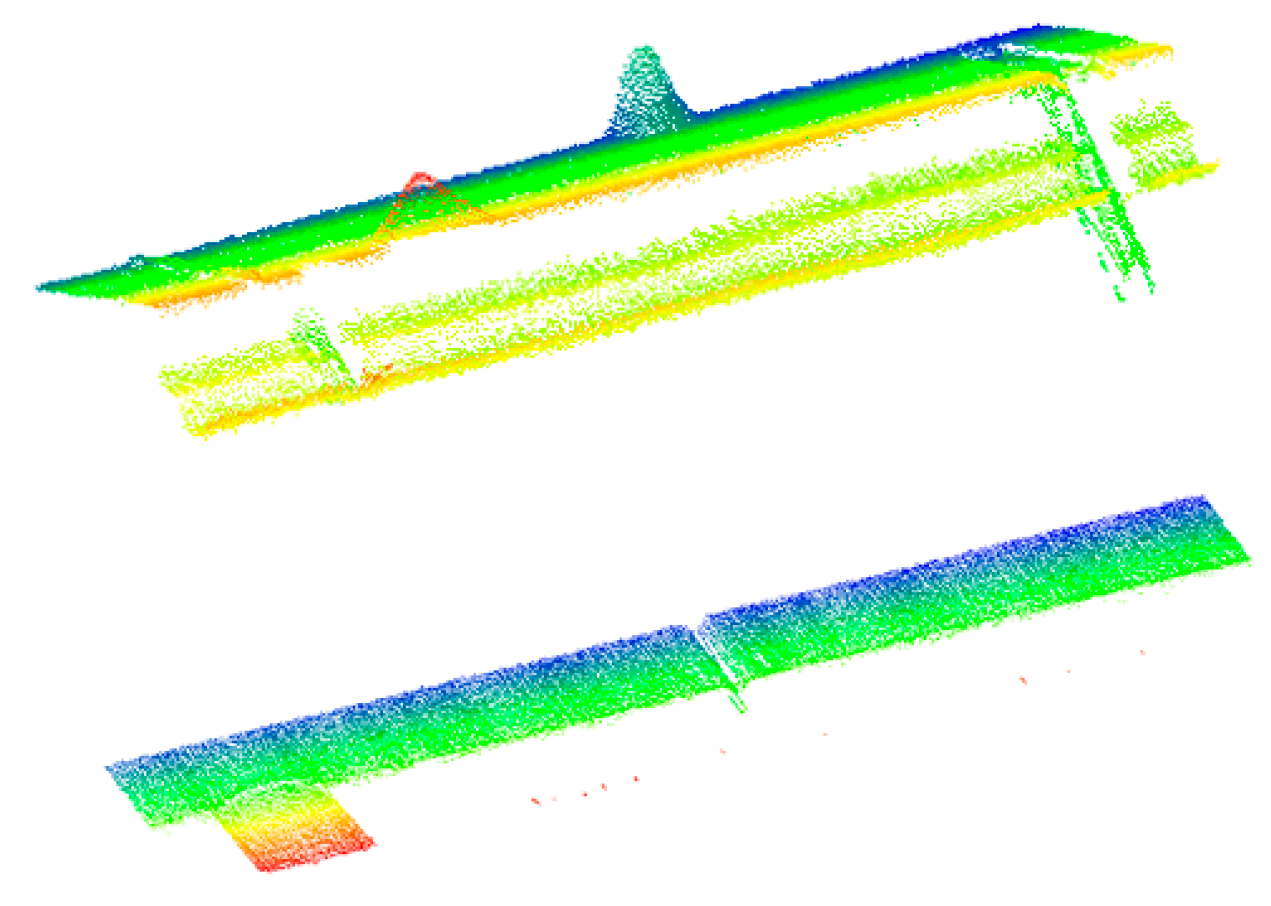
Under the processing of the TMatch algorithm, the single-ring point cloud data of the tunnel are accurately extracted, while non-tunnel structural point clouds are removed, preserving the structural features of the single-ring tunnel. Subsequently, SVD fitting technology is applied to fit each ring, enabling central plane fitting based on the single-ring tunnel lining.
By calculating the distance from each point in the point cloud to the fitted plane, we can extract the tunnel center cross-section point cloud for each ring, as shown in
Figure 19. The extracted point cloud data are precisely positioned at the center of each ring, and through plane adjustments, the relative position of the cross-section extraction within a single ring is optimized. This process enhances the accuracy of tunnel intelligent management, meeting the requirements for high-precision detection and monitoring.
Based on the extracted point cloud data, the structural deformation and misalignment of the tunnel ring segments were analyzed. For horizontal convergence deformation of the tunnel, least squares ellipse fitting was applied to compare the horizontal tunnel lining with the horizontal standard values provided by the detection system. The specific results are shown in
Table 2.
As shown in the table, the tunnel cross-sections extracted using the method presented in this paper, after being fitted with the above-mentioned fitting technology, have a maximum error of 1.4 mm, a minimum error of 0.2 mm, and an average error far less than 1 mm when compared to the standard data provided by the detection system. This demonstrates millimeter-level accuracy, validating the efficiency and reliability of the method in cross-section extraction.
The standard data used in this paper were obtained through field measurements, using the Leica TM60 total station, Leica, Wetzlar, Germany (angular accuracy of 0.5 arcseconds, distance accuracy of 0.6 mm + 1 ppm) and the associated tunnel cross-section measurement software (SimpleSection_362871_V8.1). The post-processing of the data was conducted using Leica TunnelMonitor software (
https://leica-camera.com/en-int). The measurement method employed the “proximal point search method” for standard data detection. Specifically, field measurements were taken at the center of each tunnel ring segment to avoid obstructions such as bolt holes and pipe supports. The measurement process was carefully calibrated and repeated to ensure accuracy. The final measurement results were compared with the total station standard to ensure data accuracy.
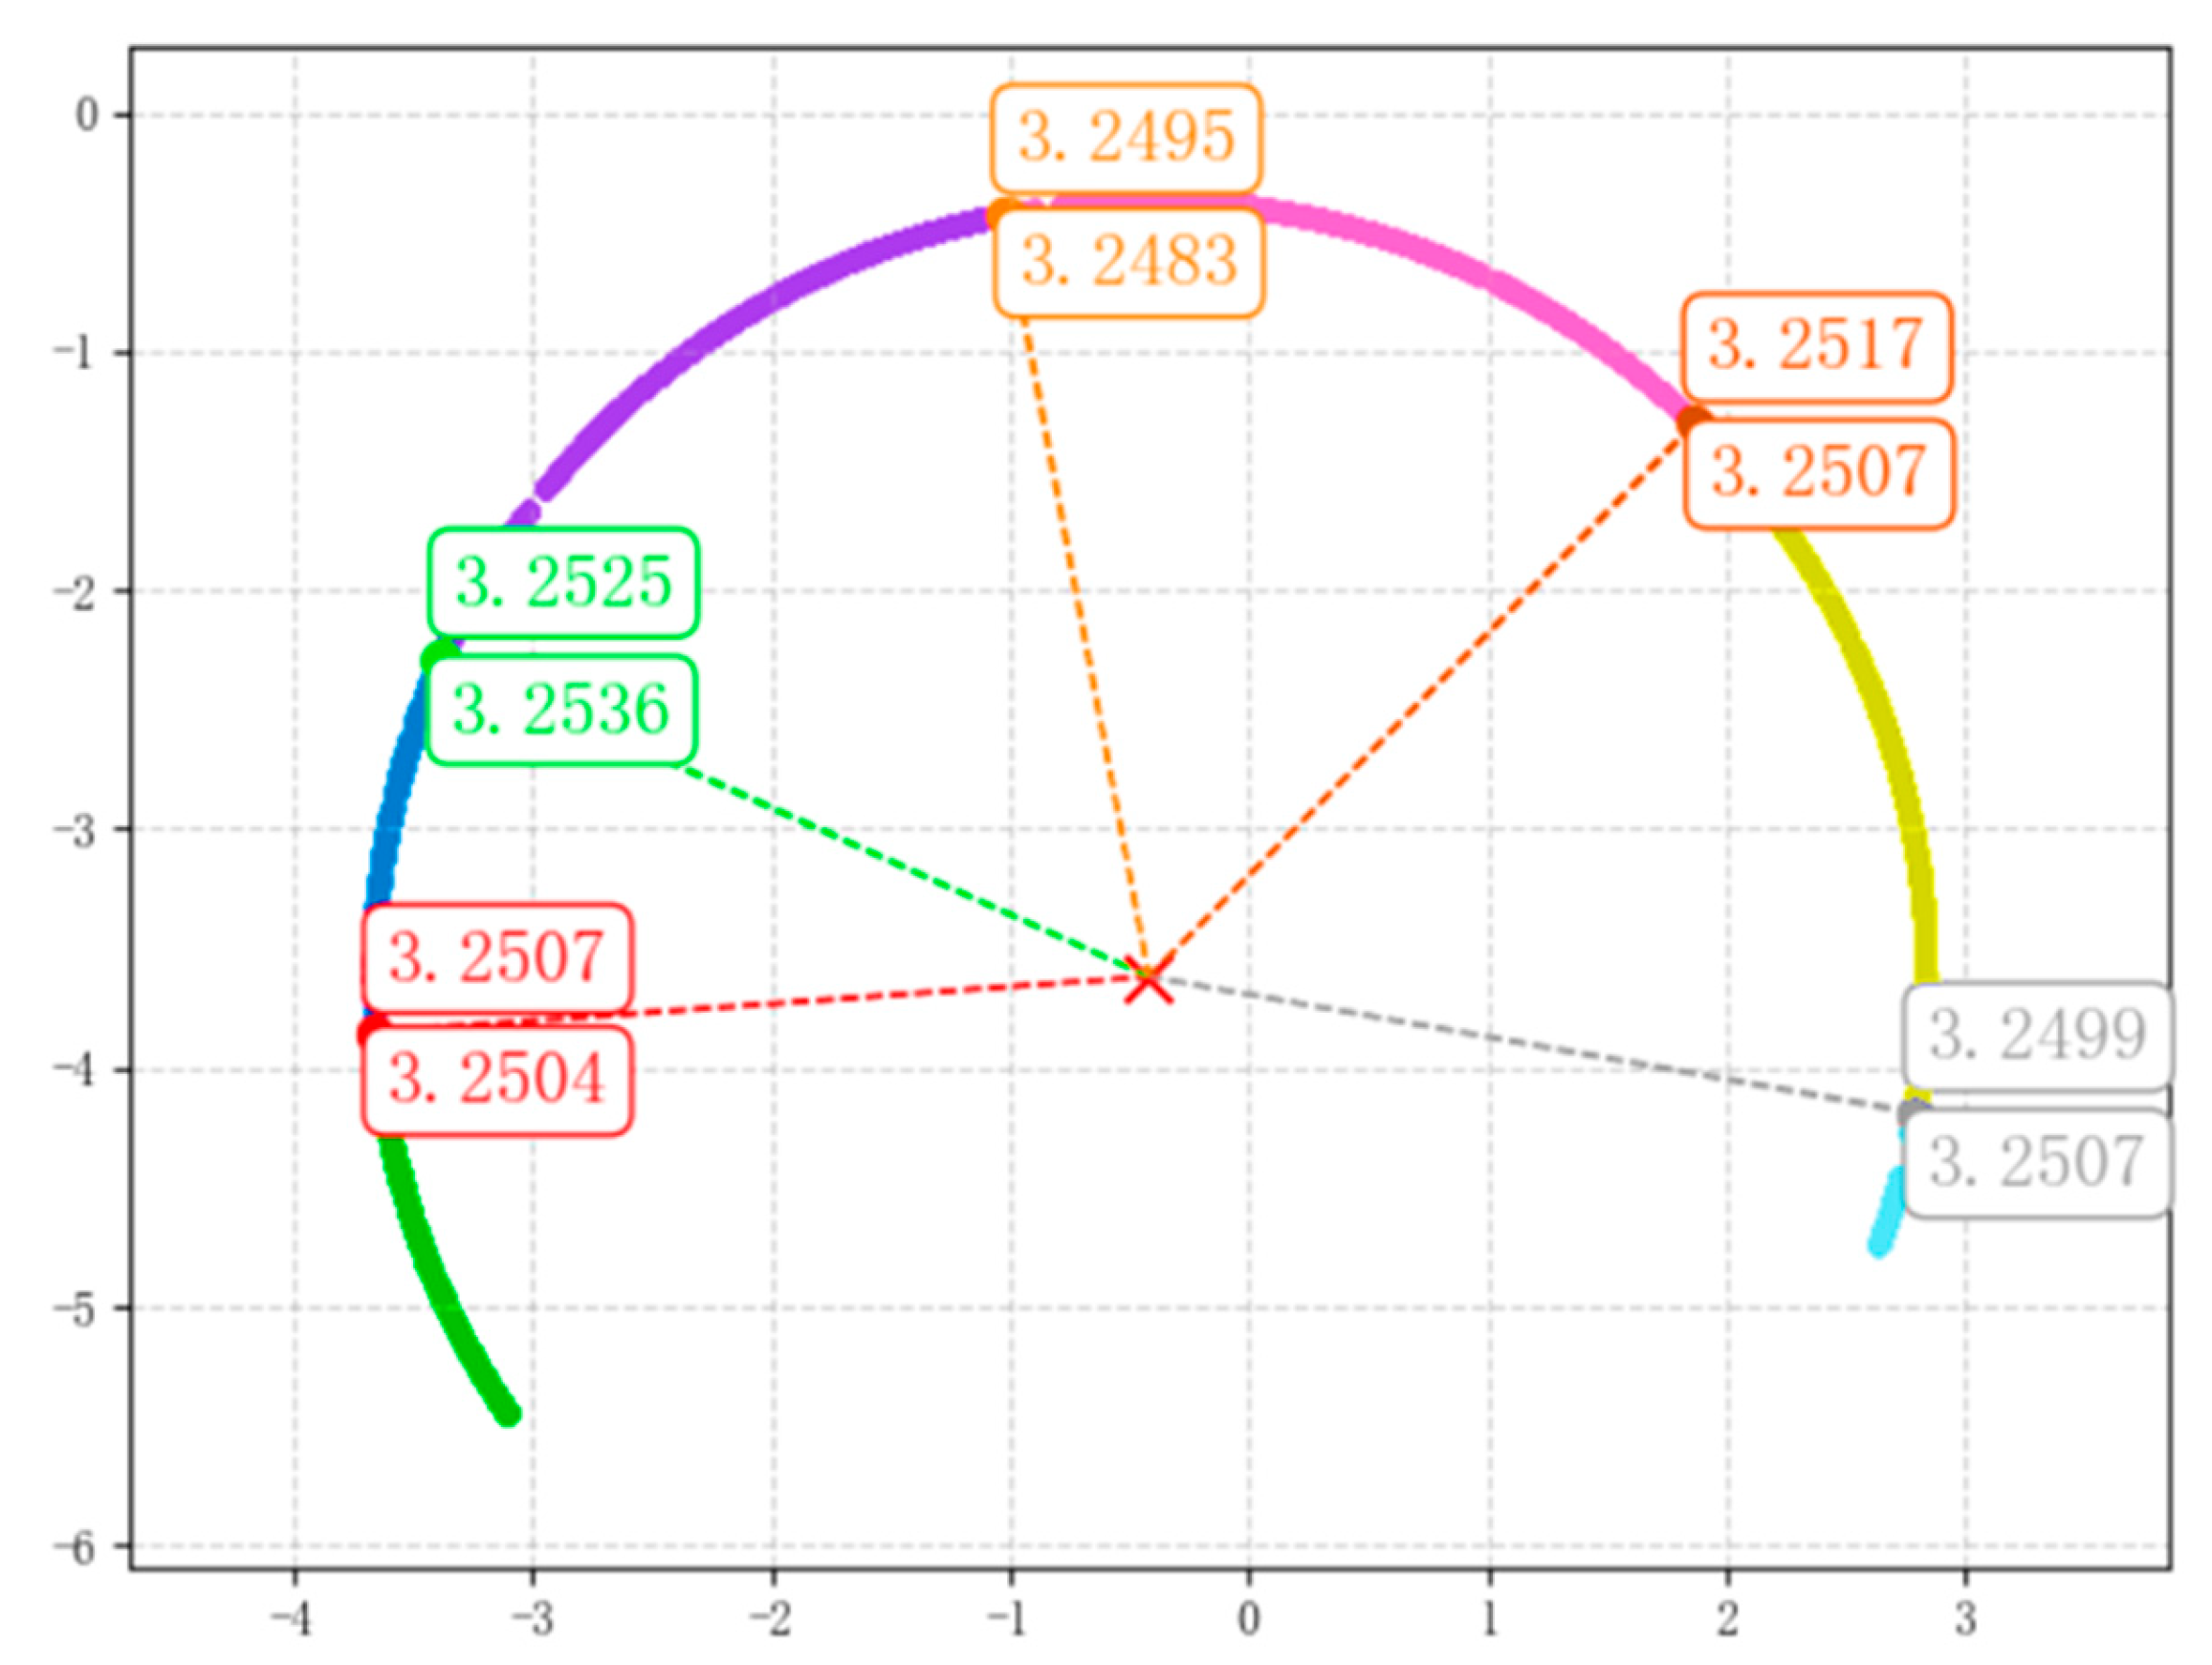
Based on the segmentation results of a specific ring tunnel, further misalignment analysis can be performed. By extracting the boundary point cloud data of each lining segment after segmentation, and calculating the deviation between the centroid and the overall or theoretical design radius, the full-scale deformation of the tunnel cross-section can be obtained. The specific results of the misalignment analysis are shown in the figure below.
4. Discussion
The tunnel point cloud structural disease detection technology based on mobile three-dimensional laser scanning equipment proposed in this study effectively enhances the intelligence and automation level of tunnel inspection. The algorithm relies solely on point cloud coordinate data, successfully extracting structural information from tunnels and performing comprehensive deformation detection, yielding good results on engineering data.
However, both the TMatch technology and ring plane fitting technology depend on the GuSAC algorithm to remove non-structural point clouds from the tunnel. This chapter analyzes the ability of the GuSAC algorithm to remove non-tunnel structural point clouds from local planes, further demonstrating the feasibility of the proposed method.
To validate the reliability of the proposed method, we compared the performance of the Least Squares Method, RANSAC, surface fitting, and GuSAC in tunnel structural point cloud recognition. We quantified their extraction capabilities in local regions using Chamfer Distance (CD) and RMSE. CD is a distance metric that measures the difference between the object edges in the point cloud and the predefined model. Considering that slight deformations may occur during tunnel operation, directly using the design axis as a reference might introduce errors, while removing non-tunnel structural point clouds could lead to human errors. Therefore, we manually removed non-tunnel structural point clouds from predefined local point clouds, established a standard dataset, and compared it with the algorithm output to assess the performance of GuSAC.
In this paper, 10 local point clouds are extracted from the tunnel, and the average values of statistical indicators are calculated. The local point clouds are divided into Regular Local and Irregular Local categories, with some local point clouds shown in
Figure 20. Since the tunnel point cloud data have been normalized during the calculation, the statistical indicators serve only as relative references, without measurement units. Detailed statistical results are presented in
Table 3.
From the statistical indicators, in Regular Local, all four algorithms demonstrate good capability in removing non-tunnel structural point clouds, with CD values (center offset errors) and RMSE (Root Mean Square Error) being relatively small. This indicates that they can effectively fit the tunnel lining plane, and the overall error is well controlled. However, in Irregular Local, only RANSAC and GuSAC are able to accurately identify the tunnel structural point cloud plane, while the CD values and RMSE errors of the Least Squares Method and surface fitting methods significantly increase. This suggests that these two methods experience larger errors in the processing of complex structures and fail to effectively remove non-structural point clouds.
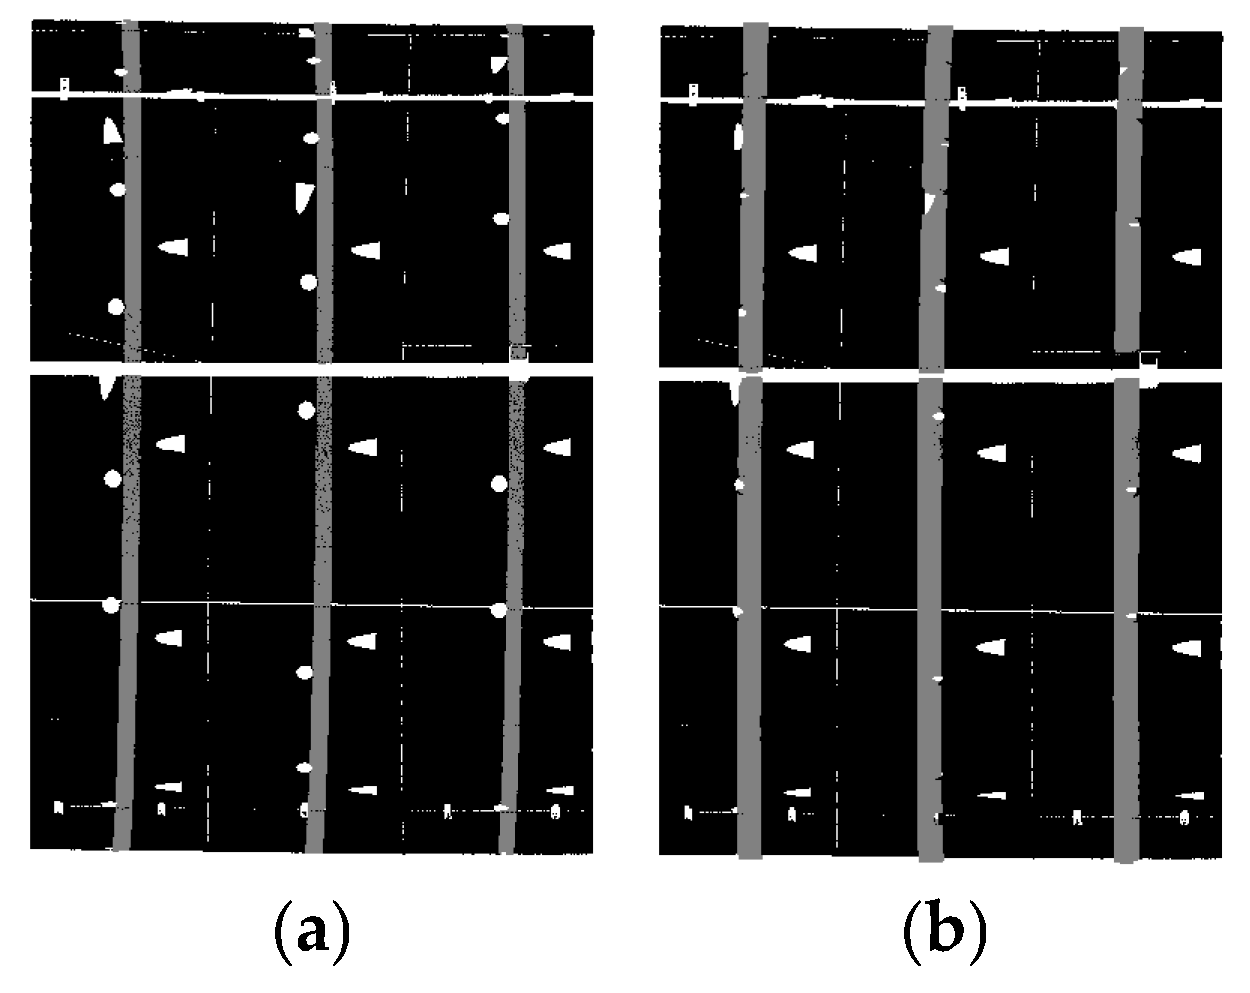
The higher metric values of GuSAC compared to RANSAC may stem from errors in the manually created standard data. It is evident that using only statistical indicators to evaluate the actual removal capability of segmentation algorithms has certain limitations, as numerical metrics cannot fully reflect the true geometric features and spatial distribution of the point clouds. Therefore, this study further incorporates visual analysis to visually assess the algorithm’s ability to retain tunnel structural point clouds and remove non-structural point clouds by comparing the point cloud distribution after processing. The specific results can be seen in
Figure 21.
Due to the significant impact of noise points on the Least Squares Method and surface fitting for surface recognition, these methods are highly susceptible to disturbances from irregular point clouds, resulting in poor visualization quality. Therefore, they are not included in the visualization comparison. The RANSAC algorithm can remove non-tunnel structural point clouds within the tunnel by identifying inliers; however, it requires continuous adjustment of the distance threshold, reducing the level of automation. Additionally, some discrete point clouds introduced by measurement equipment errors may still remain between the tunnel lining. In contrast, the GuSAC algorithm, which integrates normal vector computation with RANSAC, can more accurately identify and remove tunnel joint features while also eliminating some discrete points scattered within the tunnel structural point cloud. This improvement is achieved because GuSAC constrains the number of neighboring points during normal vector estimation, preventing isolated discrete points from obtaining stable normal vectors. As a result, these points are identified as non-structural points and removed. This processing effectively optimizes the boundary conditions of the tunnel structural point cloud, significantly enhancing the segmentation accuracy and generalization capability of the TMatch algorithm.
After completing the preprocessing with the GuSAC algorithm, TMatch utilizes SVD to identify single-ring tunnel point clouds and combines it with GMM for initial ring segmentation, enabling high-precision automated tunnel point cloud processing. SVD calculates the covariance matrix of the point cloud data and extracts the eigenvector corresponding to the smallest eigenvalue as the normal vector of the fitted plane. Additionally, the plane position is determined based on the geometric centroid of the point cloud. This method ensures that the fitted plane precisely passes through the center of the tunnel ring, maintaining the geometric accuracy of the single-ring structure. As a probability density estimation algorithm, GMM leverages the periodic distribution characteristics of tunnel point clouds along the ring segments, fitting each ring as an independent Gaussian distribution. The EM algorithm is then applied to optimize the computation of the ring center position and its boundaries, achieving an initial automatic segmentation of the tunnel.
Although GMM exhibits good adaptability in ring segmentation of tunnel point clouds, local noise, uneven density, or acquisition errors in the data may still lead to blurred boundaries or discontinuous segmentation in some ring segments. Therefore, after GMM processing, we introduce an additional regularization procedure to further refine the segmentation results. These regularization operations include geometry-constrained neighborhood analysis to eliminate local errors and enhance the overall segmentation stability. Through this approach, we further improve the segmentation accuracy of tunnel point clouds, ensuring clearer ring boundaries and enhancing the structural integrity of the point cloud data. Ultimately, this method achieves tunnel segmentation with accuracy comparable to image-based approaches without relying on tunnel image information.
Finally, after completing the tunnel lining classification, the ring plane fitting technology utilizes the SVD algorithm to perform cross-section extraction, using the tunnel core area as the center and based on tunnel ring point cloud data. This ensures that the extracted results are perpendicular to the tunnel alignment, avoiding the influence of extraction intervals and design axis accuracy. The method is both fast and accurate. In contrast, traditional design axis extraction methods heavily depend on the precision of the design axis, often resulting in extracted tunnel planes that are not perfectly perpendicular to the tunnel alignment. The cross-section extraction results show that, compared to the standard data provided by the total station, the proposed method achieves smaller errors and outperforms traditional centerline-based extraction methods, providing a more accurate representation of the actual tunnel cross-sectional structure.
Despite the promising performance of the proposed algorithms in tunnel point cloud segmentation, certain challenges remain. For instance, the regularization procedure in the TMatch algorithm relies on a complete tunnel point cloud, and when there are significant data gaps, its segmentation accuracy may degrade substantially. Additionally, the ring plane fitting technology may struggle to accurately extract regular cross-sections when tunnel damage is present, potentially affecting structural analysis reliability.
Future research will focus on optimizing algorithm performance to further enhance the accuracy and robustness of tunnel point cloud processing. On one hand, deep learning models will be explored to improve segmentation accuracy using data-driven approaches, further enhancing the feasibility of fully automated tunnel processing. Additionally, multi-source sensor data fusion will be integrated to strengthen tunnel structure recognition robustness. Computational optimizations for large-scale point cloud data will also be developed to enable efficient real-time processing, ultimately providing more precise and intelligent technical support for tunnel health monitoring and deformation analysis.
5. Conclusions
(1) For the raw point cloud data collected by 3D laser scanning, the proposed GuSAC algorithm can be used to segment and fit the tunnel in long, complex tunnels, achieving overall automatic denoising of the tunnel point cloud. The output data clearly show the boundary features between different lining segments.
(2) For the denoised point cloud processed by GuSAC, the TMatch algorithm, based on clustering algorithms and Gaussian Mixture Models, directly performs inter-ring and intra-ring segmentation of the tunnel. The segmentation accuracy for regular tunnels can reach 95%.
(3) A cross-section extraction method independent of the centerline is designed. By fitting the tunnel’s central plane using SVD-based least squares, the extracted cross-section data have a fixed position, allowing for a more accurate reflection of tunnel deformation.
In summary, the method proposed in this paper is not only theoretically innovative but also demonstrates significant effectiveness in practical applications. It provides a new technological solution for the safety monitoring and maintenance of tunnel structures, which is of great significance in enhancing the automation and intelligence of tunnel engineering. In the future, we will continue to enhance the capabilities of tunnel automation processing by focusing on aspects such as controlling the tunnel point cloud acquisition density, improving curved section segmentation performance, and establishing error analysis standards.

 ,
, 


