
Evaluation of the Performance of Soil-Nailed Walls in Weathered Sandstones Utilizing Instrumental Data


Abstract
1. Introduction
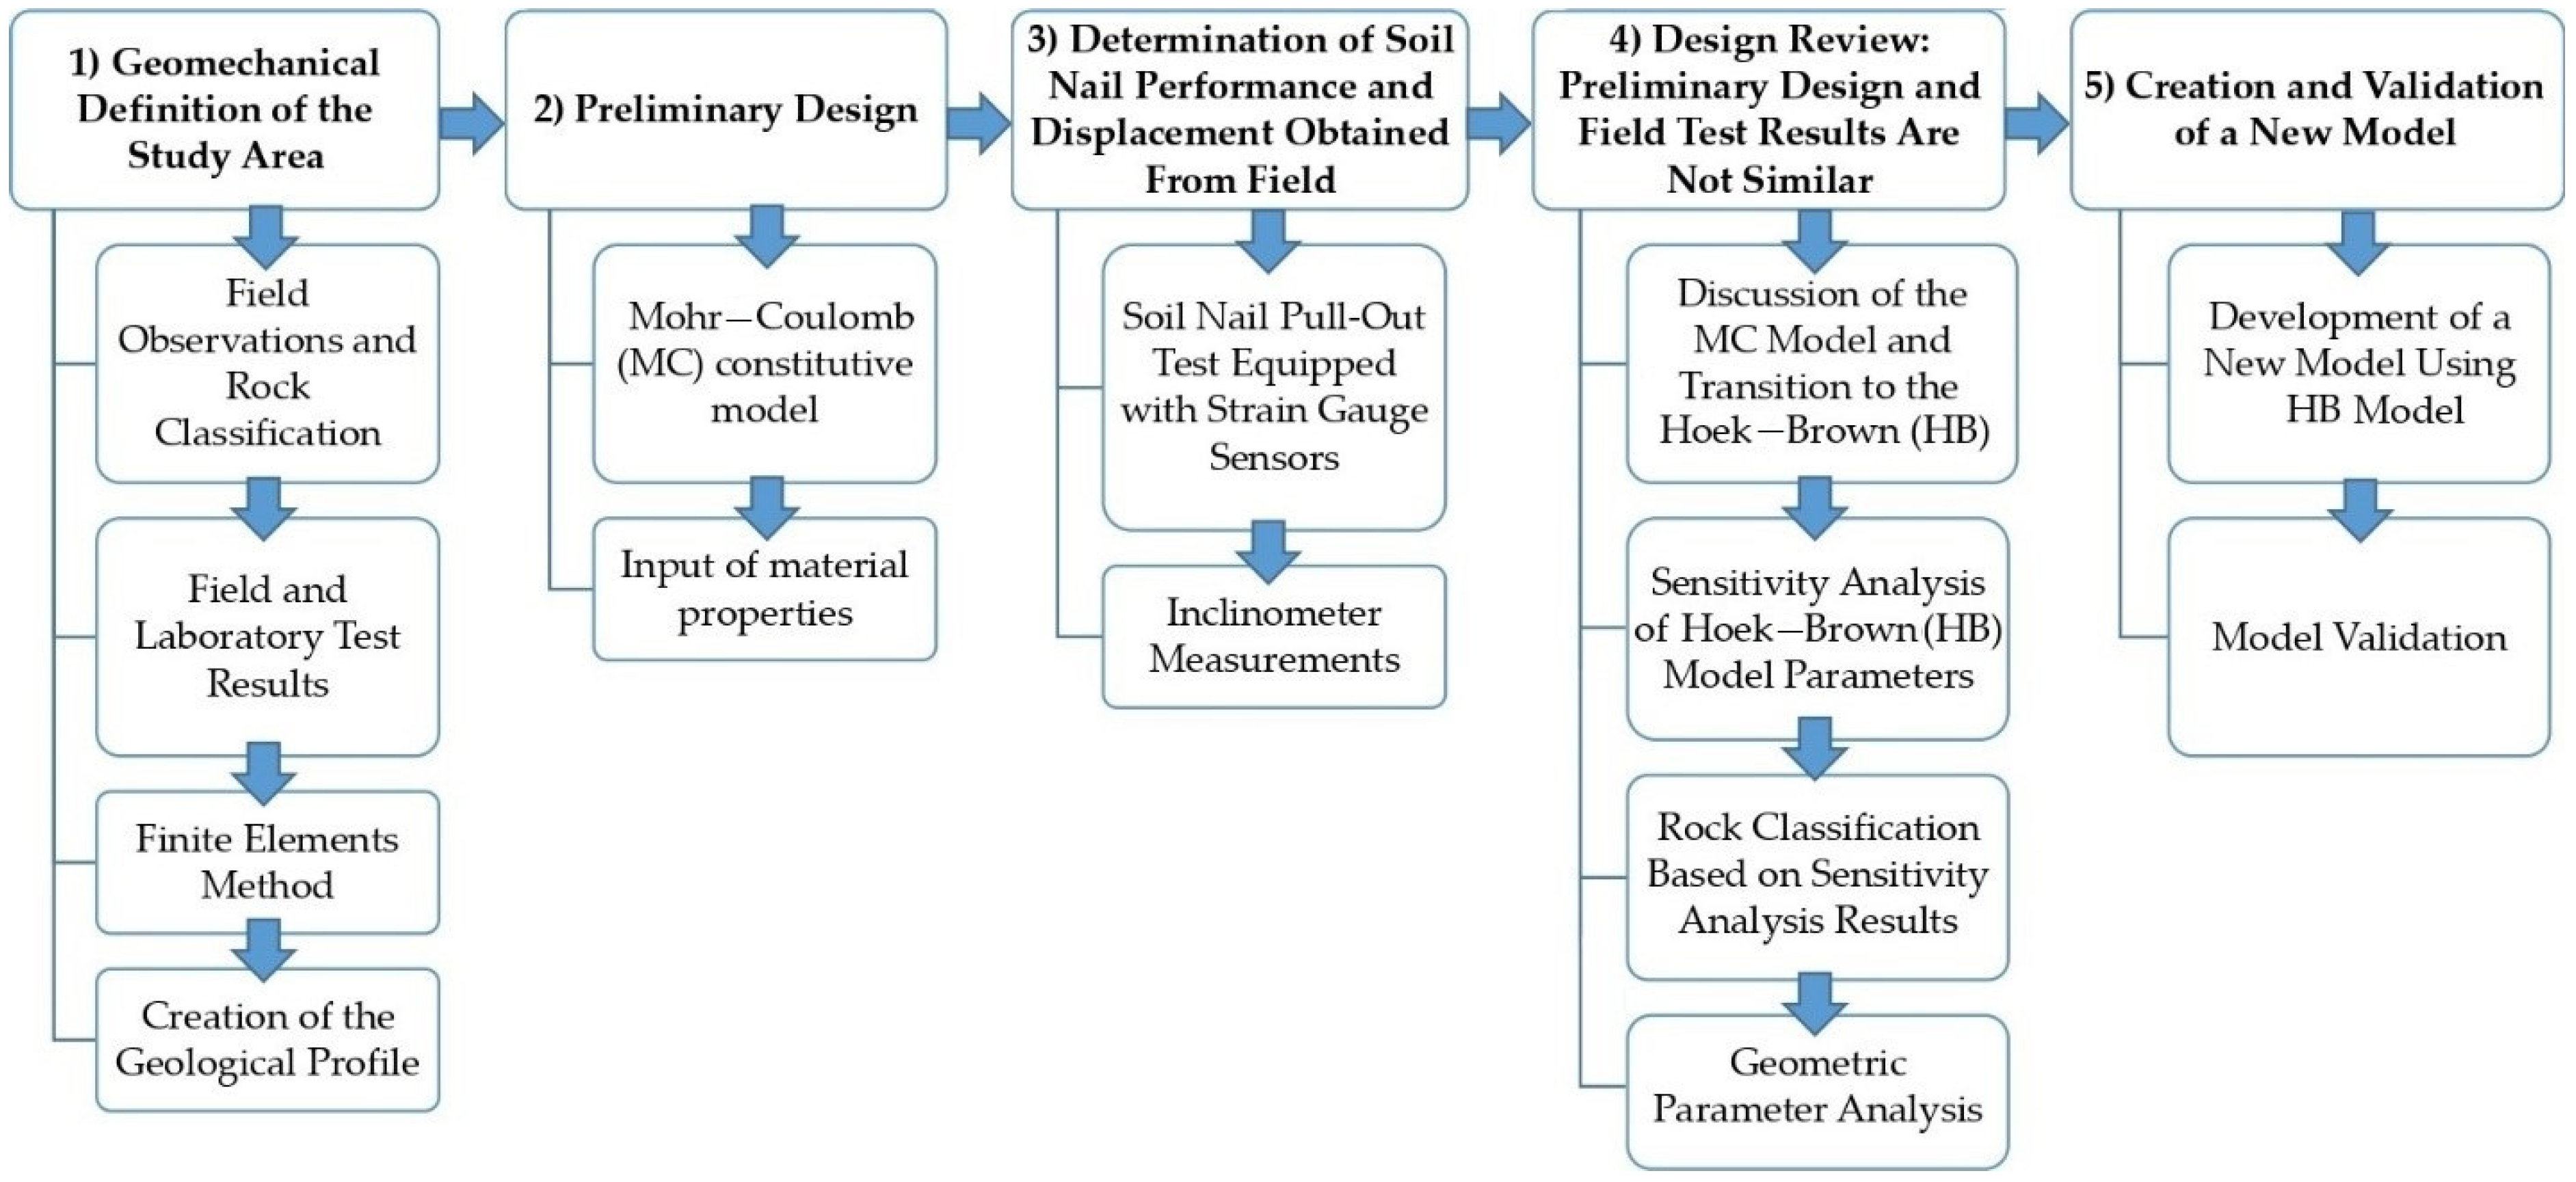
2. Materials and Methods
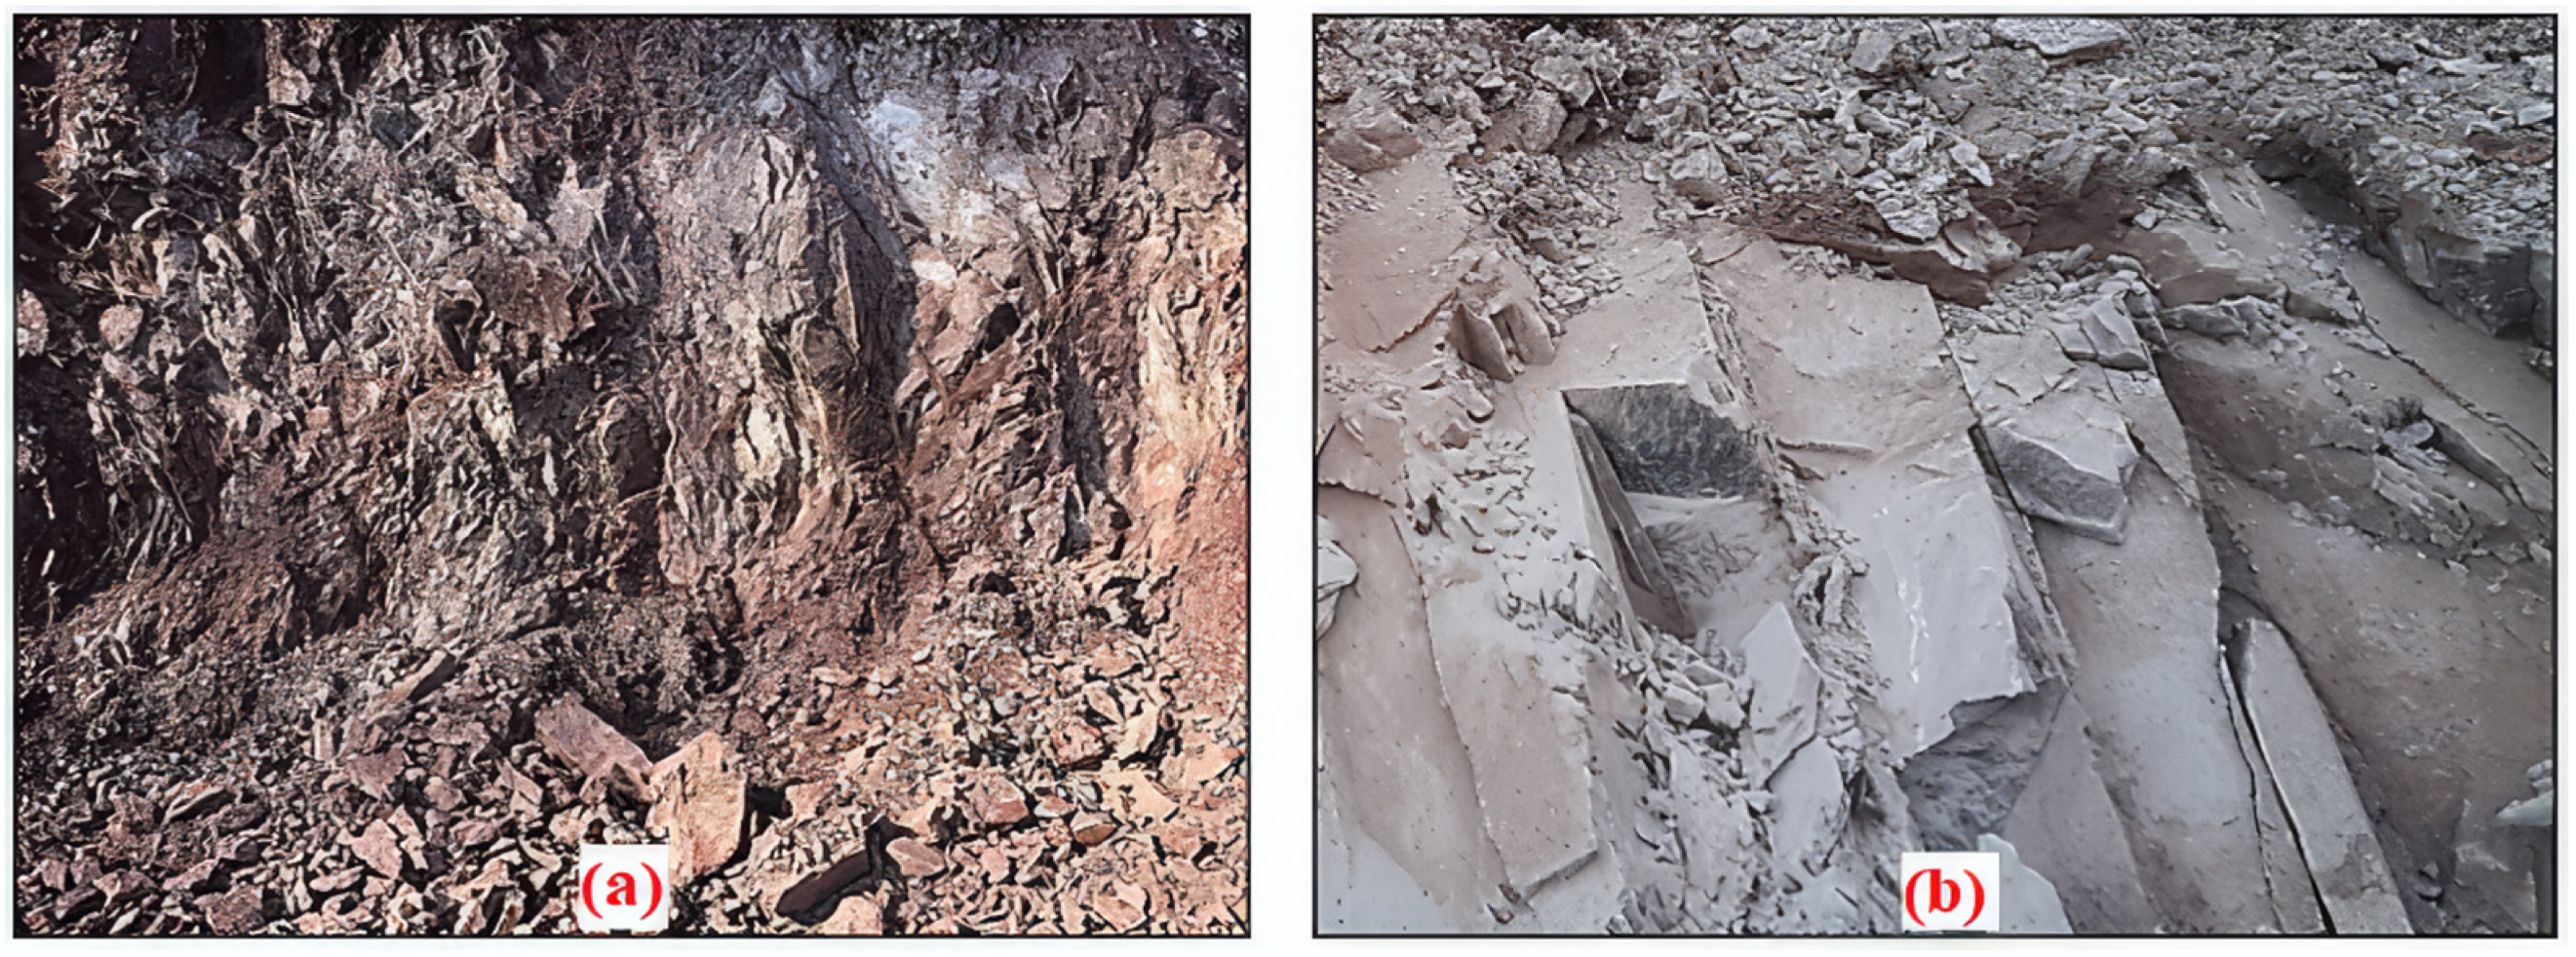
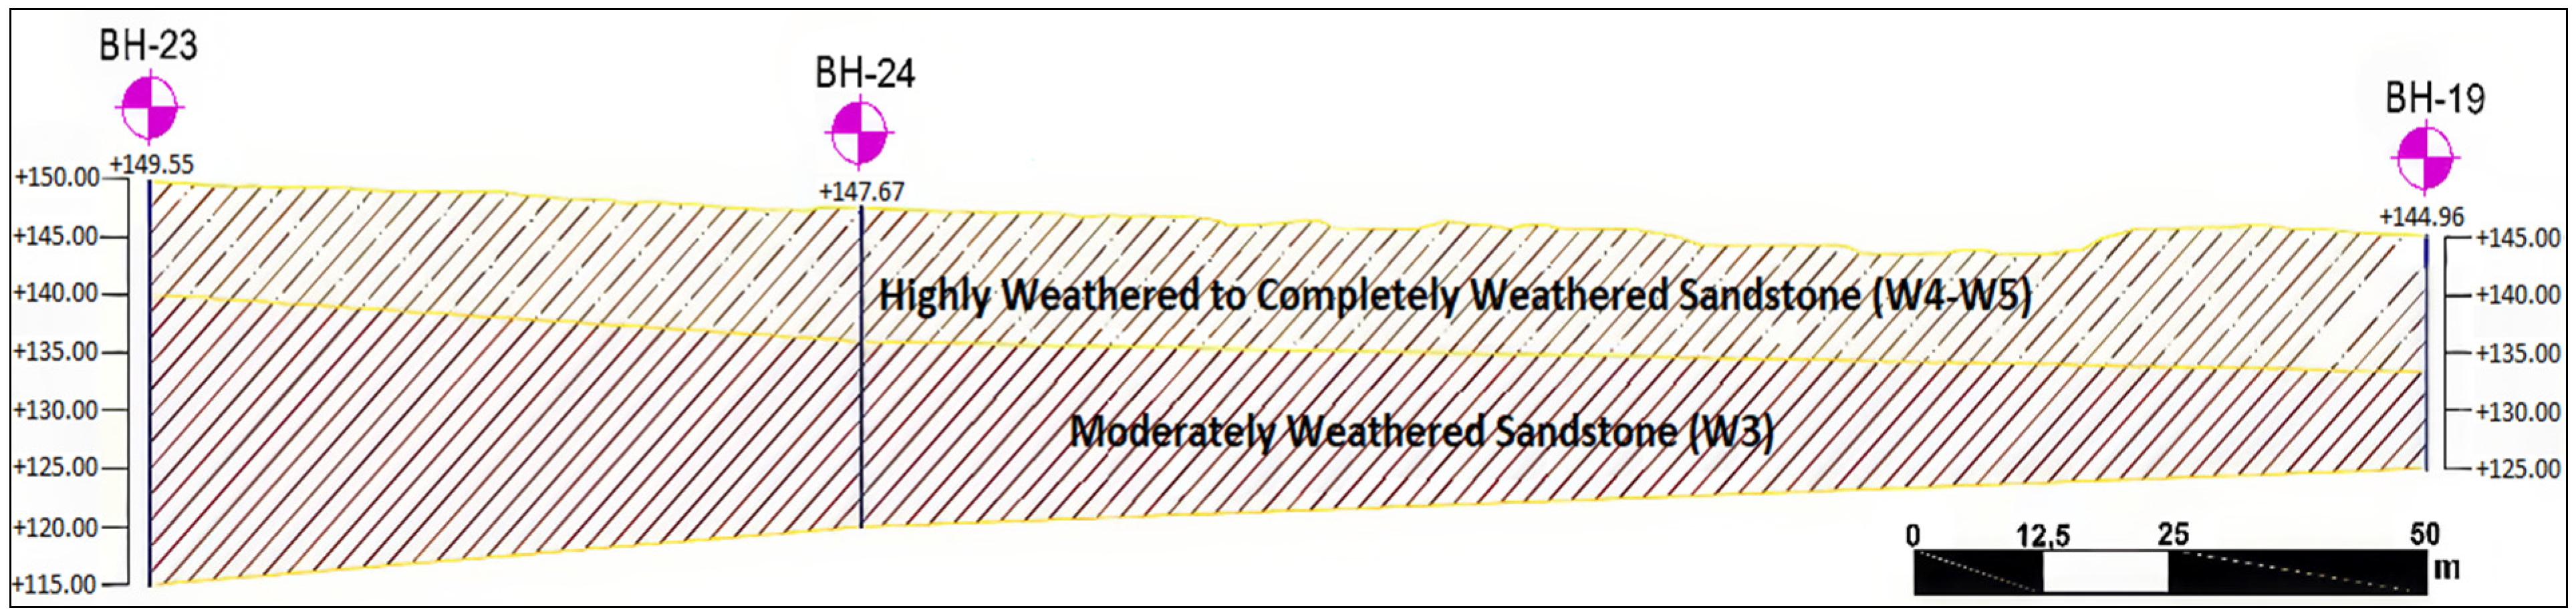
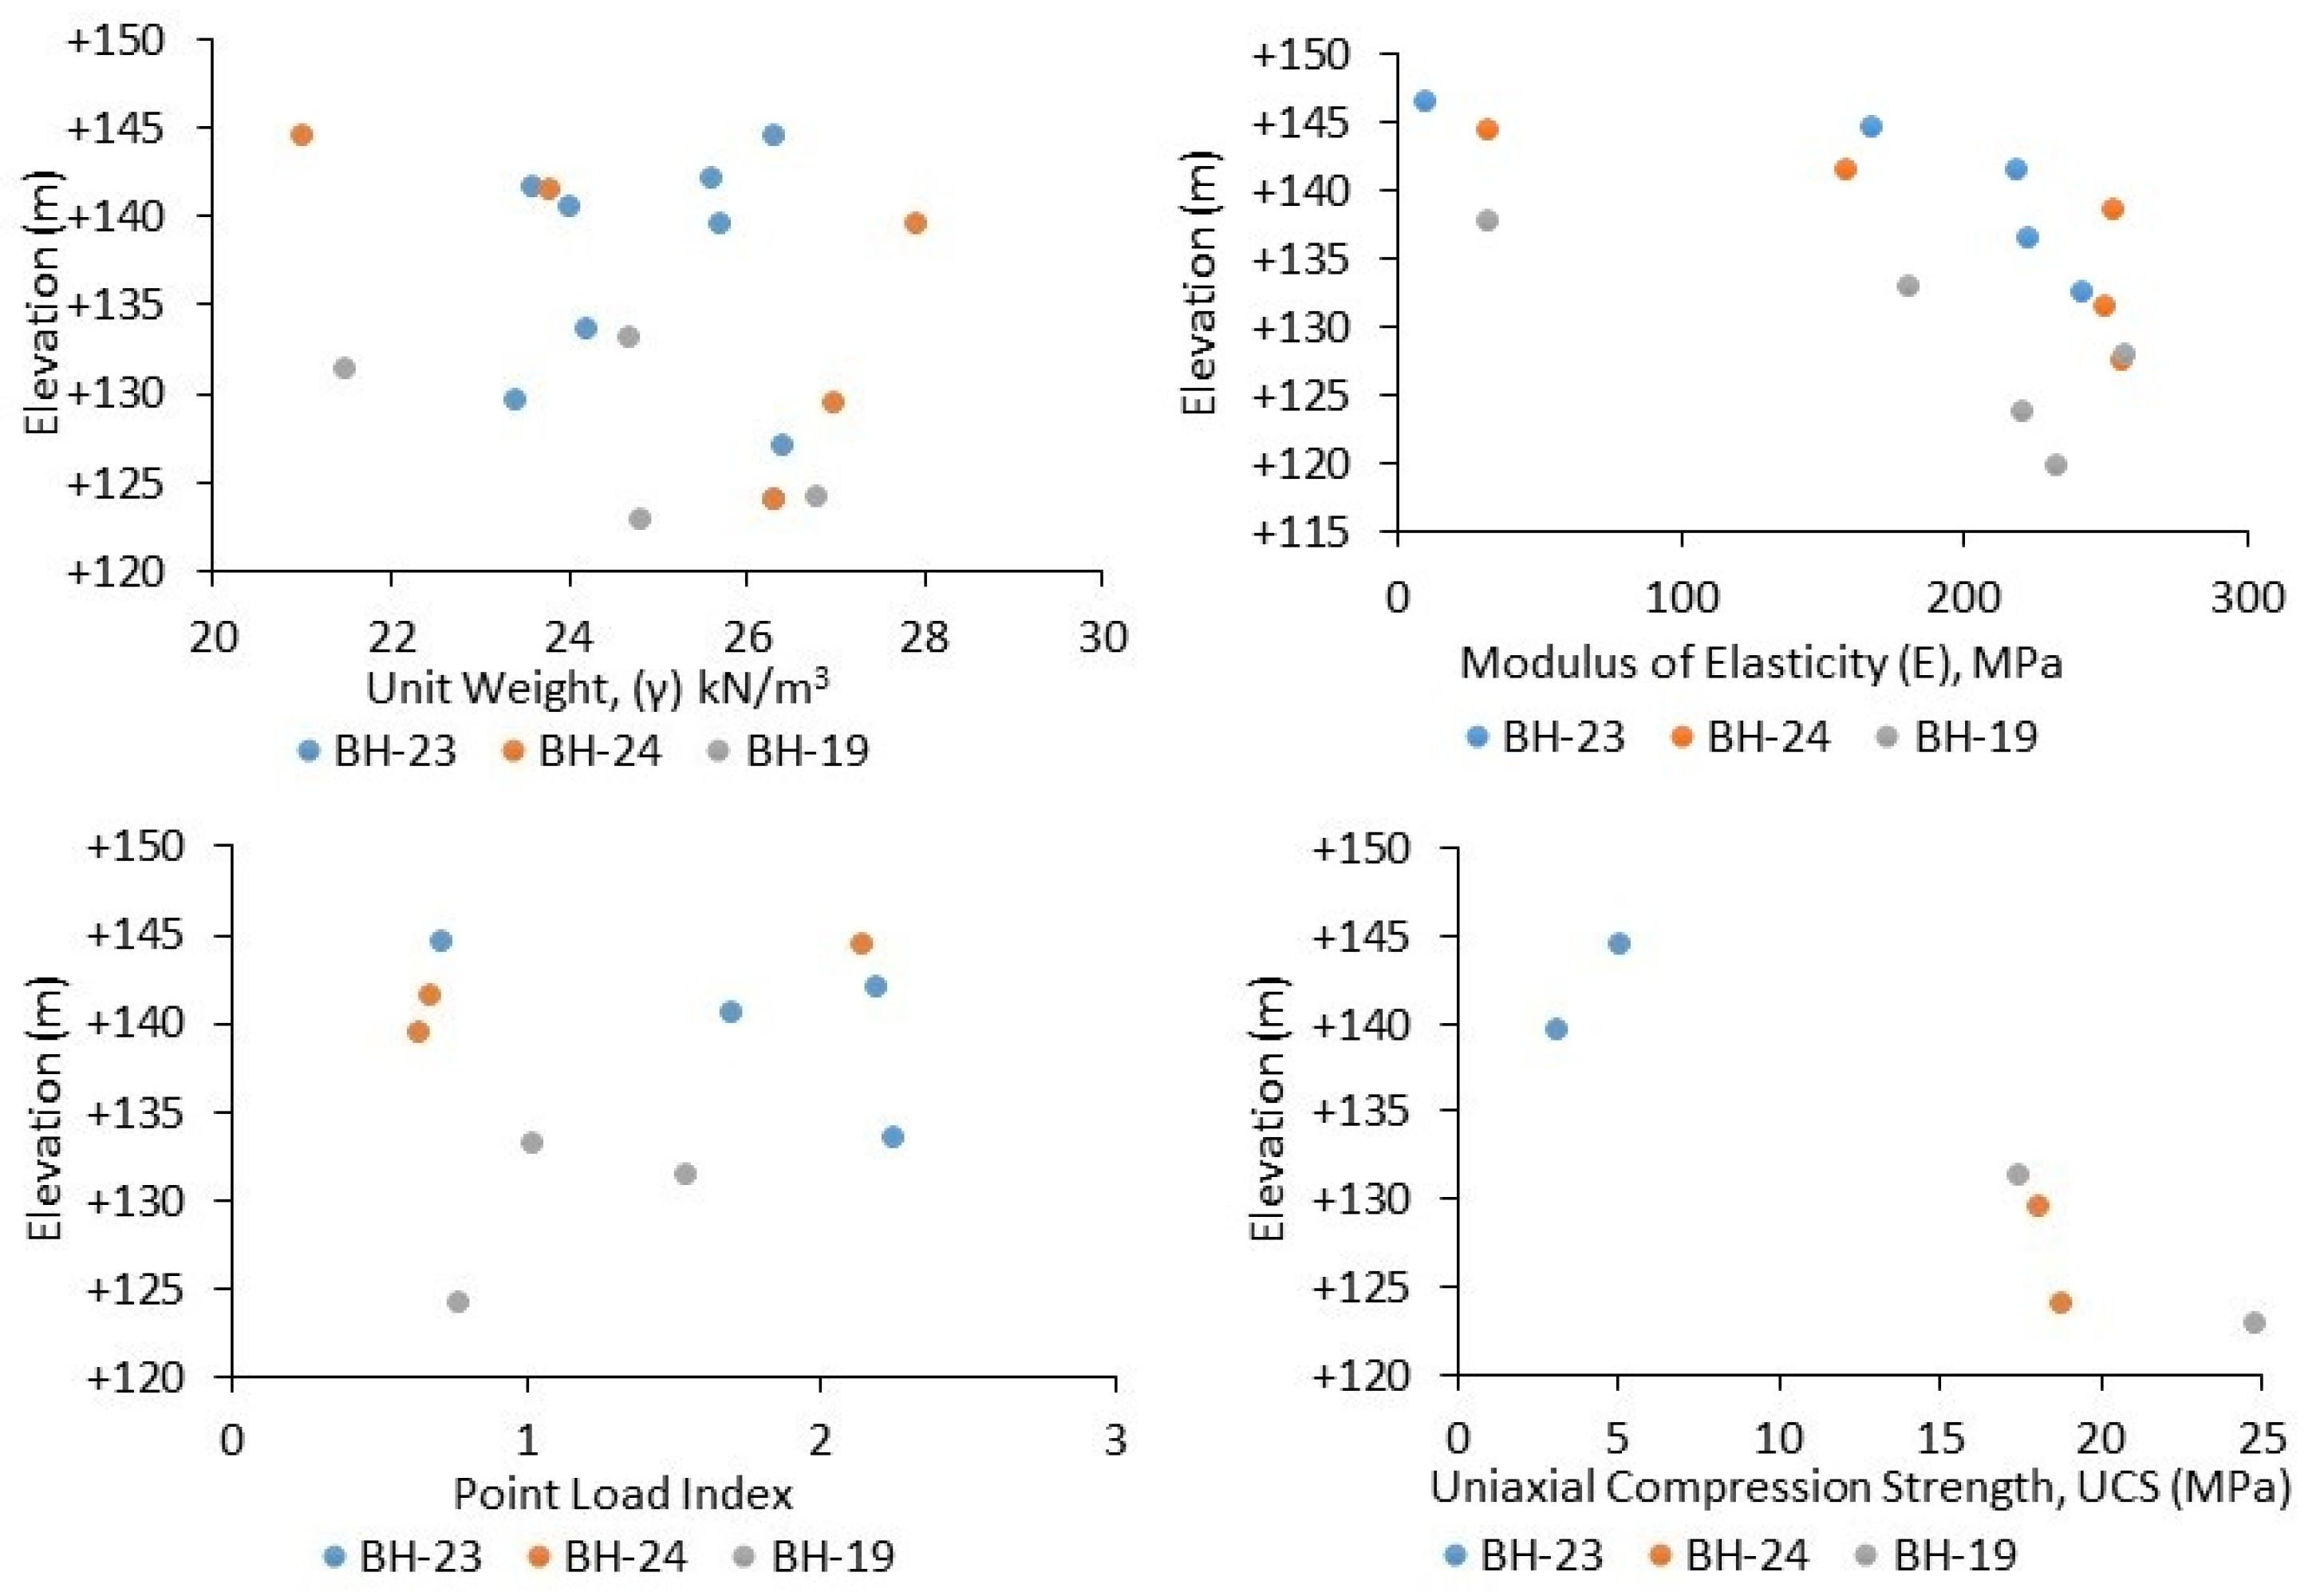
Engineering Geological Parameters of the Studied Weathered Rock Profile
3. Results and Discussion
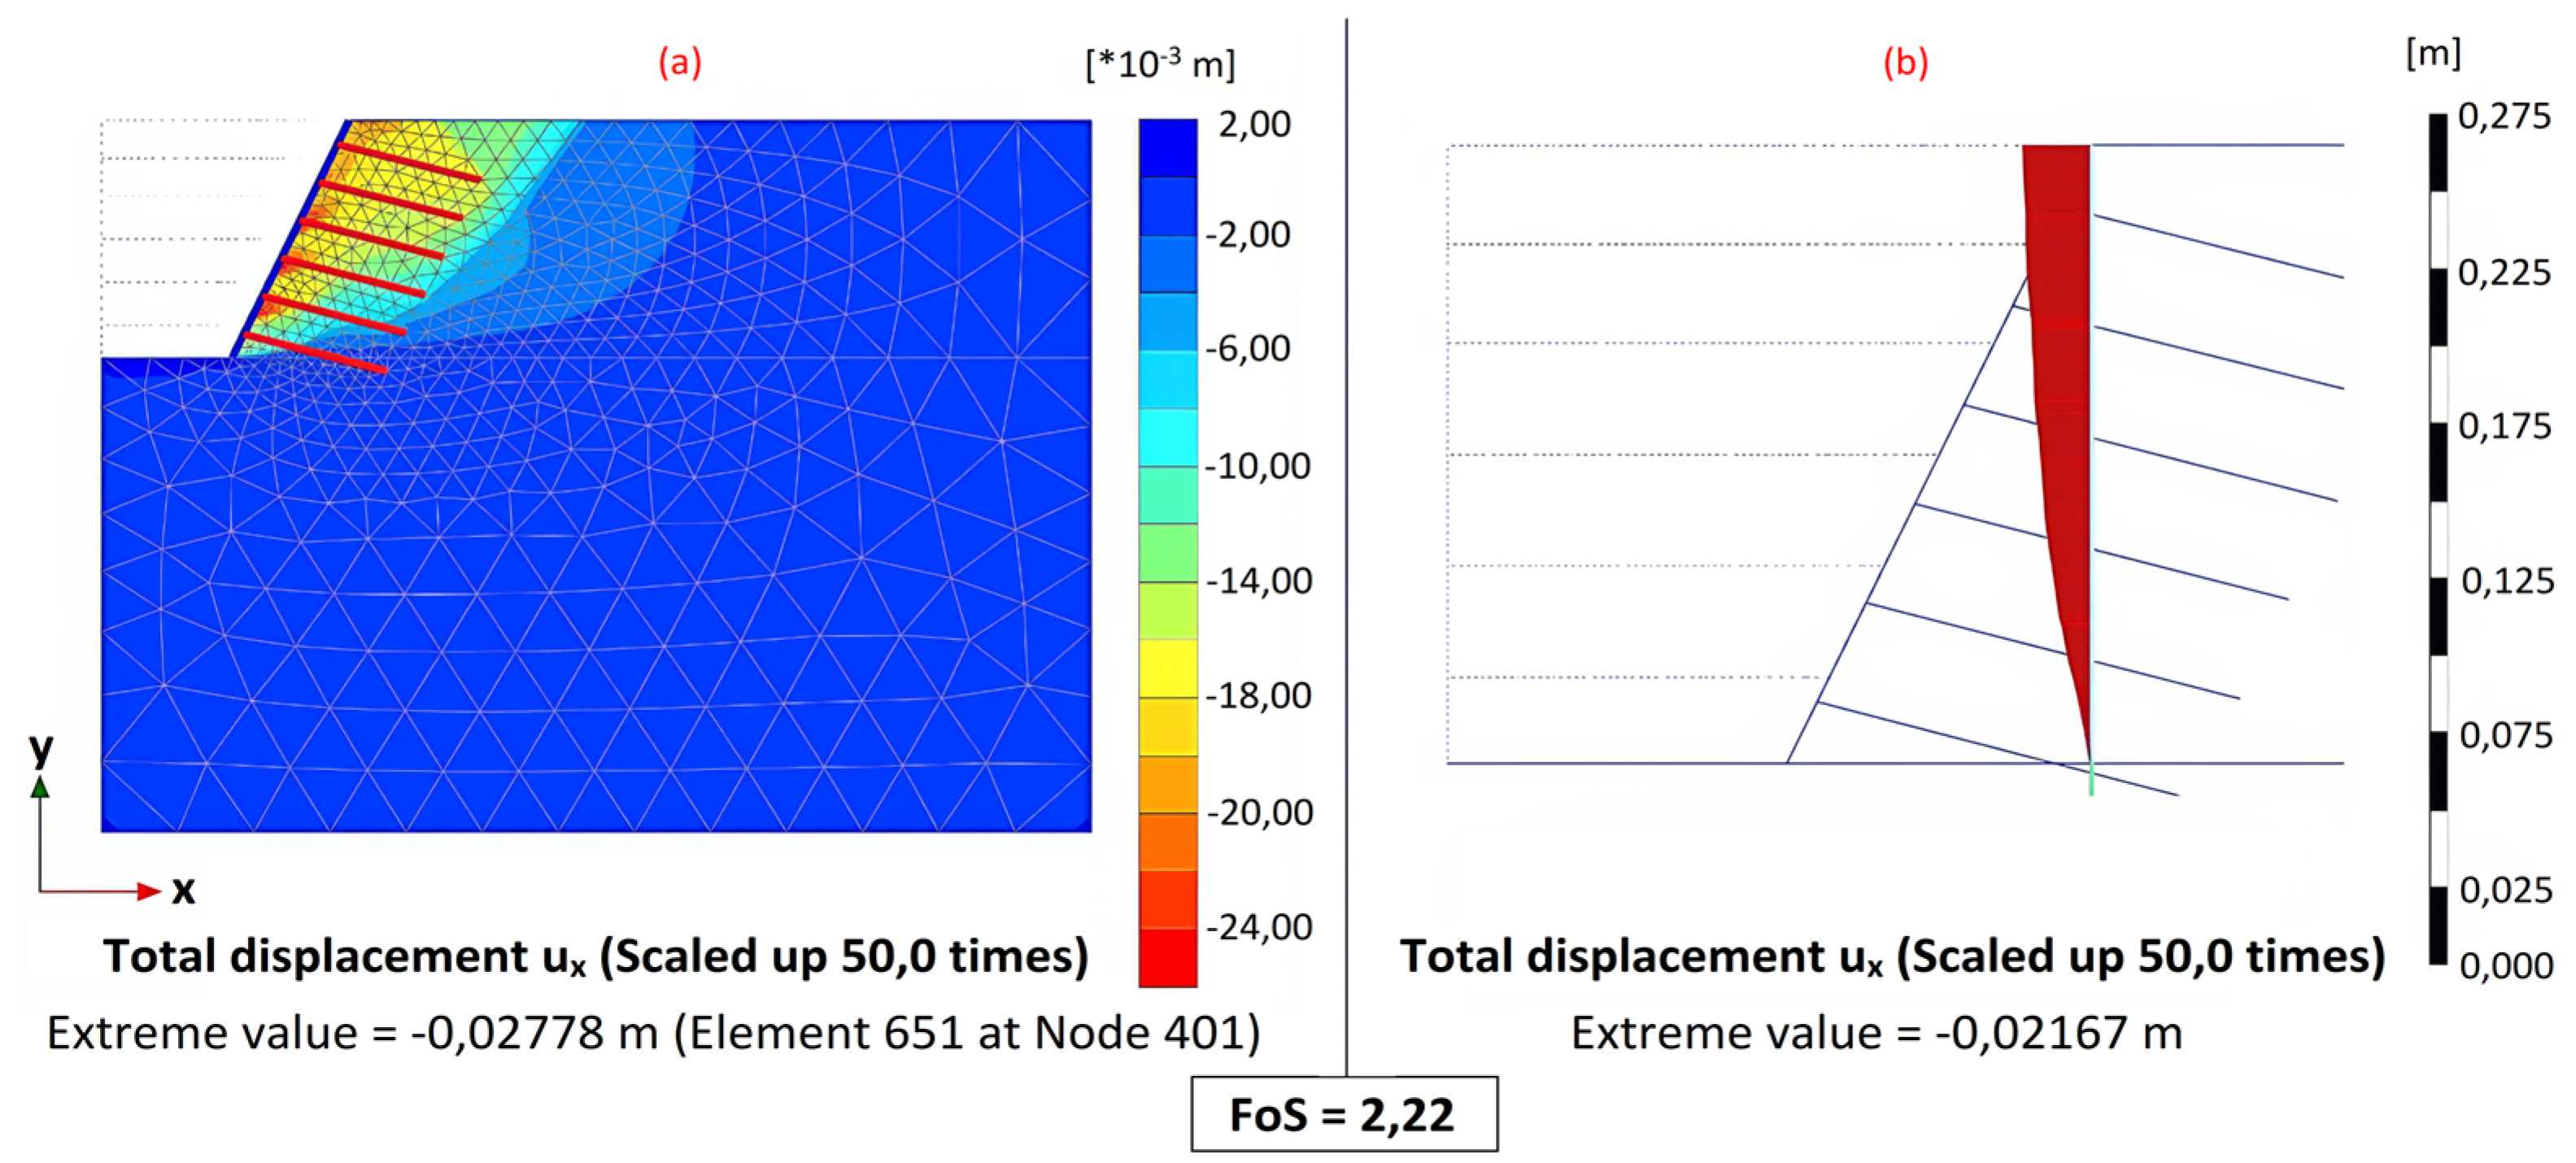
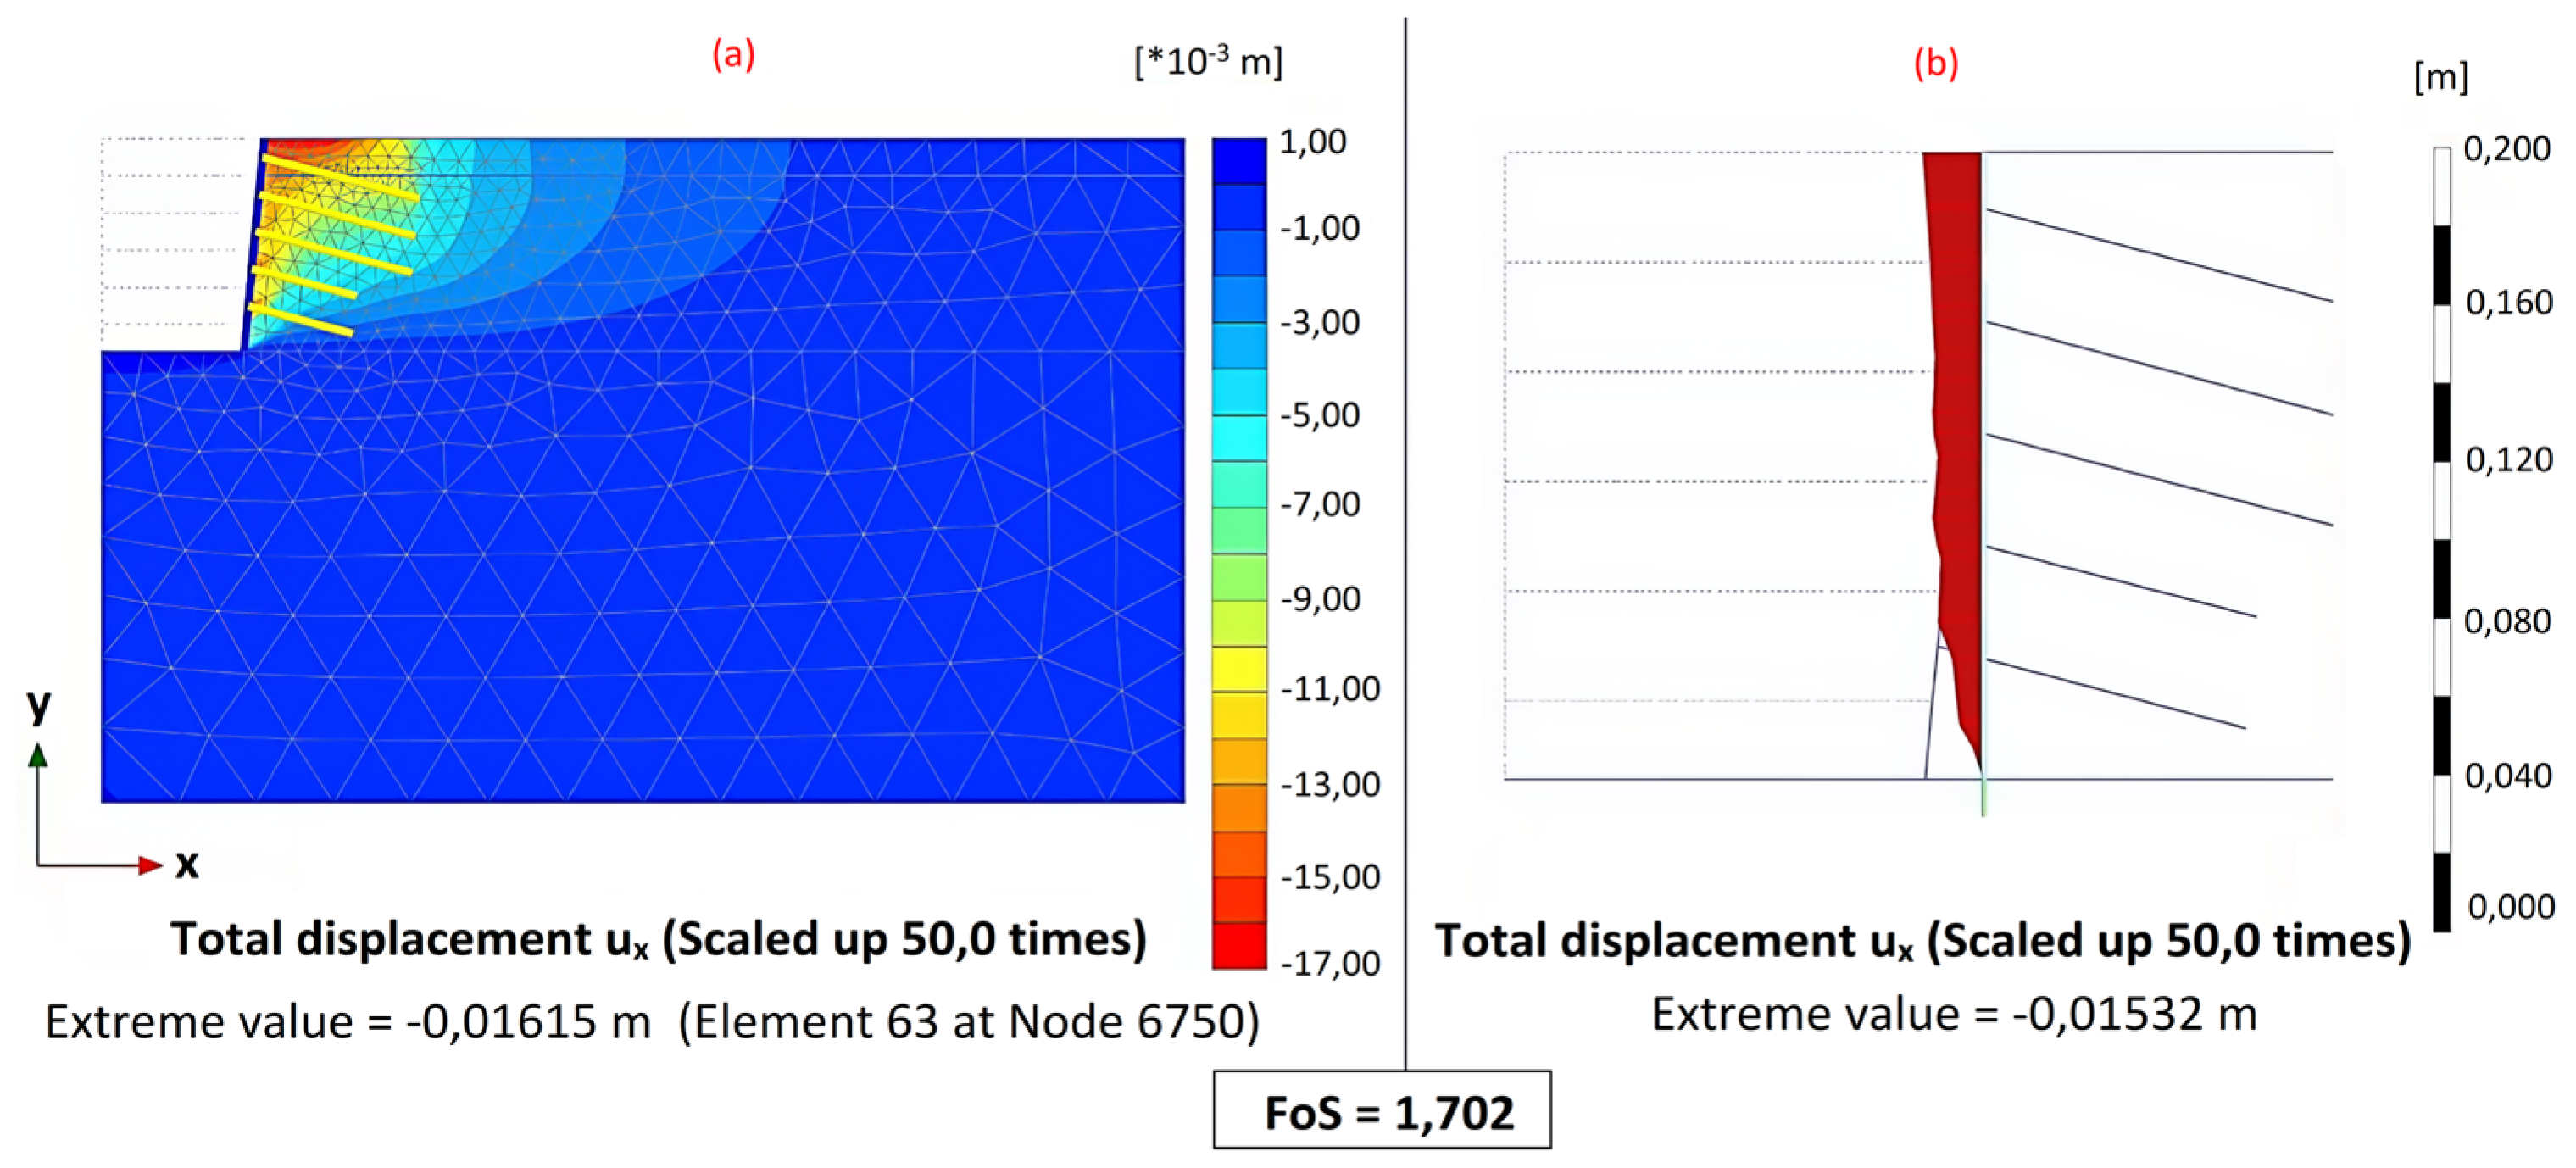
3.1. Numerical Model: The Mohr–Coulomb Constitutive Model
3.2. Performance of the Soil Nail System
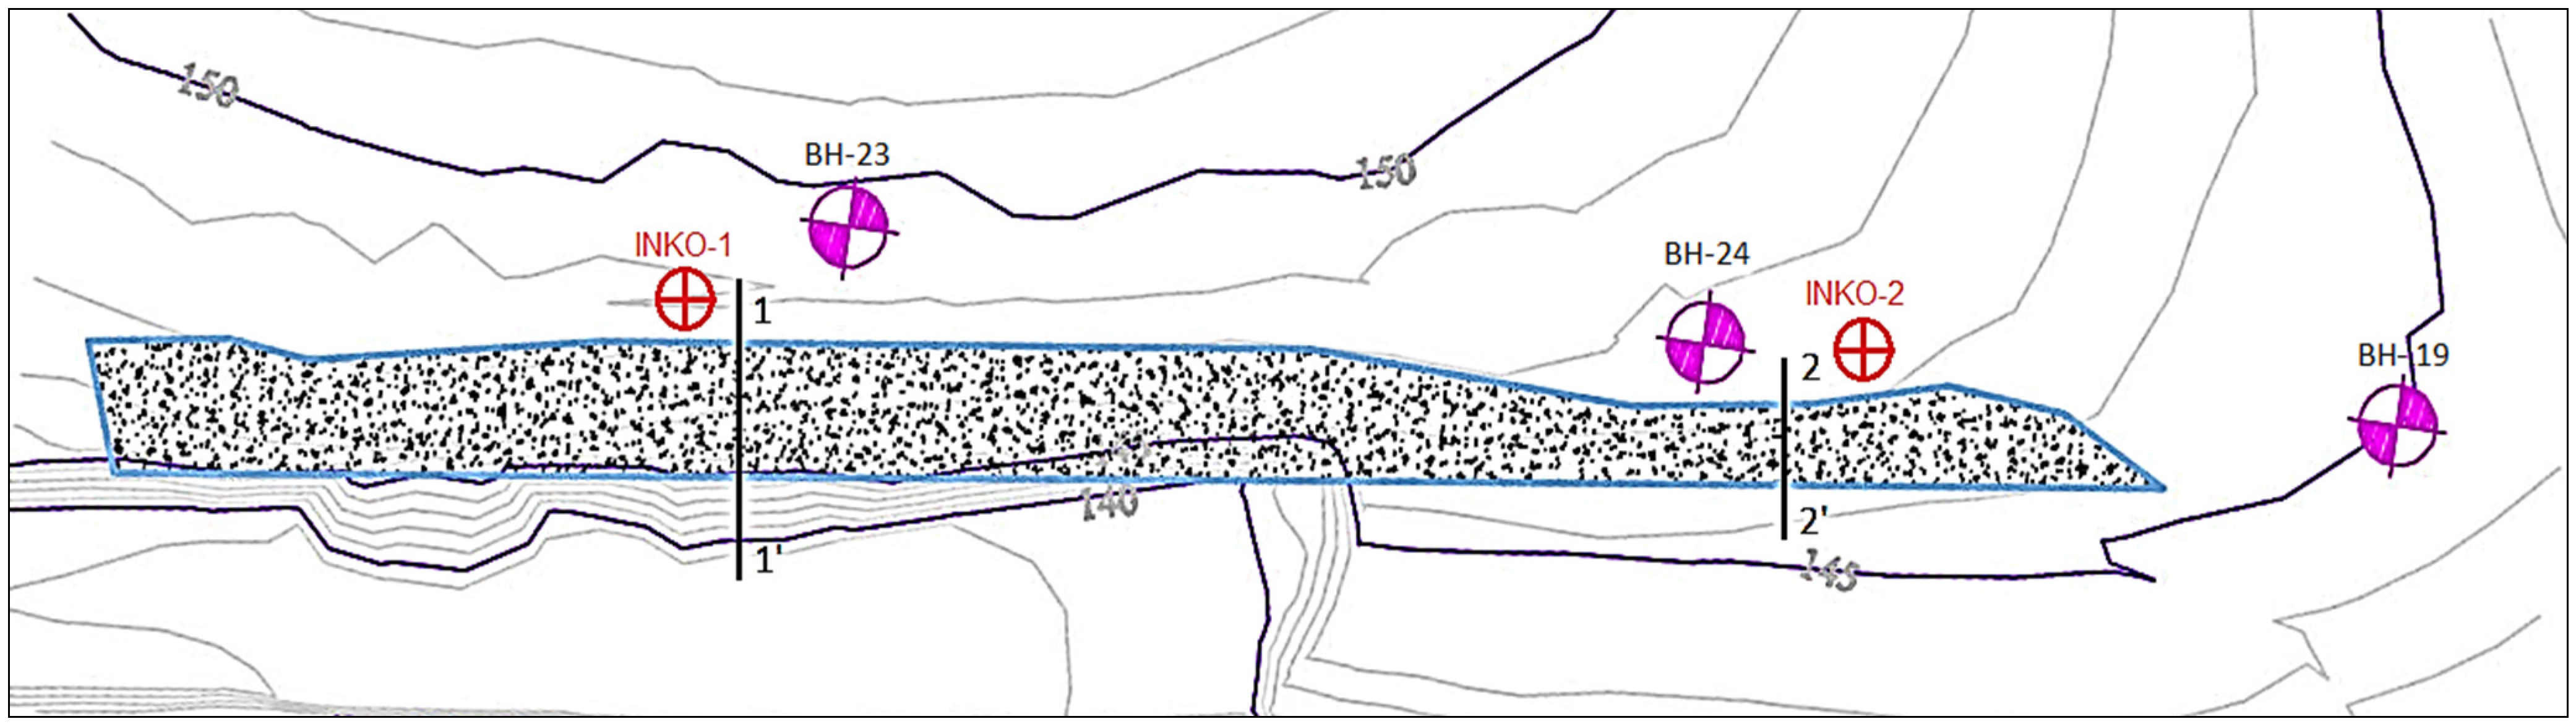
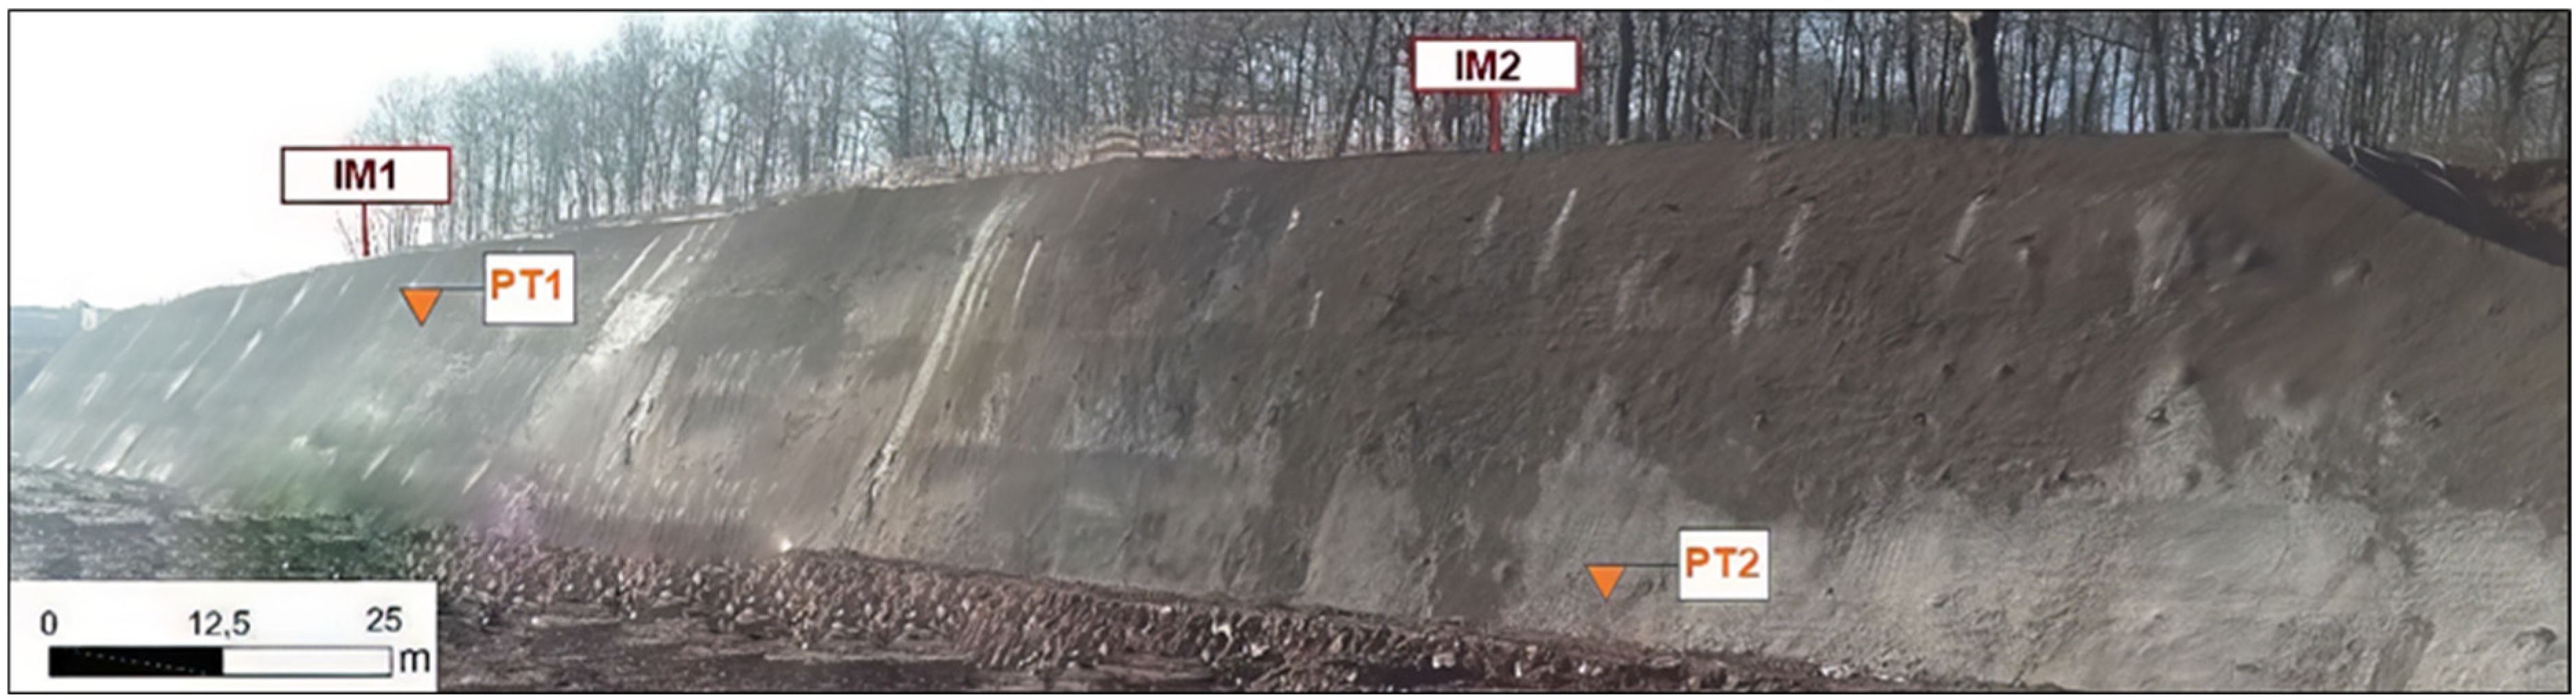
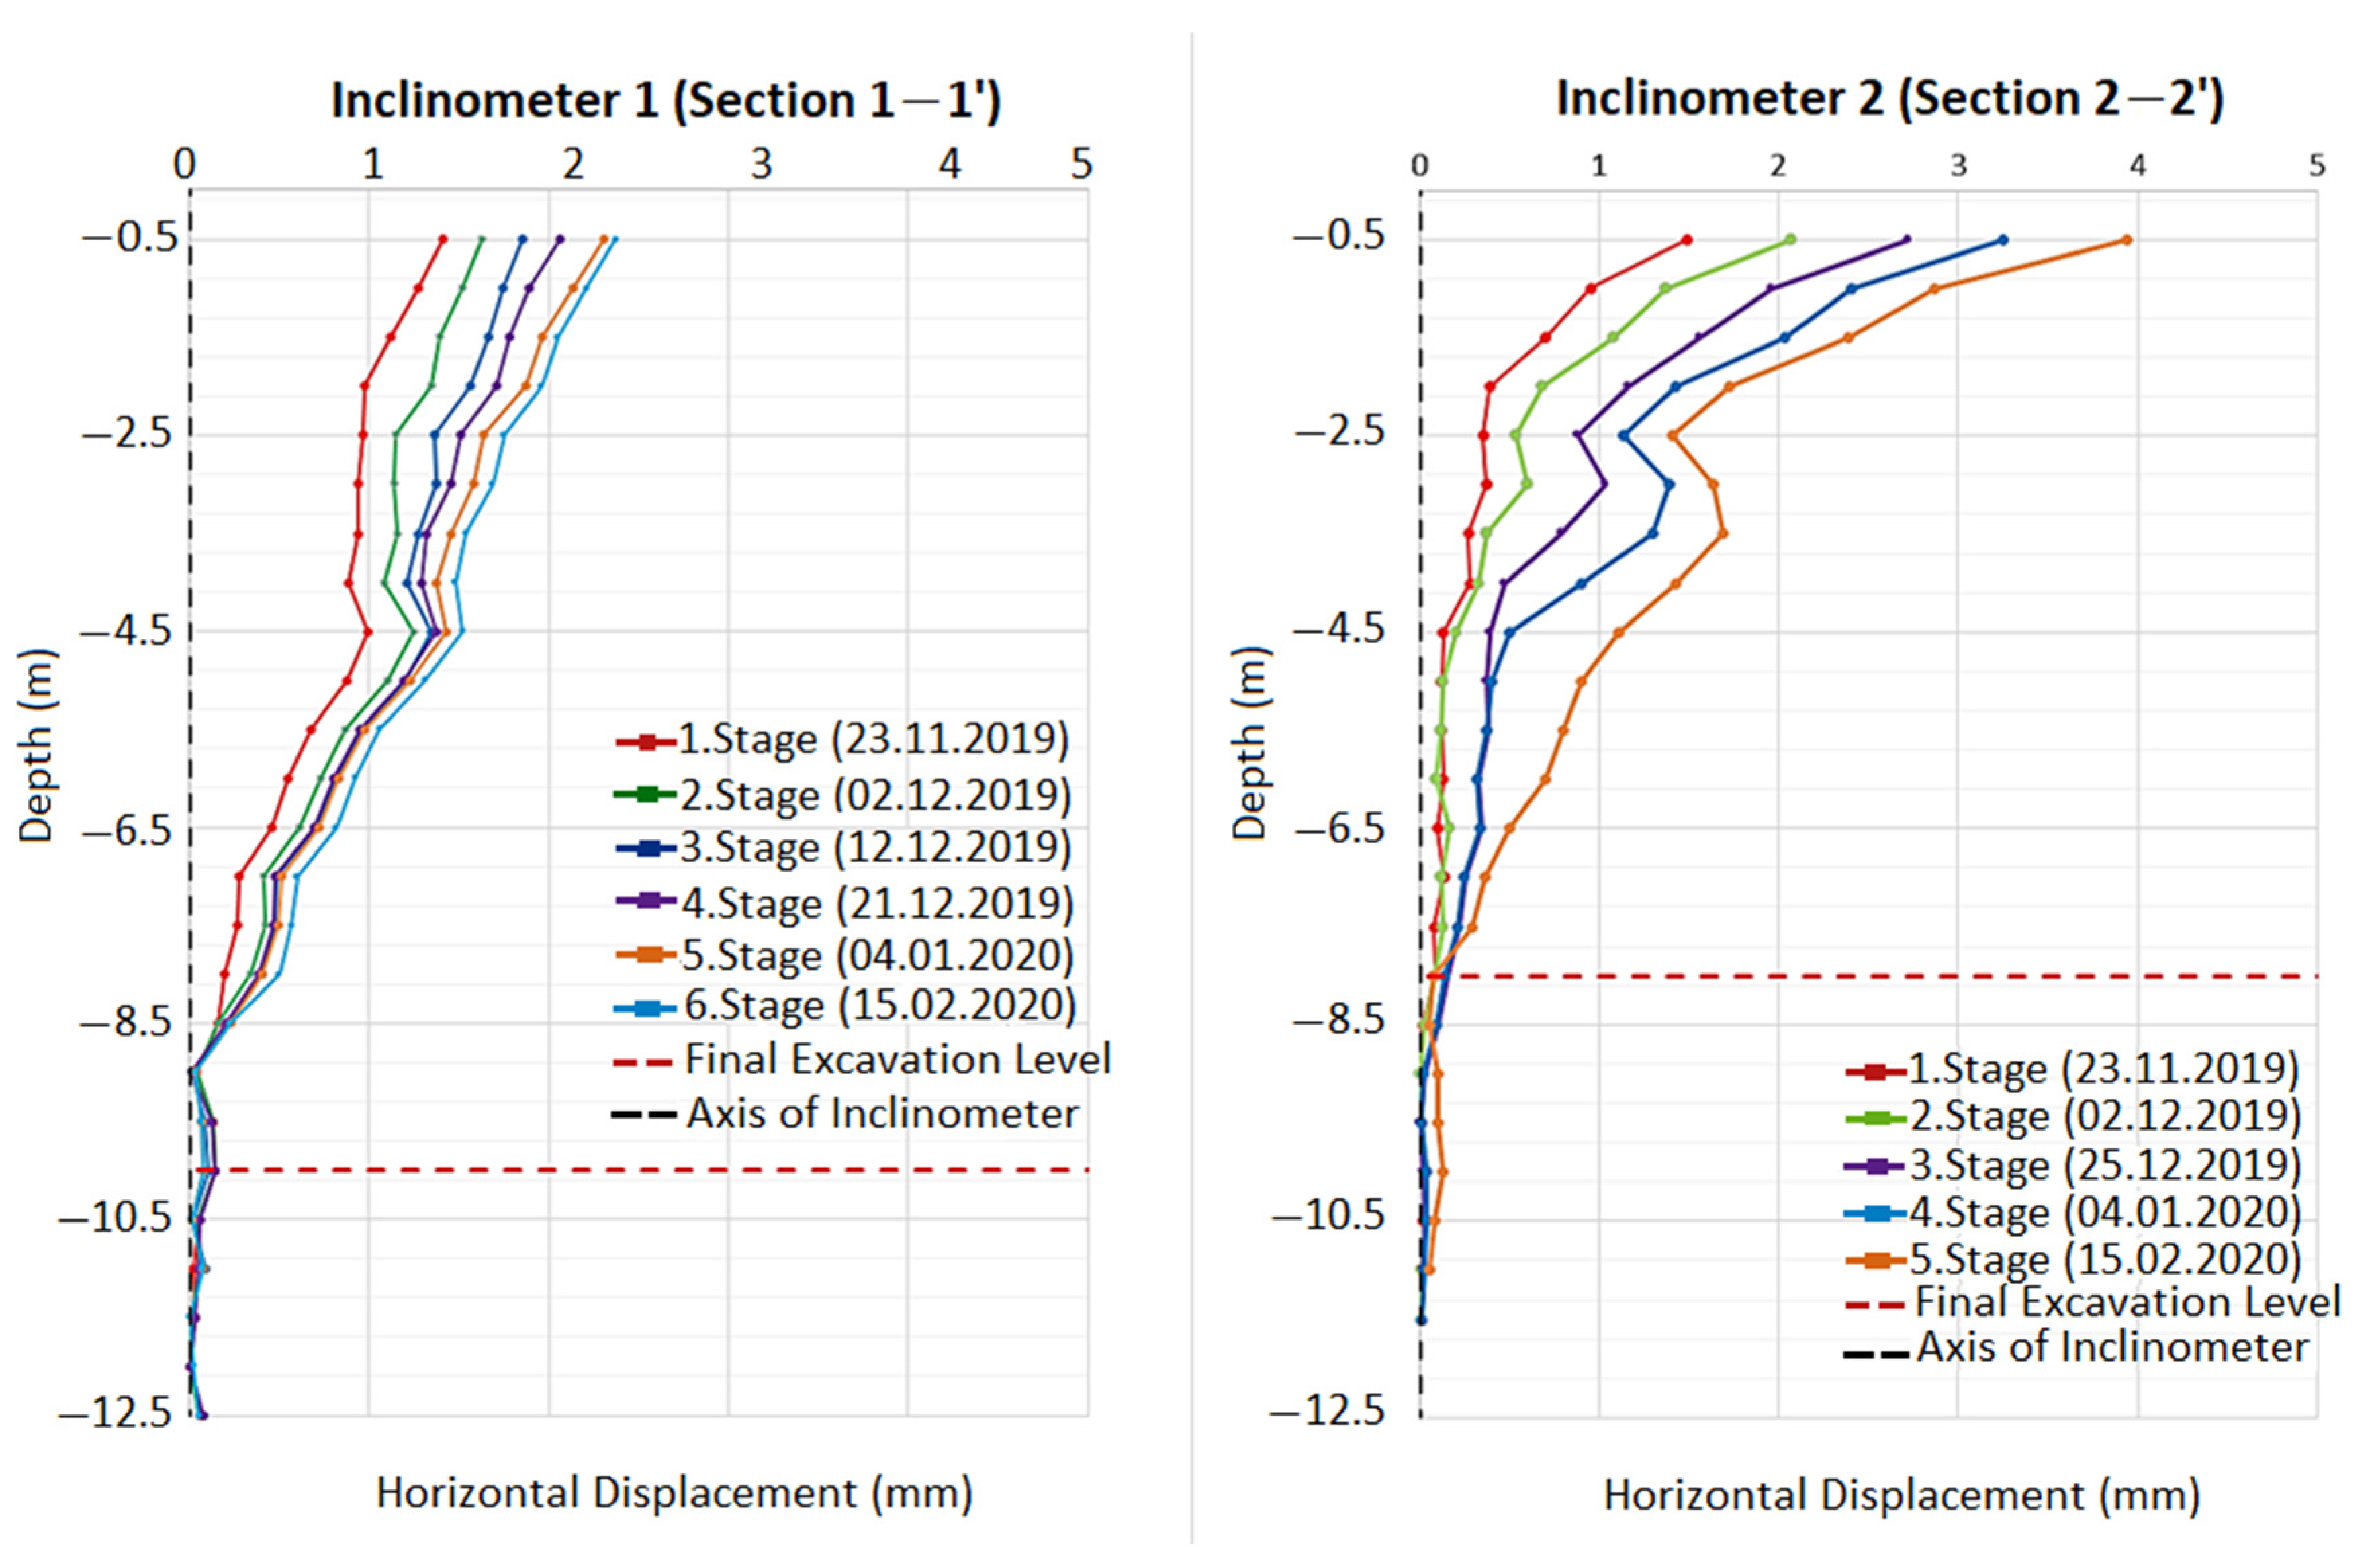
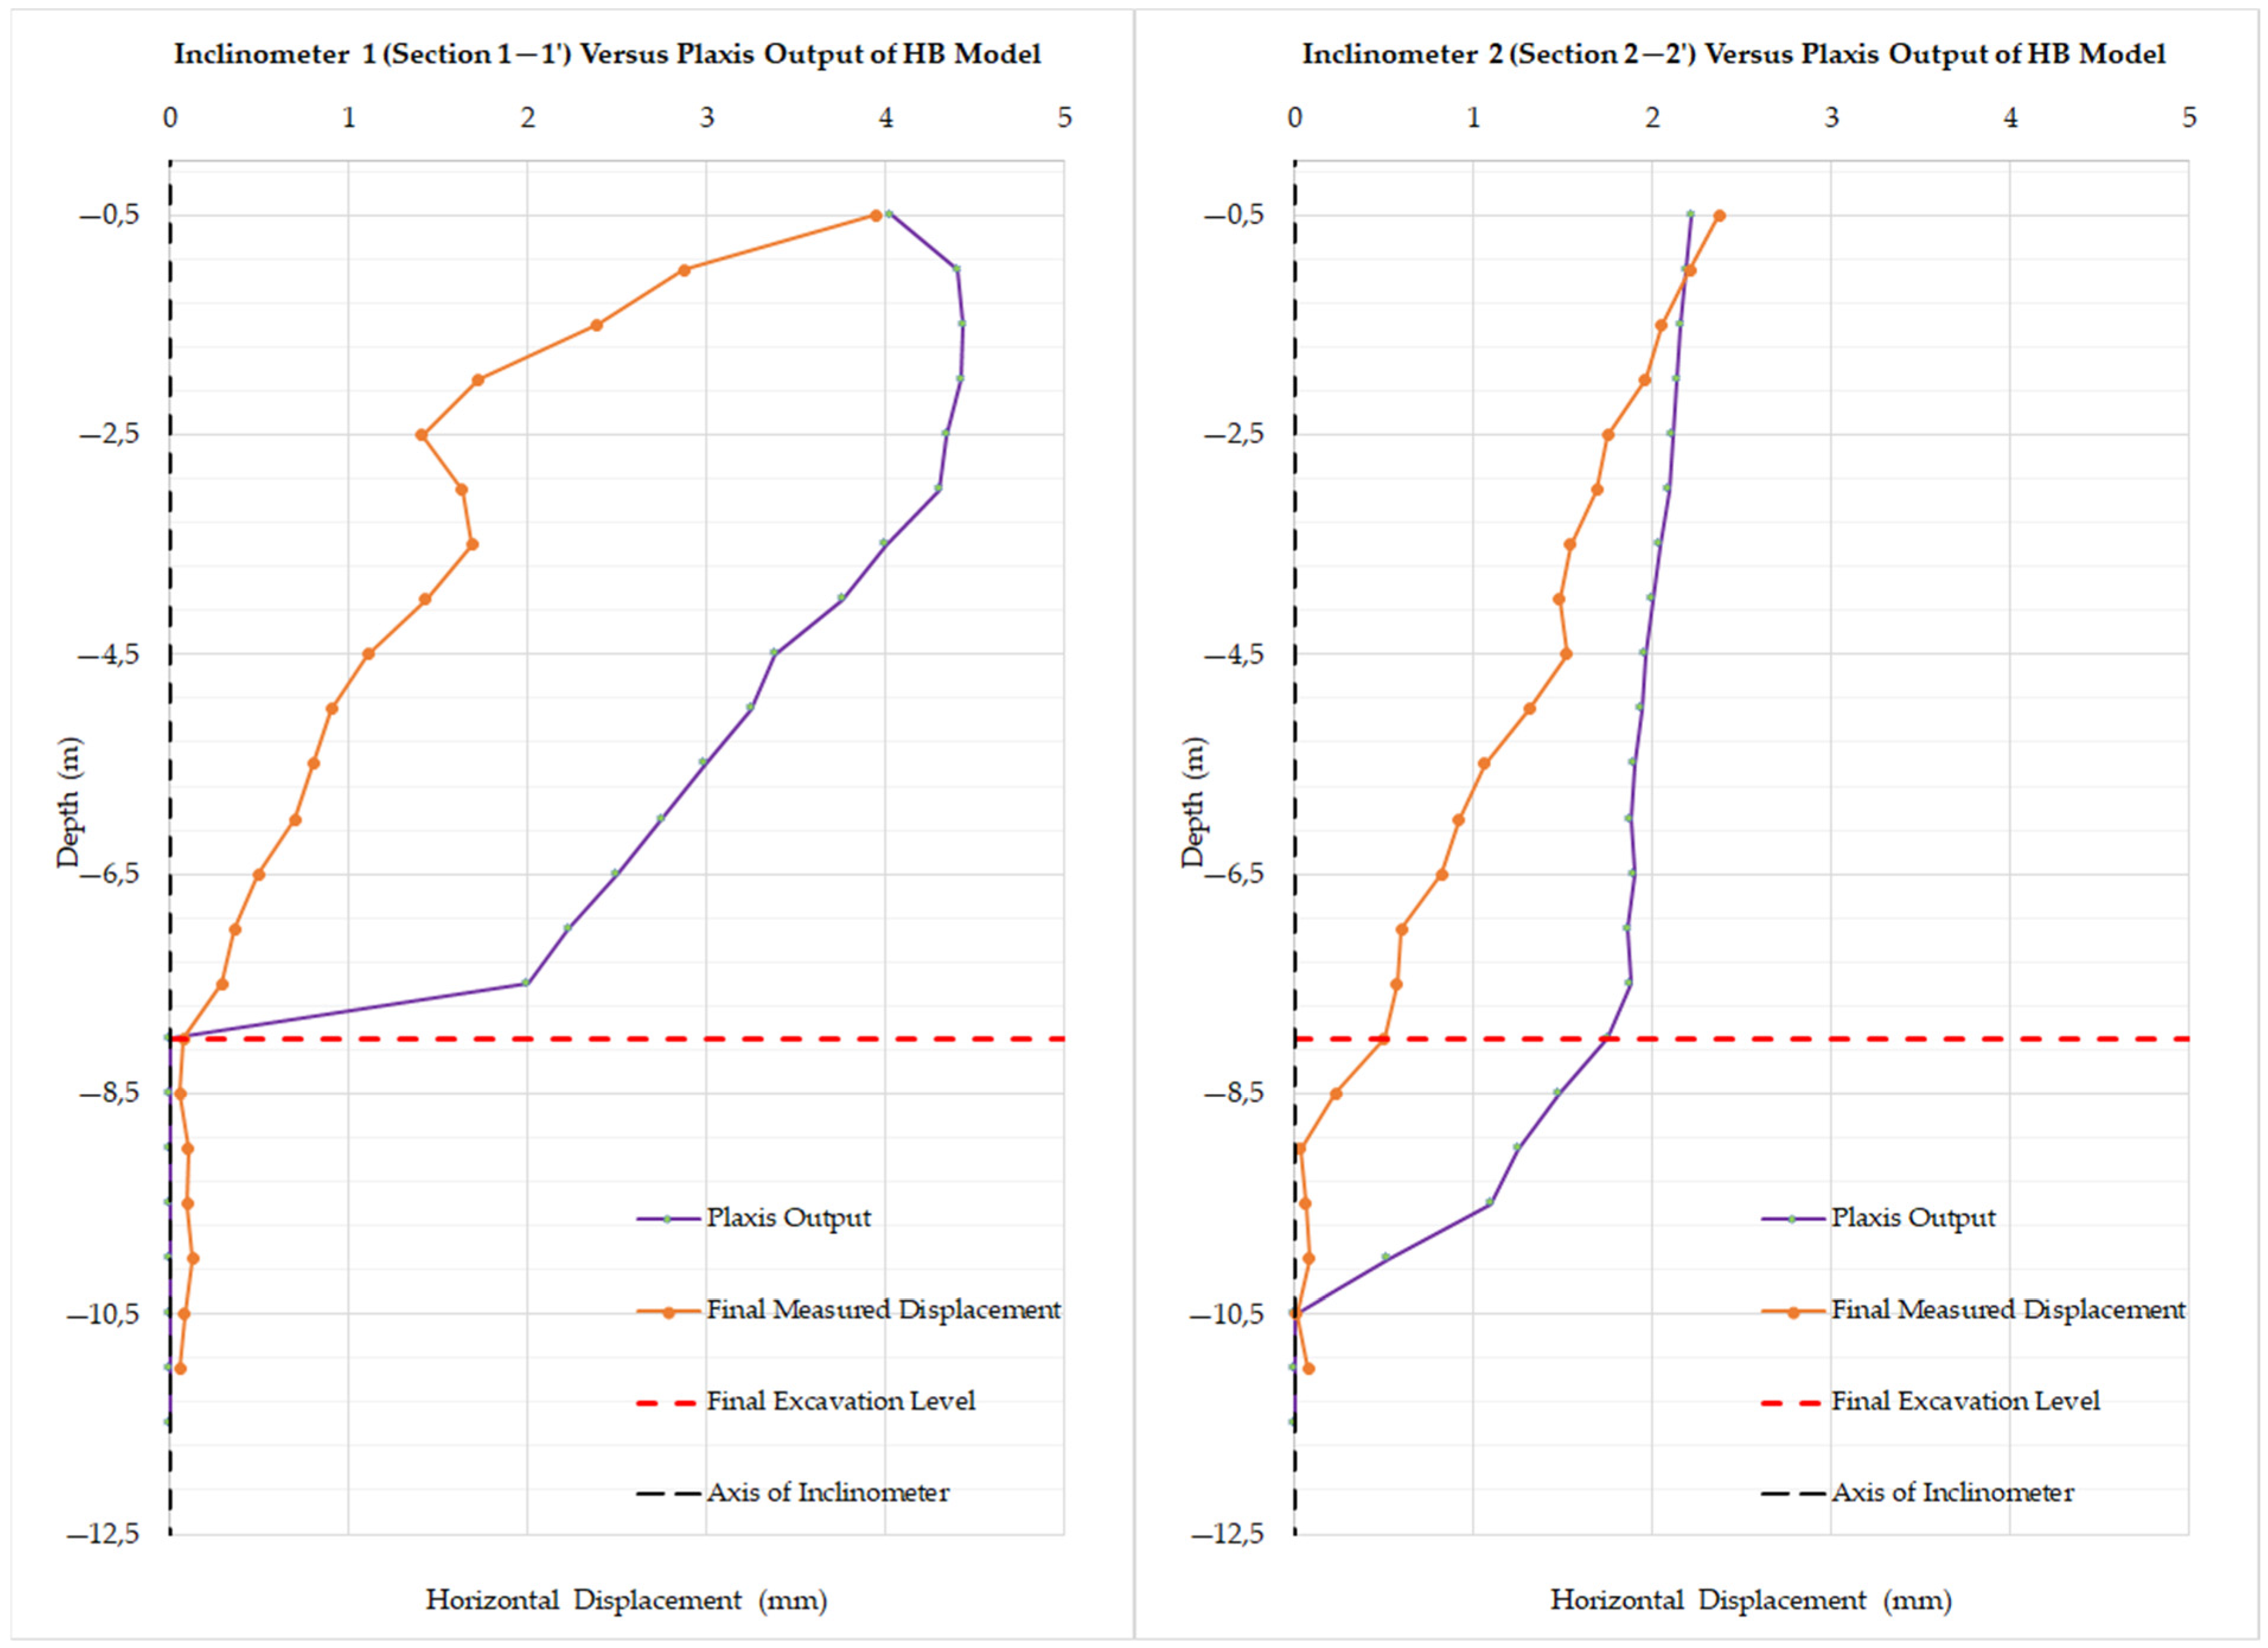
3.2.1. Inclinometer
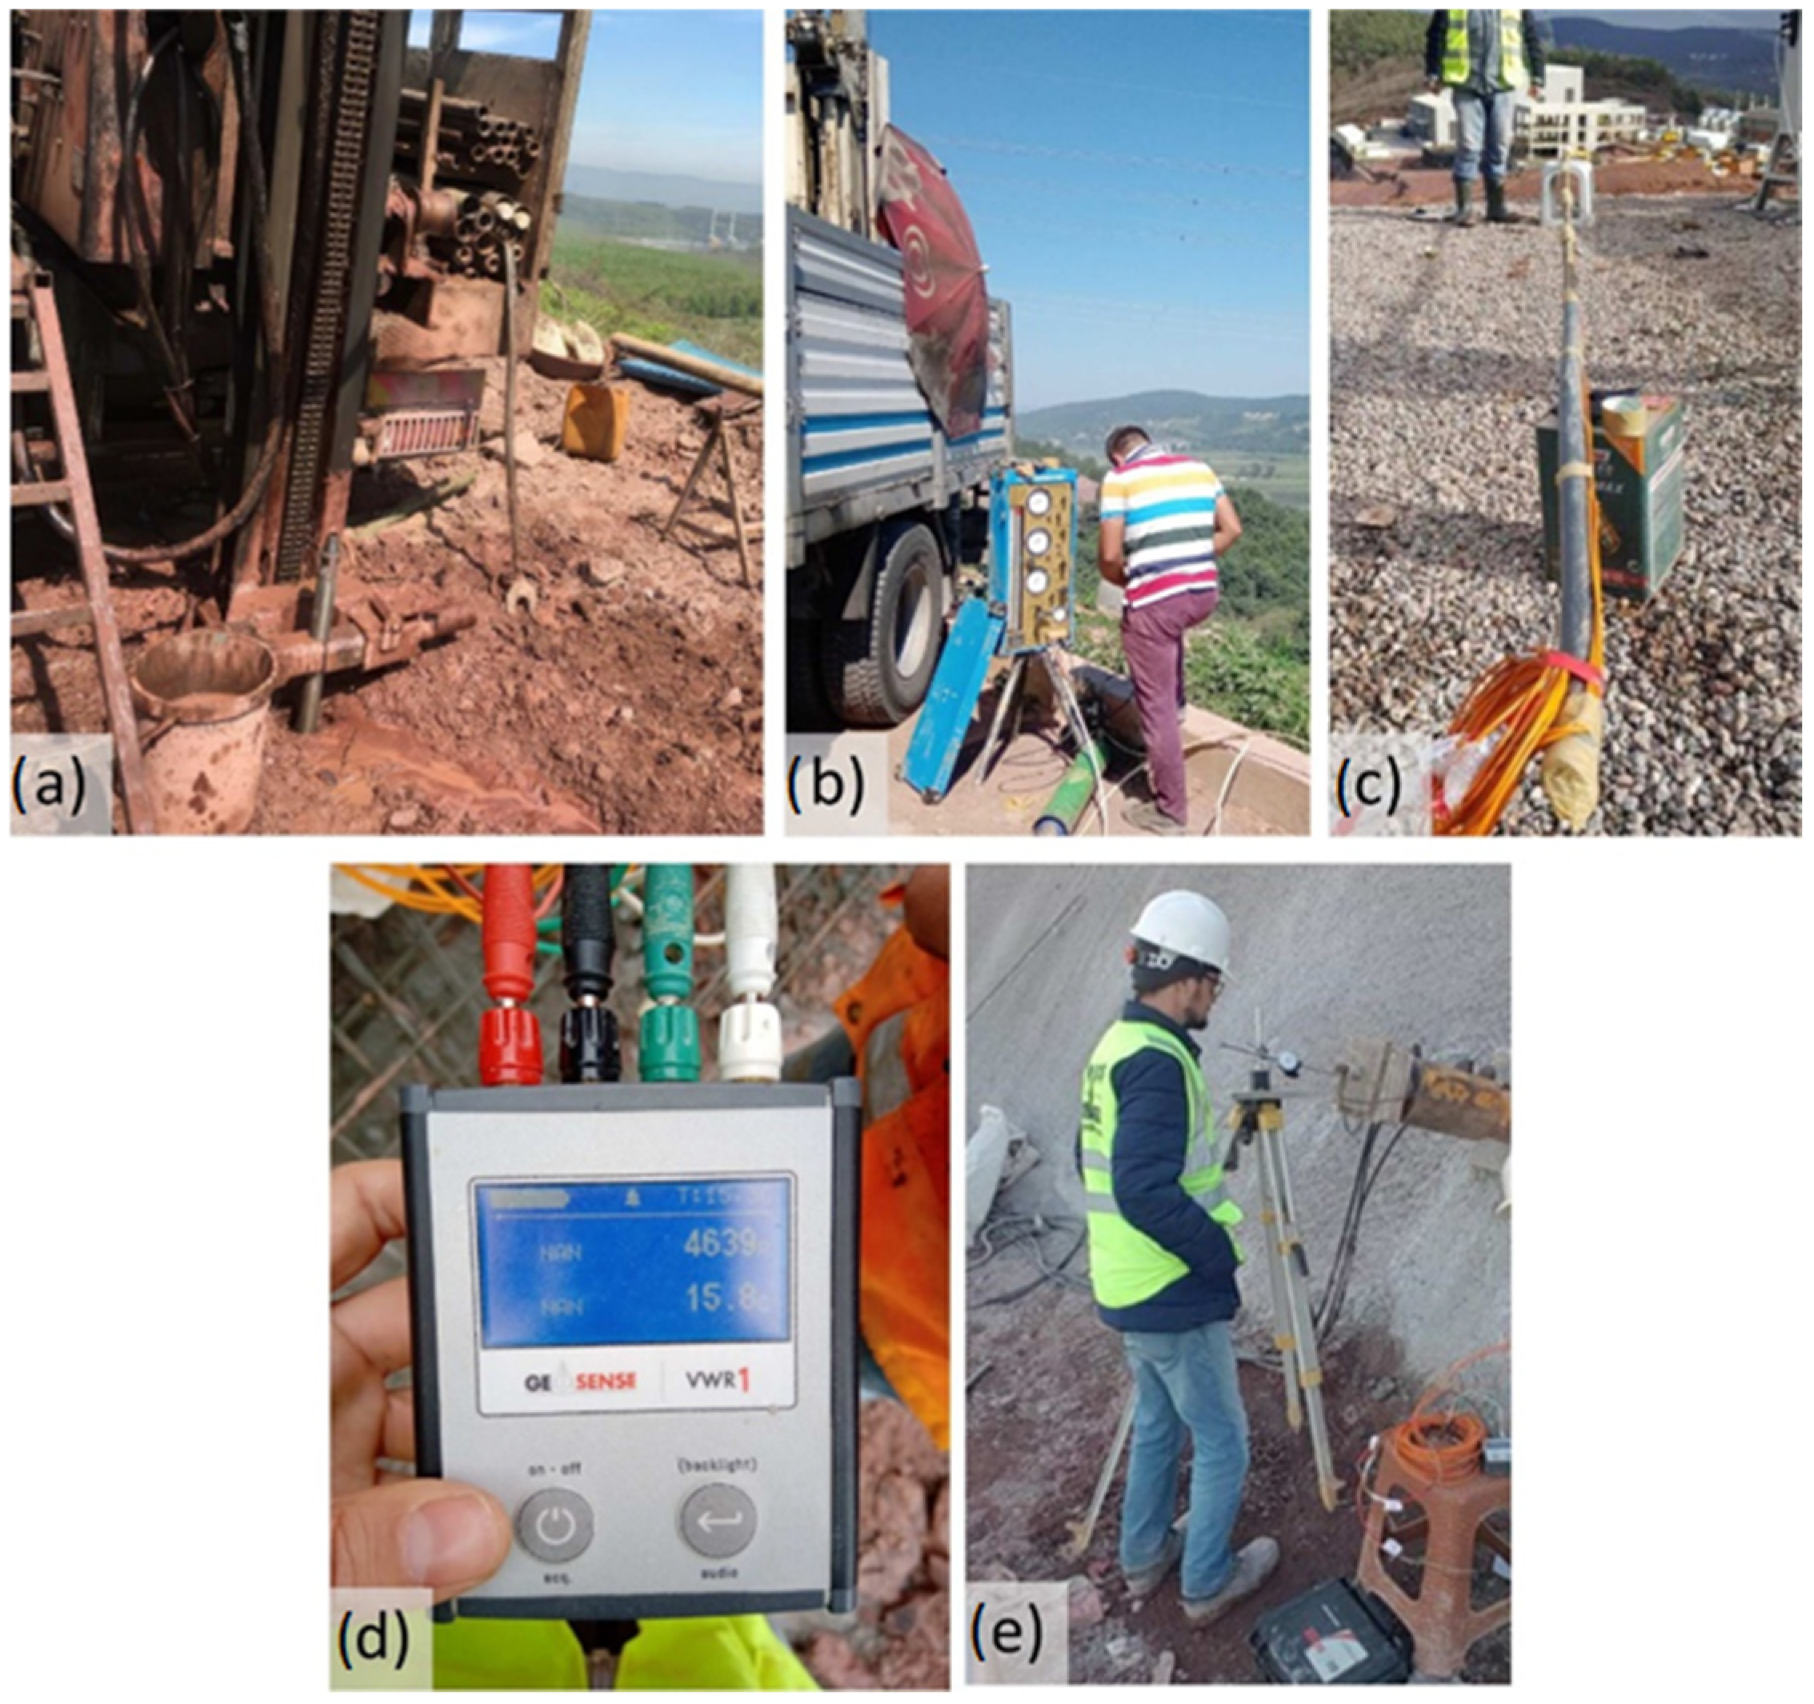
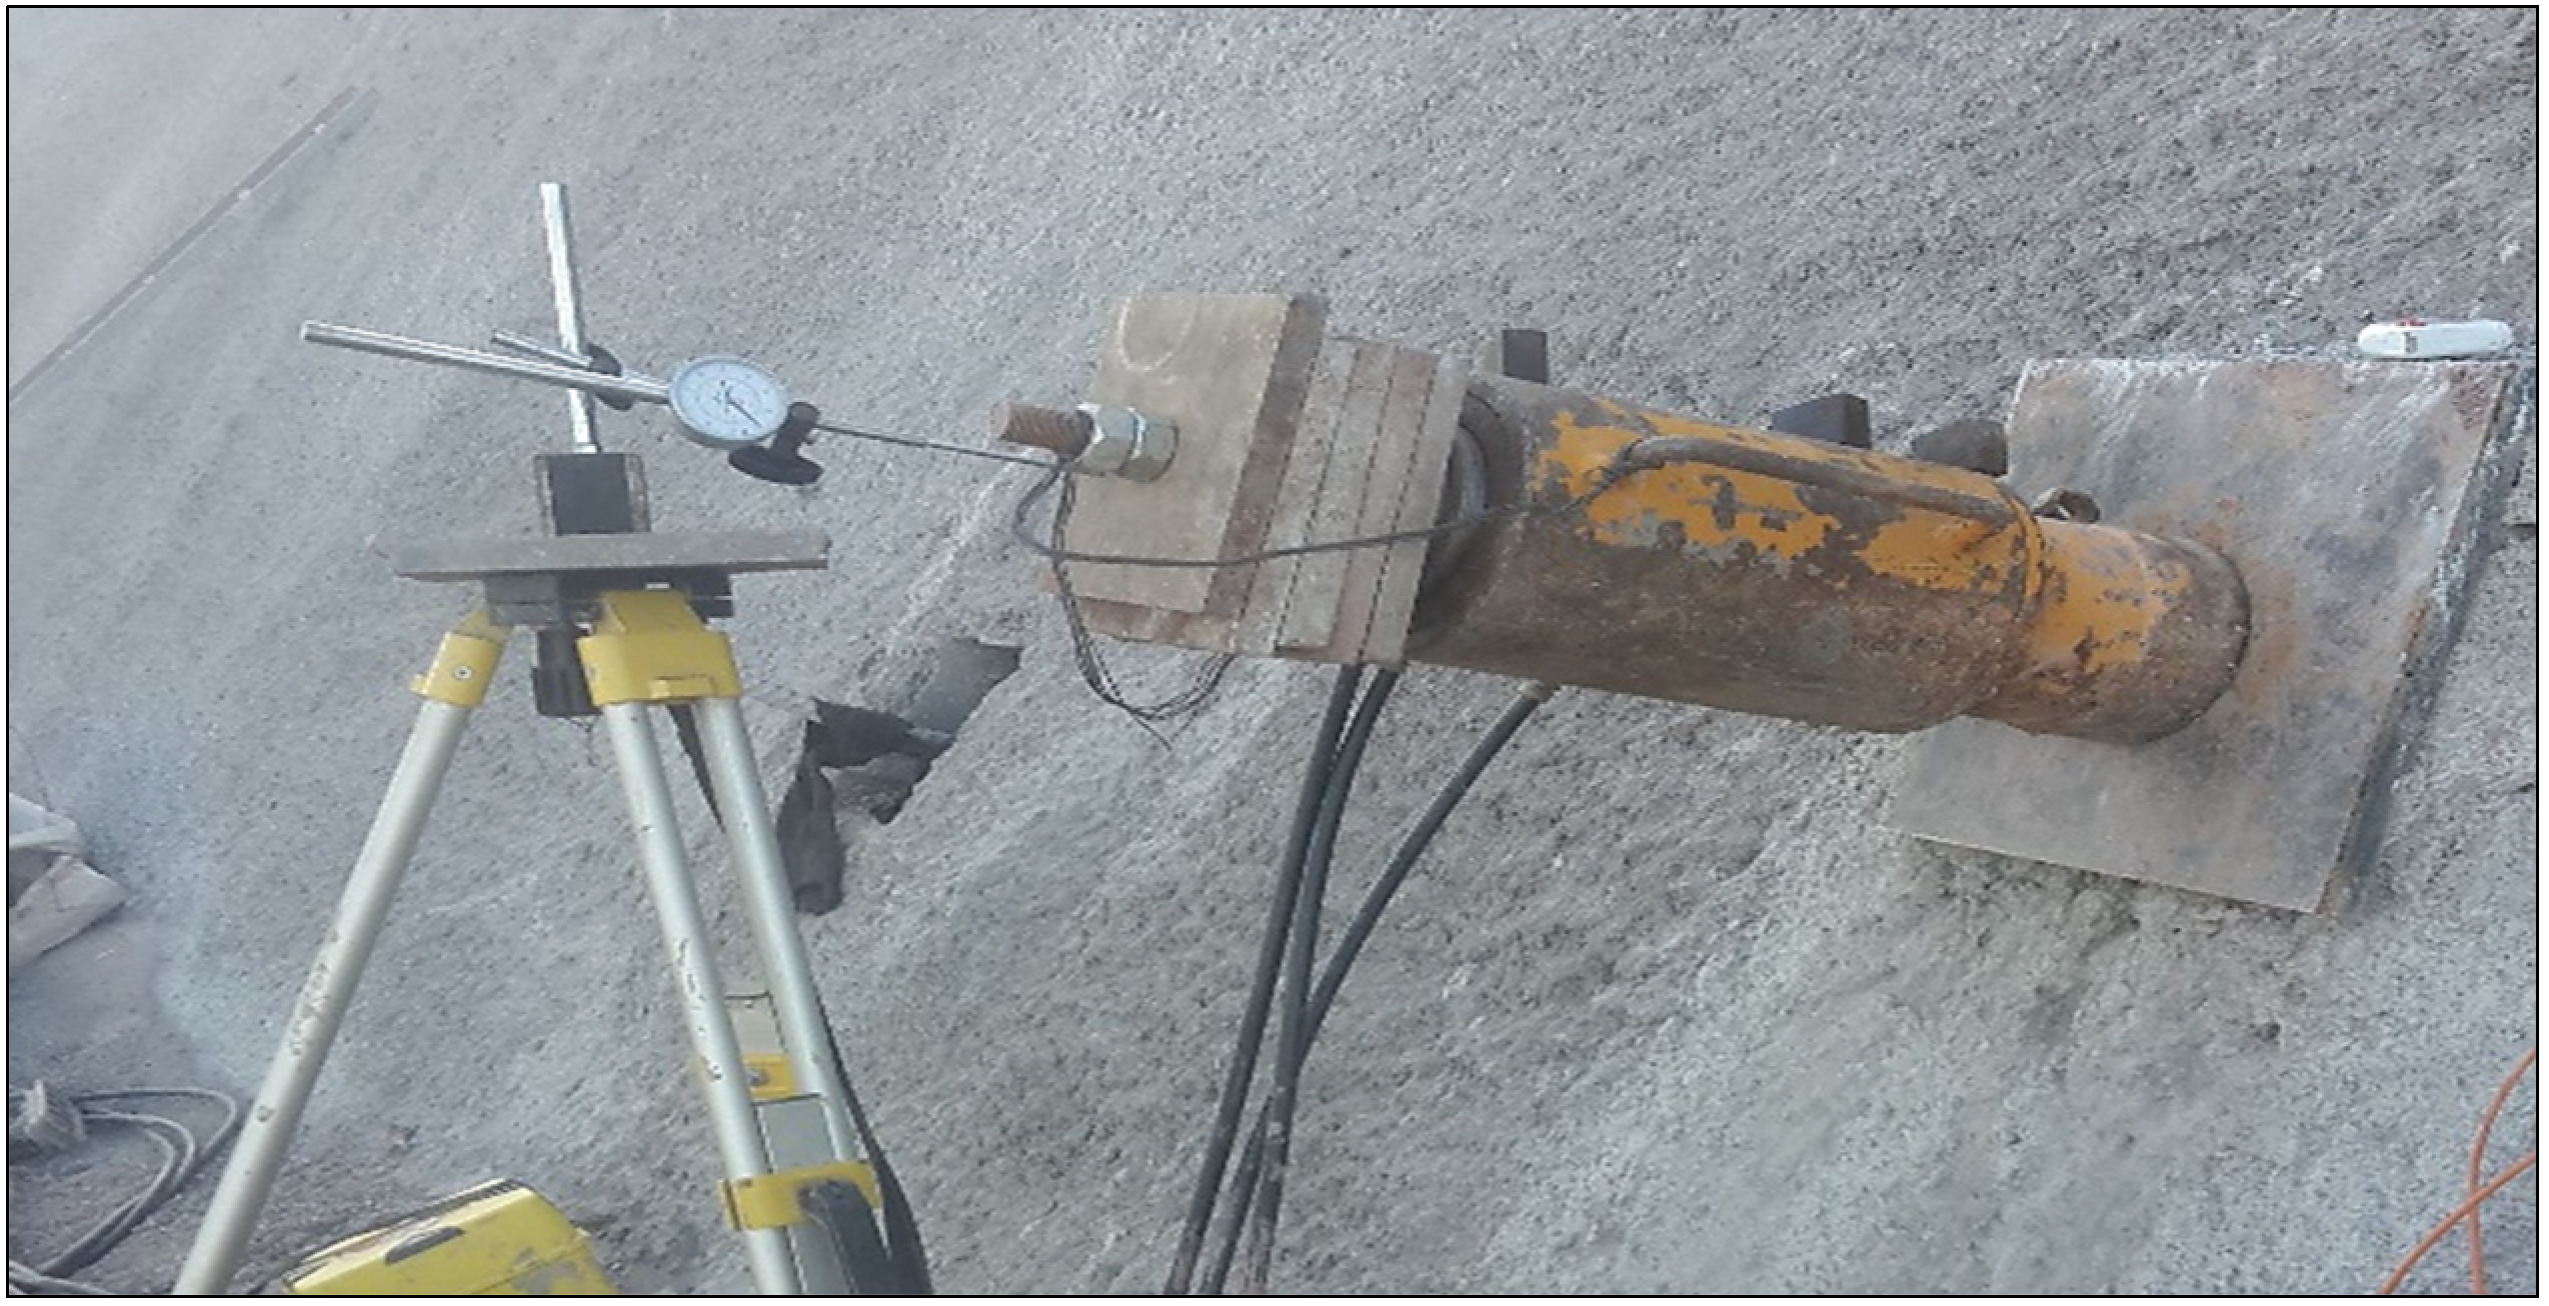
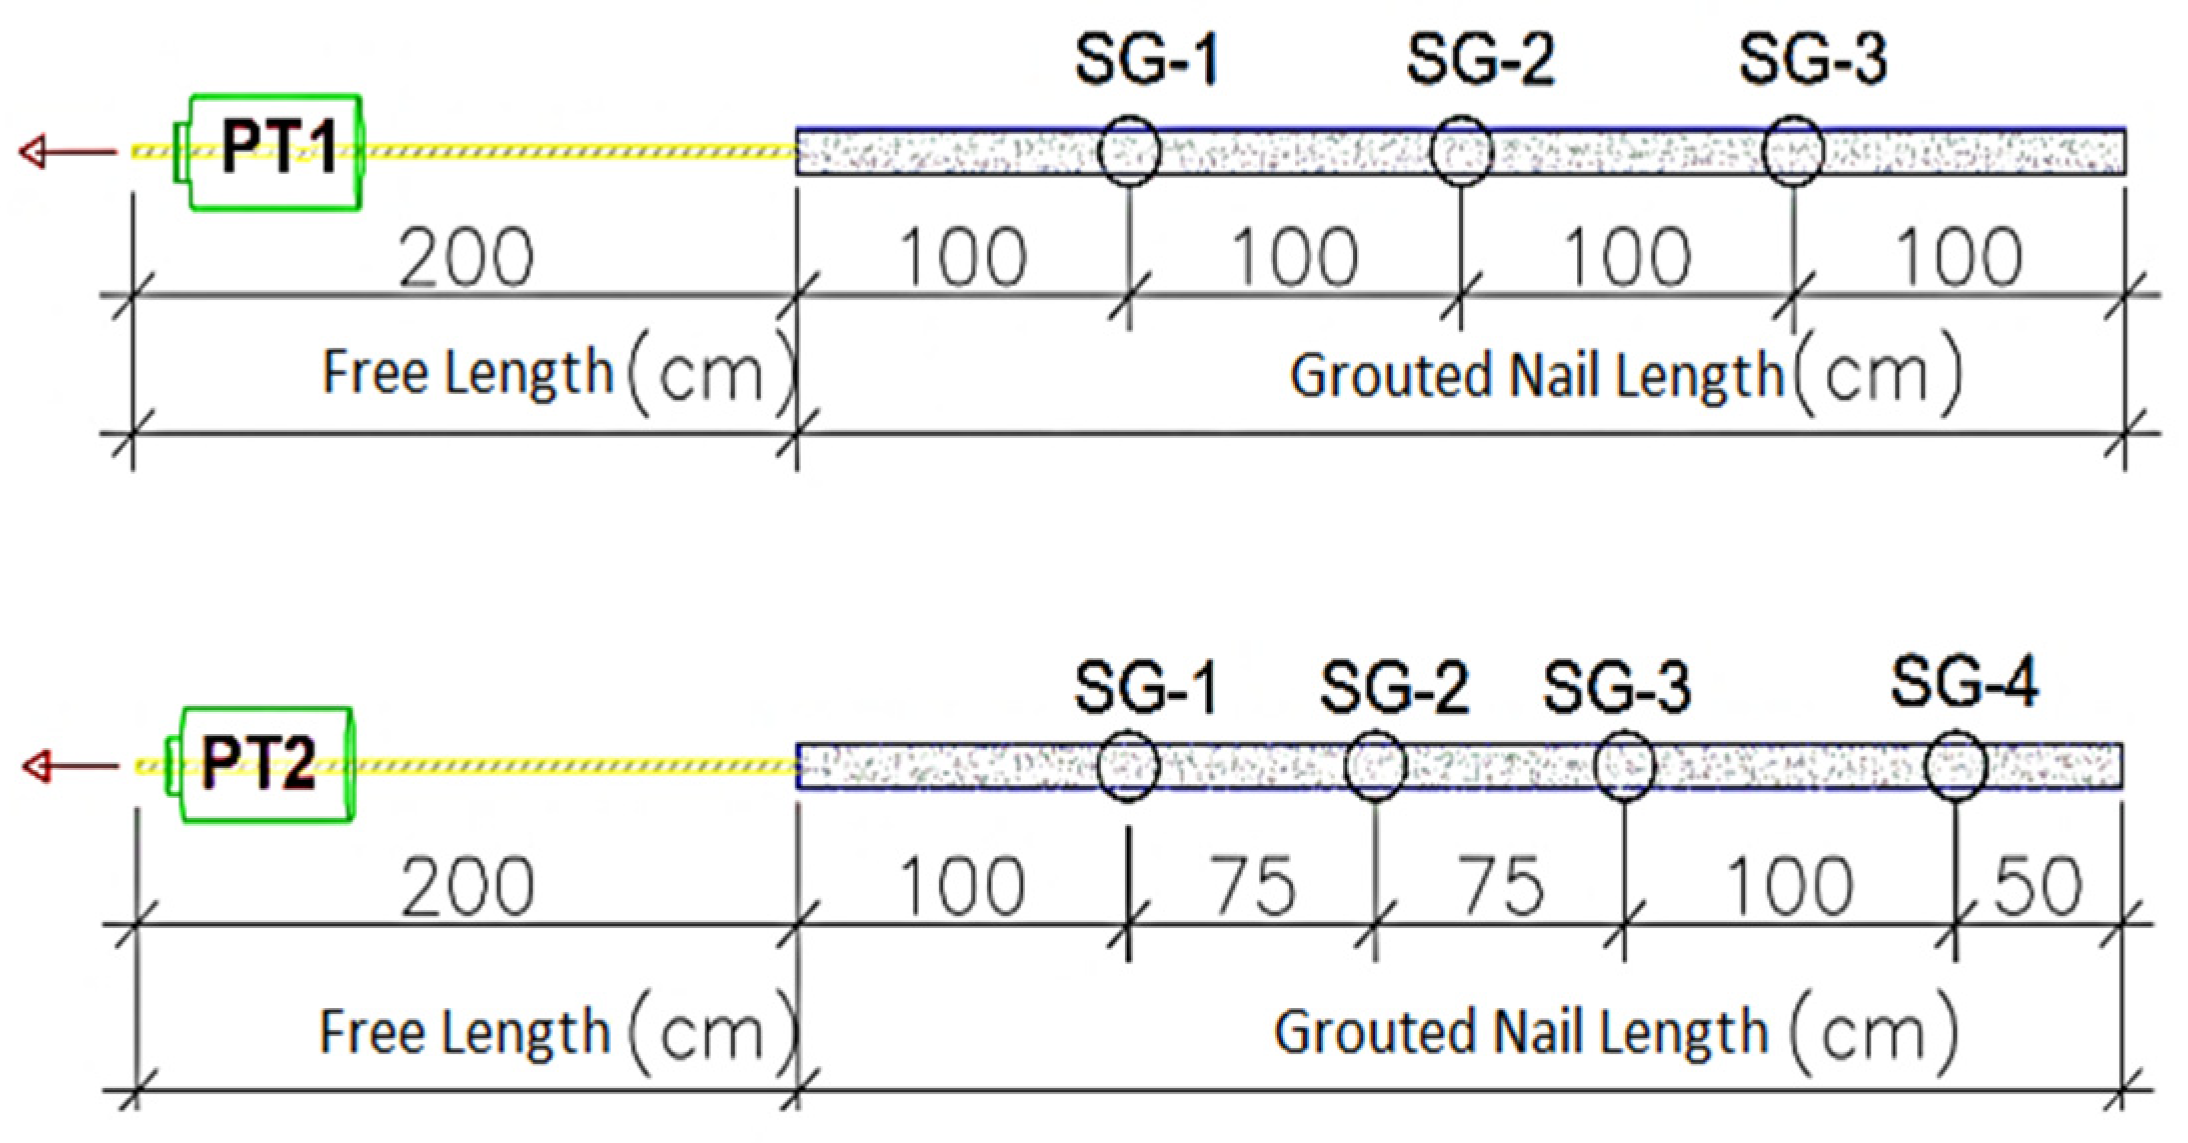
3.2.2. Soil Nail Pull-Out Tests Employing Strain Gauge Sensors
3.2.3. Examination of the Data Obtained from the Soil Nail Pull-Out Test
3.3. Design Review with Back-Analysis
3.3.1. The Hoek–Brown Constitution Model
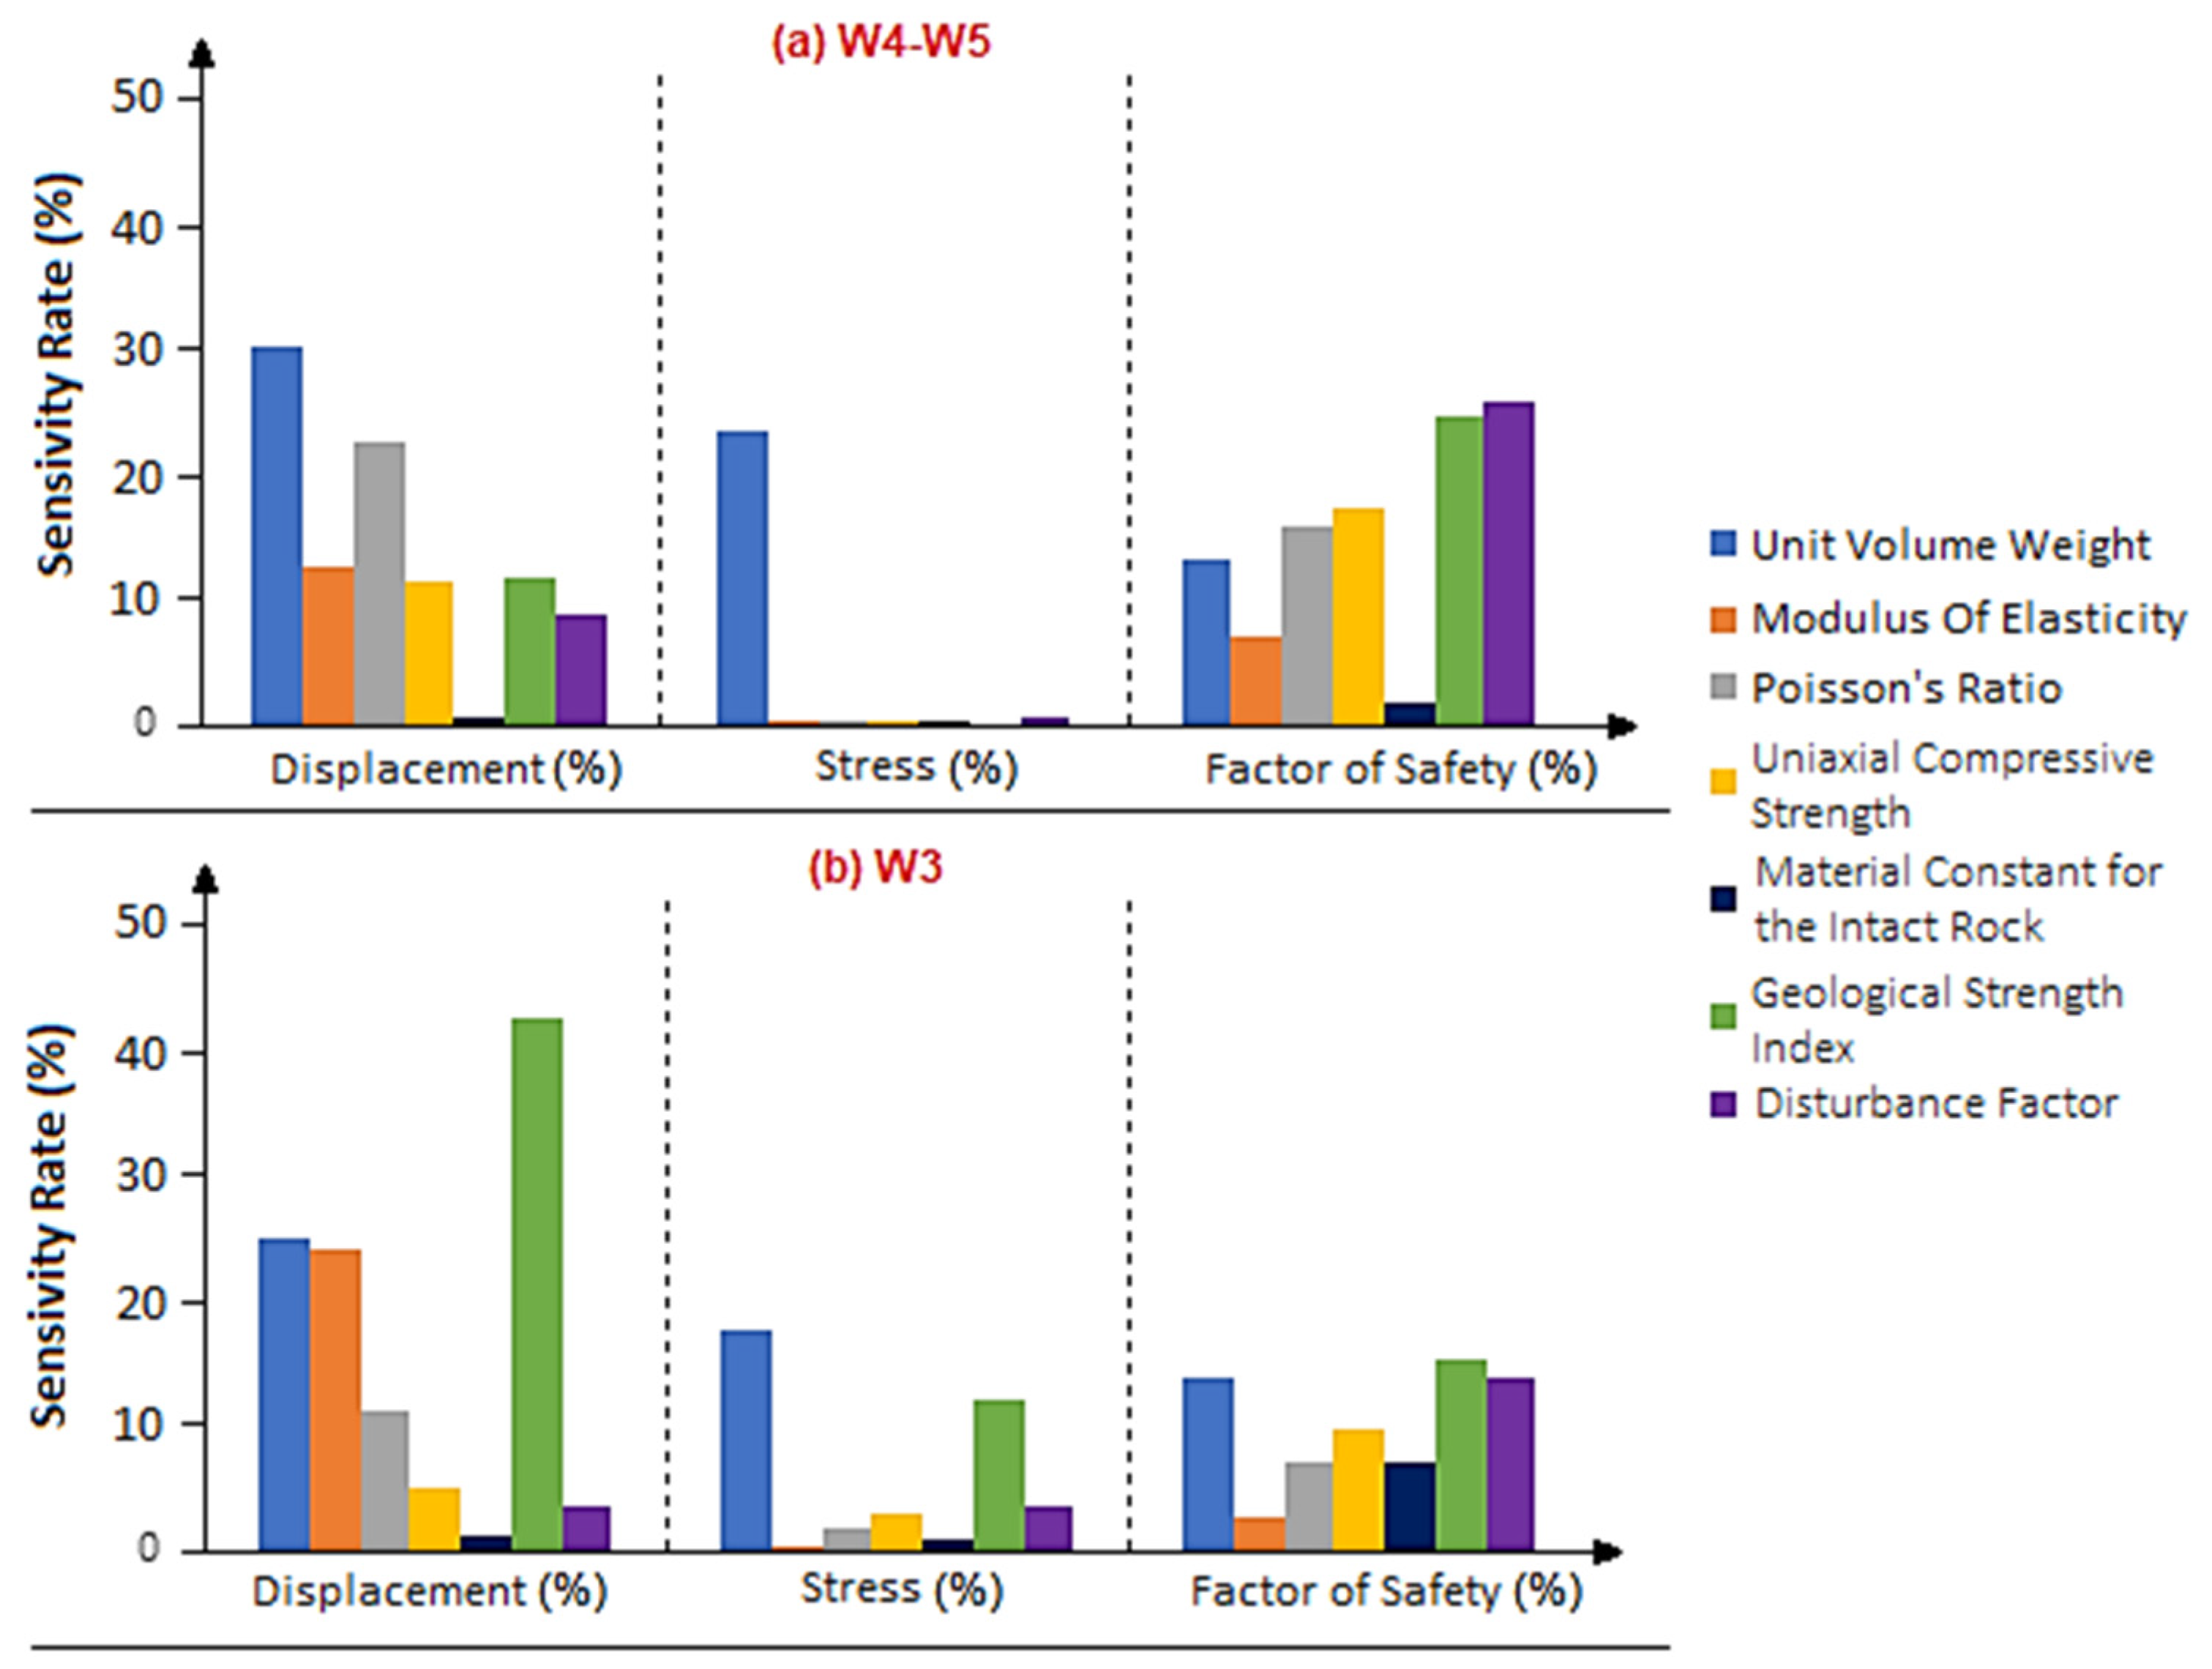
3.3.2. Sensitivity and Parameter Analysis
3.3.3. Parameter Analysis of GSI Using RMR
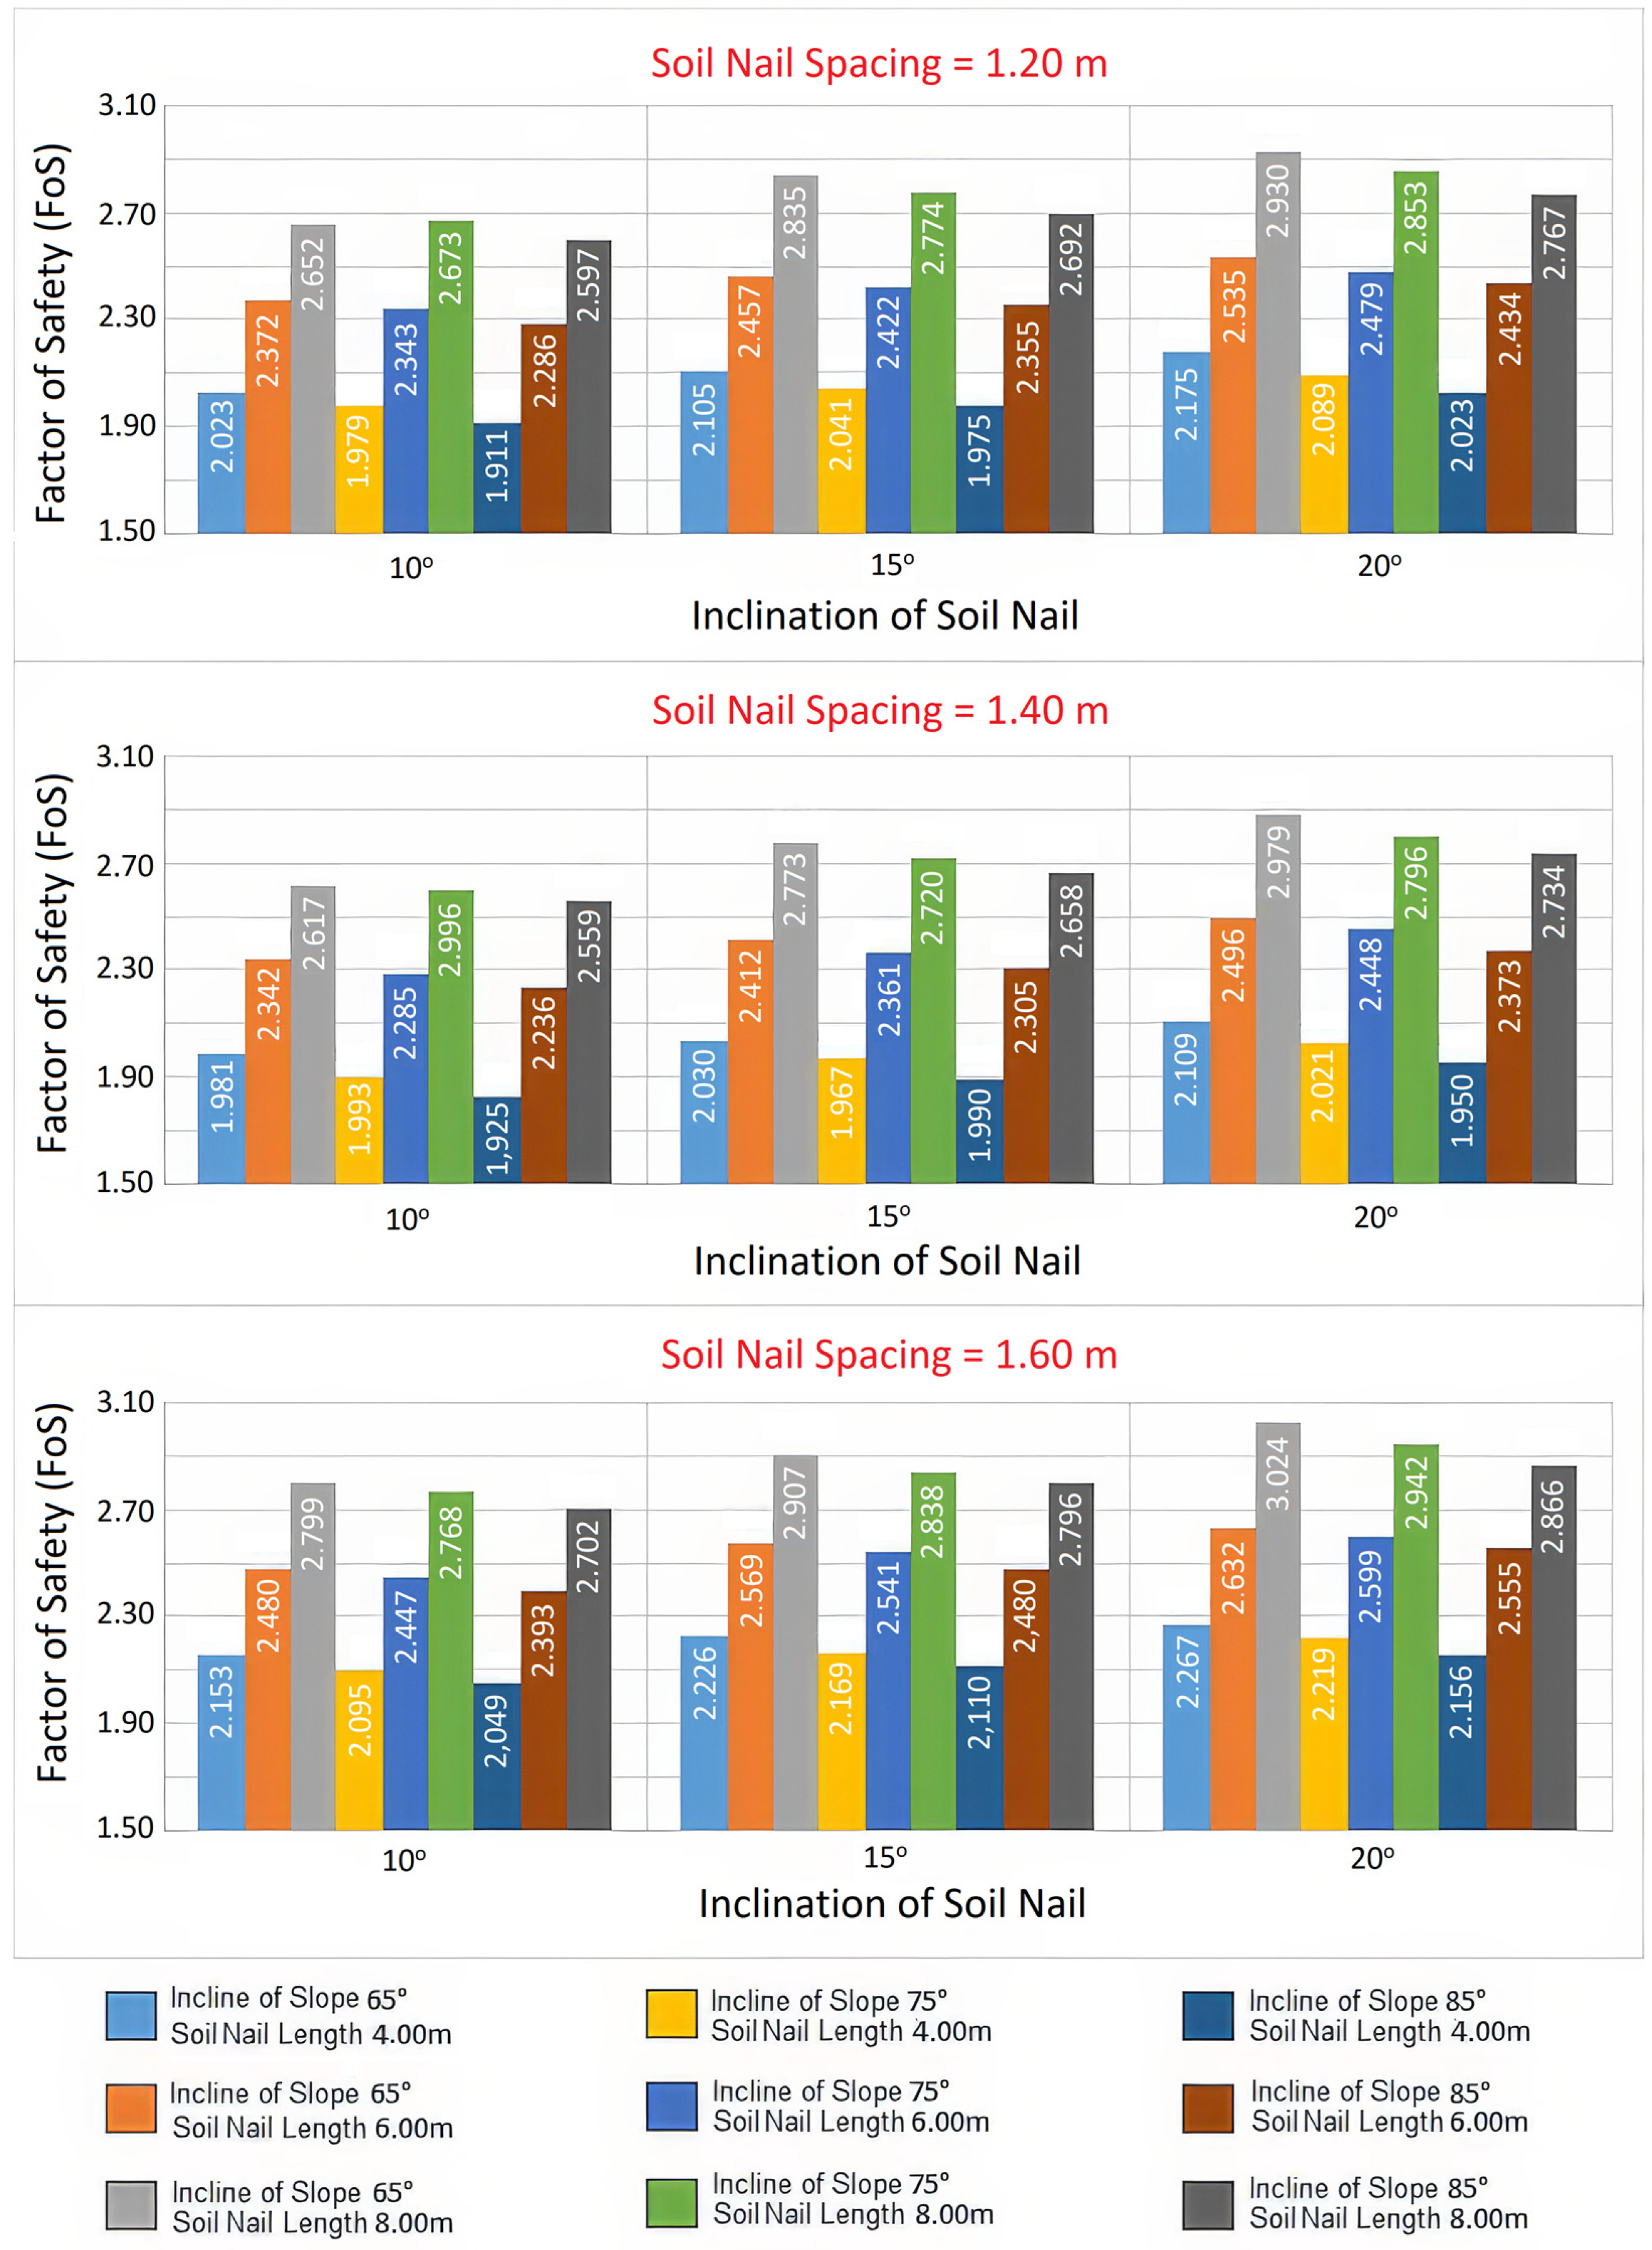
3.4. Geometric Parameter Analysis
4. Discussion and Conclusions
Author Contributions
Funding
Institutional Review Board Statement
Informed Consent Statement
Data Availability Statement
Conflicts of Interest
References
- Juran, I. Nailed-soil retaining structures: Design and practice. Transp. Res. Rec. 1987, 1119, 139–150. [Google Scholar]
- Durgunoğlu, H.T. Performance of deep soil nailed walls. In Proceedings of the International Conference on Case Histories in Geotechnical Engineering, Arlington, VA, USA, 12–16 August 2008. [Google Scholar]
- Lazarte, C.A.; Robinson, H.; Gómez, J.E.; Baxter, A.; Cadden, A.; Berg, R. Soil Nail Walls Reference Manual; No. FHWA-NHI-14-007; National Highway Institute, U.S. Department of Transportation Federal Highway Administration: Washington, DC, USA, 2015.
- Schloser, F. Behaviour and design of soil nailing. In Proceedings of the International Symposium Held at Asian Institute of Technology, Bangkok, Thailand, 29 November–3 December 1982; pp. 399–419. [Google Scholar]
- Mohamed, M.H.; Ahmed, M.; Mallick, J. Pullout Behavior of Nail Reinforcement in Nailed Soil Slope. Appl. Sci. 2021, 11, 6419. [Google Scholar] [CrossRef]
- Milligan, G.W.E.; Tei, K. The pull-out resistance of model soil nails. Soils Found. 1998, 38, 179–190. [Google Scholar] [CrossRef]
- Franzén, G. Soil Nailing—A Laboratory and Field Study of Pullout Capacity. Ph.D. Thesis, Department of Geotechnical Engineering, Chalmers University of Technology, Gothenburg, Sweden, 1998. [Google Scholar]
- Ruggeri, P.; Fruzzetti, V.M.E.; Scarpelli, G. The Behavior of a Thread-Bar Grouted Anchor in Soils from Local Strain Monitoring. Appl. Sci. 2020, 10, 7194. [Google Scholar] [CrossRef]
- Chu, L.M.; Yin, J.H. Comparison of Interface Shear Strength of Soil Nails Measured by Both Direct Shear Box Tests and Pullout Tests. J. Geotech. Geoenviron. Eng. 2005, 131, 1097–1107. [Google Scholar] [CrossRef]
- Babu, G.; Singh, V. Soil nails field pullout testing: Evaluation and applications. Int. J. Geotech. Eng. 2010, 4, 13–21. [Google Scholar] [CrossRef]
- Zhu, H.-H.; Yin, J.H.; Yeung, A.T.; Jin, W. Field pullout testing and performance evaluation of GFRP soil nails. J. Geotech. Geoenviron. Eng. 2011, 137, 633–642. [Google Scholar] [CrossRef]
- Cheng, Y.M.; Au, S.K.; Yeung, A.T. Laboratory and field evaluation of several types of soil nails for different geological conditions. Can. Geotech. J. 2016, 53, 634–645. [Google Scholar] [CrossRef]
- Xu, D.S.; Liu, H.B.; Luo, W.L. Evaluation of interface shear behavior of GFRP soil nails with a strain-transfer model and distributed fiber-optic sensors. Comput. Geotech. 2018, 95, 180–190. [Google Scholar] [CrossRef]
- Liao, Y.; Li, H.; Gao, K.; Ni, S.; Li, Y.; Chen, G.; Kong, Z. Study on Soil Stabilization and Slope Protection Effects of Different Plants on Fully Weathered Granite Backfill Slopes. Water 2024, 16, 2548. [Google Scholar] [CrossRef]
- Tian, H.J.; Kong, Z.G. Influence of Rainfall Intensity and Slope on the Slope Erosion of Longling Completely Weathered Granite. Appl. Sci. 2023, 13, 5295. [Google Scholar] [CrossRef]
- He, B.; Lin, M.; Yu, X.; Peng, G.; Huang, G.; Dai, S. Bearing Behavior of Large-Diameter Monopile Foundations of Offshore Wind Turbines in Weathered Residual Soil Seabeds. J. Mar. Sci. Eng. 2024, 12, 1785. [Google Scholar] [CrossRef]
- Wang, H.; Cheng, J.; Li, H.; Dun, Z.; Cheng, B. Full-scale field test on construction mechanical behaviors of retaining structure enhanced with soil nails and prestressed anchors. Appl. Sci. 2021, 11, 7928. [Google Scholar] [CrossRef]
- Kim, H.; Rehman, H.; Ali, W.; Naji, A.M.; Kim, J.J.; Kim, J.; Yoo, H. Classification of factors affecting the performance of fully grouted rock bolts with empirical classification systems. Appl. Sci. 2019, 9, 4781. [Google Scholar] [CrossRef]
- Abbas, H.A.; Mohamed, Z.; Kudus, S.A. Deformation behaviour, crack initiation and crack damage of weathered composite sandstone-shale by using the ultrasonic wave and the acoustic emission under uniaxial compressive stress. Int. J. Rock Mech. Min. Sci. 2023, 170, 105497. [Google Scholar] [CrossRef]
- Cai, G.; Liu, Q.; Yang, Y.; Zhou, A.; Li, X. Hydro-mechanical coupling effect on water permeability of intensely weathered sandstone. Can. Geotech. J. 2022, 60, 687–700. [Google Scholar] [CrossRef]
- ISRM. Suggested Methods for the Rock Characterization, Testing and Monitoring; ISRM Commission on Testing Methods; Pergamon Press: Oxford, UK, 1981. [Google Scholar]
- ISRM. The complete ISRM suggested methods for rock characterization, testing and monitoring: 1974–2006. In Suggested Methods Prepared by the Commission on Testing Methods; Ulusay, R., Hudson, J.A., Eds.; ISRM, Compilation Arranged by the ISRM Turkish National Group; Kozan Ofset: Ankara, Turkey, 2007. [Google Scholar]
- ASTM D7263-21; Standard Test Methods for Laboratory Determination of Density and Unit Weight of Soil Specimens. ASTM International: West Conshohocken, PA, USA, 2021.
- Bolton, M.D. Reinforced Soil Laboratory Testing and Modelling. Performance of Reinforced Soil Structures. In Proceedings of the International Reinforced Soil Conference, Glasgow, UK, 10–12 September 1990. [Google Scholar]
- Yin, J.H.; Jin, W.; Yeung, A.T.; Mak, L.M. Performance evaluation of electrical strain gauges and optical fiber sensors in field soil nail pullout tests. In Proceedings of the HKIE Geotechnical Division Annual Seminar; Hong Kong Institution of Engineers: Hong Kong, 2007; pp. 249–254. [Google Scholar]
- Choi, H.; Choi, S.; Cha, H. Structural health monitoring system based on strain gauge enabled wireless sensor nodes. In Proceedings of the 5th International Conference on Networked Sensing Systems, Kanazawa, Japan, 17–19 June 2008; pp. 211–214. [Google Scholar]
- Zhu, H.H.; Yin, J.H.; Jin, W.; Zhou, W.H. Soil nail monitoring using Fiber Bragg Grating sensors during pullout tests. In Proceedings of the Joint 60th Canadian Geotechnical and 8th IAH-CNC Conferences, Ottawa, ON, Canada, 21–24 October 2007; pp. 821–828. [Google Scholar]
- Hoek, E.; Brown, E.T. The Hoek–Brown failure criterion and GSI—2018 edition. J. Rock Mech. Geotech. Eng. 2019, 11, 445–463. [Google Scholar] [CrossRef]
- Brınkgreve, R.B.J. Selection of soil models and parameters for geotechnical engineering application. In Soil Constitutive Models: Evaluation, Selection, and Calibration, Proceedings of the Geo-Frontiers Congress, Austin, TX, USA, 24–26 January 2005; Yamamuro, J.A., Kaliakin, V.N., Eds.; American Society of Civil Engineers: Reston, VA, USA, 2005; pp. 69–98. [Google Scholar] [CrossRef]
- Brinkgreve, R.B.J.; Kumarswamy, S.; Swolfs, W.M. Plaxis, Reference Manual; PLAXIS BV: Delft, The Netherlands, 2017. [Google Scholar]
- Saeidi, A.; Cloutier, C.; Kamalibandpey, A.; Shahbazi, A. Evaluation of the Effect of Geomechanical Parameters and In Situ Stress on Tunnel Response Using Equivalent Mohr-Coulomb and Generalized Hoek-Brown Criteria. Geosciences 2022, 12, 262. [Google Scholar] [CrossRef]
- Dunnicliff, J. Geotechnical Instrumentation for Monitoring Field Performance, 1st ed.; John Wiley & Sons: New York, NY, USA, 1993; pp. 23–24. [Google Scholar]
- FHWA. Soil Nail Walls Reference Manual Developed Following: In AASHTO LRFD Bridge Design Specifications, 7th ed.; National Highway Institute, U.S. Department of Transportation Federal Highway Administration: Washington, DC, USA, 2015; pp. 241–261.
- GeoSense. VW Strain Gauge Manual: V. 1.8; GeoSense: Suffolk, UK, 2022; pp. 5–45. [Google Scholar]
- Byrne, R.J.; Cotton, D.; Porterfield, J.; Wolschlag, C.; Ueblacker, G. Manual for Design and Construction Monitoring of Soil Nail Walls; Revised Edition; Report No. FHWA-SA-96R; U.S. Department of Transportation, Federal Highway Administration: Washington, DC, USA, 1998.
- Gui, M.-W.; Rajak, R.P. Responses of Structural Components of a Full-Scale Nailed Retaining Structure under the Influence of Surcharge Loading and Nail Head Configuration: A Numerical Study. Buildings 2023, 13, 561. [Google Scholar] [CrossRef]
- Li, C.; Zhao, X.; Xu, X.; Qu, X. Study on the differences between Hoek–Brown parameters and equivalent Mohr–Coulomb parameters in the calculation slope critical acceleration and permanent displacement. Sci. Rep. 2024, 14, 15128. [Google Scholar] [CrossRef]
- Villalobos, S.A.; Villalobos, F.A. Effect of nail spacing on the global stability of soil nailed walls using limit equilibrium and finite element methods. Transp. Geotech. 2021, 26, 100454. [Google Scholar] [CrossRef]
- Sert, S.; Önalp, A. Derin Kazılarda Hassaslık ve Parametre Değişimi Analizi. In Proceedings of the Geoteknik Sempozyumu, Çukurova Üniversitesi, Adana, Turkey, 5–7 December 2011. [Google Scholar]
- Brinkgreve, R.; Laera, A.; Burg, M. New Developments in PLAXIS: Material Point Method and Reliability Analysis. In Proceedings of the Workshop on Numerical Methods in Geotechnics, Hamburg, Germany, 27–28 September 2017; pp. 73–87. [Google Scholar]
- Narimani, S.; Davarpanah, S.M.; Bar, N.; Török, Á.; Vásárhelyi, B. Geological Strength Index Relationships with the Q-System and Q-Slope. Sustainability 2023, 15, 11233. [Google Scholar] [CrossRef]
- Bienawski, Z.T. Engineering Rock Mass Classifications; Wiley: New York, NY, USA, 1989; p. 251. [Google Scholar]
- Pham, N.T.; Bing, P.; Nguyen, N.V. Study on the effect of some parameters of soil nails on the stability of vertical slopes. J. Min. Earth Sci. 2020, 61, 30–37. [Google Scholar] [CrossRef] [PubMed]
- Gokgoz, A.; Kelesoglu, M.K. Three Dimensional Finite Difference Analysis of Key Parameters Affecting the Stability and the Performance of Nailed Walls. KSCE J. Civ. Eng. 2024, 29, 100027. [Google Scholar] [CrossRef]
- Mohamed, M.H.; Ahmed, M.; Mallick, J.; AlQadhi, S. Finite Element Modeling of the Soil-Nailing Process in Nailed-Soil Slopes. Appl. Sci. 2023, 13, 2139. [Google Scholar] [CrossRef]


| Weathering Term | Degree of Weathering | Typical Features (kN/m3) |
|---|---|---|
| Residual Soil | W6 | All rock material is converted into soil. The mass structure and material fabric are destroyed. There is a large change in volume, but the soil has not been significantly transposed |
| Completely Weathered | W5 | All rock material is decomposed and/or disintegrated into soil. The original mass structure is still largely intact |
| Highly Weathered | W4 | More than half of the rock material is decomposed or has disintegrated into soil. Fresh or discolored rock is present either as a continuous framework or as core stone |
| Moderately Weathered | W3 | Less than half of the rock material is decomposed or has disintegrated into soil. Fresh or discolored rock is present either as a discontinuous framework or as core stones |
| Slightly Weathered | W2 | Discoloration indicates weathering of rock material and discontinuity surfaces. All rock material may be discolored by weathering |
| Fresh Rock | W1 | No visible signs of rock material weathering. There is perhaps slight discoloration on the major discontinuity surface |
| Borehole | Depth (m) | SPT-N Values |
|---|---|---|
| BH-19 | 1.50–1.95 | 9 |
| BH-19 | 3.00–3.45 | R |
| BH-23 | 1.50–1.95 | R |
| BH-24 | 1.50–1.95 | R |
| BH-24 | 3.00–3.45 | 33 |
| Parameter | Symbol | Unit | Value | |
|---|---|---|---|---|
| Normal Stiffness | EA | kN/m | 2.32 × 10⁵ | |
| Drilling Hole Diameter | Dh | m | 0.127 | |
| Rebar Diameter | dr | m | 0.028 | |
| Soil Nail | Rebar Elasticity Modulus | Er | kN/m2 | 2.11 × 10⁸ |
| Grout Elasticity Modulus | Eg | kN/m2 | 3.8 × 10⁶ | |
| Horizontal Spacing | Sh | m | 1.60 | |
| Rebar Length | Lx | m | 4.00–6.00 | |
| Normal Stiffness | EA | kN/m | 2.5 × 10⁶ | |
| Shotcrete | Flexural Stiffness | EI | kN/m2/m | 8333 |
| Thickness | d | m | 0.2 | |
| Poisson’s Ratio | ʋ | - | 0.2 |
| Parameter | Symbol | Unit | W3 Sandstone | W4 Sandstone |
|---|---|---|---|---|
| Modulus of Elasticity | E | MPa | 417 | 40 |
| Unit Weight | γ | kN/m3 | 26 | 21 |
| Cohesion | c | kPa | 87 | 5 |
| Internal Friction Angle | Φ | ° | 32 | 26 |
| Poisson’s Ratio | ʋ | - | 0.25 | 0.25 |
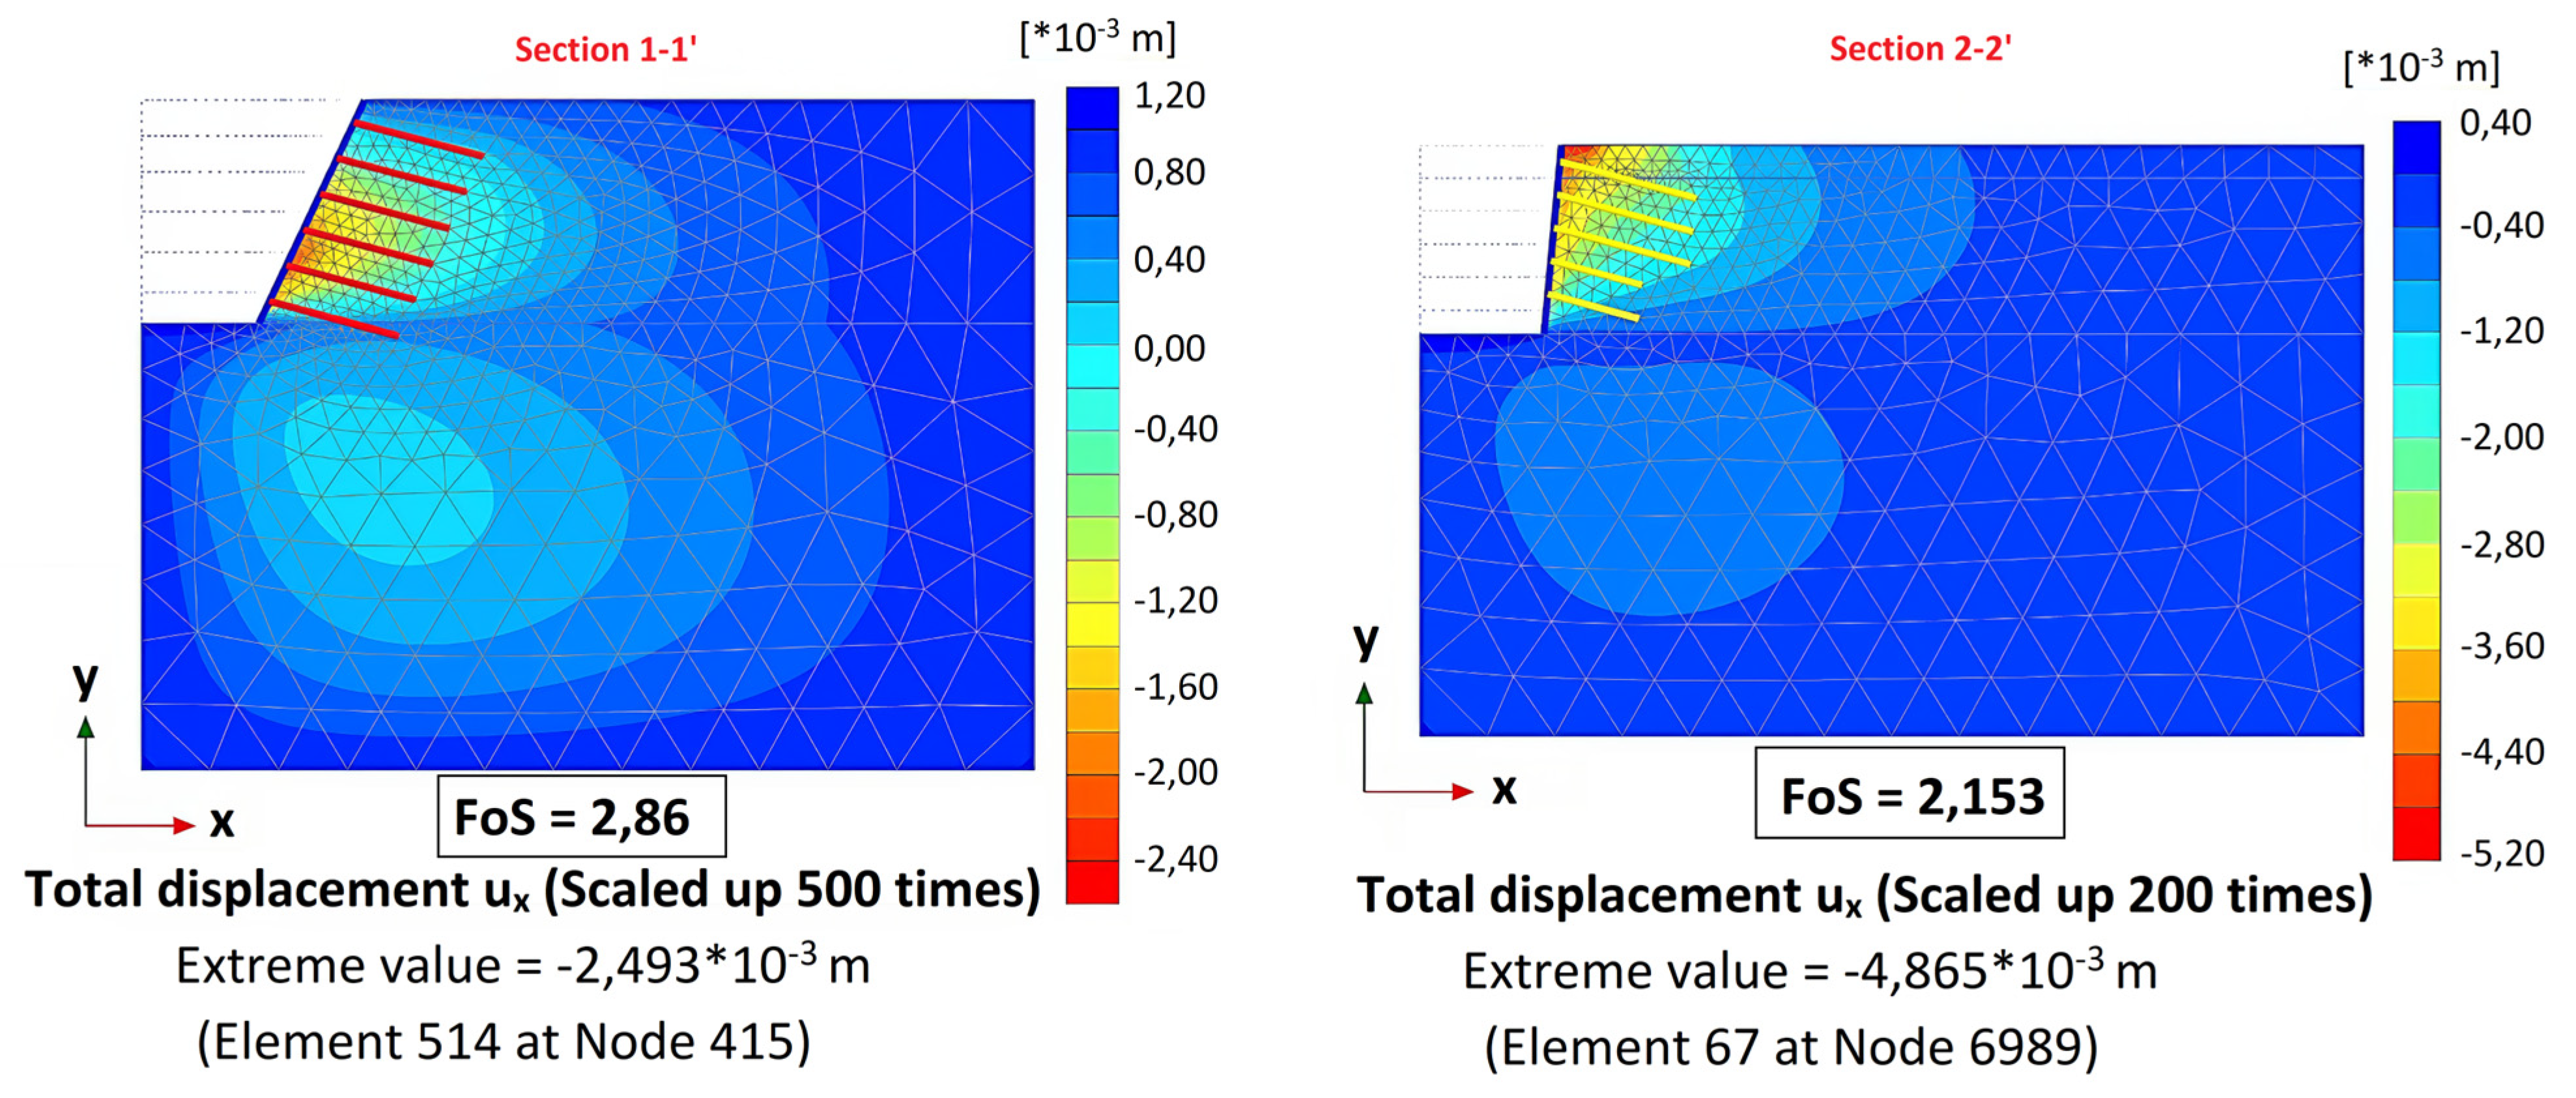
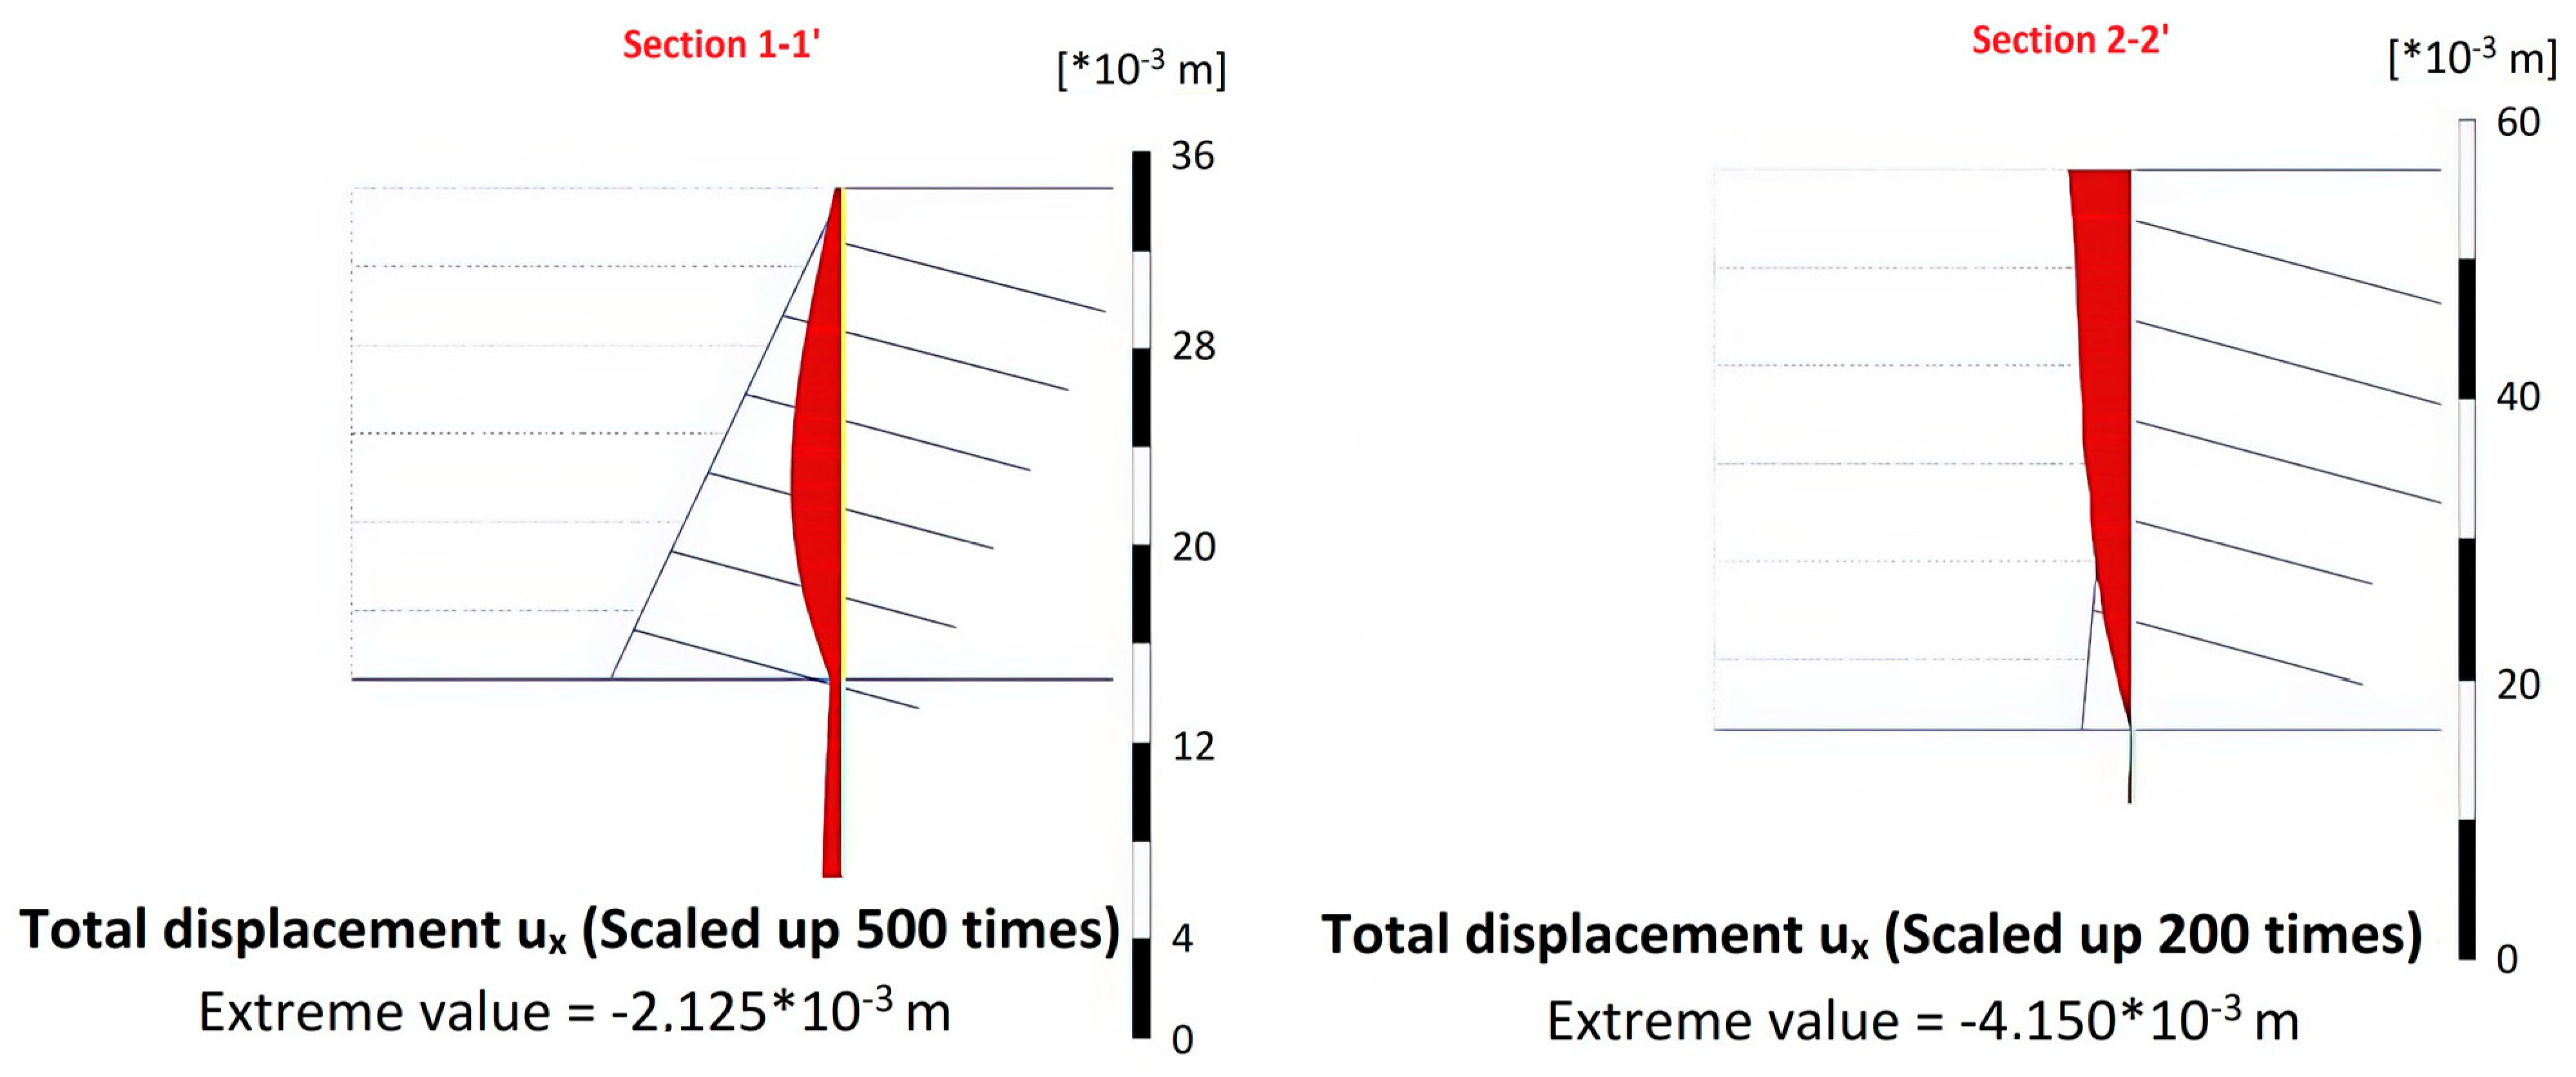
| ux | Section 1–1′ | Section 2–2′ |
|---|---|---|
| Preliminary Design | 2.22 | 1.53 |
| Field Measurement | 0.23 | 0.39 |
| Load Stage * DL | 0.125 DL | 0.25 DL | 0.50 DL | 0.75 DL | 1.00 DL | 1.25 DL | 1.50 DL | 1.75 DL | 2.00 DL |
| Time Period (min) | 1 | 10 | 10 | 10 | 10 | 10 | 10 | 10 | 10 |
| Parameter | Value | Unit |
|---|---|---|
| Strain Gauge Factor | 3.962 | Micro-strain/digit |
| Rebar Cross-Sectional Area (Ar = 28 mm) | 6.16 × 10⁻⁴ | m2 |
| Rebar Cross-Sectional Area (Ar = 40 mm) | 50.24 × 10⁻⁴ | m2 |
| Grout Cross-Sectional Area (Ag) | 1.13 × 10⁻² | m2 |
| Rebar Elasticity Modulus (Er) | 2.11 × 10⁸ | kN/m2 |
| Grout Elasticity Modulus (Eg) | 10 × 106 | kN/m2 |
| Avera Elasticity Modulus (Eave) | 21 × 106 | kN/m2 |
| Grout Factor (Gf) | 5.4 × 10⁻¹⁰ | kN/m2 |
| Parameter | Symbol | Unit | (%-25) Min. | Ref.Val | Max. (%+25) | |
|---|---|---|---|---|---|---|
| Highly Weathered to Completely Weathered Sandstone W4-W5 | Weight per unit of volume | γ | kN/m3 | 16 | 21 | 26 |
| Elasticity modulus | E | MPa | 22.5 | 30 | 37.5 | |
| Poisson’s ratio | ν | - | 0.15 | 0.2 | 0.25 | |
| Uniaxial compressive strength | σci | MPa | 12 | 16 | 20 | |
| Material constant for intact rock | mi | - | 13 | 17 | 21 | |
| Geological strength index | GSI | - | 20 | 25 | 30 | |
| Disturbance factor | D | - | 0.5 | 0.7 | 0.8 | |
| Weight per unit of volume | γ | kN/m3 | 20 | 26 | 30 | |
| Elasticity modulus | E | MPa | 225 | 300 | 375 | |
| Moderately | Poisson’s ratio | ν | - | 0.15 | 0.2 | 0.25 |
| Weathered Sandstone | Uniaxial compressive strength | σci | MPa | 16 | 20 | 25 |
| W3 | Material constant for intact rock | mi | - | 13 | 17 | 21 |
| Geological strength index | GSI | - | 30 | 40 | 50 | |
| Disturbance factor | D | - | 0.5 | 0.7 | 0.8 |
| Parameter | Highly Weathered to Completely Weathered Sandstone | Moderately Weathered Sandstone |
|---|---|---|
| Average qu (MPa) | 12 | 25 |
| RMR Score | 2 | 4 |
| RQD (%) | 0–25 | 25–50 |
| RMR Score | 3 | 8 |
| Discontinuity Spacing (mm) | <60 | 200–600 mm |
| RMR Score | 5 | 10 |
| Discontinuity Status | Fault filling and 1–5 mm open joints | Slightly rough surfaces, separation of <1 mm, hard joint surfaces |
| RMR Score | 10 | 15 |
| Groundwater | Moist | Trickle |
| RMR Score | 10 | 4 |
| Total RMR Score | 30 | 41 |
| Total GSI Score (RMR-5) | 25 | 36 |
| Parameter | Symbol | Unit | Moderately Weathered Sandstone | Completely Weathered Sandstone |
|---|---|---|---|---|
| Unit weight | γ | kN/m3 | 26 | 21 |
| Elasticity modulus | E | MPa | 280 | 100 |
| Poisson’s ratio | ν | - | 0.25 | 0.25 |
| Uniaxial compressive strength | |σci| | MPa | 25 | 12 |
| Material constant for intact rock | mi | - | 17 | 13 |
| Geological strength index | GSI | - | 36 | 25 |
| Disturbance factor | D | - | 0.7 | 0.7 |
| Inclination of Slope (°) | Soil Nail Spacing (m) | Inclination of Soil Nail (°) | Soil Nail Length (m) |
|---|---|---|---|
| 65 | 1.20 | 10 | 4.00 |
| 75 | 1.40 | 15 | 6.00 |
| 85 | 1.50 | 20 | 8.00 |
Disclaimer/Publisher’s Note: The statements, opinions and data contained in all publications are solely those of the individual author(s) and contributor(s) and not of MDPI and/or the editor(s). MDPI and/or the editor(s) disclaim responsibility for any injury to people or property resulting from any ideas, methods, instructions or products referred to in the content. |
© 2025 by the authors. Licensee MDPI, Basel, Switzerland. This article is an open access article distributed under the terms and conditions of the Creative Commons Attribution (CC BY) license (https://creativecommons.org/licenses/by/4.0/).
Share and Cite
Yeni, A.; Selçuk, M.E.; Ündül, Ö. Evaluation of the Performance of Soil-Nailed Walls in Weathered Sandstones Utilizing Instrumental Data. Appl. Sci. 2025, 15, 2908. https://doi.org/10.3390/app15062908
Yeni A, Selçuk ME, Ündül Ö. Evaluation of the Performance of Soil-Nailed Walls in Weathered Sandstones Utilizing Instrumental Data. Applied Sciences. 2025; 15(6):2908. https://doi.org/10.3390/app15062908
Chicago/Turabian StyleYeni, Anıl, Murat Ergenokon Selçuk, and Ömer Ündül. 2025. "Evaluation of the Performance of Soil-Nailed Walls in Weathered Sandstones Utilizing Instrumental Data" Applied Sciences 15, no. 6: 2908. https://doi.org/10.3390/app15062908
APA StyleYeni, A., Selçuk, M. E., & Ündül, Ö. (2025). Evaluation of the Performance of Soil-Nailed Walls in Weathered Sandstones Utilizing Instrumental Data. Applied Sciences, 15(6), 2908. https://doi.org/10.3390/app15062908