1. Introduction
Performance in basketball depends on many factors, including players’ somatic build, technical–tactical and motor skills, and physiological and psychological preparation [
1]. Morphological characteristics of athletes differ according to sport and competition level, since their adaptation is essential to optimize sports performance [
2,
3]. In basketball, the impact of somatic parameters on players’ performance has been highlighted: higher stature, higher mesomorphy, and longer limbs are associated with higher scores and better physiological parameters [
4]. Somatotype, defined as the description of morphological components (endomorphy, mesomorphy and ectomorphy), is an effective tool for accurately evaluating suitable somatic parameters for a given sport [
1]. Male basketball players are likely to display a mesomorph somatotype, but there are also professional players from top teams with mixed and balanced somatotypes [
5]. However, the somatotype varies during growth and maturation: younger competitors appeared more ectomorphic than professional players, who tend to manifest higher mesomorphic values [
1]. It should be emphasized that the somatotype must consider all three components together and not separately. This could cause issues when analyzing the relationships between the somatotype and other parameters, as the components are often considered individually.
Another important factor to evaluate is body composition since it influences the training and performance of athletes [
6]. However, many factors influence its evaluation, such as age, maturation and constitution, and these should be considered. In addition, many techniques are available for body composition assessment in basketball samples, which range from simple indirect measures to more sophisticated direct volumetric measurements [
7]. The use of laboratory methods is limited due to their cost and complexity. In light of this, portable instruments such as bioelectrical impedance analysers (BIA) have become popular among athletes thanks to their ease of use, cost-effectiveness, and portability [
8]. BIA is a non-invasive method based on the electric properties of biological tissue in response to alternate low-voltage current flow. The biological impedance is defined as the ability of human tissues to impede electric current passage [
9]. Biological tissues act as conductive interfaces that oppose the current flow (resistance) and frequency (reactance): R represents the opposition to the flow of an alternating current through intra- and extracellular ionic solution, whereas Xc represents the capacitive component of tissue interfaces, cell membranes, and organelles [
10]. Due to the relatively low cost and the portability of the analyser, many studies on body composition and clinical condition evaluations have been carried out using this technique. Nevertheless, the accuracy of BIA in predicting body fat percentage (BF) may decrease in athletes with higher statures and longer body segments, due to overestimation of lean body mass [
11]. This critical aspect may be accounted for by evaluating taller samples, such as basketball players, and highlights the need to develop specific equations. An alternative methodological approach, qualitative analysis through Bioelectrical Impedance Vector Analysis (BIVA) overpasses typical concerns associated with the use of regression equations for predicting body composition and consists of the interpretation of the raw BIA parameters (resistance R and reactance Xc) related to the subject’s stature [
8].
BIVA’s ability to properly assess body composition over time was compared with gold-standard methods, such as the four-compartment model [
7], dilution technique [
11], and Dual Energy X-ray Absorptiometry (DXA) [
12], showing comparable results when assessing body fluid and soft-tissue changes in athletes during the competitive season.
BIVA data are scarce for athletes, particularly in adolescence, and their complementary use may be helpful for the evaluation of changes in nutrition and hydration states during growth and maturation.
Considering the rapid evolution of basketball in recent years, and how athletes’ physical and physiological profiles have changed, it is necessary to have up-to-date benchmarks, possibly on the best-performing population, also considering a qualitative approach, never applied to basketball players.
Thus, the present study aimed to determine the morphological characteristics of a sample of young elite basketball players, according to the somatotype and the BIVA methods, and develop reference tolerance ellipses for the BIVA point graph. In addition, it experiments with a new simple method to synthesize and easily acquire somatotypes. Reference values for basketball players are needed by researchers, coaches, and practitioners alike when evaluating players for talent identification and development.
2. Materials and Methods
2.1. Participants and Design
A cross-sectional study was carried out in a sample of 153 young basketball players (in the age categories under-12 (U12), under-13 (U13), under-14 (U14), under-15 (U15), under-17 (U17) and under-19 (U19), selected in basketball teams from the youth academy of the professional Italian basketball clubs—Virtus Bologna and Fortitudo Bologna—registered in the best Italian division (Serie A1)). In addition to tournament matches, the players trained for 4.5 h/week and one match (U12 and U13), 6 h/week and one match (U14 and U15), 7.5 h/week and one match (U17), and 10 h/week and one match (U19).
All the evaluations were assessed at the Sports Sciences laboratory of the University of Bologna between 1 January 2022, and 30 May 2024.
All the subjects volunteered to participate in the study, giving their verbal approval. Written informed consent was provided by the parents before the study began. The study was approved by the Bioethics Committee of the University of Bologna (approval code: 25027).
2.2. Procedures
Anthropometric characteristics were collected by a trained operator according to standardized procedures [
13]. Stature and sitting height were measured to the nearest 0.1 cm using a stadiometer (GPM, Zurich, Switzerland), and leg length was derived by the subtraction of sitting height from stature. Body weight was measured to the nearest 0.1 kg (light indoor clothing, without shoes) using a calibrated electronic scale. Circumferences (relaxed and contracted upper arm and calf) were measured to the nearest 0.1 cm with a non-stretchable tape, and widths (humerus and femur) to the nearest 0.1 cm with a sliding calliper. Skinfold thicknesses (triceps, subscapular, supraspinal, and calf) were measured to the nearest 1 mm using a Lange skinfold calliper (Beta Technology Inc., Houston, TX, USA). Each anthropometric variable was collected three times, and the mean value was considered.
Somatotype components (endomorphy, mesomorphy, ectomorphy) were calculated according to the Heath−Carter anthropometric method [
14]. The distance between any two somatopoints (somatotype attitudinal distance, SAD) was calculated. SAD measures the absolute difference between two somatotypes using component ratings. The SAD expresses how similar two somatotypes are: the smaller the SAD, the closer they are to each other. The three-dimensional counterpart of the somatotype dispersion mean is the somatotype attitudinal mean (SAM), and it was calculated as the average of the SADs of each somatopoint from the mean somatopoint (S) of the sample. The size of the SAM expresses the degree of homogeneity of the sample somatopoints about the mean. A small SAM indicates a tight cluster of somatopoints about S, while a large SAM indicates a wide scatter about S.
2.3. Maturity Status Evaluation
To obtain participants’ maturity status (MS) an estimation of the years from peak height velocity (PHV), as a proxy of the adolescent growth spurt, was calculated using the equation for boys developed by Mirwald and colleagues [
15]:
Maturity offset = −9.236 + 0.0002708 (leg length × sitting height) − 0.001663 (age × leg length) + 0.007216 (age × sitting height) + 0.02292 (weight/stature).
The years from PHV were calculated by subtracting the estimated age at PHV from chronological age. Each subject was classified as early, on-time, or late maturers based on age at PHV [
16,
17].
2.4. Bioelectric Impedance Vector Analysis (BIVA)
Impedance measurements were performed with a hand-to-foot bioimpedance analyser (BIA BIVAPRO, Akern, Florence, Italy) using an electric current at a frequency of 50 kHz. Measurements were made using four electrical conductors; the subjects were supine with a lower limb angle of 45° compared to the median line of the body and the upper limb angle of 30° from the trunk. After cleansing the skin with alcohol, two Ag/AgCl low impedance electrodes (Biatrodes Akern Srl, Florence, Italy) were placed on the back of the right hand and two electrodes were placed on the corresponding foot [
18]. To avoid disturbances in fluid distribution, athletes were instructed to abstain from foods and liquids for ≥4 h before the test. Vector length (VL) was calculated as (adjusted R
2 + adjusted Xc
2) × 0.5 and PA as the arctangent of Xc/R × 180°/π. BIVA was carried out using the classic methods, e.g., normalizing R (Ω) and Xc (Ω) for stature (m) [
19]. To describe the BIVA results, each team category-subdivided MS was plotted in the tolerance ellipses (50%, 75%, and 95%) of the reference values for an athletic population [
18]. In addition, the tolerance ellipses (50%, 75%, and 95%) of the U17 and U19 basketball players of the presented teams were created and plotted as reference values for younger categories.
2.5. Statistical Analysis
All the statistical analyses were performed with STATA 18.5 Standard Edition (StataCorp, College Station, TX, USA) for Windows. Mean and standard deviation (SD) have been computed to synthesize and describe continuous variables. Frequency of appearance (%) was computed for qualitative variables.
To estimate the statistical power achieved for the ANOVA test with the sample size, we computed a post hoc analysis with the following parameters: type I error = 0.05; sample size = 153; delta = 0.3873; number of groups = 10; between-group variance = 0.15. This power yields 0.9217.
Curves’ behaviours and distributions were checked with graphic instruments and appropriate statistical tests (Shapiro–Wilk). Differences between expected and observed frequencies have been compared with the chi-squared test. Pairwise correlations among anthropometrical and bioelectrical parameters were computed using the Pearson product–moment coefficient (ρ).
The analysis of variance (ANOVA) was performed on all anthropometric features to test the differences between age and MS categories. When a significant Snedecor–Fisher value (F) was obtained, the Tukey post–hoc test was used to evaluate marginal effects. To discover the relationship between more than two components, principal component analysis (PCA) was performed to reduce the linear dimensionality of somatotypes into one component. An eigenvalue greater than one was considered to be a good decomposition. The percentage of variance was explained, and regression coefficients were computed. A type I error probability of 5% was settled on.
3. Results
Concerning MS, regardless of chronological age, there were no late maturers, and the frequency of on-time maturers was higher than that of early maturers, ranging from 80.6% in U14 to 58.1% in U15. However, the differences among age groups were not significant (Χ2 = 4.59, p = 0.205).
Table 1 shows the anthropometrical and bioelectrical characteristics of participants stratified by age categories and MS, and reports the overall comparison between layers.
MS and age presented a significant influence on all the considered parameters, except for subscapular and supraspinal skinfolds and endomorphy and ectomorphy. However, the Tukey post hoc analysis showed no significant differences in mesomorphy between groups (
Table S1).
In particular, regarding weight, height, sitting height, and lower limb length, significant differences were observed according to age and MS, except between early-maturing U15 and athletes in the older age groups (
Table S1).
As regards the circumferences and humeral and femoral widths, the differences were fewer and concerned exclusively those between the extreme age and maturation groups, mainly affecting the younger athletes compared to the early maturers in U15, U17 and U19.
Tricep skinfolds significantly differed between on-time maturers in U12 and U17 basketball players, while medial calf skinfolds were significant among on-time U12, U13, U15, U17, and U19 groups.
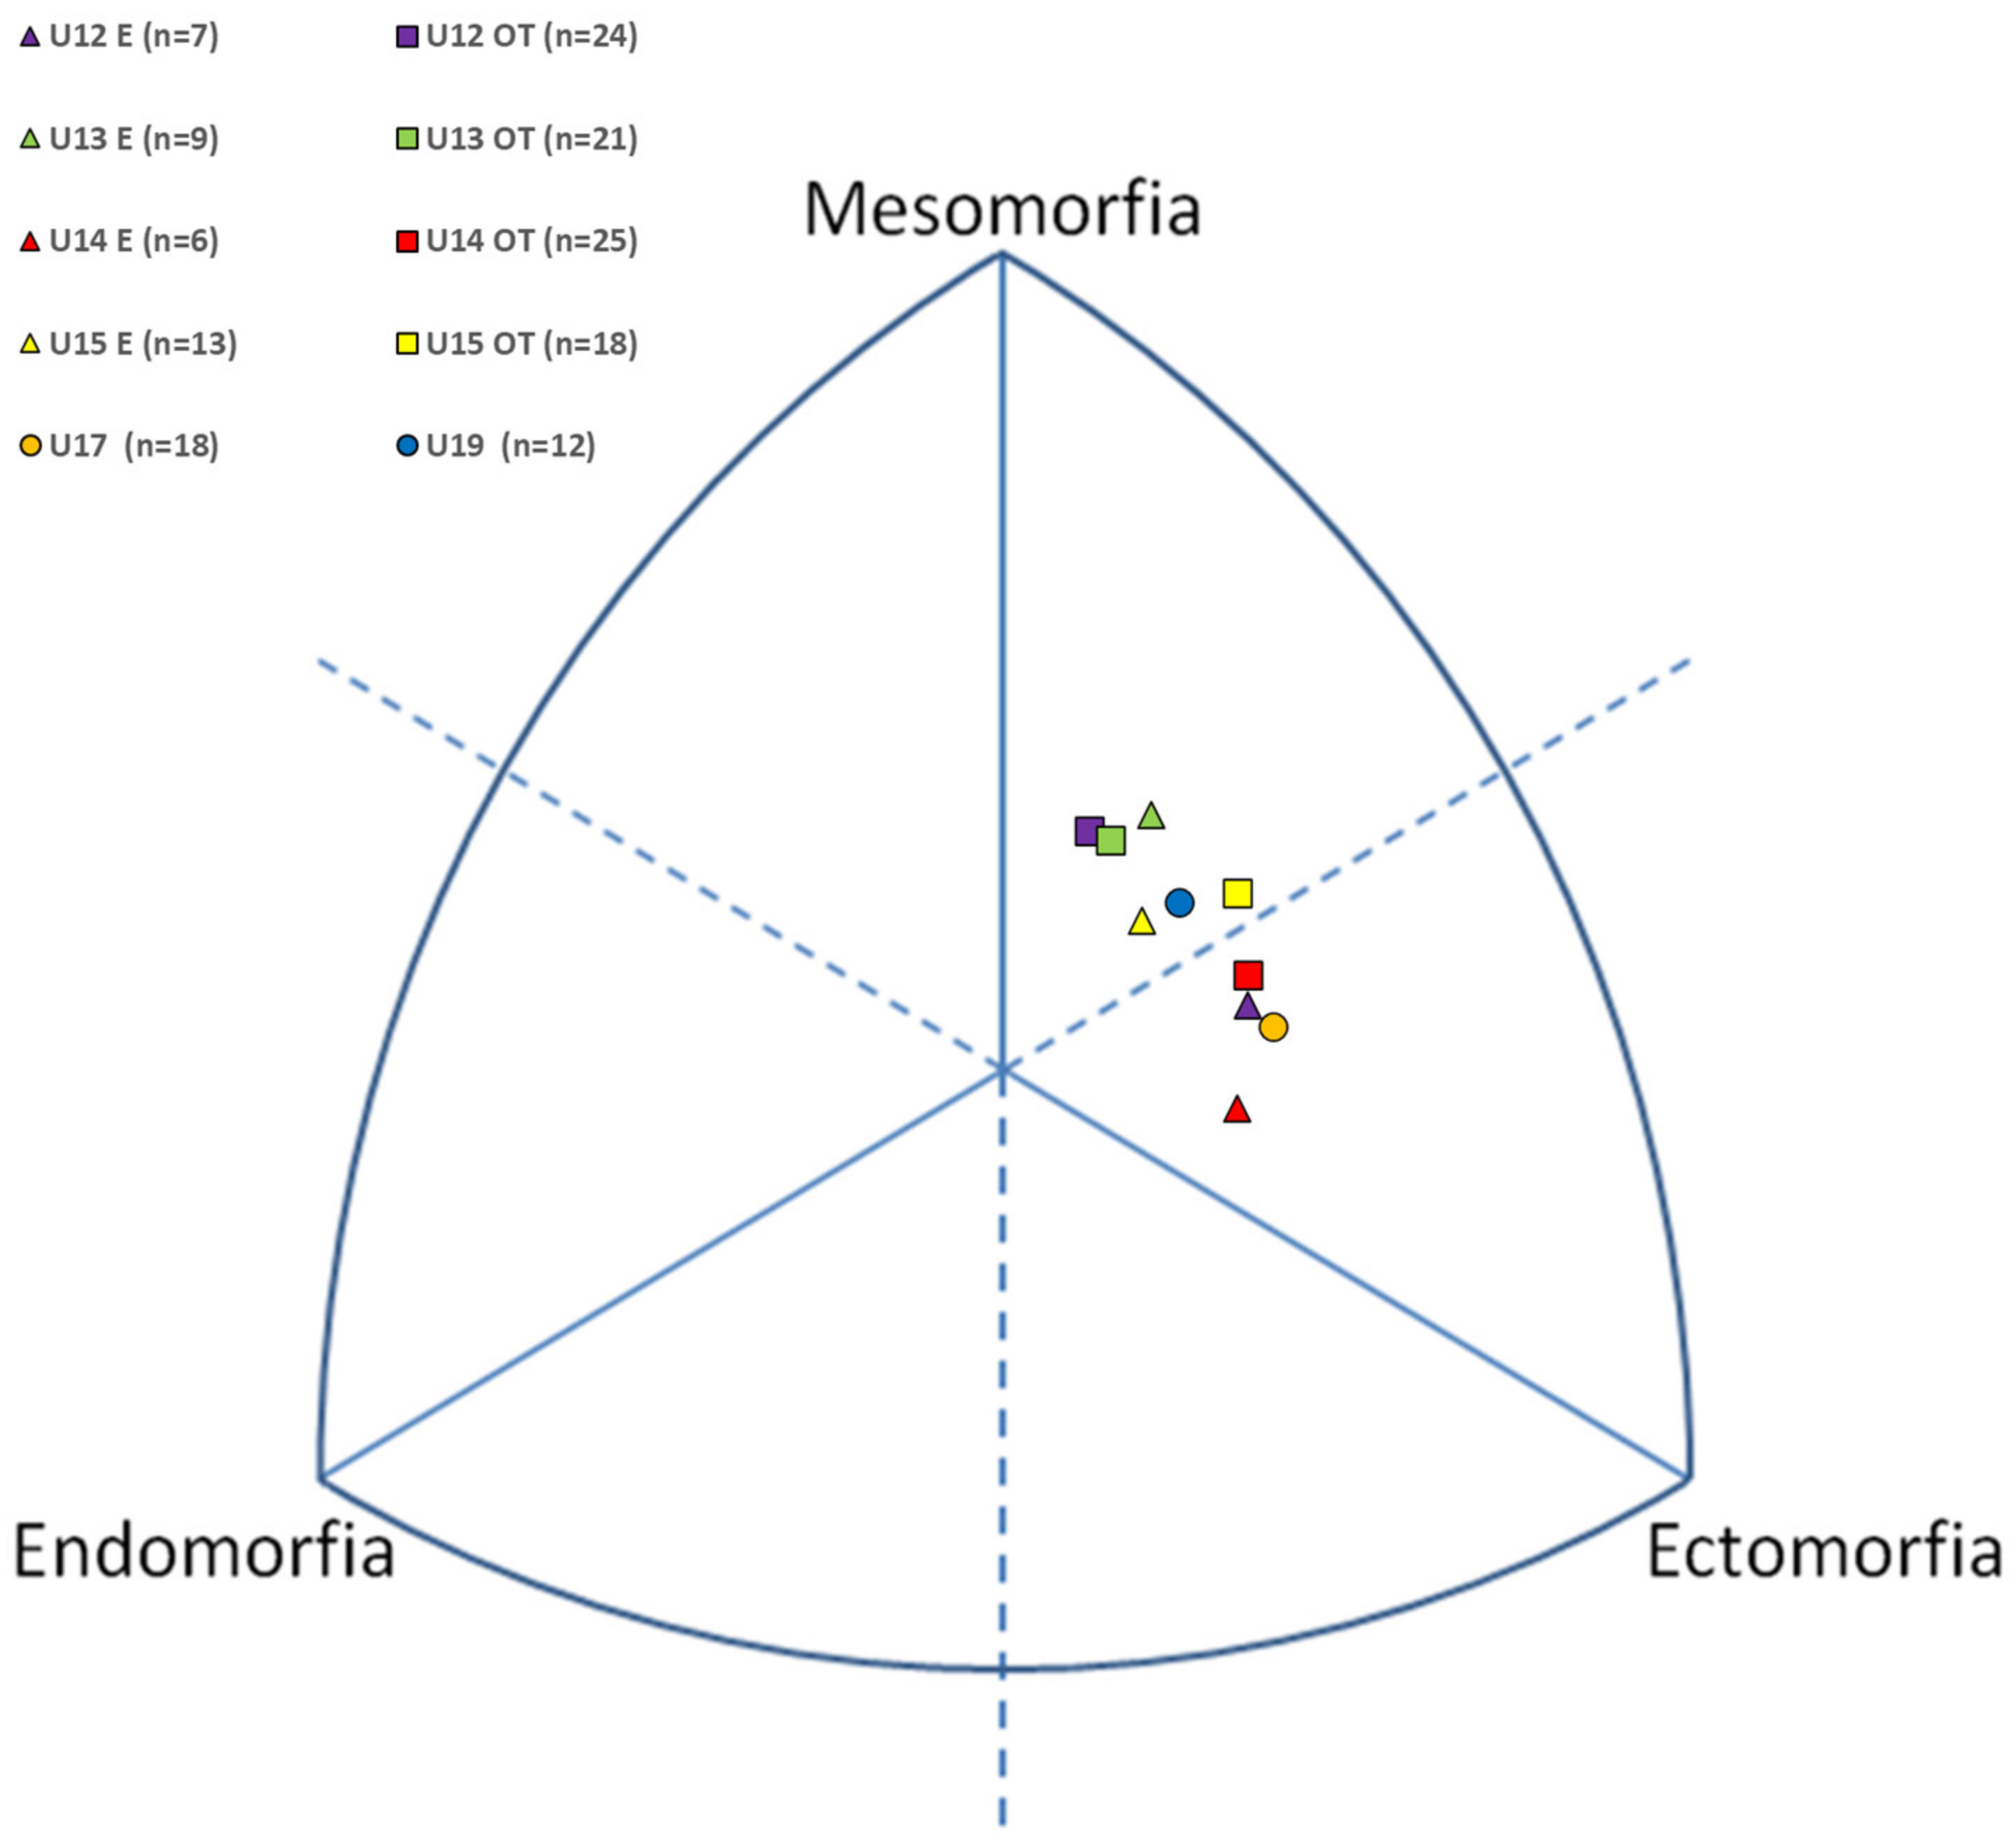
As regards the average somatotypes of the athletes of the different groups, it is possible to classify them into three categories: the majority were mesomorph–ectomorph (U12E, U14OT, U15OT, U15E and U19) type, followed by ectomorphic–mesomorph (U12OT, U13OT and U13E) and by mesomorphic–ectomorph (U14E and U17) (
Figure 1). The SAD is very small, from a minimum of 0.09 in U19 to a maximum of 1.02 in U14, indicating that each somatotype was closer to its mean (S = 2.3–3.9–3.7). As a consequence, the degree of homogeneity of the sample’s somatopoints around the mean (SAM = 0.53 ± 0.59) is high, indicating a tight cluster of somatopoints around S.
Resistance and Phase Angle (PhA) showed significant differences between younger players (U12, U13, and U14 on-time) and athletes in the older age groups (U15–U19), while, for reactance, the differences were detected only between on-time U12 and U17 (
Table S1). When R and Xc were corrected by stature, significant differences increased, and the on-time U12 group differed from all other age groups.
Figure 2A shows the mean vectors of the basketball players grouped by age category and MS on the R–Xc graph of the reference values for an athletic population [
19], while in
Figure 2B the values of the mean vectors of U12–15 athletes were plotted on the R–Xc graph, proposed in this study as a reference for the U17 and U19 basketball players. Compared to the reference tolerance ellipses for an athletic population (
Figure 2A), early maturers of U15, U17 and U19 entered the 50° percentile, on-time maturers of U15 entered the 75° percentile and early maturers of U13 and U14 the 95° percentile. Distant from the ellipses, and other groups, were U12E, U13OT, and U14OT. On-time U12 was very distant from the reference ellipses.
Figure 2B shows that early maturers of U15 entered the 50° percentile of the basketballer reference population, on-time maturers of U15 entered the 75° percentile, and early maturers of U13 the 95° percentile. The early maturers of U14 were placed near the ellipses but not inside. A group further away from the ellipses was represented by the categories early maturers of U12 and on-time maturers of U13 and U14, while on-time U12 members were even further apart.
Figure 3A shows the relationship between the BIA PhA and the interaction of age categories and mesomorphy. The slopes show a linear trend with ageing and increments in muscle–skeletal systems [U13 vs. U12: contrast = −0.095 (−0.30, 0.11), F = 0.87,
p = 0.354; U14 vs. <U14: contrast = 0.179 (−0.07; 0.43), F = 2.01,
p = 0.158; U15 vs. <U15: contrast = 0.789 (0.52; 1.06), F = 32.98,
p < 0.001; U17 vs. <U17: contrast = 1.00 (0.75; 1.26), F = 60.16,
p < 0.001; U19 vs. <U19: contrast = 0.867 (0.55; 1.18), F = 30.09,
p < 0.001].
Figure 3B shows all slopes plotted in a single scatter graph.
Figure 4A shows the relationship between the first component resulting from the PCA and the somatotype components. The first component explains 80.74% of the variance (eigenvalue = 2.42), with a standard error of 0.023 and a measurement bias of 0.004. The coefficients were −0.614 (CI:−0.65, −0.58; z = −37.86,
p < 0.001), 0.568 (CI: 0.51, 0.63), z = 19.58,
p < 0.001) and 0.547 (CI: 0.48, 0.61; z = 16.54,
p < 0.001) for ecto, meso and endomorphy, respectively, and the PCA component can be estimated as −1.66204 + (0.648 × endomorphy) + (0.5127 × mesomorphy) − (0.493 × ectomorphy). In addition, PCA can be predicted by each component separately as follows:
- (a)
−3.6368 + 1.5837 × endomorphy (R2 = 0.723, RMSE = 0.819);
- (b)
−4.842 + 1.2385 × mesomorphy (R2 = 0.784, RMSE = 0.722);
- (c)
4.4294 − 1.1889 × ectomorphy (R2 = 0.915, RMSE = 0.454).
Figure 4B represents the relationship between the PCA component and BIA parameters, where the PCA component increases with PhA and decreases with both R and Xc, linearly. Due to BIA parameters’ logarithmic scaling, each increment of 1% in Ω corresponds to a unit incrementation in PCA. However, when adjusted by age, the PCA component showed significant results only with Xc [β = −10.961 (−20.97, −0.96), t = −2.17,
p = 0.032] and PhA [β = 11.39 (1.22, 21.56), t = −2.21,
p = 0.028].
4. Discussion
This study aimed to evaluate the influence of age and maturation on anthropometric characteristics, somatotype, and BIVA patterns in elite youth basketball players and to propose new tolerance ellipses for basketball players.
The considered traits showed an increasing trend with age and MS, except for the skinfold thicknesses and R. These differences confirmed that fat parameters decrease with age and maturation in elite adolescent players. PhA was influenced by age and maturation, based on studies on young athletes from other sports [
20,
21,
22].
The distribution of somatotypes of the U12–19 players of the present study is homogeneous, mainly covering the area of the somatogram close to meso- and ectomorphy, with the majority being mesomorph–ectomorph, followed by ectomorphic mesomorph and mesomorphic ectomorph. As the main authors reported [
14], our results represent somatic traits composed of wide prevalence of stature-related musculoskeletal robustness and slenderness, where both mesomorphy and ectomorphy were greater than endomorphy (fatness). No particular trend was detected with age and maturation. Considering the group as a whole, the mean somatotype of young players was characterized by the following code: 2.3–3.9–3.7, indicating that the average young player had an ectomorphic mesomorphic body. Few studies considered the somatotype of young basketball athletes, and our data agree with the somatotype of the young male basketball players studied by Gryko et al. [
1] (2.12–3.75–4.17). In the same study, the authors reported that young competitors were more ectomorphic, while professional players were more mesomorphic (2.26–4.57–3.04). Popovic and colleagues observed that male basketball players are likely to display a mesomorph somatotype, but there are also professional players from top teams with mixed and balanced somatotypes [
4].
Concerning to the BIVA approach, the 50%, 75%, and 95% confidence intervals allow total body water (TBW) and soft tissues (e.g., bone content and fat-free mass) to be evaluated within reference population-specific ranges. We observed a trend from the upper right towards the lower left, aimed at the 50th percentile in the R–Xc graph, where the U17 and U19 groups were placed exactly in the ellipse’s centre, showing a body composition akin to the athletic population. In addition, the athletes in the U13E, U14E, and U15 groups were plotted inside the tolerance ellipses, but not U12, 13OT, and U14OT. This highlights the importance of considering biological maturity when evaluating differences in growth patterns in young athletes. The BIVA vector reflects the changes in TBW and lean tissue. Therefore, younger athletes with an advanced MS showed body compositions similar to those of adult athletes. This is due to the increase in soft tissue and fluid, which is primarily related to somatic maturation. Our detection is in line with previous results, where body compositions of adolescent elite football players were analyzed in relation to maturation [
22]. When younger categories were observed in U17–U19 tolerance ellipses, we observed a homogeneous trend from the upper right towards the lower left, where only early and elder players approach the centre. In synthesis, the mean vector displacement of early-maturing athletes indicates that, to achieve the body composition of the basketball player profile, an increase in TBW and intra/extra cellular water ratio is necessary, shortening the vector length and increasing the slope. To our knowledge, this is the first study that evaluates the changes in the BIVA patterns and body composition in relation to MS and chronological age in elite youth basketball players. Although the changes detected are in accordance with expected physiology, no specific comparisons can be made.
One additional goal of this study was to relate BIA parameters and somatotypes. The relationship between PhA and mesomorphy showed a linear positive trend with age categories. Previous studies have considered only the association between PhA and body composition parameters. However, the muscular–skeletal structure models within adolescents in bone robustness and muscular hypertrophy (cells’ cross-sectional area and density [
23]. Boys’ peak bone mass is expected to occur at 14.1 ± 0.95 years [
24], fastening through anatomical and mechanical interaction with jointed muscles. Physical efforts and movements lead to this interaction, enhancing somatic and biological growth [
25].
Incrementation with age exhibited a strong correlation close to the end of somatic maturation when a great amount of musculoskeletal growth occurred. In agreement with our results, a recent review reported that the PhA was directly associated with lean mass and muscle mass in different age groups [
9]. In addition, most studies found a direct relationship between PhA and muscle strength and aerobic fitness [
26,
27], important characteristics for athletes, and related to the muscular component. However, there is still a lack of evidence to establish the direction of associations between PhA and other body composition parameters, such as the percentage of body fat [
9]. In addition, the relationship between PhA, muscle strength, and aerobic fitness highlights an important gap in determining a cause–effect association between bioelectrical parameters and physiological adaptations.
The final purpose of this study was to combine and evaluate the somatotype and bioelectrical features. The dimensionality reduction in the three components of the somatotype in a single PCA plot allowed us to look for the relationship between a synthetic component and the bioelectrical parameters. Despite the less intuitive interpretation, we found that the PhA has a positive correlation with it, which leads us to hypothesize that PhA was negatively affected by body lengths and positively conditioned by musculoskeletal growth. Although the second result has previously been justified, the first could be affected by the decreased accuracy of BIA measurements in athletes with length dimensions [
11]. All the somatotype components have been considered to relatively represent some geometrical size of the body, from lipidic to streamlined profiles. The single application of each component appears to be less informative alone and leads investigators to evaluate the whole sphere of the somatotype. The average rate of each component explains useful information, but requires more than ten measurements and four pieces of equipment [
15]. In addition, anthropometrical techniques require a high level of experience and precision, and lose their accuracy and reliability with a technical error of measurement (TEM) greater than 5%. Thus, drawbacks lie behind the acquisition and interpretation of the outcomes. A new synthetic method, such as that presented above, may overcome the problem related to evaluations needed for estimating endomorphy (skinfold thicknesses) and mesomorphy (body shapes circumference, diameter, and skinfold thicknesses) given its good (TEM = 1.24%) estimation ability with ectomorphy alone (body mass and stature). In addition, one component could be easier to relate to other variables concerning body composition and physical performance. However, while this study sets an explorative trajectory toward new possibilities in the sphere of field body composition, deeper investigation is needed to validate the elucidated method.
The strengths of this study are that the sample comprised selected elite young basketball players, providing a comprehensive description of an elite sample using multiple methods (Anthropometry and BIVA), which can serve as a useful reference for researchers and practitioners. In addition, this study could enhance perspectives in somatic analysis, prompting new ways to easily describe human body features. If the proposed method is validated on a larger sample, it will allow researchers to accurately investigate somatic features with a parsimonious model, reducing time and costs.
Some limitations should be considered. The results of the present study utilize BIA equipment at a 50 kHz frequency, applied to a similar population. In addition, although the data distribution is normal, on-time maturers outnumber early maturers. Unfortunately, the authors could not estimate the years of experience of each player, and the sample consisted of 98% Caucasian people. The authors considered it inappropriate to draw comparisons between races. Furthermore, even though the Mirwald equations are widely used, they present some limitations [
28]: the regression equations accurately predict maturation when players ages lie around 14 years old, but estimate precision decreases with distance from this age (12< or >16). Further investigations of specific samples, with balanced distributions of maturity status being evaluated with gold standard methods, could provide us relevant information and help researchers and coaches to adequately promote future talent. Also, we could not evaluate the sample twice in order to provide test–retest validation for the new assessed method. Finally, to directly investigate and identify talent requires longitudinal designs with lots of information not available for authors and clubs; our purpose only involves setting a useful bridge between body composition and the needs of basketball-playing adolescents.


