Abstract
The shedding of leaves by Posidonia oceanica (P. oceanica) in autumn results in the accumulation of shoreline debris, contributing to significant economic, social, and environmental problems. Due to the lack of alternative solutions, this waste biomass is disposed of in landfills, incurring an economic cost for the disposal process. In the context of the circular economy, anaerobic digestion (AD) can serve as a highly efficient biological alternative for treating and valorizing wastes with a high organic load. The aim of this research was to comparatively evaluate the performance and kinetics of the AD of ashore P. oceanica biomass and its anaerobic co-digestion (co-AD) with different nitrogen-rich co-substrates. To evaluate the effect of the nitrogen source in the co-AD system, peptone, casein, synthetic casein, urea, and the microalgae Raphidocelis subcapitata were used as co-substrates in biomethanization tests at a mesophilic temperature (35 ± 2 °C). The lowest methane yield was achieved for the sole AD of P. oceanica (79 ± 3 NL CH4 kg−1 VS), while the highest yields were found for the three co-ADs of P. oceanica with proteins (i.e., peptone, casein, and synthetic casein), showing no significant differences among them (380 ± 30 − 420 ± 30 NL CH4 kg−1 VS). Additionally, the first-order kinetics and the transference function model were proven and allowed for adequately fitting the experimental results of methane production with time.
1. Introduction
Around 100 million years ago, terrestrial monocotyledonous plants, already reproducing through a floral system, began to colonize marine ecosystems, forming complex and well-structured habitats. Among these ecosystems, seagrasses have become one of the most productive and valuable areas on our planet, providing a wide range of essential services: vital habitat for thousands of fish and invertebrate species, food, nutrient cycling, carbon sink, etc. [1].
Posidonia oceanica (P. oceanica) is a marine angiosperm species that is endemic to the Mediterranean Sea. It forms extensive seagrass in shallow water, covering about 1.5% of the Mediterranean basin and playing an important role in coastal ecosystem dynamics [2,3]. These meadows provide oxygen, food, shelter, and protection for many marine species. Additionally, these extensive meadows form a natural barrier that reduces wave energy, protecting against erosion and stabilizing the coastal profile [4]. Currently, P. oceanica beds are in danger of disappearance and have been listed as priority habitats by the European authorities [5].
P. oceanica presents a stem, long leaves grouped in bunches, and a root system that enables the individual specimens to cling to the substrate. Its leaves are removed from the rhizome in autumn after losing their photosynthetic capacity. These loosed leaves are released in large quantities along the shore and once they reach the sand, they start to decompose, causing serious environmental problems (methane release to the atmosphere, proliferation of mosquitoes, problems with navigation and fishing, etc.) [6,7]. Fresh deposits of P. oceanica debris usually appear at the coast during autumn and winter due to the weather and sea conditions, making this marine plant a renewable resource. Some leaves keep their fibrous structure for long periods after the easily biodegradable components are completely decomposed. These fibers are highly resistant to the mechanical and chemical action of the seawater. They are rolled up by the wave movement around a rhizomic nucleus, as a starting point for the formation of spherical agglomerates, from 3 to 12 cm in diameter (Figure 1). These agglomerates, called aegagropiles, are eventually left ashore where they remain and are sun-dried [8,9,10].
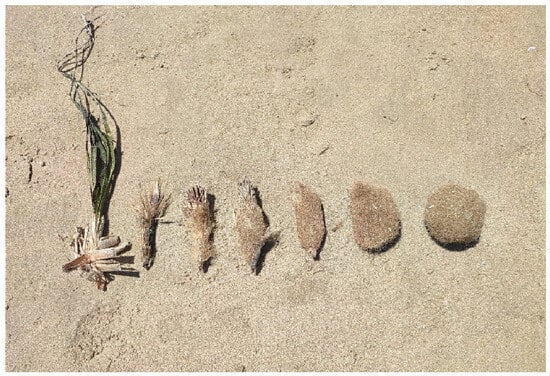
Figure 1.
Detail of the formation of the Posidonia oceanica aegagropiles.
Although in protected natural areas, the collection of P. oceanica and its debris is forbidden due to its benefits on the conservation of the local habitat (Decree 132/2005, 2005), in certain locations, exceptionally, the responsible authorities allow and encourage the collection of this biomass. For instance, on beaches of Formentera (Spain), this waste is widely used as bedding for animals, crops, and as insulation in traditional houses. In Italy, the use as a co-substrate in composting is also allowed, provided that it does not exceed 20% of the final mixture in terms of wet matter [11]. The removal of tons of P. oceanica remains is a common practice in Mediterranean coasts to allow for recreational use in the summer months. Due to the lack of alternative solutions, this biomass is usually disposed of in landfills, which provokes an environmental problem as a significant amount of organic matter is removed from the ecosystem. Moreover, it carries an economic cost due to the disposal process [4,12].
In the context of the circular economy, anaerobic digestion (AD) can be a highly efficient biological alternative for the treatment and valorization of wastes with a high organic load [13]. The interest in AD facilities has grown over the past few years because of the high methane content (around 50–60%) of the generated biogas, making it a renewable energy alternative to fossil fuels. Furthermore, the digestate can be used as an organic soil amender [13,14]. However, the viability of these processes is highly dependent on the type of substrate used. Therefore, before their implementation on an industrial or pilot scale, it is necessary to assess the methane potential of the biomass through laboratory-scale assays, such as the Biochemical Methane Potential (BMP) test, which allows the identification of substrate biodegradability, activity of the inoculum, and methane yield, providing some insights about the potential toxicity of the substrate to the AD process due to the presence of certain metabolites [14].
The use of P. oceanica for methane production by AD has been scarcely investigated in the literature. In an earlier study, the methane yield obtained was rather low (62 LCH4 kg−1 VS Pos), most likely, due to the high lignin content (>30% VS) and the presence of minerals and salts [4]. Accordingly, the effect of thermal pre-treatment (132 °C; 2.3 bar; 30 min) coupled with the removal of salts and the use of acid (HCl) during hydrolysis was also assessed by De Sanctis and Di Iaconi [4]. However, despite the applied pre-treatments, the methane production did not improve and even the yield was sometimes reduced by up to 73%. Another alternative could be the use of other substrates for an anaerobic co-digestion (co-AD) process. The co-AD process has important advantages, such as: (i) avoiding the use of chemicals or extra energy; (ii) the mixed feedstock could be prepared to present an optimal C/N ratio (25–30); (iii) mixing two co-substrates can dilute the presence of toxicants for the anaerobic process, such as salts or phenols; and (iv) it could enhance the valorization of other biomasses otherwise wasted [15,16]. Lignocellulosic biomasses, such as P. oceanica, are usually subjected to co-AD processes due to the lack of the necessary amount of nitrogen and, thus, the balanced C/N ratio to allow a stable performance. However, the bioavailability of the nitrogen source provided may influence the final methane production, although no sound conclusions can be drawn due to the significant lack of specific studies [17].
This study aimed to assess the influence of different nitrogen-rich substrates, which represent different nitrogen bioavailabilities, as co-substrates of the co-AD process of aegagropiles (ashore biomass) of the marine phanerogam P. oceanica, through BMP tests. This study represents a breakthrough in research into the valorization of P. oceanica waste, as it is the first time this biomass has been proposed to be used as a co-substrate in a co-AD process. In addition, it aims to further investigate the importance of the type of nitrogen source in anaerobic co-digestion systems. Another objective of this study was to assess the kinetics of anaerobic digestion of single P. oceanica biomass and mixtures of this biomass with different co-substrates rich in nitrogen, such as peptone, casein, synthetic casein (composed of a mixture of amino acids), urea, and the microalga Raphidocelis subcapitata.
2. Materials and Methods
2.1. Collection and Main Characterization of the Material
Dried P. oceanica aegagropiles were collected during the winter season along a 150 m transect at a distance of 5–7 m from the coastline at ‘Playa de las Huertas’, Alicante (Spain). The samples (n = 72) were transported to the laboratory, where they were dried at room temperature (25 °C) and low humidity for several days until a constant weight was reached. Subsequently, all samples were weighed and their volume estimated, assuming that all samples had an ellipsoidal shape. After biometric analyses, the samples were ground to obtain a homogeneous substrate with a particle size of up to 3.5 mm.
The following methods were used to determine the specific physicochemical parameters of the P. oceanica biomass: APHA [18] standard methods (2540B and 2540E) were used to determine total solids (TS), volatile solids (VS), and mineral solids (MS). Raposo et al. [19] and APHA [18] standard method (5220D) were used to determine the total chemical oxygen demand (CODt) and soluble chemical oxygen demand (CODs), respectively. pH and total alkalinity (TA) were measured using a pH meter (model Crison 20 basic). The APHA [18] standard method (2320B) with titration to pH 4.3 was used to determine the TA. A LECO TruSpec® Micro Elemental Analyzer from the Leco Corporation (St. Joseph, MI, USA) was used for elemental analysis. Metal elements were determined by following the U.S. EPA 3051A method [20]; briefly, samples were digested with a Mars Xtraction microwave (CEM, Matthews, NC, USA) and analyzed by inductively coupled plasma mass spectrometry (ICP-MS, AGILENT 7800, Madrid, Spain).
2.2. Biomethanization Tests
BMP tests were performed in 250 mL reactors as described by De la Lama-Calvente et al. [21]. A mixture of anaerobic inocula from two industrial anaerobic digesters, one from a brewery (Heineken, Seville) and the other from a wastewater treatment plant (EMASESA—EDAR El Copero, Seville, Spain), was used for BMP testing. Based on the volatile solids fraction of each inoculum, the mixing ratio was 1:1. The final inoculum mixture had values of 29.9 ± 0.1 (g kg−1) TS, 18.7 ± 0.5 (g kg−1) VS and 11.2 ± 0.5 (g kg−1) MS.
To achieve an appropriate C/N ratio (25) the following nitrogen-rich co-substrates were used (Table S1): (i) synthetic urea (Panreac); (ii) casein from bovine milk (Sigma-Aldrich); (iii) gelatin peptone of porcine origin (Cultimed); (iv) a mixture of amino acids prepared in the laboratory similar to commercial casein [22]; and (v) microalga Raphidocelis subcapitata, grown in Arnon-rich medium. The used acronyms along the text to identify the different substrates were: P.o.: P. oceanica; P.o.:Ur.: P. oceanica—Urea; P.o.:Cas.: P. oceanica—Casein; P.o.:Pep.: P. oceanica—Peptone; P.o.:Syn.Cas.: P. oceanica—Synthetic casein made of amino acids; P.o.:R.s.: P. oceanica—Raphidocelis subcapitata.
The main physicochemical characteristics of the different substrates used are shown in Table 1. All the reactors were set up with an inoculum-to-substrate ratio (ISR) of 2 (based on VS), distilled water, and a micro-nutrient solution. The composition of the solution of trace elements was as follows: (in mg L−1) FeCl2·4H2O, 2000; CoCl2·6H2O, 2000; MnCl2·4H2O, 500; AlCl3·6H2O, 90; (NH4)6Mo7O24·4H2O, 50; H3BO3, 50; ZnCl2, 50; CuCl2·2H2O, 38; NiCl2·6H2O, 50; Na2SeO3·5H2O, 194; and EDTA, 1000. All assays were carried out in triplicate and were performed at a mesophilic temperature (35 ± 1 °C). In addition, 3 reactors without added substrate were included as blanks to determine the endogenous methane production of the inoculum. Additionally, 3 reactors were fed with cellulose (Fluka Avicel PH- 101) and treated as the positive control to confirm the good activity of the inoculum. Before sealing, nitrogen gas was applied to all the reactors to ensure anaerobic conditions. The biogas produced in the reactors was passed through a NaOH 2N solution capable of trapping the CO2 from the biogas mixture. The remained gas was measured volumetrically and assumed to be methane, as supported by several publications [23,24]. The experimental accumulative methane values are given in standard conditions of pressure and temperature (101.325 kPa and 273.15 K). Finally, the BMP tests were stopped when methane production was less than 1% of the accumulative value for 3 consecutive days.

Table 1.
Main physicochemical characteristics of the different studied co-substrates. Values are given by means ± standard deviations.
2.3. Kinetic Study
The first-order kinetic model and the transference function model (TFM) were applied to perform the kinetic study of methane production from the different co-digestion mixtures. Further information regarding the used equations can be found in the Appendix A.
2.4. Statistical Analysis
Analysis of variance (ANOVA) and Tukey’s HSD test were used to compare the results of the different treatments and to determine whether there were significant differences. Before this, a normality test (Shapiro–Wilk test) was performed. A p-value ≤ 0.05 was considered statistically significant. For the calculation of biodegradability, the theoretical BMP test values were calculated using the formula described by Nielfa et al. [25] (Table S1). All the statistical analyses were carried out by using the SPSS Statistics software v.29 (IBM, Business Machines Corp, New York, NY, USA).
3. Results and Discussion
3.1. Posidonia Oceanica Characterization
The collected samples showed a normal distribution in terms of biovolume (Table 2), ranging from 10 to 850 cm3, with an average value of 300 ± 200 cm3 and a mode of 50 cm3. The aegagropiles were milled and the particle size distribution was measured. The results showed that due to the morphology of the material, all the fibers passed through the 3.5 mm mesh sieve. As suggested by the specific literature [26], the fraction related to a particle size between 1 mm and 3.5 mm was selected for further analysis and the BMP tests.
Table 2.
Biometric and physicochemical characterization of the aegagropiles of Posidonia oceanica. Values are given by means ± standard deviations.
The results showed a VS/TS ratio above 0.8, which is considered a suitable value for AD and is within the same range as other lignocellulosic biomasses [27]. Although the samples were kept at room temperature until a constant weight, the main humidity loss occurred in the collected site. Thus, it could be considered that the aegagropiles were sun-dried before further analysis and use. This low humidity (12%) was similar to other biomasses dried naturally. For example, different varieties of Sorghum bicolor presented humidity values within the range of 7–9% when sun-dried [27]. Similarly, the sun-dried biomass of the ashore macroalgae Rugulopteryx okamurae showed humidity values between 28 and 7% [28].
Regarding the elemental analysis, the C/N ratio (153 ± 5) indicated a low N content (Table 1), which may unbalance AD performance by affecting the bacterial growth and subsequently their hydrolytic activity [29]. This result supported the idea of carrying out a co-AD process using N-rich co-substrates. Seagrasses are also characterized by their potential to absorb heavy metals present in the seawater and act as bioindicators [30]. However, the heavy metal uptake capacity is strongly linked to the species and the location [30,31]. Regarding P. oceanica, strong relationships between the location, the plant part, the collection season, and the heavy metal composition have been previously reported [31,32]. The results obtained in this study are within the range of those previously reported, with very few exceptions [31,32,33]. For example, Zn is commonly detected in the 100–1000 ppm range, while in the sample used in the present study this element could not be detected. Similarly, Fe and Pb have been reported in the 100–3000 ppm and 10–100 ppm ranges, respectively, however, in the present study, Fe was found at a concentration of 1.6 ± 0.1 ppm and Pb at 3 ± 2 ppm [31,32,33]. While the data reported in the literature is related to healthy and alive specimens of P. oceanica, in the present study, the P. oceanica samples were collected ashore, sun-dried, and after a natural decomposition process. These differences in the biomass origin could significantly alter the elemental profile as it has been recently reported [28]. Furthermore, heavy metals are strongly linked to a good performance of the AD process. While it is well known that the presence of trace elements is essential for efficient AD performance, at certain concentrations, these may disrupt the process by inhibiting the microbiome activity [34]. The most studied and common elements are Cu, Fe, Ni, Cd, Cr, Pb, and Zn. Although there is a significant amount of data supporting their impact on AD, there is still a lack of consensus regarding specific limits to identify the potential toxicity of the substrates. Nevertheless, the values reported in Table 2 were not considered of major concern when compared with those reported in the literature [34,35,36,37].
3.2. Co-Substrate Characterization
The co-substrates used in the present study were commercial products of chemical degree, except for the microalga R. subcapitata, which was cultivated in an Arnon-rich medium. The solid fraction of these compounds represented more than 90% of the sample, while for the microalgae, the humidity represents 42% of the total weight (Table 1). In any case, the VS/TS ratio was above 0.94 across the board, suggesting that the organic fraction of each co-substrate could be considered quantitatively equal. Moreover, the elemental analysis revealed that the C/N ratio ranged from 11.78 (R. subcapitata) to 0.43 (urea), confirming the suitability of these co-substrates as feedstock for the co-AD with lignocellulosic biomasses, such as P. oceanica aegagropiles.
3.3. Digestate Main Characteristics
The main physicochemical characteristics of the digestates resulting from the BMP tests carried out in this study are shown in Table 3. The pH ranged from 7.77 to 8.22 across the board, except for the P.o.:Ur. test which showed a higher value (9.2). pH values between 6.5 and 8.5 suggest a stable AD performance, although at pH under 6.3 or over 7.8 the methanogenesis stage may suffer failures and be partially hindered [38]. A higher pH may be related to the formation of ammonia during the hydrolysis stage, which is inhibitory to methanogens. Aqueous ammonia (NH4+) is in equilibrium with free ammonia (NH3); however, this equilibrium shifts to free ammonia formation as the pH increases. Concentrations of aqueous ammonia between 1.7 and 14 g NH3 L−1 have been reported as inhibitory to methanogens, especially to acetoclastic species [38]. However, the total ammonium nitrogen (TAN) limits, from which inhibitory effects are observed, are highly related to other factors, such as substrate, inoculum, environmental conditions, and microbial acclimation [39]. In any case, it is generally considered that TAN values below 2500 mg N-NH4+ L−1 do not indicate significant inhibition [26]. Another parameter directly linked to the stability of the AD process is the buffer capacity of the system, measured as the TA. It is generally accepted that TA, as a measure of carbonate buffer capacity, should be above 3000 mg CaCO3 kg−1 [26]. However, there is very little information about a TA upper limit, which may indicate an inhibition process. In fact, in this study, the TA value of the digestate derived from the inhibited P.o.:Ur. test was as high as 15,100 mg CaCO3 kg−1.
Table 3.
Physicochemical parameters of the digestates derived from the biomethanization tests. Values are given as means ± standard deviations. Values with different letters in the same row mean significant differences.
Based on the physicochemical characteristics, the assayed digestates could be roughly separated into three main groups: (i) P.o. and P.o.:R.s.; (ii) P.o.:Cas., P.o.:Pep., and P.o.:Syn.Cas.; (iii) P.o.:Ur. The first group is characterized by showing the lowest pH, TA, and TAN values, although within acceptable values for the adequate performance of the AD process. The experimental methane yield was significantly lower than those achieved from the second group, despite the higher theoretical value (Table S2). This could be related to the lignocellulosic character of sun-dried P. oceanica. Moreover, the relatively low COD value suggested that the main limiting step was the hydrolytic stage, although the differences between both P.o. and P.o.:R.s. tests might also indicate that the methanogenesis was more limited in the P.o. test, based on the higher COD value and the lower methane yield. These differences might be related to the more balanced C/N ratio of the P.o.:R.s. test, which allowed for more consistent and stable bacterial and archaea growth. Similar results have been observed recently when other lignocellulosic biomasses, such as thermo-chemical pretreated rice husk, were co-digested with cow manure at different C/N ratios (13.8–75.7) [40]. The results showed that the highest methane yield was achieved at a C/N ratio of 24.7, meaning a yield improvement of 76% against the control [40]. In the present study, an improvement of 146% in methane yield of P.o.:R.s. compared to the mono-digestion of the sole P. oceanica was observed (Figure 2). The evaluation of P. oceanica as feedstock for an AD process is scarce in the literature. Only two studies reported specific methane yields using P. oceanica as a substrate. De Sanctis and Di Iaconi [4] reported values from 29 to 62 L CH4 kg−1 VS, depending on the operating conditions. These results were slightly lower than that obtained in this study from the sole digestion of P. oceanica (79 ± 3 NL CH4 kg−1 VS). Additionally, De Sanctis and Di Iaconi [4] also evaluated the effect of some pretreatments, such as washing, thermal, or acidification with HCl, on methane production. The highest value (94 L CH4 kg−1 VS) was observed for the unwashed biomass thermally pretreated at 132 °C for 30 min after sample acidification with HCl. Again, in the present study, the co-AD of P. oceanica with a N-rich co-substrate, such as the microalga R. subcapitata, led to higher values (194 ± 4 NL CH4 kg−1 VS, Figure 2).
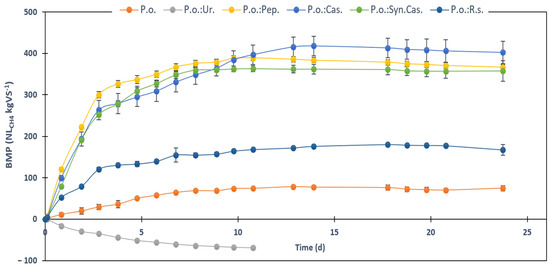
Figure 2.
Experimental and accumulative methane of the different biomethanization (BMP) tests carried out versus time. P.o.: P. oceanica; Ur: urea; Cas.: casein; Pep.: gelatine peptone; Syn.Cas.: amino acids mixture simulating a synthetic casein; R.s.: Raphidocelis subcapitata. Values are given as means ± standard deviations.
The second group was characterized by the highest methane yield (380 ± 30−420 ± 30 NL CH4 kg−1 VS), with no significant differences between the three results. Moreover, biodegradability above 75% may indicate an almost complete degradation of the substrate [41]. COD values similar to those found in the first group (Table 3) also indicate that there was not an accumulation of solubilized organic matter, suggesting that both the hydrolytic and the methanogenetic stages operated properly. Only the P.o.:Pep. test showed a significantly higher COD value; however, it also showed the highest BD (97%). Peptone is a partially degraded protein, which makes it much more easily digestible and bioavailable for microorganisms, providing a quick source of nitrogen. This could suggest that the substrate was completely solubilized, unlike the other two tests where some parts of the substrates may have remained intact or not biodegraded. Due to its complex structure, casein is less soluble in water and takes longer to be digested by microorganisms. In biological systems, microorganisms need to break down casein into simpler components before they can metabolize it. The co-digestion of complex substrates, such as casein proteins and lignocellulose can create a more stable environment for anaerobic microorganisms, thereby optimizing biogas production. The hydrolysis of proteins, particularly complex ones, such as casein, is likely to be synchronized with the hydrolysis of complex lignocellulose, allowing for a more balanced release of nitrogen and carbon compounds. This synchronized release can maintain an optimal soluble C/N ratio, which is crucial for the proper development of anaerobic microorganisms. The parallel hydrolysis of nitrogenous and carbonaceous compounds promotes a more efficient digestion process, supporting the microbial community’s stability and increasing methane production. This is in line with the principles established in anaerobic digestion, where proper synchronization of substrate degradation is key to maximizing biogas yields. In any case and despite the apparent good performance, pH, TA, and TAN analyses of the digestates indicated that the systems were close to failure due to inhibition processes. In fact, when compared with the first group, the TAN values were around 2-fold higher, the pH was higher at least by 0.5 units, and the TA also increased up to 9000 mg CaCO3 kg−1 (Table 3). Although these values were still within the normal limits for good AD performance, they were closer to the upper limits which indicates inhibition due to the presence of ammonia. This may be due to the higher degradability of nitrogenated compounds from pure proteins and amino acids in contrast with those derived from more complex biomasses, such as the marine plant P. oceanica or the microalga R. subcapitata. This also suggests that in a continuous mode of operation, the system may collapse and could be inhibited due to the accumulation of ammonia. This has been also confirmed by Rhee et al. [42], who reported that the AD of nitrogen-rich substrates produced an anaerobic digestate with a pH higher than those obtained from lipid-rich substrates. Nevertheless, the co-AD of lignocellulosic biomasses with protein-rich substrates enhances the methane yield greatly. For example, Rhee et al. [42] reported a methane yield of 325.9 L CH4 kg−1 VS for casein. In the present study, the mixture of P. oceanica and casein reported a higher methane yield of 420 ± 30 L CH4 kg−1 VS, which suggests the importance of the C/N balance. However, the methane yield of the mixture of P. oceanica with a casein-like amino acid mixture was somewhat lower (380 ± 30 L CH4 kg−1 VS). This suggests that not only the C/N ratio, but also, the N source-type impact AD performance.
A total inhibition due to a high ammonia concentration (TAN: 4000 mg N-NH4+ kg−1) was observed from the P.o.:Ur. test. Moreover, the pH was above 9 and TA above 15,000 mg CaCO3 kg−1. In fact, as could be observed in Figure 2, the accumulative methane yield was negative. This is because the background production from blanks was higher than the methane production from the P.o.:Ur. test, which demonstrates that the methanogenetic microbial communities were completely inhibited. Urea is a compound highly soluble, which suggests that the liberation of ammonia into the reactor system could have been immediate. This assumption was also supported by the high CODs (7700 ± 500 mg O2 kg−1, Table 3). Additionally, the theoretical methane yield of urea was null, so any methane produced should be linked only to the fed P. oceanica (Table S2). On one hand, the findings of this study contrast with previously reported data in the literature, which support the idea of urea as a good nitrogen-rich source that enhances the methanization of high C/N ratio biomasses. For example, an earlier study reported that reducing the C/N ratio of cattle waste from 40 to 27 by using urea slightly increased biogas production (8–11%) [43]. More recently, the use of urea to reduce the C/N ratio of hulless barley straw from 38.92 to 23.68 enhanced the methane production by 69.7% when coupled with alkaline pretreatment (KOH 5.02%; 24.07 h) [44]. On the other hand, recent studies, similar to what was observed in this work, reported urea to be inhibitory at certain concentrations. For example, the plant hybrid Pennisetum was co-digested with different concentrations of urea, and the results showed that up to a TAN value of 4000 mg N-NH4+ L−1, the system was able to recover, although at 3000 mg N-NH4+ L−1, the methane yield only achieved 85% of the control, and at 4000 mg N-NH4+ L−1, the methane yield was less than 50% of the control. Finally, at TAN values above 4000 mg N-NH4+ L−1, the system failed to recover and was completely inhibited [45].
3.4. Kinetic Modelling
Two mathematical models (i.e., first-order and transference function model (TFM)) were applied to the experimental data to obtain the kinetic parameters that describe and simulate the AD process performance. These models were applied to all the assessed tests, except to the P.o.:Ur. test due to the negative methane yield recorded, which made it not possible to properly fit any kinetic model.
3.4.1. First-Order Kinetic Model
A summary of the kinetic parameters obtained from Equation (A1) for the anaerobic digestion of single P. oceanica and co-AD of P. oceanica and nitrogen-rich substrates is shown in Table 4. The experimental results align well with the proposed model, as evidenced by the low standard deviations and high determination coefficient values obtained for all the assayed tests.
Table 4.
Values of the kinetic constant obtained from the first-order model for the different mixtures tested. Values are given as means ± standard deviations.
Figure 3 shows, as an example, the variation of the experimental values of methane production with time for the mixture P.o.:Pep. and the theoretical curve obtained with the first-order model. The highest specific rate constant obtained in the present research was found for the mixture P.o.:Pep. (0.46 ± 0.01 d−1), which was 130% higher than that obtained for a single P. oceanica (0.20 ± 0.01 d−1). The low value observed in the case of individual P. oceanica can be attributed to the elevated lignin content (35% VS) and the presence of high salinity residues in the marine plant. Consequently, the viability of P. oceanica as a feedstock for anaerobic digestion may be primarily influenced by two characteristics: its elevated lignin content and the existence of saline residues. This lignin content was very similar as observed for Pine pinaster or Date palm leaves [4]. The anaerobic digestibility of P. oceanica could be improved by using pre-treatments or considering co-digestion with other substrates, given its notable lignin content. Additionally, concerning the existence of saline residues, previous authors emphasized that elevated salinity and the concentration of specific ions may hinder the activity of anaerobic microorganisms crucial for the digestion process, ultimately resulting in decreased efficiency [4].
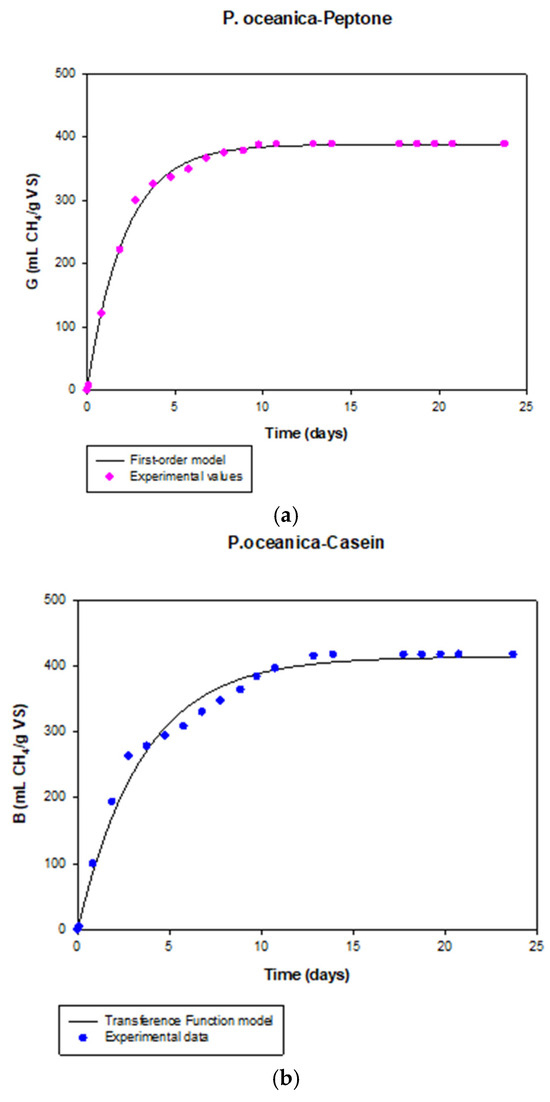
Figure 3.
Variation of the experimental values of methane production with time and theoretical curves obtained with the first-order model (mixture P. oceanica—peptone) (a) and transference function model (mixture P. oceanica—casein) (b).
As can be observed in Table 4, the first-order kinetic constant, k, obtained for the other co-AD tested was also higher than the value obtained for the sole P. oceanica, with values 40%, 80%, and 45% higher for the mixtures P.o.:Cas., P.o.:Syn.Cas., and P.o.:R.s., respectively.
A lower value of the first-order kinetic constant (0.10 d−1) was reported by Li et al. [46] in the batch anaerobic digestion of fresh seagrass biomass, while the kinetic constant increased up to values in the range of 0.15–0.19 d−1 when the seagrass was previously stored in well-ventilated open tanks. On the other hand, a k value of 0.24 d−1 was achieved when the seagrass was co-digested with chicken manure [46], this value being very similar to that obtained in the present research when the P. oceanica was co-digested with the microalga R. subcapitata (0.29 d−1) or with casein (0.28 d−1).
A recent study investigated the utilization of biomass from three frequently employed macrophytes in constructed wastewater treatment wetlands—Water Hyacinth sp., Typha sp., and Cyperus sp.—as a substrate for methane production [47]. The assessment of biochemical methane potential for these three biomasses was carried out in batch mode at 37 °C. Additionally, a kinetic analysis of AD was performed for these substrates, using the first-order model. Hyacinth sp. showed the highest degradation rate, with k values between 0.35 and 0.53 d−1 (for tests at ISR ratios between 1 and 4), which was expected due to its lower level of lignin when compared to Typha sp. and Cyperus sp.: 7.5%, 12%, and 17%, respectively [47]. This highest degradation rate contributed to the lowest total digestion time. The lowest value of k was observed in Cyperus sp. AD at an ISR of 4, 0.07, and 0.09 d−1, while k values of between 0.109 and 0.186 d−1 were achieved for Typha sp. biomass. The biomass of Typha sp. exhibited k values proximate to those of microcrystalline cellulose (used as a positive control), achieving a value of 0.170 d−1. In a study by Dutra et al. [48], the floating macrophyte Egeria densa demonstrated a k value of 0.27 d–1, an intermediate figure in comparison to plants examined in the Moratti et al. [47] investigation but resembling the value observed for Hyacinth sp. The notable feature of Egeria densa is its relatively low lignin content (6.3%), emphasizing its impact on the hydrolysis rate.
Sarto et al. [49] investigated the impact of chemical pretreatment on biogas production derived from Hyacinth sp. The pretreatment procedure involved varying H2SO4 concentrations from 0 to 5% v/v and adjusting the residence time between 0 and 90 min. The findings revealed alterations not only in cellulose content but also in glucose levels, COD, and the COD/N ratio. Optimal pretreatment conditions were identified as a 5% v/v H2SO4 concentration with an exposure time of 60 min, as the slurry pretreated under these conditions exhibited a COD/N ratio of 388 [49]. For this pretreated Hyacinth sp., a k value of 0.021 d−1 was achieved, which was much lower than those reported by Moretti et al. [47] (0.35–0.53 d−1) and those attained in the present research, although the biogas production for pretreated Hyacinth sp. biomass increased by 131% compared to the untreated biomass.
3.4.2. Transference Function Model (TFM)
The TFM parameters obtained for single P. oceanica biomass and the different mixtures tested in this study are shown in Table 5. The appropriateness of the proposed model for describing methane production time is supported by the low standard deviations and elevated determination coefficient values obtained from the experimental results. Figure 3 shows as an example the variation of the experimental data of methane production with time for the mixture P.o.:Cas. and the theoretical curve obtained with the TFM.
Table 5.
Values of the parameters obtained from the transference function model for the different substrates studied. Values are given as means ± standard deviations.
The determined lag times were nearly negligible across all instances, owing to the rapid consumption of readily available biodegradable components in the various mixtures examined during the anaerobic co-digestion processes investigated [49]. The minimal lag time values additionally suggest prompt microbial acclimatization to the digestion conditions and effective methanation of organic substances [37]. Therefore, the absence of a lag phase (Figure 3) suggests that the microbiota thrived in an environment conducive to degradation [47]. This adaptation to the substrate is reflected in the coherence of the negligible or minimal values of λ.
As can be seen in Table 5, the highest values of the maximum methane production rate (Rmax) were found for the co-AD of the mixtures of P. oceanica with peptone, casein, and synthetic casein compared to the anaerobic mono-digestion of the sole P. oceanica. Specifically, the highest Rmax value was found for the co-AD of the mixture P.o.-Pep. (183 ± 5 mL CH4 (g VS·d)−1), which was 10.9 times higher than the lowest value, which was found for the digestion of the single P. oceanica biomass tested (16.8 ± 0.9 mL CH4 (g VS·d)−1). All co-ADs between the P. oceanica and the nitrogen-rich substrates have higher maximum methane production rates compared to mono-digestion of the single P. oceanica sample, except the non-simulated P.o.:Ur. This fact indicates that the co-AD of these samples has a positive effect on the anaerobic degradation rate. The worst co-substrate was the microalga R. subcapitata as it showed a negative effect on both the methane production rate and yield. This fact may be attributable to the low bioavailability of nitrogen in the case of this microalgae, which is located within the cell wall hindering the hydrolysis step of the anaerobic process [50].
A Rmax value of 40.5 mL CH4 (g VS·d)−1, some higher than that obtained in the present research for single P. oceanica, was reported by Li et al. [46] in BMP tests of fresh seagrass Zostera marina. However, this value increased up to 65.7 mL CH4 (g VS·d)−1 when the seagrass was previously stored in a well-ventilated and open plastic tank for 15 days. Likewise, in the current study [46], the Rmax values increased up to 131.5 and 150.4 mL CH4 (g VS·d)−1 when the fresh Z. marina and the stored Z. marina were co-digested with chicken manure (ratio 1:1). In any case, as can be seen, these values were lower than that achieved for the mixture P.o.-Pep. in the present work.
On the one hand, Moretti et al. [47] recently reported Rmax values in the range of 87–114 mL CH4 (g VS·d)−1 for BMP assays of the macrophyte Hyacinth sp. at ISRs in the range of 1–4. The maximum methane production rate value decreased for the macrophyte Typha sp. and Cyperus sp., which is attributed to the low lignin content of the Hyacinth sp. (6.3%) compared to the other two aquatic plants tested (12.4% and 16.7%, respectively) [47]. On the other hand, Sarto et al. [51] reported an increase in the maximum methane production value from 6.6 to 7.2 mL CH4 (g VS·d)−1 when the Hyacinth sp. was chemically pretreated with sulfuric acid at a concentration of 5% (v/v) for 60 min. This was attributed to an increase in the COD/N ratio from 47.4 (untreated biomass) to 388.2 (pretreated biomass) [51].
4. Conclusions
The impact of the nitrogen source during the anaerobic co-digestion (co-AD) of the ashore marine seagrass Posidonia oceanica (P. oceanica) and N-rich substrates has been assessed in this study. There were no significant differences observed in the methane yields (380 ± 30−420 ± 30 NL CH4 kg−1 VS) derived from the co-AD of P. oceanica and protein-like substrates (i.e., casein, peptone and synthetic casein), being these the highest yields achieved. However, the physicochemical characteristics of the resulting digestates suggested that long-term and continuous anaerobic processes may fail due to ammonia accumulation.
The use of urea as a nitrogen source to reduce the C/N ratio of P. oceanica from 153 ± 5 to 25 has been proven to be inefficient and inhibitory to the co-AD process. TAN values of 4000 ± 200 mg N-NH4+ kg−1 were obtained in the digestate and showed complete inhibition of the microbial community.
The co-AD of P. oceanica with R. subcapitata enhanced the methane yield by 145% when compared with the sole AD of P. oceanica. Although the methane yield was lower than that obtained from the protein-like co-substrates (194 ± 4 NL CH4 kg−1 VS), the resulting digestates showed higher stability, suggesting that nitrogen derived from complex organisms, such as microalgae, would be a better option in scaled-up co-AD systems.
Data from AD experiments were well described by the first-order and transference function model (TFM). The highest specific rate constant (first-order model) obtained in the present research was found for the mixture P. oceanica—peptone (0.46 ± 0.01 days−1). This value was 130% higher than that obtained for the sole P. oceanica biomass. In addition, the highest maximum methane production rate (Rmax) (TFM) was also found for the above-mentioned mixture, which was 10.9 times higher than the lowest value, which was found for the single P. oceanica biomass tested (16.8 ± 0.9 mL CH4 (g VS·d)−1).
Supplementary Materials
The following supporting information can be downloaded at: https://www.mdpi.com/article/10.3390/app15062880/s1, Table S1. C/N ratio, grams of volatile solids (VS) added in the BMP and Theoretical BMP value of each co-substrate; Table S2. Theoretical and experimental BMP of each co-substrate and calculated synergistic effect.
Author Contributions
D.d.l.L.-C.: Conceptualization, Investigation, Validation, Supervision, Writing—original draft, Writing—review & editing; J.M.M.-L.: Conceptualization, Validation, Supervision, Writing—original draft, Writing—review & editing; I.G.-M.: Investigation, Writing—original draft; J.R.-C.: Investigation, Writing—original draft; R.B.: Supervision, Resources, Funding acquisition, Writing—review & editing; M.J.F.-R.: Conceptualization, Investigation, Validation, Supervision, Writing—original draft, Writing—review & editing. All authors have read and agreed to the published version of the manuscript.
Funding
The authors wish to express their gratitude to the Spanish Ministry of Science, Innovation and Universities for providing financial support through the project PID2023-151811OB-I00. This research was co-funded by Spanish State Research Agency, grant number FJC2020-045654-I.
Institutional Review Board Statement
Not applicable.
Informed Consent Statement
Not applicable.
Data Availability Statement
The data presented in this study are available in the article.
Acknowledgments
The authors also wish to thank M. Martín-Fernández and M. Borrego-Caraballo for their technical support and dedication.
Conflicts of Interest
Author Iván Garrido-Murillo was employed by the company Empresa Metropolitana de Abastecimiento y Saneamiento de Aguas de Sevilla (EMASESA). The remaining authors declare that the research was conducted in the absence of any commercial or financial relationships that could be construed as a potential conflict of interest.
Appendix A. Kinetic Modeling
Appendix A.1. First-Order Kinetic Model
In order to study the process kinetics and estimate the process performance in the AD of the Posidonia oceanica (P. oceanica) biomass and different mixtures of P. oceanica and nitrogen-rich compounds mentioned, the following first-order kinetic model was used:
where G is the cumulative specific methane production (mL CH4/g VSadded), Gmax is the ultimate methane production (mL CH4/g VSadded), k is the specific rate constant (days−1), and t is the digestion time (days). This kinetic model is normally applied to assess the kinetics of the batch AD processes for different types of biodegradable substrates [49,52]. This model assumes that methane production is proportional to the amount of substrate and not limited by microbial cell mass [53].
Appendix A.2. Transference Function Model
The transference function model (TFM) was applied to fit the experimental data of methane production during the above-mentioned BMP tests (Equation (A2)). This model was successfully applied by several authors for biomethanization of different organic wastes [54,55]:
where B (mL CH4/g VSadded) is the cumulative specific methane production, Bmax (mL CH4/g VSadded) is the ultimate methane production, Rmax is the maximum methane production rate (mL CH4/g VSadded·d), t (d) is the digestion time, and λ (d) is the lag time. In this model, it was assumed that the kinetics of methane production were proportional to the bacterial growth rate inside the batch reactors [54].
Determination coefficients (R2) and standard errors of estimates (S.E.E.) were calculated to evaluate the goodness-of-fit and the accuracy of the results for both models. The kinetic parameters for each experiment and mathematical adjustment were determined numerically from the experimental data obtained by non-linear regression using the software Sigma-Plot v.11.
References
- Murphy, G.E.P.; Dunic, J.C.; Adamczyk, E.M.; Bittick, S.J.; Côté, I.M.; Cristiani, J.; Wong, M.C. From coast to coast to coast: Ecology and management of seagrass ecosystems across Canada. Facets 2021, 6, 139–179. [Google Scholar] [CrossRef]
- Ruiz, J.M.; Guillén, J.E.; Ramos Segura, A.; Otero, M.M. Atlas de las Praderas Marinas de España Instituto Español de Oceanografía. 2015. Available online: https://www.iucn.org/es/content/atlas-de-las-praderas-marinas-de-espana (accessed on 12 October 2023).
- Azcárate-García, T.; Beca-Carretero, P.; Brun, F.G. Plant and meadow structure characterisation of Posidonia oceanica in its westernmost distribution range. Diversity 2023, 15, 101. [Google Scholar] [CrossRef]
- De Sanctis, M.; Di Iaconi, C. Evaluation of posidonia oceanica residues as feedstock for anaerobic digestion. Bioresour. Technol. Rep. 2019, 8, 100317. [Google Scholar] [CrossRef]
- European Union. Council Directive 97/62/EC of 27 October 1997 adapting Directive 92/43/EEC on the conservation of natural habitats and of wild fauna and flora. Off. J. Eur. Communities 1997, L305, 42–65. [Google Scholar]
- Hachana, Y.; Jebbari, A.; El Mejdoub, H.; Yousfi, W.; Fortina, R. Seagrass debris as source of fiber and bioactive compounds in feed for dairy goats. Int. J. Agric. Biol. 2021, 26, 722–730. [Google Scholar] [CrossRef]
- Schorn, S.; Ahmerkamp, S.; Bullock, E.; Weber, M.; Lott, C.; Liebeke, M.; Lavik, G.; Kuypers, M.M.M.; Graf, J.S.; Milucka, J. Diverese methylotrophic methanogenic archaea cause high methane emissions from seagrass meadows. Proc. Natl. Acad. Sci. USA 2022, 119, e2106628119. [Google Scholar] [CrossRef]
- Lefebvre, L.; Compère, P.; Léonard, A.; Plougonven, E.; Vandewalle, N.; Gobert, S. Mediterranean aegagropiles from Posidonia oceanica (L) delile (1813): A first complete description from macroscopic to microscopic structure. Mar. Biol. 2021, 168, 37. [Google Scholar] [CrossRef]
- Lefebvre, L.; Compère, P.; Gobert, S. The formation of aegagropiles from the mediterranean seagrass Posidonia oceanica (L) delile (1813): Plant tissue sources and colonisation by melanised fungal mycelium. Mar. Biol. 2023, 170, 19. [Google Scholar] [CrossRef]
- Sanchez-Vidal, A.; Canals, M.; de Haan, W.P.; Romero, J.; Veny, M. Seagrasses provide a novel ecosystem service by trapping marine plastics. Sci. Rep. 2021, 11, 254. [Google Scholar] [CrossRef]
- Parente, A.; Serio, F.; Montesano, F.F.; Mininni, C.; Santamaria, P. The compost of posidonia residues: A short review on a new component for soilless growing media. ISHS Acta Horticult. 2014, 1034, 291–298. [Google Scholar] [CrossRef]
- Parente, A.; Montesano, F.F.; Lomoro, A.; Guido, M. Improvement of beached Posidonia residues performance to composting. Environ. Eng. Manag. J. 2013, 12, 81–84. [Google Scholar]
- Mata-Alvarez, J.; Dosta, J.; Romero-Güiza, M.S.; Fonoll, X.; Peces, M.; Astals, S. A critical review on anaerobic co-digestion achievements between 2010 and 2013. Renew Sust. Energy Rev. 2014, 36, 412–427. [Google Scholar] [CrossRef]
- Raposo, F.; De La Rubia, M.A.; Fernández-Cegrí, V.; Borja, R. Anaerobic digestion of solid organic substrates in batch mode: An overview relating to methane yields and experimental procedures. Renew. Sust. Energ. Rev. 2012, 16, 861–877. [Google Scholar] [CrossRef]
- Mata-Alvarez, J.; Macé, S.; Llabrés, P. Anaerobic digestion of organic solid wastes an overview of research achievements and perspectives. Bioresour. Technol. 2000, 74, 3–16. [Google Scholar] [CrossRef]
- Xu, J.; Wang, X.; Sun, S.; Zhao, Y.; Hu, C. Effects of influent C/N ratios and treatment technologies on integral biogas upgrading and pollutants removal from synthetic domestic sewage. Sew. Sci. Rep. 2017, 7, 10897. [Google Scholar] [CrossRef]
- Karrabi, M.; Ranjbar, F.M.; Shahnavaz, B.; Seyedi, S. A comprehensive review on biogas production from lignocellulosic wastes through anaerobic digestion: An insight into performance improvement strategies. Fuel 2023, 340, 127239. [Google Scholar] [CrossRef]
- APHA. Standard Methods for the Examination of Water and Wastewater, 23rd ed; American Public Health Association: Washington, WA, USA, 2017. [Google Scholar]
- Raposo, F.; de la Rubia, M.A.; Borja, R.; Alaiz, M. Assessment of a modified and optimised method for deter-mining chemical oxygen demand of solid substrates and solutions with high suspended solid content. Talanta 2008, 76, 448–453. [Google Scholar] [CrossRef]
- USEPA. Method 3051A (SW-846): Microwave Assisted Acid Digestion of Sediments Sludges and Oils, 1st ed.; United States Environmental Protection Agency: Washington, WA, USA, 2007.
- De la Lama-Calvente, D.; Cubero, J.; Fernández-Rodríguez, M.J.; Jiménez-Rodríguez, A.; Borja, R. Anaerobic co-digestion of microalgae and industrial wastes: A critical and bibliometric review. In Progress in Microalgae Research—A Path for Shaping Sustainable Futures; Zepka, Q., o Jacob-Lopes, E., Costa Deprá, M., Eds.; Intech Open: London, UK, 2022; pp. 1–26. [Google Scholar]
- Gordon, W.G.; Semmett, W.F.; Cable, R.S.; Morris, M. Amino acid composition of α-casein and β-Casein2. J. Am. Chem. Soc. 1949, 71, 3293–3297. [Google Scholar] [CrossRef]
- Fernández-Rodríguez, M.J.; Puntano, N.F.; Mancilla-Leytón, J.M.; Borja, R. Batch mesophilic anaerobic co-digestion of spent goat straw bedding and goat cheese whey: Comparison with the mono-digestion of the two sole substrates. J. Environ. Manag. 2021, 280, 111733. [Google Scholar] [CrossRef]
- Casallas-Ojeda, M.; Meneses-Bejarano, S.; Urueña-Argote, R.; Marmolejo-Rebellón, L.F.; Torres-Lozada, P. Techniques for quantifying methane production potential in the anaerobic digestion process. Waste Biomass Valori. 2022, 13, 2493–2510. [Google Scholar] [CrossRef]
- Nielfa, A.; Cano, R.; Fernández-Polanco, M. Theoretical methane production generated by the co-digestion of organic fraction municipal solid waste and biological sludge. Biotechnol. Rep. 2015, 5, 14–21. [Google Scholar] [CrossRef] [PubMed]
- Holliger, C.; Alves, M.; Andrade, D.; Angelidaki, I.; Astals, S.; Baier, U.; Bougrier, C.; Buffi`ere, P.; Carballa, M.; de Wilde, V.; et al. Towards a standardization of biomethane potential tests. Water Sci. Technol. 2016, 74, 2515–2522. [Google Scholar] [CrossRef] [PubMed]
- De la Lama-Calvente, D.; Fernández-Rodríguez, M.J.; Gandullo, J.; Desena, I.; de la Osa, C.; Feria, A.B.; Jiménez-Rodríguez, A.; Borja, R. Valorization of different landrace and commercial sorghum (Sorghum bicolor (L) moench) straw varieties by anaerobic digestion. Glob. Change Biol. 2022, 15, 332–345. [Google Scholar] [CrossRef]
- De la Lama-Calvente D, Fernández-Rodríguez MJ, García-Gómez JC, Borja R, Impact of natural degradation of the invasive alga Rugulopteryx okamurae on anaerobic digestion: Heavy metal pollution and kinetic performance. Mar. Pollut. Bull. 2023, 192, 115005. [CrossRef]
- Khalid, A.; Arshad, M.; Anjum, M.; Mahmood, T.; Dawson, L. The anaerobic digestion of solid organic waste. Waste Manag. 2011, 31, 1737–1744. [Google Scholar] [CrossRef]
- Naznee, S.; Mishra, A.K.; Raju, N.J.; Mehmood, G. Coastal macrophytes as bioindicators of trace metals in the Asia’s largest lagoon ecosystem. Mar. Pol. Bull. 2022, 178, 113576. [Google Scholar] [CrossRef]
- Warnau, M.; Ledent, G.; Temara, A.; Bouquegneau, J.M.; Jangoux, M.; Dubois, P. Heavy metals in Posidonia oceanica and Paracentrotus lividus from seagrass beds of the north-western. Mediterr. Sci. Total Environ. 1995, 171, 95–99. [Google Scholar] [CrossRef]
- Ward, T.J. Temporal variation of metals in the seagrass Posidonia australis and its potential as a sentinel accumulator near a lead smelter. Mar. Biol. 1987, 95, 315–321. [Google Scholar] [CrossRef]
- Öztürk, R.Ç.; Gedik, K.; Şahin, A.; Özvarol, Y.; Mutlu, E. Comparative trace element trends in Posidonia oceanica and its sediments along the Turkish-Mediterranean Sea coast. Environ. Sci. Pollut. Res. 2021, 28, 31697–61407. [Google Scholar] [CrossRef]
- Guo, Q.; Majeed, S.; Xu, R.; Zhang, K.; Kakade, A.; Kahn, A.; Hafeez, H.Y.; Mao, C.; Liu, P.; Li, X. Heavy metals interact with the microbial community and affect biogas production in anaerobic digestion: A review. J. Environ. Manag. 2019, 240, 266–272. [Google Scholar] [CrossRef]
- van Hullebusch, E.D.; Guibaud, G.; Simon, S.; Lenz, M.; Yekta, S.S.; Fermoso, F.G.; Jain, R.; Duester, L.; Roussel, J.; Guillon, E.; et al. Methodological approaches for fractionation and speciation to estimate trace element bioavailability in engineered anaerobic digestion ecosystems: An overview. Crit. Rev. Environ. Sci. Technol. 2016, 46, 1324–1366. [Google Scholar] [CrossRef]
- Alrawashdeh, K.A.; Gul, E.; Yang, Q.; Yang, H.; Bartocci, P.; Fantozzi, F. Effect of heavy metals in the performance of anaerobic digestion of olive mill waste. Processes 2020, 8, 1146. [Google Scholar] [CrossRef]
- Zhang, J.; Qi, C.; Wang, Y.; Li, Y.; Han, T.; Gong, X.; Shan, M.; Li, G.; Luo, W. Enhancing biogas production from livestock manure in solid-state anaerobic digestion by sorghum-vinegar residues. Environ. Technol. Innov. 2022, 26, 102276. [Google Scholar] [CrossRef]
- Sarker, S.; Lamb, J.J.; Hjelme, D.R.; Lien, K.M. A review of the role of critical parameters in the design and operation of biogas production plants. Appl. Sci. 2019, 9, 1915. [Google Scholar] [CrossRef]
- Chen, Y.; Cheng, J.J.; Creamer, K.S. Inhibition of anaerobic digestion process: A review. Bioresour. Technol. 2008, 99, 4044–4067. [Google Scholar] [CrossRef]
- Hassan, M.; Masud, S.F.B.; Anwar, M.; Zhao, C.; Singh, R.S.; Mehryar, E. Methane enhancement by the co-digestion of thermochemical alkali solubilized rice husk and cow manure: Lignocellulosics decomposition perspectives. Biomass Convers. Biorefin 2023, 13, 13963–13975. [Google Scholar] [CrossRef]
- Raposo, F.; Fernández-Cegrí, V.; De la Rubia, M.A.; Borja, R.; Béline, F.; Cavinato, C.; Demirer, G.; Fernández, B.; Fernández-Polanco, M.; Frigon, J.C.; et al. Biochemical methane potential (BMP) of solid organic substrates: Evaluation of anaerobic biodegradability using data from an international interlaboratory study. J. Chem. Technol. Biotechnol. 2011, 86, 1088–1098. [Google Scholar] [CrossRef]
- Rhee, C.; Park, S.G.; Yu, S.I.; Dalantai, T.; Shin, J.; Chae, K.J.; Shin, S.G. Mapping microbial dynamics in anaerobic digestion system linked with organic composition of substrates: Protein and lipid. Energy 2023, 275, 127411. [Google Scholar] [CrossRef]
- Malik, R.K.; Singh, R.; Tauro, P. Effect of inorganic nitrogen supplementation on biogas production. Biol. Wastes 1987, 21, 139–142. [Google Scholar] [CrossRef]
- Liu, L.; Du, Z.; Li, Y.; Han, R. Effects of urea addition on anaerobic digestion characteristics of hulless barley straw pretreated with KOH. J. Mater. Cycles Waste Manag. 2023, 25, 479–489. [Google Scholar] [CrossRef]
- Guo, Y.; Xiao, F.; Yan, M.; Tang, S.; Duan, Z.; Sun, Y.; Li, Y. Effect of ammonia on anaerobic digestion: Focusing on energy flow and electron transfer. Chem. Eng. J. 2023, 471, 144638. [Google Scholar] [CrossRef]
- Li, C.; Strömbergc, S.; Liu, G.; Nges, I.A.; Liu, J. Assessment of regional biomass as co-substrate in the anaerobic digestion of chicken manure: Impact of co-digestion with chicken processing waste seagrass and Miscanthus. Biochem. Eng. J. 2017, 118, 1–10. [Google Scholar] [CrossRef]
- Moretti, E.R.; Roston, D.M.; da Silva, A.J.; Pereda-Reyes, I. Biogas from aquatic plants: A bioenergetics incentive for constructed wetlands usage. Heliyon 2023, 9, e12537. [Google Scholar] [CrossRef] [PubMed]
- Dutra, J.C.F.; Passos, M.F.; da Silva, T.F.; Mockaitis, G. Pyrolysis and anaerobic digestion of the Egeria Densa biomass in different pretreatment conditions for potential use as a substrate in the generation of bioproducts. J. Water Process Eng. 2021, 40, 101772. [Google Scholar] [CrossRef]
- Li, L.; Kong, X.; Yang, F.; Li, D.; Yuan, Z.; Sun, Y. Biogas production potential and kinetics of microwave and conventional thermal pretreatment of grass. Appl. Biochem. Biotechnol. 2012, 166, 1188–1191. [Google Scholar] [CrossRef]
- Fernández-Rodríguez, M.J.; De La Lama-Calvente, D.; García-González, M.; Moreno-Fernández, J.; Jiménez-Rodríguez, A.; Borja, R.; Rincón-Llorente, B. Integral valorization of two-phase olive mill solid waste (OMSW) and related washing waters by anaerobic co-digestion of OMSW and the microalga Raphidocelis subcapitata cultivated in these effluents. J. Agric. Food Chem. 2022, 70, 3219–3227. [Google Scholar] [CrossRef]
- Sarto, S.; Hildayat, R.; Syaichurrozi, I. Effect of chemical pretreatment using sulfuric acid on biogas production from water hyacinth and kinetics. Renew. Energ. 2019, 132, 335–350. [Google Scholar] [CrossRef]
- Scarcelli, P.G.; Serejo, M.L.; Paulo, P.L.; Boncz, M.Á. Evaluation of biomethanization during co-digestion of thermally pretreated microalgae and waste activated sludge, and estimation of its kinetic parameters. Sci. Total Environ. 2020, 706, 135745. [Google Scholar] [CrossRef]
- Wang, M.; Lee, E.; Dilbeck, M.P.; Liebelt, M.; Zhang, Q.; Ergas, S.J. Thermal pre-treatment of microalgae for biomethane production: Experimental studies, kinetics and energy analysis. J. Chem. Technol. Biotechnol. 2017, 92, 399–407. [Google Scholar] [CrossRef]
- Donoso-Bravo, A.; Perez-Elvira, S.I.; Fernández-Polanco, F. Application of simplified models for anaerobic biodegradability tests. Evaluation of pre-treatment processes. Chem. Eng. J. 2010, 160, 607–614. [Google Scholar] [CrossRef]
- Fernández-Rodríguez, M.J.; De la Lama-Calvente, D.; Jiménez-Rodríguez, A.; Borja, R.; Rincón-Llorente, B. Influence of the cell wall of Chlamydomonas reinhardtii on anaerobic digestion yield and on its anaerobic co-digestion with a carbon-rich substrate. Process Saf. Environ. Prot. 2019, 128, 167–175. [Google Scholar] [CrossRef]
Disclaimer/Publisher’s Note: The statements, opinions and data contained in all publications are solely those of the individual author(s) and contributor(s) and not of MDPI and/or the editor(s). MDPI and/or the editor(s) disclaim responsibility for any injury to people or property resulting from any ideas, methods, instructions or products referred to in the content. |
© 2025 by the authors. Licensee MDPI, Basel, Switzerland. This article is an open access article distributed under the terms and conditions of the Creative Commons Attribution (CC BY) license (https://creativecommons.org/licenses/by/4.0/).