
A Cognitive Diagnosis Model Using Convolutional Neural Networks to Predict Student Scores


Abstract
1. Introduction
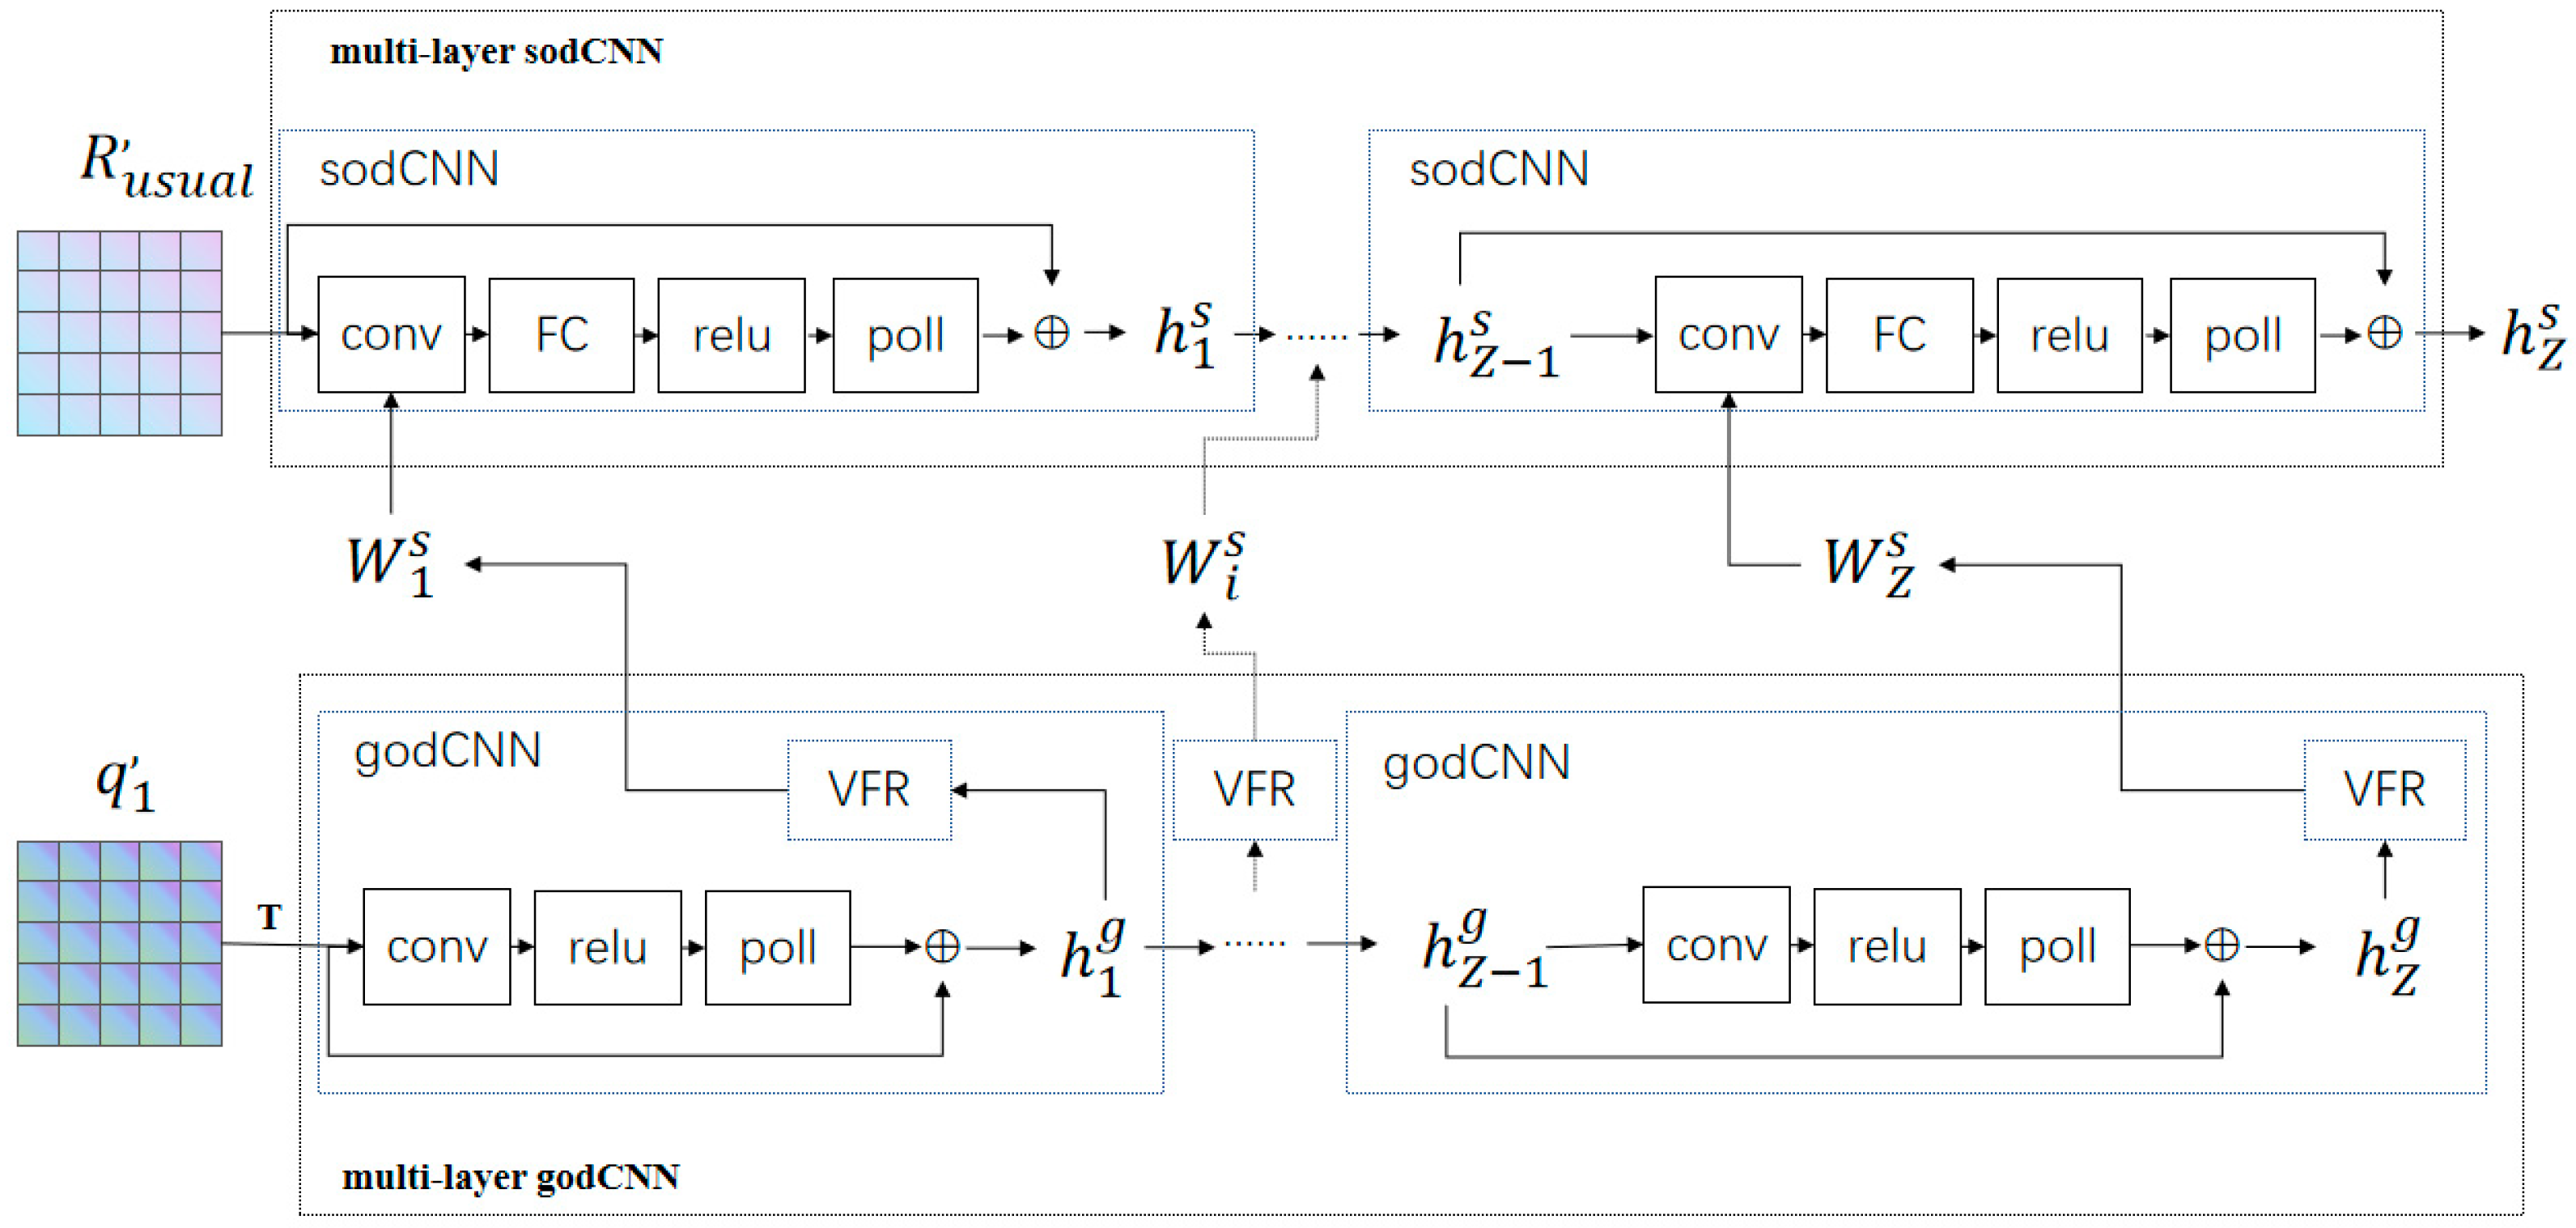
- Two multi-layer (general and special) one-dimensional convolutional neural networks are combined, that is, the convolutional kernel of the special one-dimensional convolutional neural network is generated by the ordinary one-dimensional convolutional neural network, so as to model the cognitive diagnosis process of students and the prediction process of final exam results.
- The attention mechanism is used to further improve the prediction accuracy of the model by considering the influence of the intra-level relationships among students, questions and knowledge points on students’ answer results.
- On the public datasets FrcSub [5], Math1 [5] and Math2 [5] and the self-built BOIT dataset, the proposed CNNCD model and some classical cognitive diagnosis models are compared and analyzed through experiments, and the three indexes of Accuracy [9], Root Mean Square Error (RMSE [10]) and Mean Absolute Error (MAE [10]) are evaluated, respectively. The experimental results show that the proposed model is superior to the comparison models, which indicates the feasibility and effectiveness of the proposed model.
2. Related Work
2.1. Attention Mechanism
2.2. Cognitive Diagnosis Based on Neural Networks
3. Materials and Methods
3.1. Dataset
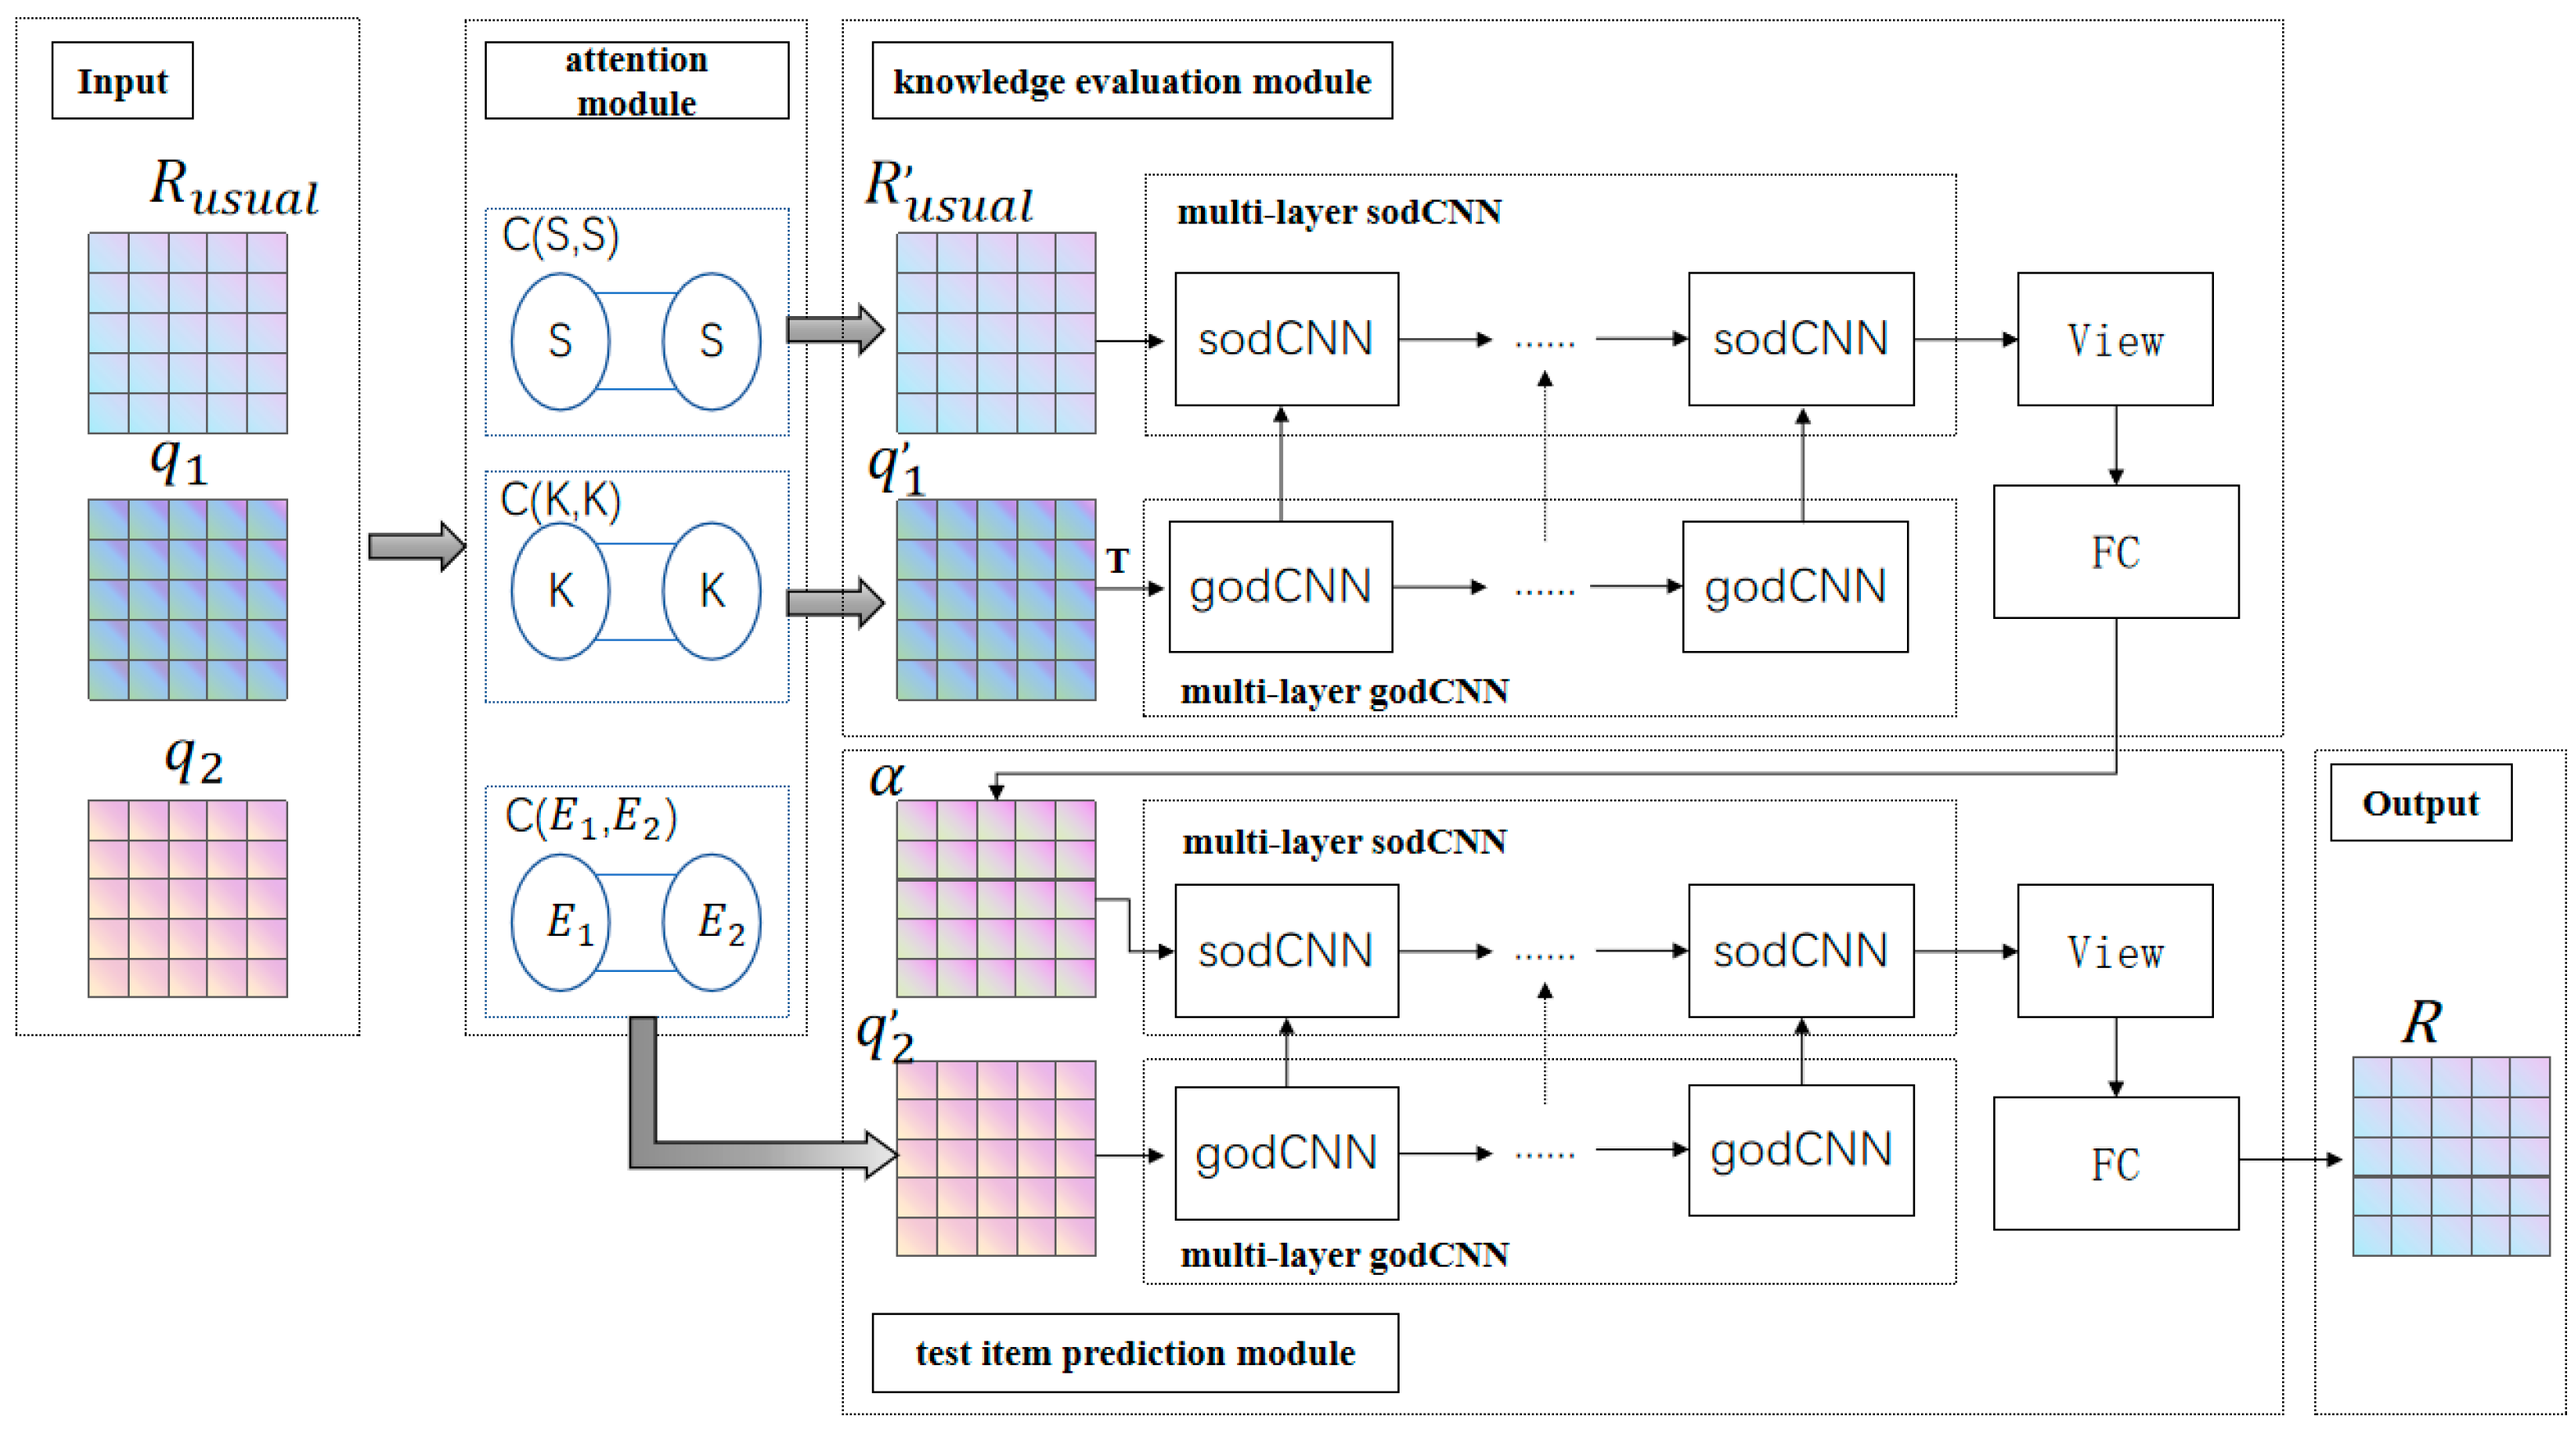
3.2. CNNCD Model
3.2.1. Attention Module
3.2.2. Knowledge Evaluation Module
3.2.3. Test Item Prediction Module
3.2.4. Loss Function and Network Optimization
3.3. Performance Index
4. Experiments and Analysis of Results
4.1. Comparative Experiment
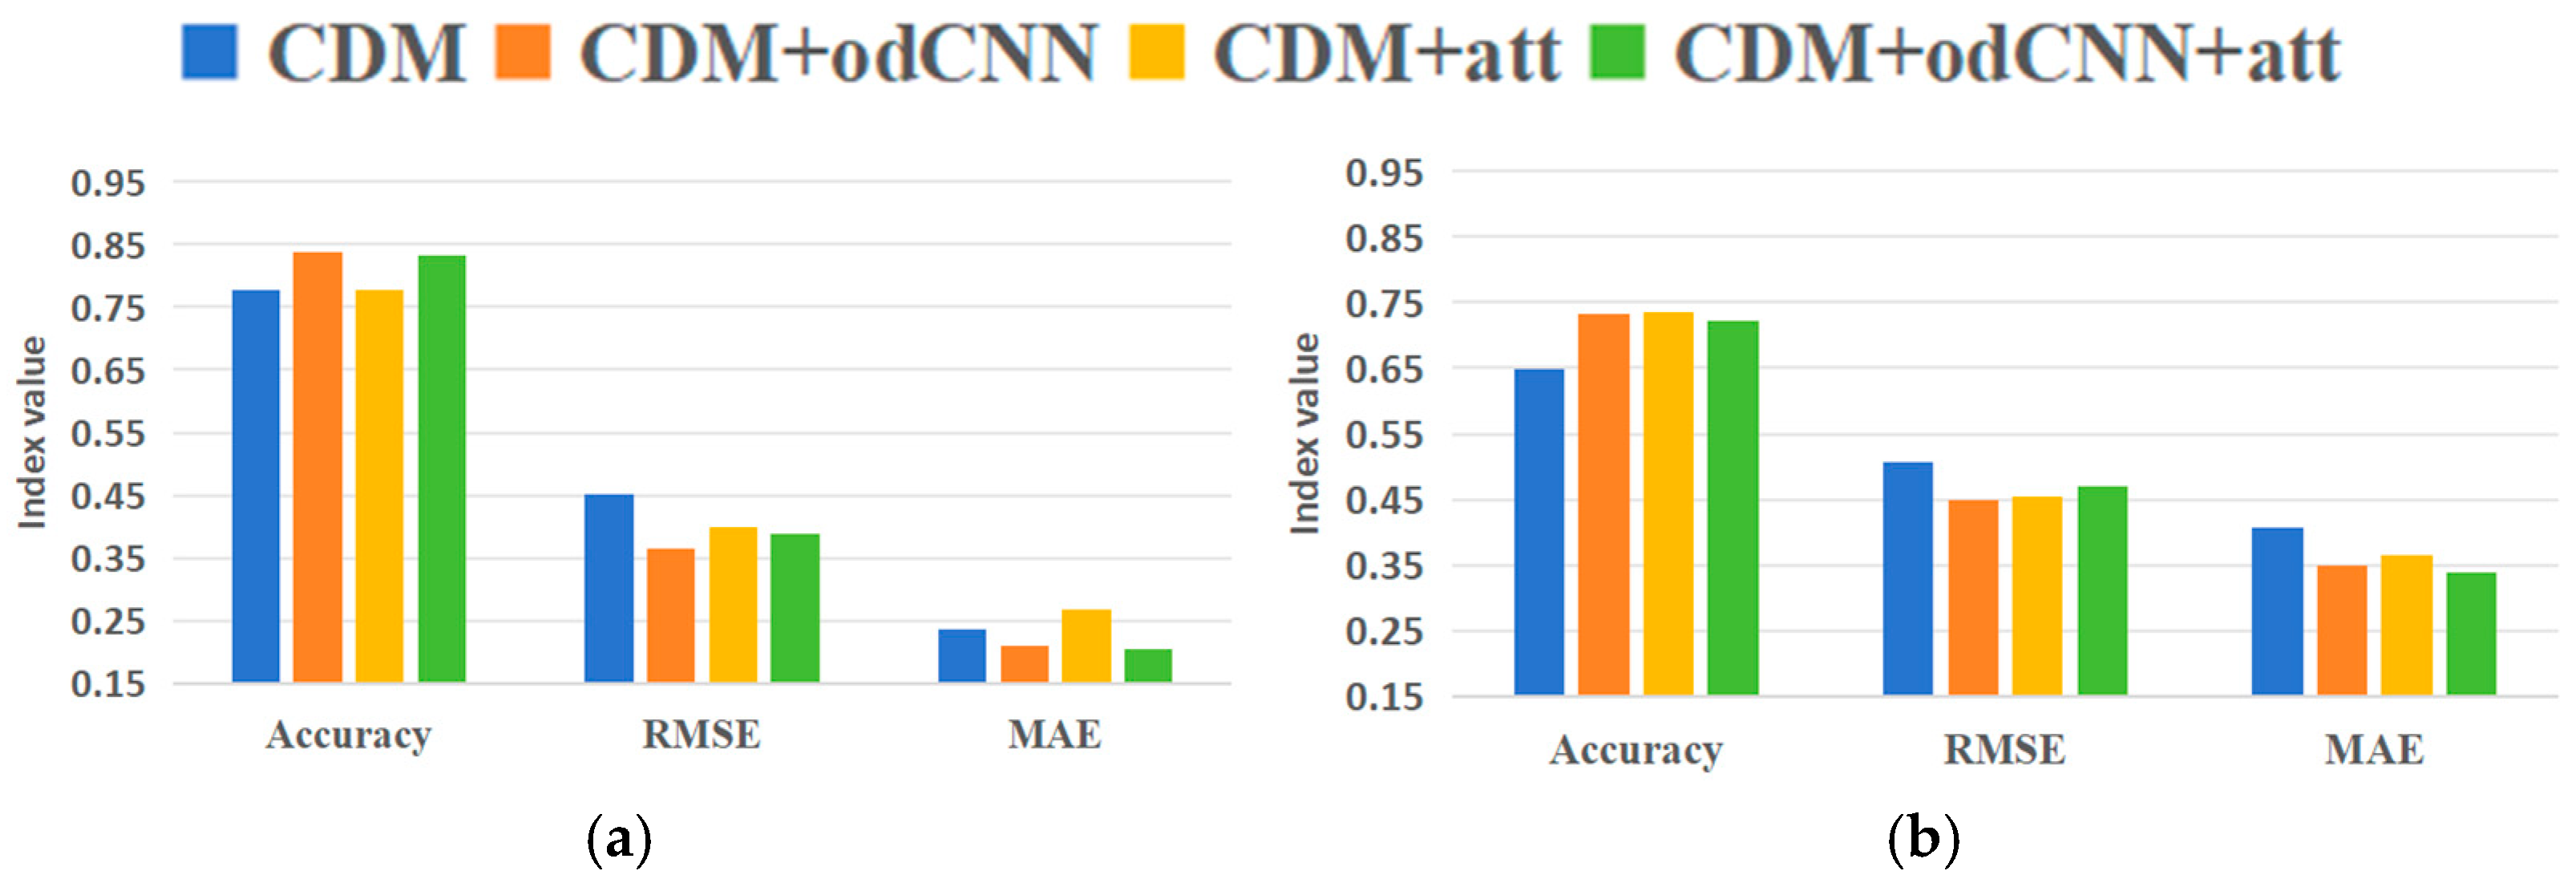
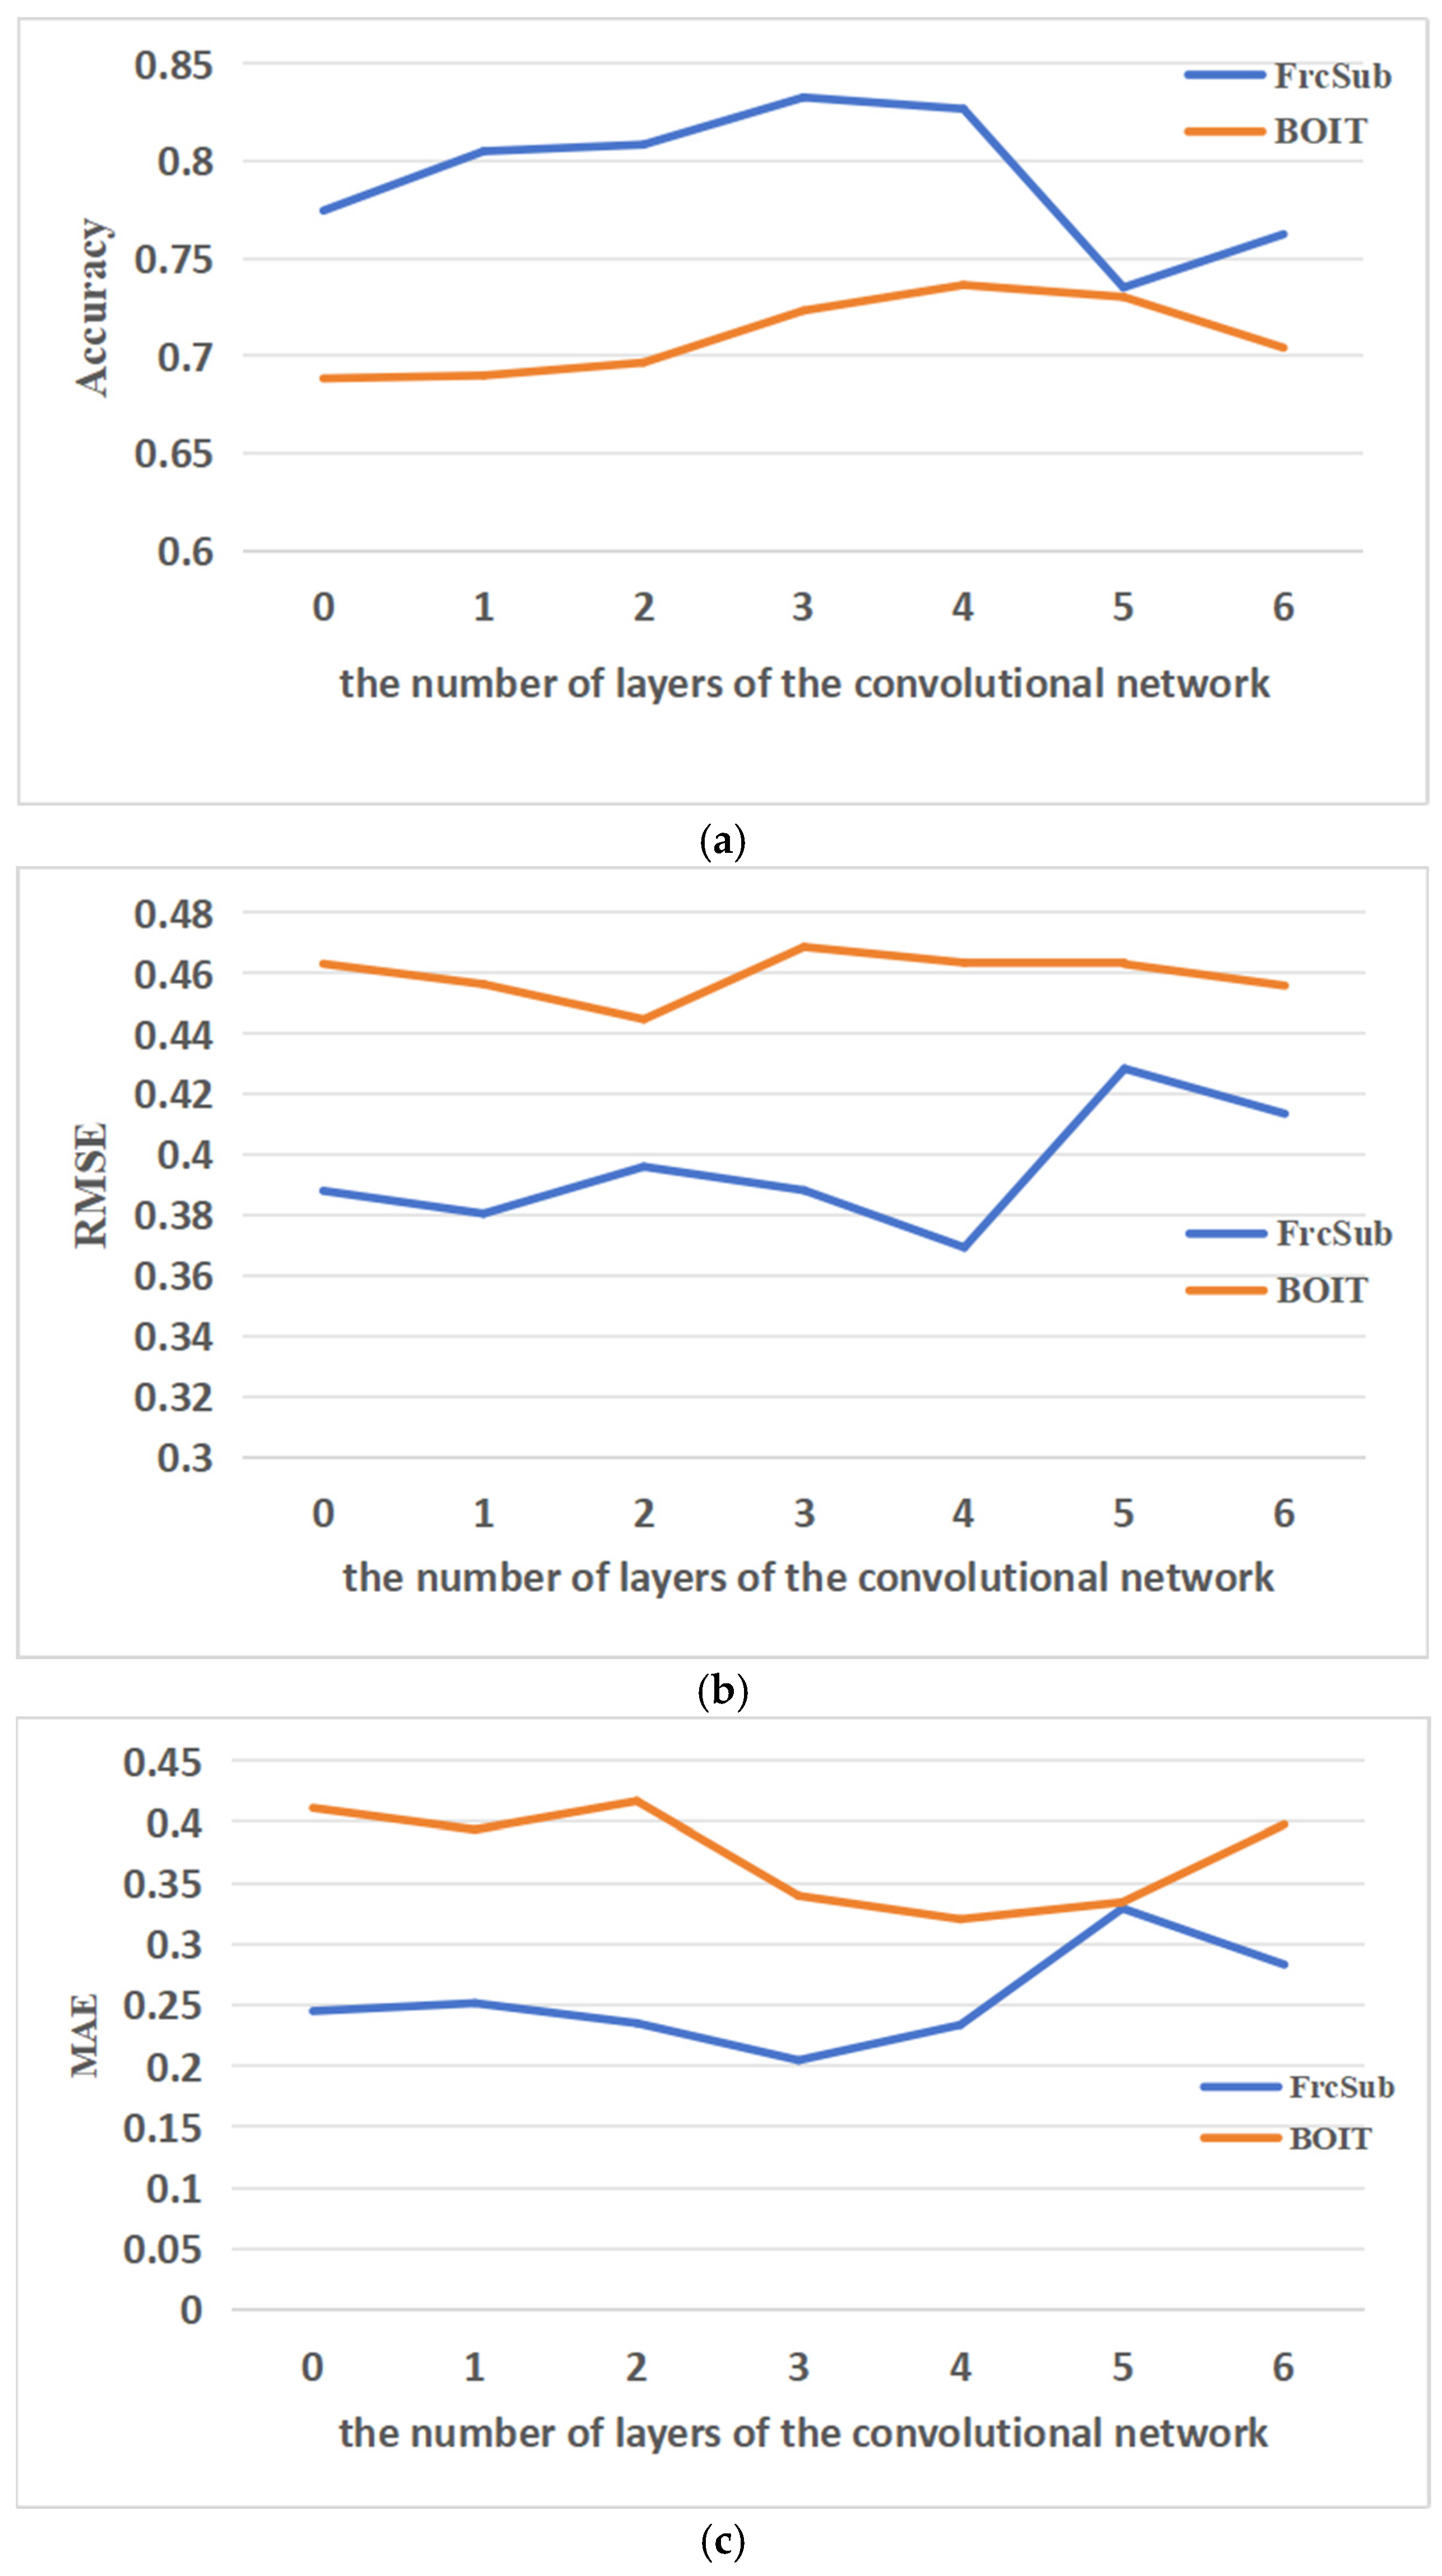
4.2. Ablation Experiment
5. Conclusions
Author Contributions
Funding
Institutional Review Board Statement
Informed Consent Statement
Data Availability Statement
Conflicts of Interest
Correction Statement
References
- Cheng, X. Study on Learning Diagnosis and Personalized Test Item Recommendation Based on Graph Embedding. Master’s Thesis, Hubei University, Wuhan, China, 2023. [Google Scholar]
- Tao, J.; Zhao, W.; Zhang, Y.; Guo, Q.; Min, B.; Xu, X.; Liu, F. Cognitive diagnostic assessment: A Q-matrix constraint-based neural network method. Behav. Res. Methods 2024, 56, 6981–7004. [Google Scholar] [CrossRef]
- Embretson, S.; Reise, S. Item Response Theory for Psychologists; Psychology Press: New York, NY, USA, 2000; Volume 4. [Google Scholar] [CrossRef]
- Jimmy, D.l.T. DINA Model and Parameter Estimation: A Didactic. J. Educ. Behav. Stat. 2009, 34, 115–130. [Google Scholar]
- Liu, Q.; Wu, R.; Chen, E.; Xu, G.; Su, Y.; Chen, Z.; Hu, G. Fuzzy Cognitive Diagnosis for Modelling Examinee Performance. ACM Trans. Intell. Syst. Technol. (TIST) 2018, 9, 1–26. [Google Scholar] [CrossRef]
- Wang, F.; Liu, Q.; Chen, E.; Huang, Z.; Chen, Y.; Yin, Y.; Huang, Z.; Wang, S. Neural Cognitive Diagnosis for Intelligent Education Systems. Proc. AAAI Conf. Artif. Intell. 2020, 34, 6153–6161. [Google Scholar] [CrossRef]
- Wang, L.; Luo, Z.; Liu, C. Cognitiveand Response Model for Evaluation of MOOC Learners. Chin. J. Electron. 2023, 51, 18–25. [Google Scholar]
- Hirose, H. Prediction of Success or Failure for Final Examination using Nearest Neighbor Method to the Trend of Weekly Online Testing. arXiv 2018, arXiv:1901.02056. [Google Scholar]
- Yang, H. Feature mining method of equipment support data based on attribute classification. Ordnance Mater. Sci. Eng. 2020, 43, 124–128. [Google Scholar] [CrossRef]
- Hodson, T.O. Root-mean-square error (RMSE) or mean absolute error (MAE): When to use them or not. Geosci. Model Dev. 2022, 15, 5481–5487. [Google Scholar] [CrossRef]
- Zhao, T.; Song, T. Establishing a Fusion Model of Attention Mechanism and Generative Adversarial Network to Estimate Students’ Attitudes in English Classes. Teh. Vjesn.—Tech. Gaz. 2022, 29, 1464–1471. [Google Scholar]
- Ma, H.; Li, M.; Wu, L.; Zhang, H.; Cao, Y.; Zhang, X.; Zhao, X. Knowledge-Sensed Cognitive Diagnosis for Intelligent Education Platforms. In Proceedings of the 31st ACM International Conference on Information & Knowledge Management, Atlanta, GA, USA, 17–21 October 2022; pp. 1451–1460. [Google Scholar]
- Qian, L.; Zheng, K.; Wang, L.; Li, S. Student State-aware knowledge tracing based on attention mechanism: A cognitive theory view. Pattern Recognit. Lett. 2024, 184, 190–196. [Google Scholar] [CrossRef]
- Wu, J.; Zhang, Y.; Fu, L.; Luo, Y.; Xie, H.; Hua, R. BRAYOLOv7: An improved model based on attention mechanism and raspberry pi implementation for online education. Int. J. Sen. Netw. 2024, 46, 45–59. [Google Scholar] [CrossRef]
- Dey, A.; Anand, A.; Samanta, S.; Sah, B.K.; Biswas, S. Attention-Based AdaptSepCX Network for Effective Student Action Recognition in Online Learning. Procedia Comput. Sci. 2024, 233, 164–174. [Google Scholar] [CrossRef]
- Du, L.; Xu, Y. Development strategy of online English teaching based on attention mechanism and recurrent neural network recommendation method. Int. J. Data Min. Bioinform. 2024, 28, 140–155. [Google Scholar] [CrossRef]
- Miao, W. A Study on the Teaching Design of a Hybrid Civics Course Based on the Improved Attention Mechanism. Appl. Sci. 2022, 12, 1243. [Google Scholar] [CrossRef]
- Su, B.; Peng, J. Sentiment Analysis of Comment Texts on Online Courses Based on Hierarchical Attention Mechanism. Appl. Sci. 2023, 13, 4204. [Google Scholar] [CrossRef]
- Yan, C.; Ganglin, W.; Jiaxin, L.; Yunwei, C.; Qinghua, Z.; Feng, T.; Haiping, Z.; Qianying, W.; Yaqiang, W. A prediction model of student performance based on self-attention mechanism. Knowl. Inf. Syst. 2022, 65, 733–758. [Google Scholar]
- Hu, P.; Tang, X.; Yang, L.; Kong, C.; Xia, D. LCANet: A model for analysis of students real-time sentiment by integrating attention mechanism and joint loss function. Complex Intell. Syst. 2024, 11, 27. [Google Scholar] [CrossRef]
- Cheng, S.; Liu, Q.; Chen, E.; Huang, Z.; Huang, Z.; Chen, Y.; Ma, H.; Hu, G. DIRT: Deep Learning Enhanced Item Response Theory for Cognitive Diagnosis. In Proceedings of the 28th ACM International Conference on Information and Knowledge Management, Beijing, China, 3–7 November 2019; pp. 2397–2400. [Google Scholar]
- Yeung, C.-K. Deep-IRT: Make Deep Learning Based Knowledge Tracing Explainable Using Item Response Theory. arXiv 2019, arXiv:1904.11738. [Google Scholar]
- Gao, W.; Liu, Q.; Huang, Z.; Yu, Y.; Bi, H.; Wang, M.-C.; Ma, J.; Wang, S.; Su, Y. RCD:Relation Map Driven Cognitive Diagnosis for Intelligent Education Systems; Computing Association: New York, NY, USA, 2021. [Google Scholar] [CrossRef]
- Liu, Y.; Zhang, L. Cognitive diagnosis model integrating forgetting and knowledge importance. J. South China Univ. Technol. (Nat. Sci. Ed.) 2023, 51, 54–62. [Google Scholar]
- Girshick, R. Fast R-CNN. In Proceedings of the 2015 IEEE International Conference on Computer Vision (ICCV), Santiago, Chile, 7–13 December 2015; pp. 1440–1448. [Google Scholar]
- Tian, Y.; Zhang, Y.; Zhang, H. Recent Advances in Stochastic Gradient Descent in Deep Learning. Mathematics 2023, 11, 682. [Google Scholar] [CrossRef]
- Smith, L.N.; Topin, N. Super-convergence: Very fast training of neural networks using large learning rates. In Proceedings of the Defense + Commercial Sensing, Baltimore, MD, USA, 15–16 April 2019. [Google Scholar]
- Reckase, M.D. 18 Multidimensional Item Response Theory. In Handbook of Statistics; Rao, C.R., Sinharay, S., Eds.; Elsevier: Amsterdam, The Netherlands, 2006; Volume 26, pp. 607–642. [Google Scholar]
- Luo, Z.; Li, Y.; Yu, X.; Gao, C.; Peng, Y. A Simple Cognitive Diagnosis Method Based on Q-Matrix Theory. Acta Psychol. Sin. 2015, 47, 264–272. [Google Scholar] [CrossRef]

| DataSet | Number of Students | Number of Questions | Number of Knowledge Points |
|---|---|---|---|
| FrcSub | 536 | 20 | 8 |
| Math1 | 4209 | 15 | 11 |
| Math2 | 3911 | 16 | 16 |
| BOIT | 198 | 38 | 11 |
| TSR | Accuracy | RMSE | MAE | |||||||||||||
|---|---|---|---|---|---|---|---|---|---|---|---|---|---|---|---|---|
| Model | 0.3 | 0.4 | 0.5 | 0.6 | 0.7 | 0.3 | 0.4 | 0.5 | 0.6 | 0.7 | 0.3 | 0.4 | 0.5 | 0.6 | 0.7 | |
| FuzzyCDF | 0.722 | 0.749 | 0.774 | 0.793 | 0.814 | 0.436 | 0.418 | 0.399 | 0.391 | 0.374 | 0.378 | 0.357 | 0.332 | 0.327 | 0.309 | |
| DINA | 0.489 | 0.500 | 0.503 | 0.529 | 0.542 | 0.715 | 0.707 | 0.705 | 0.686 | 0.677 | 0.511 | 0.500 | 0.497 | 0.471 | 0.458 | |
| IRT | 0.679 | 0.673 | 0.670 | 0.671 | 0.655 | 0.499 | 0.494 | 0.492 | 0.495 | 0.504 | 0.360 | 0.370 | 0.365 | 0.361 | 0.388 | |
| MIRT | 0.704 | 0.726 | 0.754 | 0.749 | 0.795 | 0.495 | 0.475 | 0.446 | 0.457 | 0.410 | 0.308 | 0.290 | 0.263 | 0.264 | 0.222 | |
| NCDM | 0.632 | 0.695 | 0.772 | 0.786 | 0.795 | 0.595 | 0.525 | 0.464 | 0.457 | 0.446 | 0.365 | 0.303 | 0.230 | 0.224 | 0.214 | |
| MCD | 0.720 | 0.743 | 0.750 | 0.770 | 0.795 | 0.469 | 0.437 | 0.423 | 0.406 | 0.384 | 0.317 | 0.299 | 0.298 | 0.286 | 0.268 | |
| CNNCD | 0.743 | 0.762 | 0.787 | 0.815 | 0.828 | 0.427 | 0.412 | 0.390 | 0.374 | 0.366 | 0.307 | 0.314 | 0.256 | 0.257 | 0.206 | |
| TSR | Accuracy | RMSE | MAE | |||||||||||||
|---|---|---|---|---|---|---|---|---|---|---|---|---|---|---|---|---|
| Model | 0.3 | 0.4 | 0.5 | 0.6 | 0.7 | 0.3 | 0.4 | 0.5 | 0.6 | 0.7 | 0.3 | 0.4 | 0.5 | 0.6 | 0.7 | |
| FuzzyCDF | 0.517 | 0.543 | 0.541 | 0.563 | 0.590 | 0.531 | 0.521 | 0.520 | 0.512 | 0.501 | 0.492 | 0.480 | 0.481 | 0.469 | 0.454 | |
| DINA | 0.540 | 0.549 | 0.590 | 0.590 | 0.621 | 0.581 | 0.580 | 0.529 | 0.540 | 0.546 | 0.496 | 0.462 | 0.439 | 0.434 | 0.412 | |
| IRT | 0.552 | 0.500 | 0.489 | 0.553 | 0.426 | 0.563 | 0.619 | 0.528 | 0.553 | 0.750 | 0.466 | 0.491 | 0.465 | 0.469 | 0.578 | |
| MIRT | 0.554 | 0.543 | 0.533 | 0.554 | 0.525 | 0.612 | 0.610 | 0.630 | 0.599 | 0.626 | 0.450 | 0.457 | 0.470 | 0.450 | 0.477 | |
| NCDM | 0.507 | 0.500 | 0.539 | 0.561 | 0.547 | 0.702 | 0.707 | 0.674 | 0.659 | 0.666 | 0.493 | 0.500 | 0.463 | 0.440 | 0.452 | |
| MCD | 0.544 | 0.573 | 0.570 | 0.545 | 0.568 | 0.556 | 0.524 | 0.526 | 0.524 | 0.497 | 0.463 | 0.452 | 0.458 | 0.475 | 0.476 | |
| CNNCD | 0.611 | 0.658 | 0.657 | 0.665 | 0.708 | 0.490 | 0.483 | 0.475 | 0.479 | 0.457 | 0.485 | 0.475 | 0.457 | 0.419 | 0.398 | |
| TSR | Accuracy | RMSE | MAE | |||||||||||||
|---|---|---|---|---|---|---|---|---|---|---|---|---|---|---|---|---|
| Model | 0.3 | 0.4 | 0.5 | 0.6 | 0.7 | 0.3 | 0.4 | 0.5 | 0.6 | 0.7 | 0.3 | 0.4 | 0.5 | 0.6 | 0.7 | |
| FuzzyCDF | 0.552 | 0.560 | 0.574 | 0.591 | 0.613 | 0.516 | 0.513 | 0.509 | 0.497 | 0.491 | 0.473 | 0.468 | 0.464 | 0.452 | 0.438 | |
| DINA | 0.552 | 0.577 | 0.561 | 0.605 | 0.672 | 0.562 | 0.551 | 0.557 | 0.514 | 0.490 | 0.482 | 0.460 | 0.455 | 0.435 | 0.386 | |
| IRT | 0.558 | 0.518 | 0.547 | 0.445 | 0.564 | 0.596 | 0.643 | 0.544 | 0.681 | 0.616 | 0.462 | 0.497 | 0.459 | 0.581 | 0.498 | |
| MIRT | 0.528 | 0.545 | 0.520 | 0.550 | 0.549 | 0.642 | 0.613 | 0.634 | 0.611 | 0.608 | 0.473 | 0.459 | 0.482 | 0.450 | 0.457 | |
| NCDM | 0.582 | 0.593 | 0.573 | 0.651 | 0.710 | 0.646 | 0.638 | 0.653 | 0.591 | 0.507 | 0.418 | 0.407 | 0.427 | 0.349 | 0.345 | |
| MCD | 0.529 | 0.542 | 0.578 | 0.566 | 0.684 | 0.565 | 0.555 | 0.529 | 0.528 | 0.465 | 0.475 | 0.473 | 0.449 | 0.463 | 0.448 | |
| CNNCD | 0.589 | 0.610 | 0.604 | 0.687 | 0.778 | 0.490 | 0.496 | 0.492 | 0.464 | 0.407 | 0.477 | 0.496 | 0.467 | 0.439 | 0.321 | |
| Model | Accuracy | RMSE | MAE |
|---|---|---|---|
| FuzzyCDF | 0.585 | 0.512 | 0.444 |
| DINA | 0.590 | 0.538 | 0.445 |
| IRT | 0.685 | 0.494 | 0.372 |
| MIRT | 0.619 | 0.547 | 0.386 |
| NCDM | 0.695 | 0.498 | 0.321 |
| MCD | 0.703 | 0.453 | 0.368 |
| CNNCD | 0.734 | 0.448 | 0.348 |
Disclaimer/Publisher’s Note: The statements, opinions and data contained in all publications are solely those of the individual author(s) and contributor(s) and not of MDPI and/or the editor(s). MDPI and/or the editor(s) disclaim responsibility for any injury to people or property resulting from any ideas, methods, instructions or products referred to in the content. |
© 2025 by the authors. Licensee MDPI, Basel, Switzerland. This article is an open access article distributed under the terms and conditions of the Creative Commons Attribution (CC BY) license (https://creativecommons.org/licenses/by/4.0/).
Share and Cite
Mo, J.; Hao, L.; Yuan, H.; Shou, Z. A Cognitive Diagnosis Model Using Convolutional Neural Networks to Predict Student Scores. Appl. Sci. 2025, 15, 2875. https://doi.org/10.3390/app15062875
Mo J, Hao L, Yuan H, Shou Z. A Cognitive Diagnosis Model Using Convolutional Neural Networks to Predict Student Scores. Applied Sciences. 2025; 15(6):2875. https://doi.org/10.3390/app15062875
Chicago/Turabian StyleMo, Jianwen, Longhua Hao, Hua Yuan, and Zhaoyu Shou. 2025. "A Cognitive Diagnosis Model Using Convolutional Neural Networks to Predict Student Scores" Applied Sciences 15, no. 6: 2875. https://doi.org/10.3390/app15062875
APA StyleMo, J., Hao, L., Yuan, H., & Shou, Z. (2025). A Cognitive Diagnosis Model Using Convolutional Neural Networks to Predict Student Scores. Applied Sciences, 15(6), 2875. https://doi.org/10.3390/app15062875