1. Introduction
Stored grains and desiccants may be dried by ventilating them with air that has a low relative humidity. The performance of driers can be estimated accurately only if the equilibrium moisture content of the solid phase is reliably known as a function of the temperature and humidity of its surrounding atmosphere. In other words, it is essential to have accurate sorption isotherms. This enables the moisture content of the solid phase in the vicinity of the air inlet to the drier to be estimated. This may be the target moisture content, or it may be a constraint imposed on the moisture content. For example, some grains, such as rice and corn, must not be over-dried because it results in their cracking during processing. If desirable properties such as germination and dough quality are to be preserved, temperature constraints must be imposed on the air used to dry grains. The overall rate of drying of hygroscopic materials, such as food grains, is a function of the differences in the humidities of the air entering and leaving the bed. To calculate the humidity of air leaving a drier, it is important to have isotherms that are accurate when the solid material has a high moisture content.
Weak physico-chemical bonds form when moisture is adsorbed by hygroscopic materials. The formation of the bonds is accompanied by the liberation of energy, which is termed the isothermal differential heat of wetting,
, of the solid phase [
1]. Wetting of the solid reduces the surface energy of the pores that permeate grains and desiccants; hence, the enthalpy of the solid decreases when its moisture content increases. As a result,
is a negative quantity. Isotherms provide relationships not only between
,
, and
, but they also subsume information on the differential heat of wetting
. Hence, it is important that sorption isotherms be not only accurate but expressions for
must be consistent with the isotherms. The energy required to remove a given quantity of adsorbed water is a function of the integral heat of wetting, which is the integration of
between the initial and final moisture contents. As evidenced by the work of Sanches et al. [
2], the value of
generally increases rapidly as the moisture content of the solids tends to zero; hence, it is important that psychrometric data are gathered in the region of low relative humidity, i.e., 0
.
The commercial importance of canola has resulted in its psychrometric properties receiving considerable attention in the scientific literature. For example, Sun and Byrne [
3] identify twelve publications that present experimental data on the sorption properties of canola that includes 668 experimental data points. They comprise 21 subsets that include adsorption and desorption. Sun and Byrne [
3] fitted their data to the modified Chung–Pfost [
4], the modified Halsey reported by Iglesias et al. [
5], the modified Henderson used by Thompson et al. [
6], and the modified Oswin [
7] equations. They concluded that the modified Halsey equation provides the most accurate estimates of the relative humidities and moisture contents in the adsorption, desorption, and combined cases. Sun and Byrne [
3] report that in the case of the Halsey model, the mean relative deviation
between the modelled
and experimental
moisture contents defined by
is 0.084 and 0.17 for the adsorption and desorption isotherms, respectively. They recognise that this is a significant error, and they caution against fitting isotherms to only one set of experimental data. This need for caution is evident when examining the experimental results obtained by Gazor [
8], who found that Halsey’s equation is clearly the least accurate, which is diametrically contrary to the finding of Sun and Byrne [
3].
Majd et al. [
9] also determined the psychrometric properties of canola. A motivation of their work is to estimate the energy required to remove moisture from canola. As alluded to above, this comprises both the latent heat of vaporisation of water and the differential heat of wetting to remove moisture that is bound to the substrate of canola. A key quantity in estimating the isothermal differential heat of wetting is the partial differential of the relative humidity with respect to temperature when the moisture content of canola is constant,
[
10,
11]. An inspection of Majd et al.’s [
9] experimental results suggests that their values of
are about double those obtained by Gazor [
8]. As a result, their estimated values of the isothermal differential heat of wetting are also about twice those estimated by Gazor [
8]. Ceteris paribus, we expect Majd et al.’s [
9] sorption data to predict a lower rate of drying than those of Gazor [
8] because more energy is required to desorb moisture.
Inconsistencies may arise when sorption isotherms are accurately fitted to inaccurate data. For example, Close and Banks [
12] fitted sorption data for silica gel to a set of polynomials that contain 25 fitted parameters. As a result, they captured erroneous details that give rise to unrealistic discontinuities in the simulation of heat and mass transfer in ventilated hygroscopic porous media. The issue was partially resolved when Close and Banks [
12] replaced a 14-parameter polynomial with one that has only one parameter. Hunter [
13] also observed that shock fronts are likely to arise when his isotherm is used to predict the speeds at which heating and wetting waves propagate through beds of aerated wheat. When Cenkowski et al. [
14] modelled the drying of canola, they modified the Henderson isotherm to ensure that the maximum equilibrium relative humidity is 0.8. This has the effect of reducing the rate at which water vapour is expelled from beds of drying canola, which increases the predicted time of drying. Without this ad hoc modification to the sorption isotherm, commercial drying systems would be under-designed. However, the ad hoc nature of the modification points to an underlying problem with sorption data that must be addressed in future work.
Although both Gazor [
8] and Majd et al. [
9] refer to the importance of psychrometric properties influencing the rate of drying of canola, neither explicitly quantify their effects. This paper fills this lacuna by estimating the speeds at which drying and temperature fronts propagate through beds of drying canola. The work also highlights the need to formulate accurate and thermodynamically consistent sorption data over wide ranges of temperature and relative humidity.
2. Mechanisms of Drying Hygroscopic Porous Media
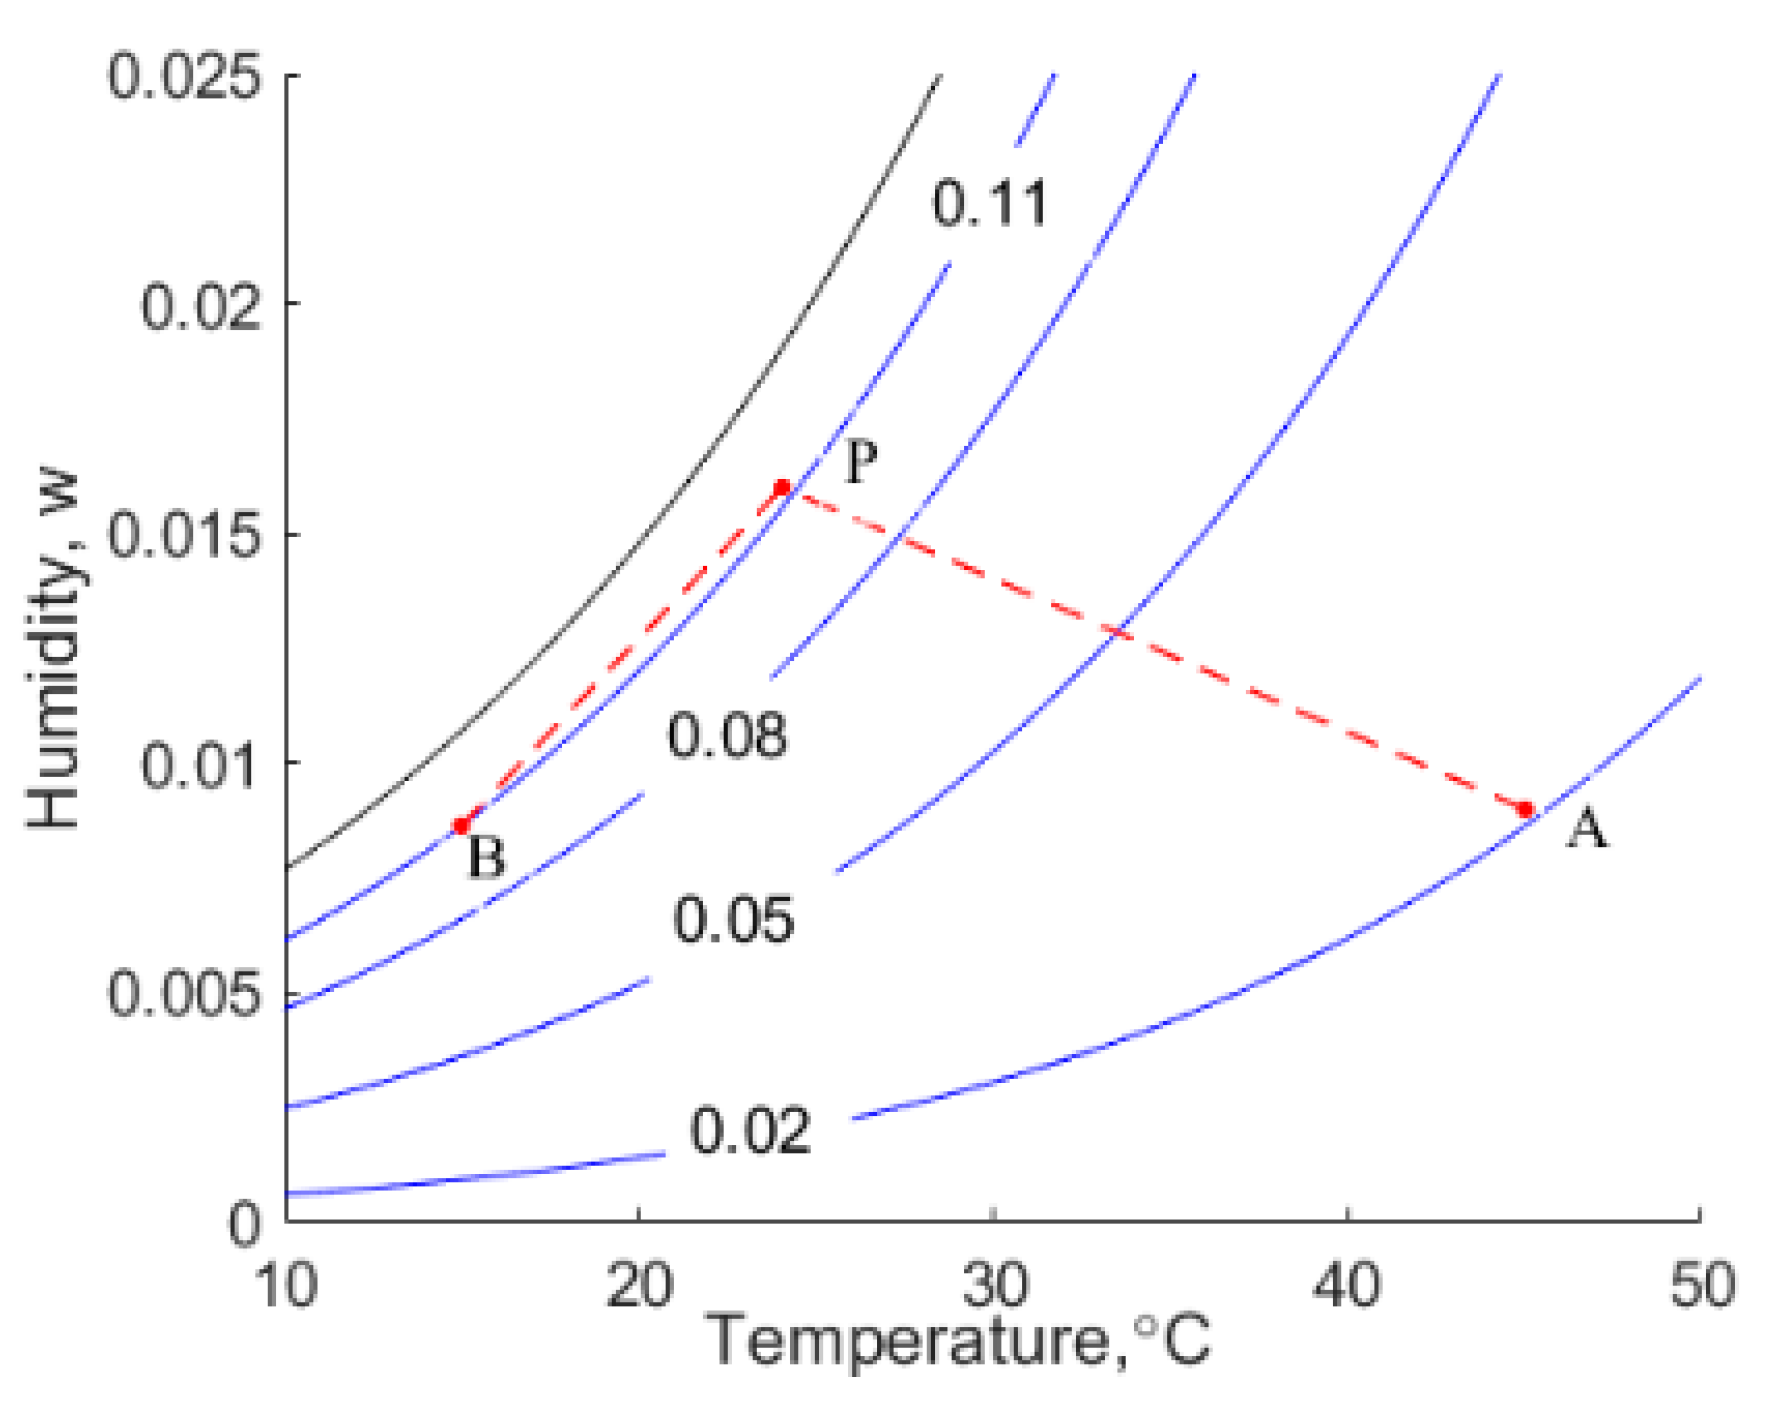
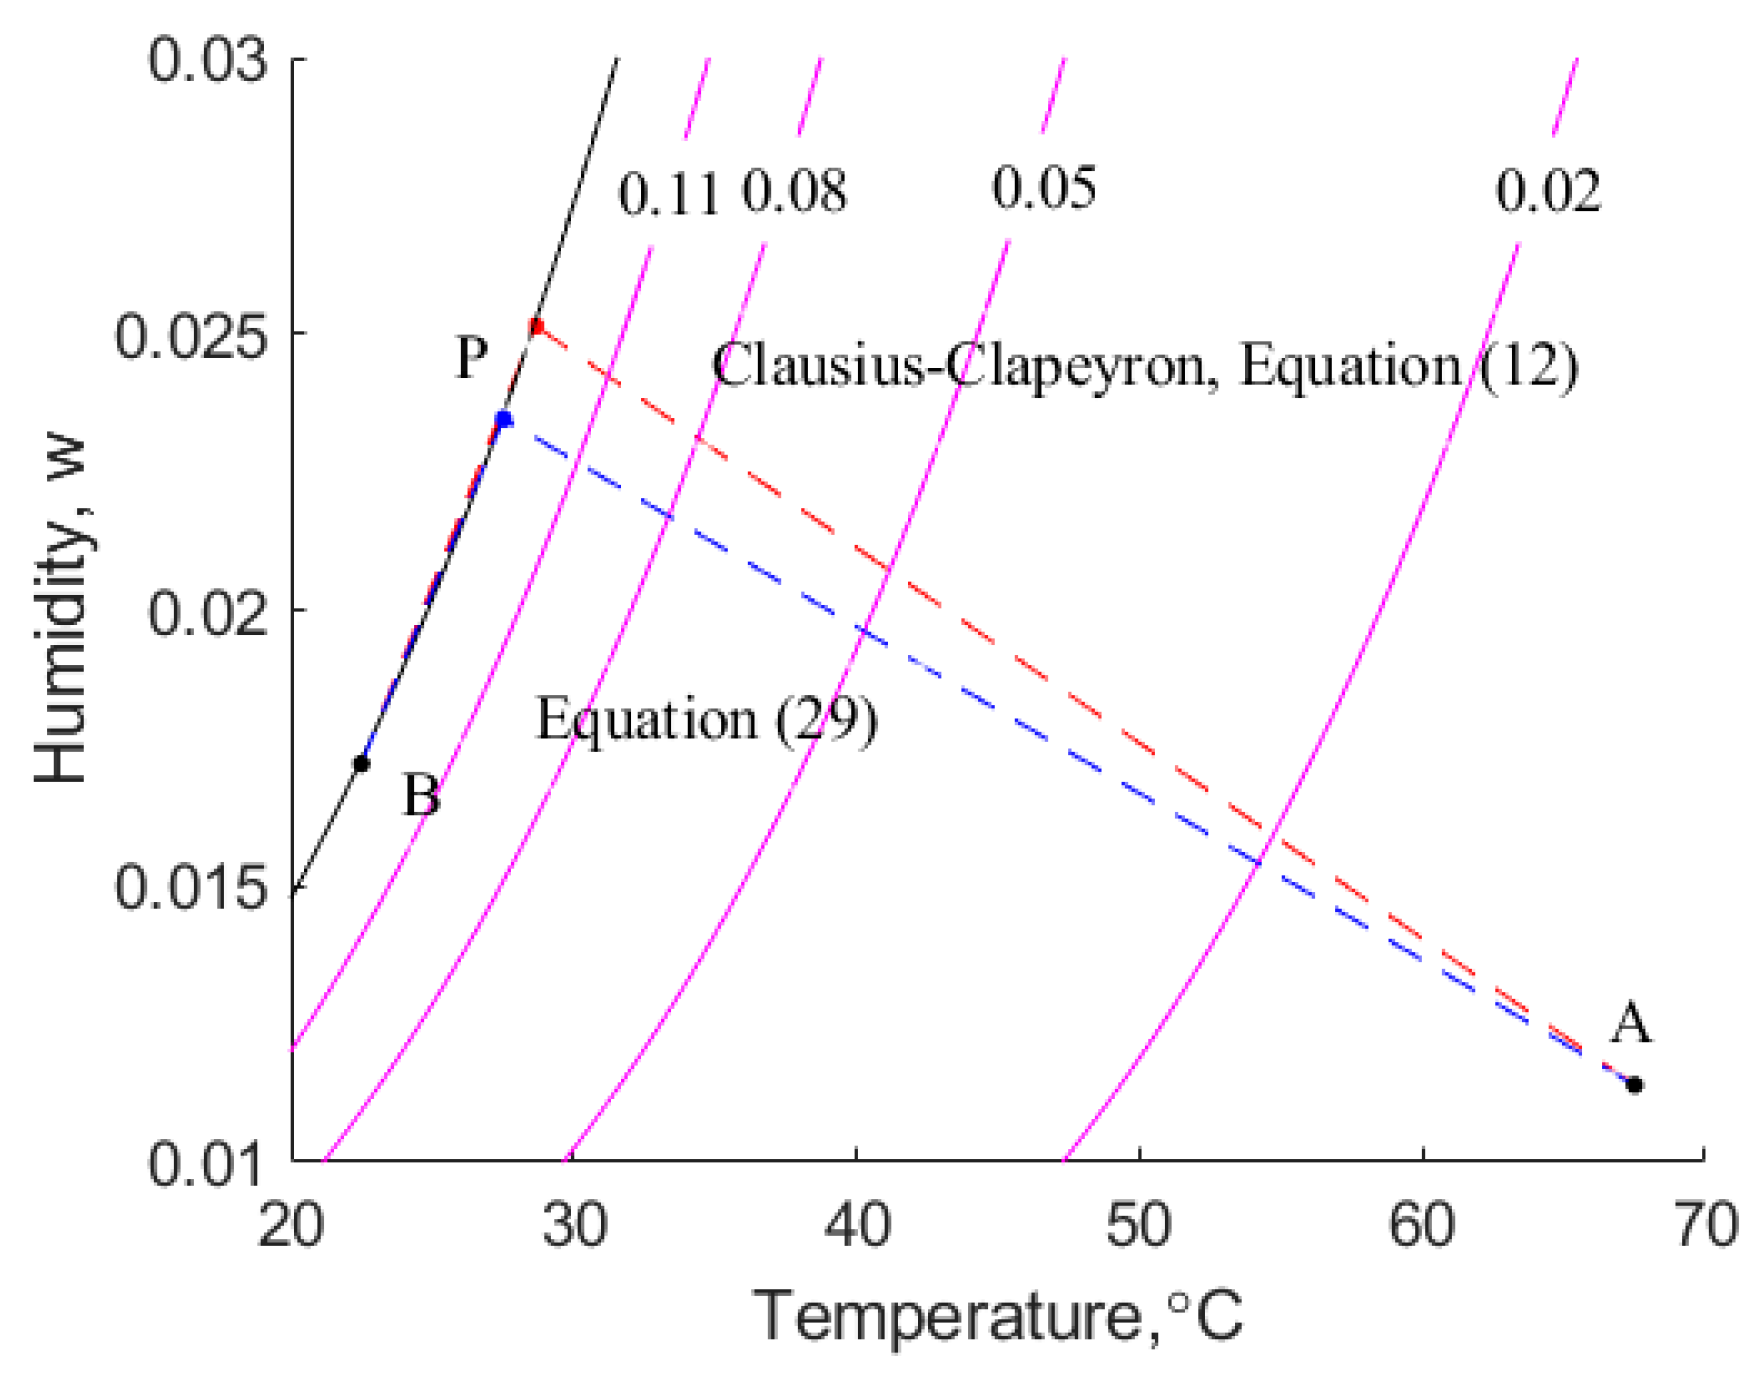
Beds of moist hygroscopic materials, such as canola, are dried by ventilating them with warm air that has a low relative humidity. Grains in proximity to the air inlet attain the temperature of the incoming air, referred to as state A shown in
Figure 1.
Grains distant from the entrance of the bed are at their initial temperature, state B. Two heat and mass transfer fronts propagate through the bed, namely a slow-moving drying front and a relatively rapidly moving heating front. The two fronts are separated by a plateau state, P. The moisture in the canola in state A is deemed to be in thermodynamic equilibrium with the moisture in the incoming air, whilst canola in state B retains its initial moisture content, as shown in
Figure 1. It is observed that the moisture content of the grain in the plateau state, P, is higher than its initial value, i.e., this region of grain has adsorbed moisture.
Figure 1 shows the values of the humidity of the interstitial air that correspond to the initial temperature and moisture content of the grain. The states of the air used in this example are depicted on the psychrometric chart shown in
Figure 2.
Figure 1 suggests that the heating and drying waves are sharp. In practice, dispersive effects such as the resistance to mass transfer between the solid phase and the surrounding intergranular air cause the formation of waves that have finite widths. The dispersive effects result in some of the moisture in the air not being adsorbed instantaneously; hence, the moisture content profiles of the grains and air become smeared along the drier. However, neglecting dispersive effects has a significant advantage, namely it permits a simple mathematical expression for the speed of the heating and drying fronts to be calculated. This provides a direct and powerful method of comparing the influence of the sorption isotherm on the degree and rate of cooling beds of hygroscopic porous media, such as food grains. In this work, we do not consider dispersive effects, although Ingram [
15] and Thorpe [
16] show that the analysis provides the correct average speed of the transfer waves. The analysis also provides the correct value of temperature and grain moisture content at the plateau state. Furthermore, dispersive effects may be accounted for by superimposing spreads of moisture, temperature, and humidity on the drying and temperature fronts.
Figure 1 shows the velocities of the drying and wetting waves traversing a bed of canola when the specific mass flow rate of the dry component of the moist air is 1 kg/s per square metre cross-section of the bed. This is an order of magnitude greater than air flow rates typical encountered in grain drying systems; hence, in practice, the velocity of a drying front, AP, is likely to be on the order of
m/s. This low speed occurs because the bulk density of canola is three orders of magnitude greater than that of the intergranular air, i.e., 1
. Furthermore, it is observed in
Figure 1 that the change in the moisture content of the solid is on the order of
and the change in humidity of the air is on the order of
. By considering mass transfer, we therefore anticipate that a large volume of air must flow to remove the moisture from the solids. This reasoning is confirmed in
Figure 1, which shows that the velocity of the drying front, AP, is indeed four orders of magnitude that of the specific mass flow rate of the air, as suggested by the foregoing discussion.
Heat and mass transfer phenomena that occur in beds of drying hygroscopic solids are intimately intertwined. The energy in the air stream at A must not only increase the sensible heat of the solids, but it must also supply energy to release and vaporise the adsorbed moisture. Given the high latent heat of vaporisation of water, combined with the heat of wetting of adsorbed moisture, a large volume of air must flow in order to dry a relatively small volume of grain. Hence, the velocity of the drying front is much lower than that of the intergranular air, which is perfectly consistent with the above discussion of moisture transfer. Heat and mass transfer in ventilated beds of canola are inextricably coupled.
It is observed that the moisture content of the solid phase is higher in the plateau state than in its initial state, B. This is because some of the moisture removed from the canola by the warm air entering the grain in state A condenses in state P, and it is adsorbed by the cooler grain.
The situation across the heating front, BP, is starkly different from that across the drying front, AP. The humidity and temperature of the air upstream of the heating front, state P, are higher than those downstream, where the grains are in their initial state, B. Hence, as the moving front, BP, penetrates the cool dry grain, the initial moisture content and temperature of the grain increases by 0.0047 and 8.8 °C, respectively. The increase in moisture liberates the heat of condensation of water and seemingly the heat of wetting. However, we shall observe that the heat of wetting may not be liberated. Notwithstanding, the condensation of water augments the rate at which sensible heat from the air in the plateau state is transferred to the bed in state B. The net result is that the heating wave has a higher velocity than it would have if the grain were not hygroscopic, i.e., if only sensible heat transfer occurs. In the particular case under consideration, the velocity of the heating wave is 0.00219 m/s, whereas if the only heat transfer was from the air to the solid and no condensation and wetting occurred, it would be only 0.00061 m/s.
3. Mathematical Analysis
The above description of the heat and mass transfer phenomena that occur in beds of drying grains is semi-qualitative. An explicit expression for the speed, , of the heat and mass transfer fronts through ventilated beds of hygroscopic media, such as food grains, can be obtained if we consider the solid phase and the intergranular air to be in thermodynamic equilibrium.
Previous analyses, such as that of Ingram [
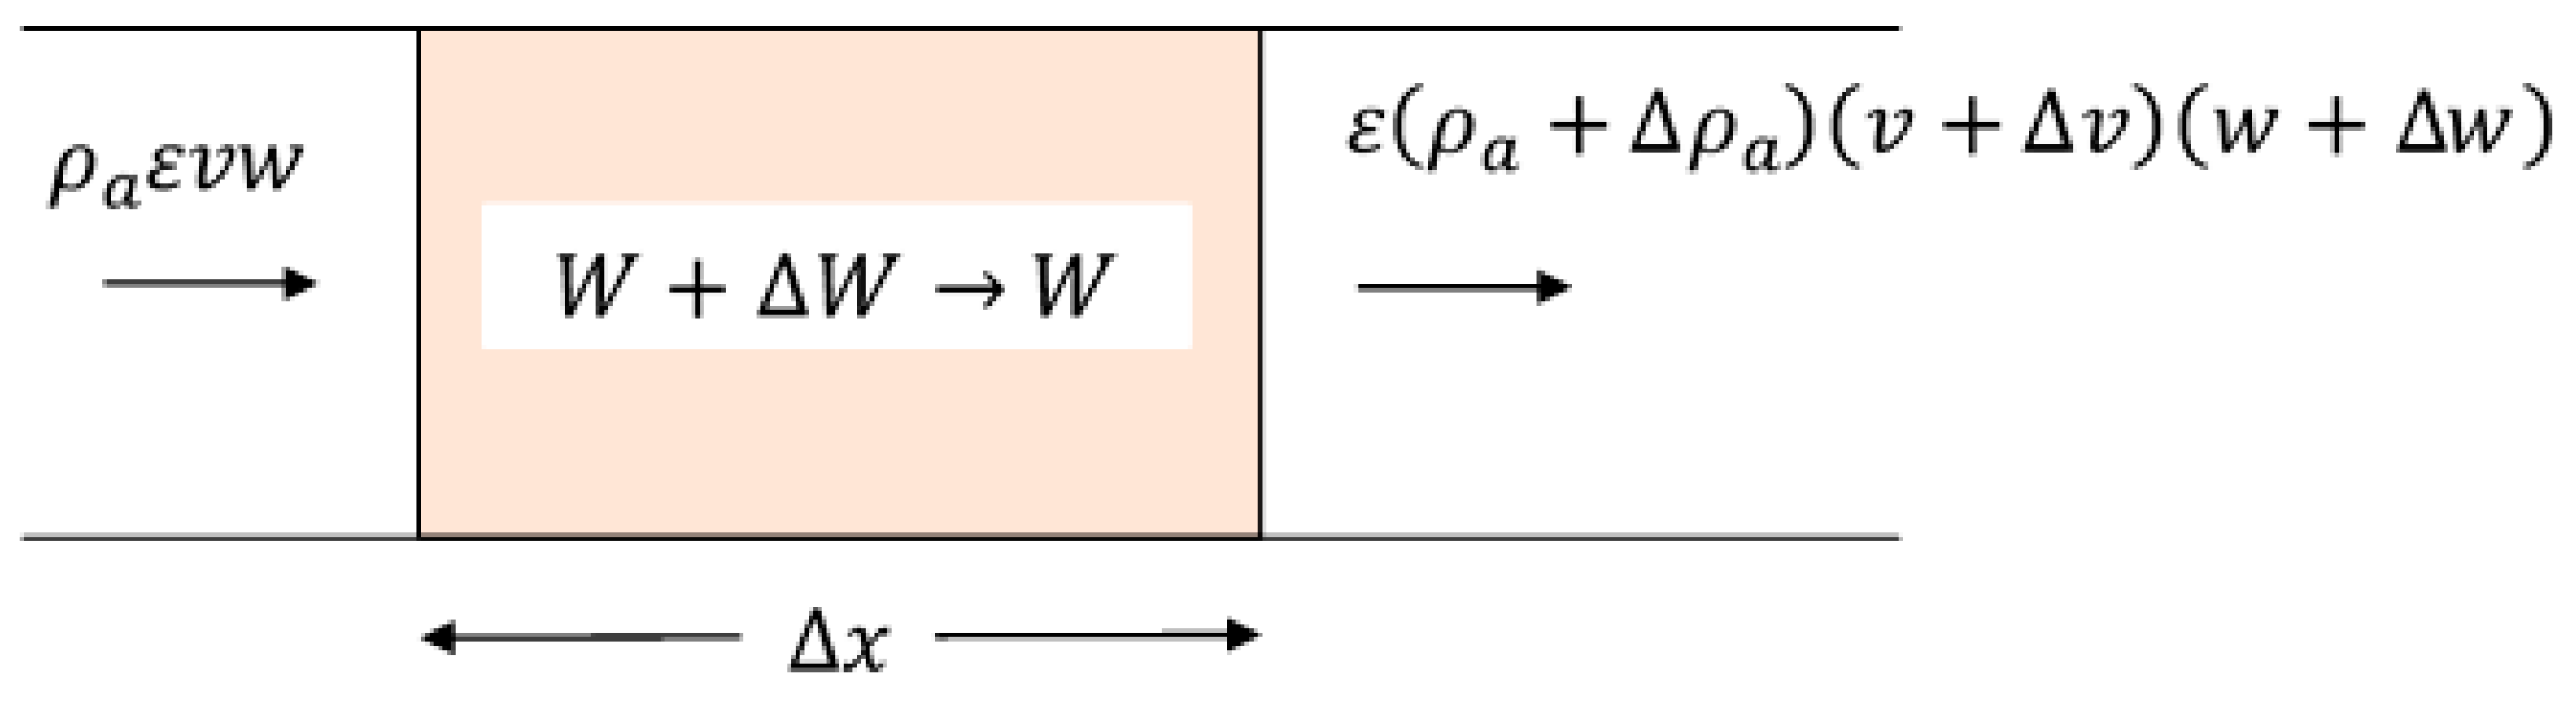
12], have assumed that the density and mean velocity of the intergranular air are constant throughout beds of drying grains. This is manifestly not the case because each region of a bed of ventilated material has a different temperature, hence the density of the intergranular air varies in time and space. Therefore, we consider a small region of the bed that has a length
and in which the intergranular air initially has a density, humidity, and velocity of
,
, and
, respectively, as indicated in
Figure 3. The initial moisture content of the grain is
. After a time,
, air is displaced so that its properties within the element become
and
, and the interstitial velocity of the air is
. The grain assumes a moisture content,
, which is in thermodynamic equilibrium with the air entering the element.
The conservation of mass applied to dry air (in which moisture is conveyed) demands that
in which
is the mass flow rate of the component of dry air per unit cross-sectional area of the bed. A mass balance on the moisture in the element is expressed as
Amount of moisture in the
air that enters the element | = | Amount of moisture in the
air that leaves the element | + | Amount of moisture in the
element that accumulates in
the air and solid |
Algebraically, this is expressed as
Since the change in moisture that accumulates in the air and solid in the element of length
occurs in a time
, the velocity,
, with which a drying or heating front traverses the element is
which when used in Equation (3) results in
is the velocity of the transfer front based on a mass balance of moisture across the element portrayed in
Figure 3. If we had performed an enthalpy balance on the element instead of a moisture balance and designated the change in the enthalpy of the solids and air as
and
, respectively, we would obtain the same velocity,
.
noting that
.
The enthalpy,
, of moist air is expressed as
in which
is an arbitrary reference temperature, taken to be 0 °C in this work.
and
are the specific heats of dry air and liquid water, respectively, and
is the heat of vaporisation of water at a temperature
. The enthalpy,
, of the solid phase is given by
where
is the specific heat of the dry solid and
is the integral heat of wetting defined by
in which
is the isothermal differential heat of wetting, which is the energy released when weak bonds form between the substrate of the solid and water molecules.
is the heat released when a quantity of moisture,
, is physically adsorbed, and it is conventionally a negative quantity. Hence, as a greater quantity of moisture is adsorbed,
decreases. The isothermal differential heat of sorption,
, is the energy required to remove moisture from the solid, and it can be expressed as
where
is the latent heat of vaporisation of water.
is the energy required to both vaporise water and break the loose bonds between the water and the solid phase. It is convenient to express
as
This form enables
; hence,
can be determined from the Clausius–Clapeyron equation applied to stored grains by Thorpe [
10,
11]:
in which
is the saturation pressure of water at a temperature
and
is the relative humidity of the intergranular air.
is obtained directly from the sorption isotherm equation, and it is crucial to this study.
It is convenient to express the integral heat of wetting,
, as
where
and
.
4. Speeds of Temperature and Drying Fronts
The velocities of the drying and temperature fronts are given by solving Equations (5) and (6) across each of the heat and mass transfer fronts that propagate through the bed. We generally know the initial thermodynamic state of the bed, state B. It is defined by the moisture content, , and temperature, , of the grain that is to be dried; hence, the humidity, , of the interstitial air can be determined from a sorption isotherm. Similarly, state A of the air entering the bed is defined by its temperature and humidity of the air entering the grain. The equilibrium moisture content, , of the grain initially in the bed is given by a suitable isotherm.
Making use of Equations (6) and (7), we define a function as follows:
where the subscripts
and
correspond to those defined in Equations (5) and (6), and
and
rrepresent the drying and heating fronts, respectively. Recall that
and
. The Nelder–Mead simplex method [
17] is used to search for values of
and
that render
. However, searching for the unknown values in the plateau state is very sensitive to the initial values of
and
. This difficulty is overcome by observing that the order of magnitude of the terms in the denominator of Equation (5) are
and
As a result, we can write
Similar reasoning yields
which suggests we can write
where the subscripts refer to the difference between the plateau state P and inlet state A where the canola is in equilibrium with the air that enters the bed. The thermodynamic state,
in the plateau state is unknown. Hence, we cross-multiply Equation (20) and define the function
as
in which
and
We define a similar function
that involves the differences between the enthalpies and moisture contents at the plateau state and the initial conditions, and we write
Each of the two terms on the right-hand side of Equation (26) must be zero; hence, a search procedure is used to determine the values of
and
that satisfy this condition. These readily determined values are used as the initial values when determining
, which provides marginally more refined values of
and
that account for the fact that the density of air varies with the temperature difference either side of the temperature and moisture fronts. Values of
and
at which
are again found by the Nelder–Mead simplex method [
17] for minimising non-linear functions, which is implemented as a MATLAB
® Version R2020b function.
5. Sorption Isotherms
We have noted that a plethora of equations has been proposed to describe the sorption properties of canola. The predicted performance of driers is likely to depend on the accuracy with which the sorption equations describe the properties at the initial and final conditions, i.e., at high and low moisture contents. Hence, the extremities of moisture content are a focus of our studies, as well as predictions of the differential and integral heats of wetting which directly influence the rate of drying. The isotherms considered are described below.
5.1. Modified Henderson
The relative humidity,
, of air in thermodynamic equilibrium with canola that has a temperature,
, and moisture content,
, is given by
or equivalently
The constants given by Sokhansanj et al. [
18] are
,
, and
, whilst those presented by Gazor [
8] are
,
, and
.
In their study of canola drying, Cenkowski et al. [
14] made use of the following empirical expression for
:
where
4.7,
−44.2 when
, and
0.5 and
−14.5 when
. Hence, by making use of Equations (11) and (29), the following is obtained:
and when
,
Making use of the Clausius–Clapeyron equation, we obtain
which when inserted into Equation (12) gives an expression for
, i.e.,
Hence,
The integrand in Equation (34) appears not to have a closed form solution; hence, it is integrated numerically using the trapezoidal rule.
5.2. Modified Chung–Pfost
The modified Chung–Pfost isotherm provides the following relationship between the relative humidity, the moisture content of grains, and temperature:
or
in which the constants presented by Gazor [
8] are
,
, and
.
Making use of Equations (12) and (36), the modified Chung–Pfost isotherm provides the following expression for
:
which provides
5.3. Modified Halsey
The modified Halsey isotherm is formulated as
or
in which Gazor [
8] determined the constants as
,
, and
.
Now
and
which provides
Note that the exponent of
, namely
, demonstrates that
is indeterminate when
5.4. Modified Oswin
or
for which Gazor [
8] gives
,
, and
.
By making use of Equations (12)–(14) and (50), the integral heat of wetting,
, is given by
The integral in Equation (51) is evaluated numerically, and the definition of
given by Equation (44) ensures that the integrand remains finite as
5.5. Hunter
Hunter [
19] presents the following expression for the relative humidity,
, of air with grain that has a moisture content,
:
in which
is an empirical constant and
is the saturation vapour pressure at the temperature,
, of interest.
is an empirical function of the moisture content,
, of the grains, given by
Hunter [
19] provides the following equation for
:
The mean values of the moisture contents of canola at the relative humidities,
, measured by Gazor [
8] were calculated. This enables the unknown parameters
,
,
,
,
, and
to be estimated by minimising the sum of the errors between the measured values of the relative humidities and those given by Equation (52). Algebraically, when the relative humidity,
, and temperature,
, are known, then the unknown parameters are found by minimising
, which is given by
The following values of the parameters that satisfy Equations (53) and (55) are found to be , , , , and . In Equation (52), .
as a function of the moisture content,
, is given by Equation (53), and to simplify the algebra, the function is replaced by the following polynomial equations:
and
where
and
are empirical constants.
Using Equation (56) in Equations (13) and (14) yields
and Equations (13), (14), (56) and (57) give
Values of the coefficients
and
are given in
Table 1.
Hunter’s [
19] isotherm faithfully fits sorption data that are experimentally determined. However, like Close and Banks [
12], Hunter [
13] observed that anomalies arise when calculating the speeds of transfer waves through beds of aerated wheat.
In this work, the saturation vapour pressure of water,
, as a function of temperature is given by the expression presented by Huang [
20], namely
where the enhancement factor,
, assumes the value 1.005 at atmospheric pressure.
6. Anomalies
6.1. EMC as a Function of Temperature and Humidity
A key feature of sorption isotherms is that they encapsulate the relationship between the equilibrium moisture content of hygroscopic solids and the temperature and humidity of their surrounding atmosphere. In this work, it is found that in the range of relative humidity,
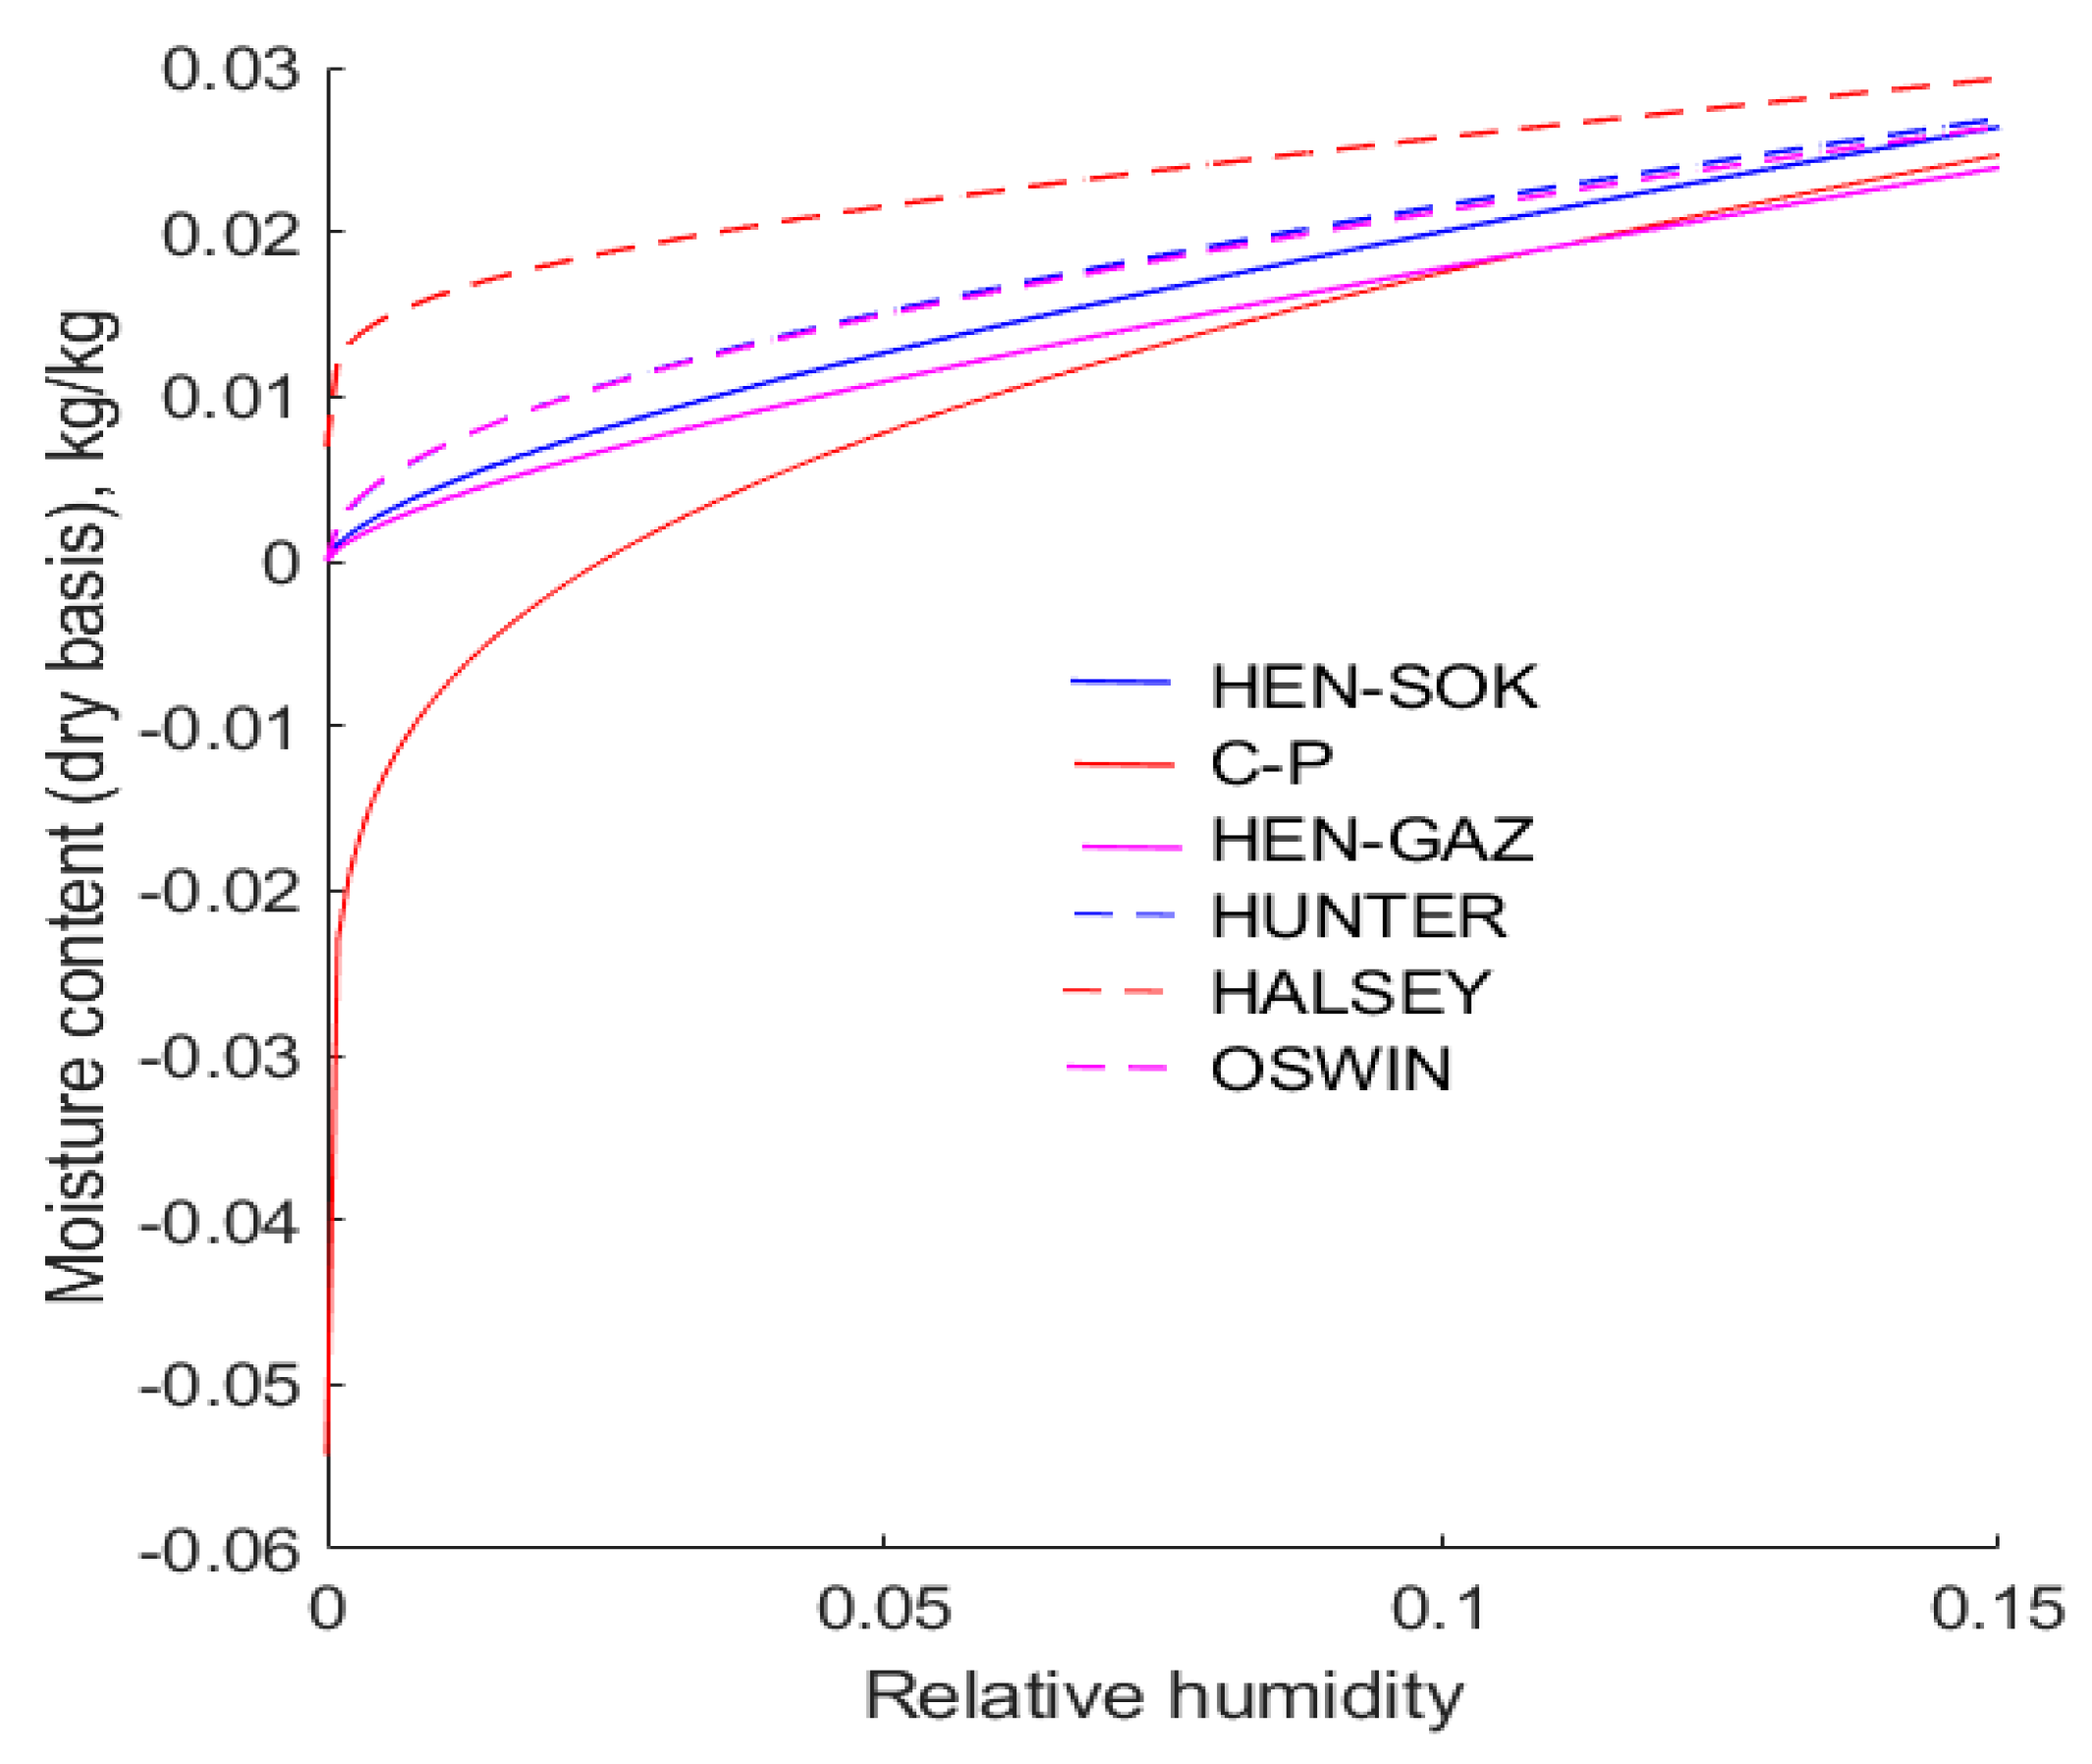
, all of the isotherms are defined above yield moisture contents of canola within 0.01 of each other. However, there are considerable differences between the predicted moisture contents at low and high extremes of relative humidity.
Figure 4 shows the behaviour of the six isotherms in the range
at 30 °C. It can be seen that there are discrepancies between all of the isotherms, and this inevitably leads to erroneous predictions of the moisture contents of canola that is being dried. Significantly, it is observed that the ubiquitous modified Chung–Pfost isotherm yields negative values of moisture content when the relative humidity is less than about 0.025. This is a physical impossibility, but it is inherent in the form of the Chung–Pfost isotherm. It is found that the modified Halsey isotherm predicts that the moisture content of canola exceeds 0.01 when the relative humidity of the air exceeds 8 × 10
−5. However, in the extreme, as the relative humidity approaches zero, the Halsey equation predicts that the moisture content approaches zero. Compared with other isotherms considered in this work, this result is distinctly anomalous.
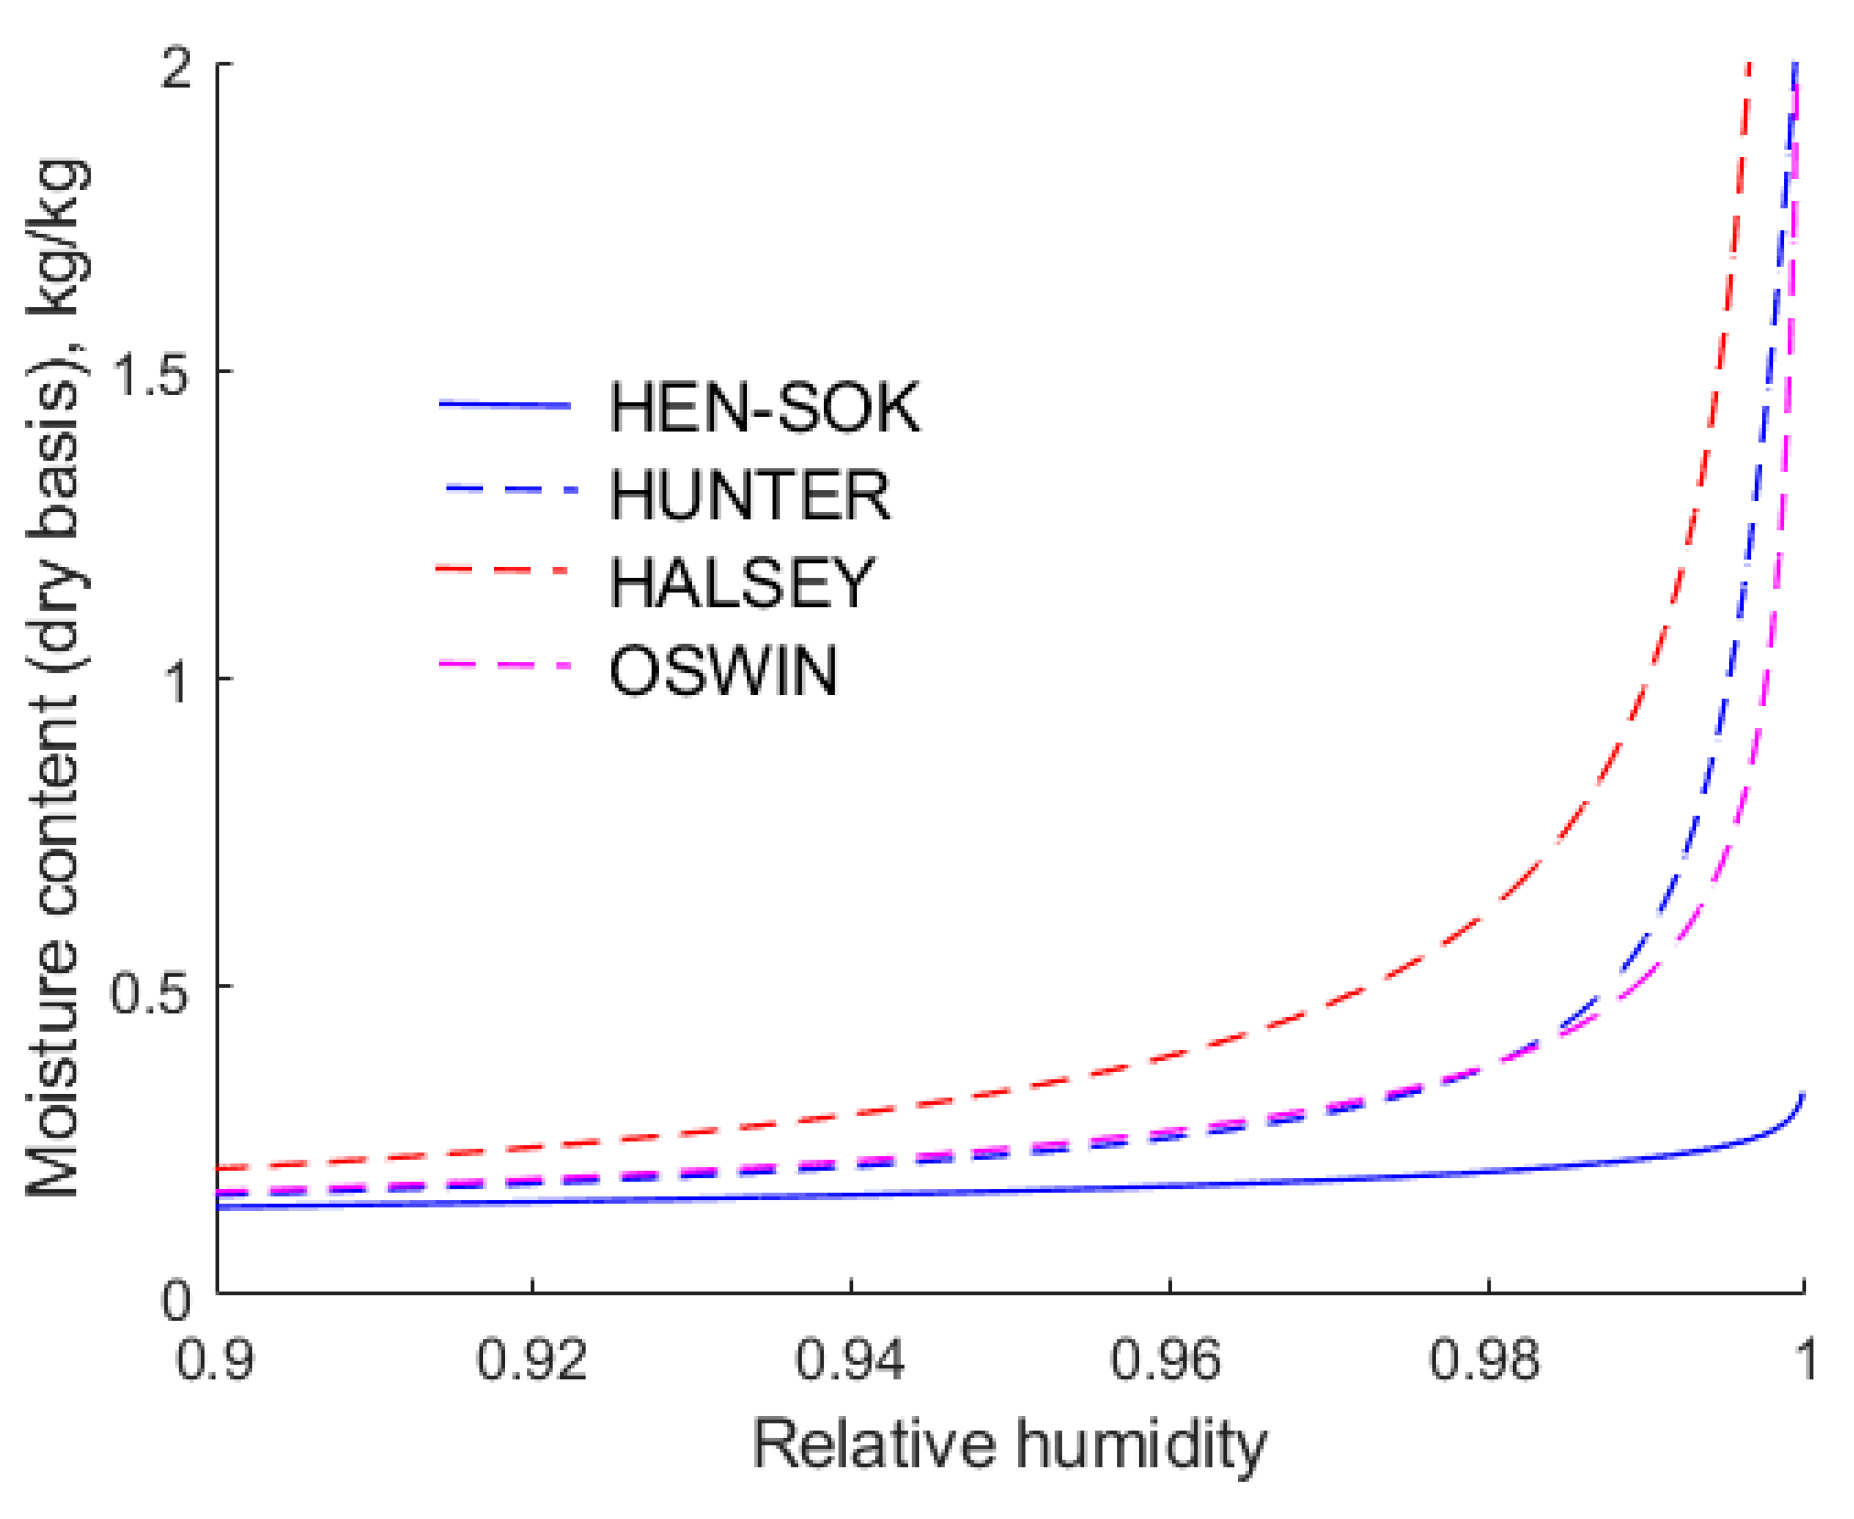
As the relative humidity approaches unity, the moisture contents predicted by the modified Chung–Pfost and Henderson isotherms are similar. Hence, for the sake of clarity,
Figure 5 shows only the Henderson isotherm fitted to Sokhansanj et al.’s [
18] data However, as the relative humidity of air approaches unity, the moisture contents predicted by the modified Halsey, Oswin, and Hunter isotherms are markedly higher and different from each other. This is important from a practical point of view, because if an isotherm predicts that the relative humidity of air is too high, it follows that water vapour will be expelled from the drier at a higher rate. This may result in a drier being under-sized.
The rapid increase in the moisture content with increasing humidity is consistent with the Brunauer, Emmet, and Teller [
21] isotherm, which assumes that the water molecules form multilayers. However, it should be noted that Hunter’s [
19] isotherm is purely empirical, although it apparently captures a multi-layering effect. Recall that the isotherms were fitted to the same experimental data, hence the forms of the isotherms play a key role in their accuracy. However, it is important to note that the isotherms are extrapolated beyond the data on which they are based, and this may contribute to the divergence in results. The differences in the equilibrium moisture contests evident in
Figure 4 and
Figure 5 highlight the need to obtain reliable sorption data over a wide range of relative humidities.
6.2. Dependence of on Moisture Content
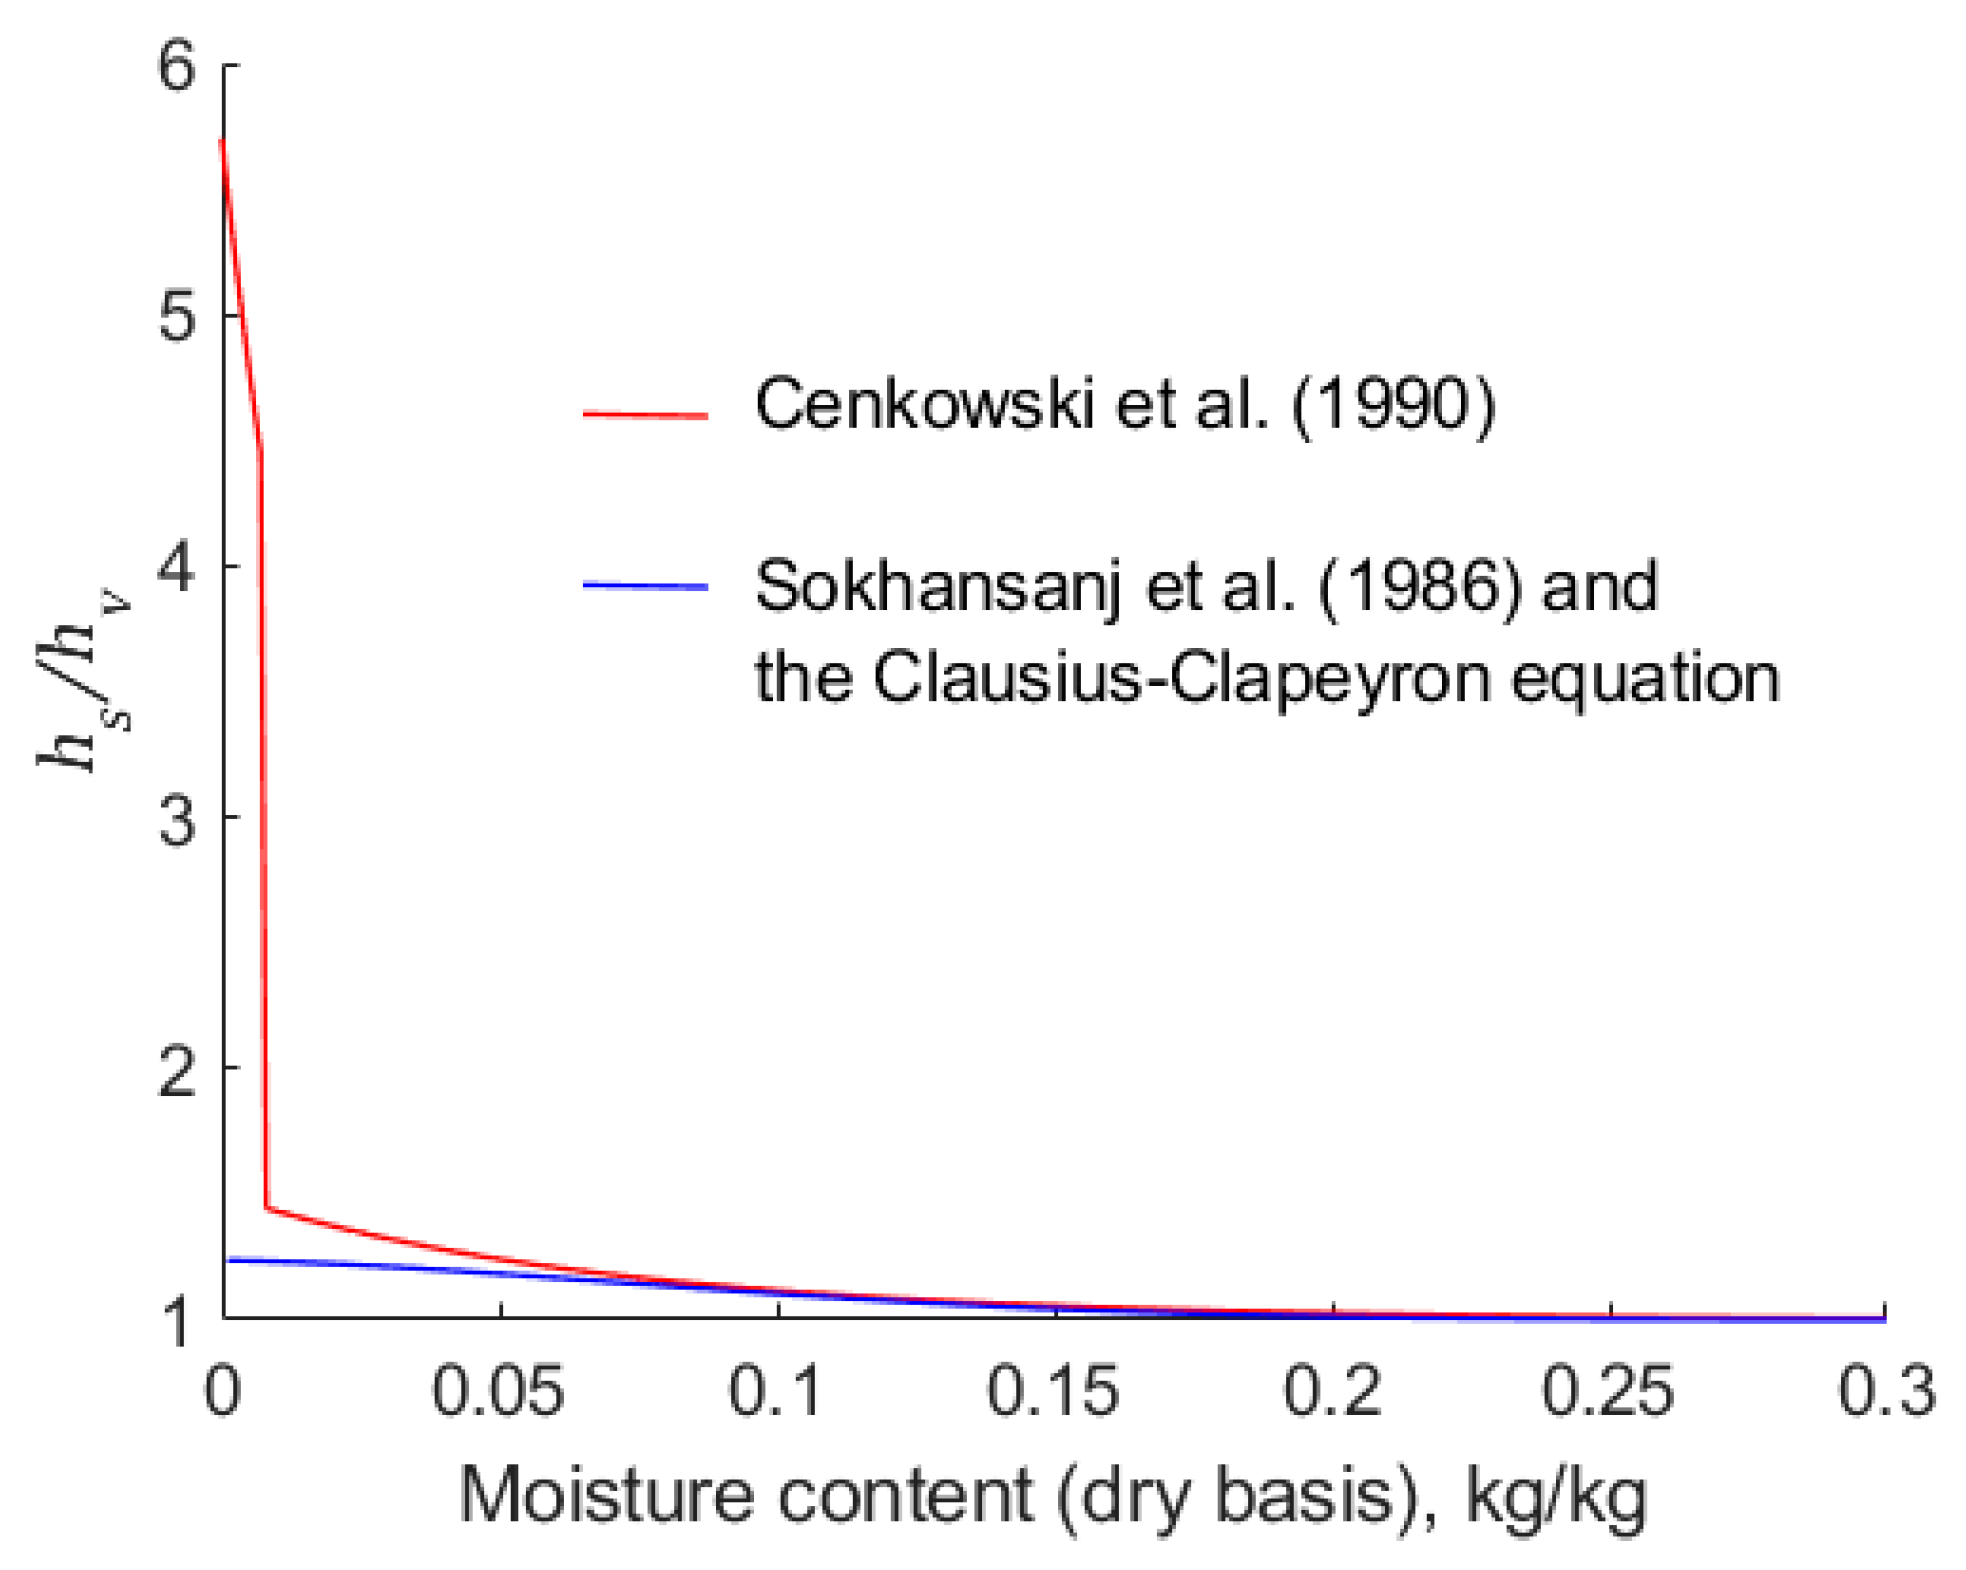
Cenkowski et al. [
14] make use of Equation (29) to estimate values of
. This equation is a function of moisture content only. In this work, we have used the same Henderson isotherm with Sokhansanj et al.’s parameters, but we have calculated
using the Clausius–Clapeyron equation.
Figure 6 indicates that there is a significant difference between the two estimates of
, particularly in the region of low moisture content,
. For example, when
, the empirical equation, Equation (29), results in the value of
being 5.5, whereas the combination of the modified Henderson equation and the Clausius–Clapeyron equation yields a value of 1.25. Prima facie, it is expected that higher values of
predicted using Equation (29) are likely to result in a lower rate of drying because more energy is required to break the weak bonds between the canola and the adsorbed water.
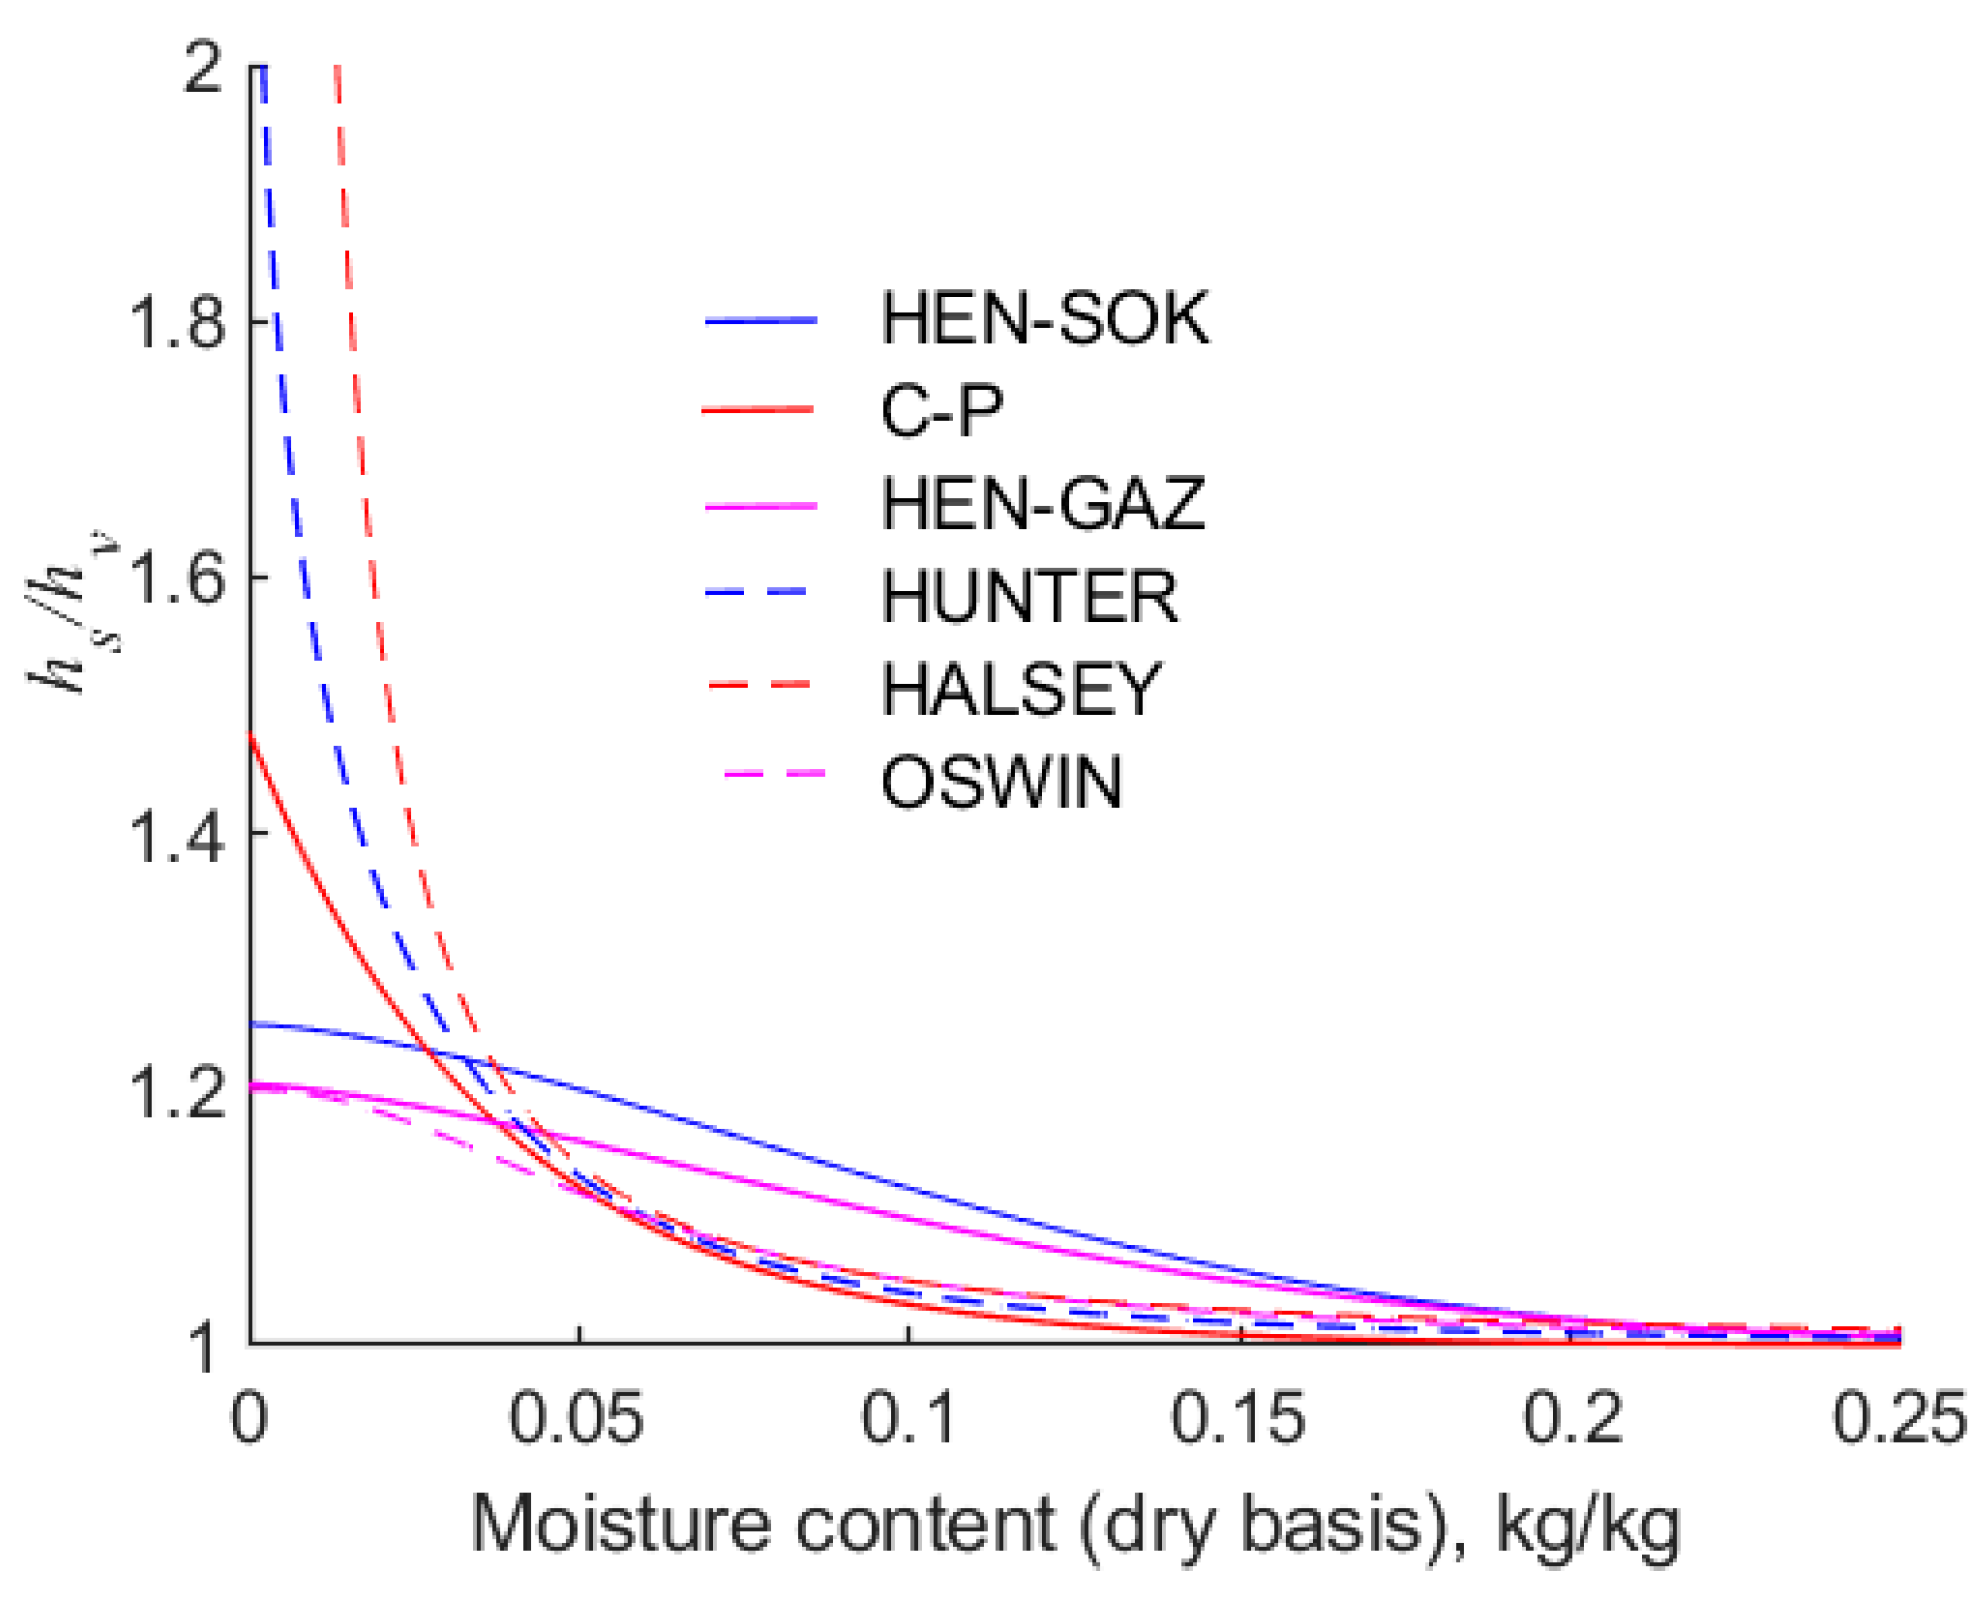
Figure 7 shows the values of
for the isotherms calculated when the Clausius–Clapeyron equation is invoked. It is observed that the modified Halsey and Hunter isotherms result in
as
. The remaining isotherms yield a variety of relationships between
and the moisture content, but they tend to unify as
increases.
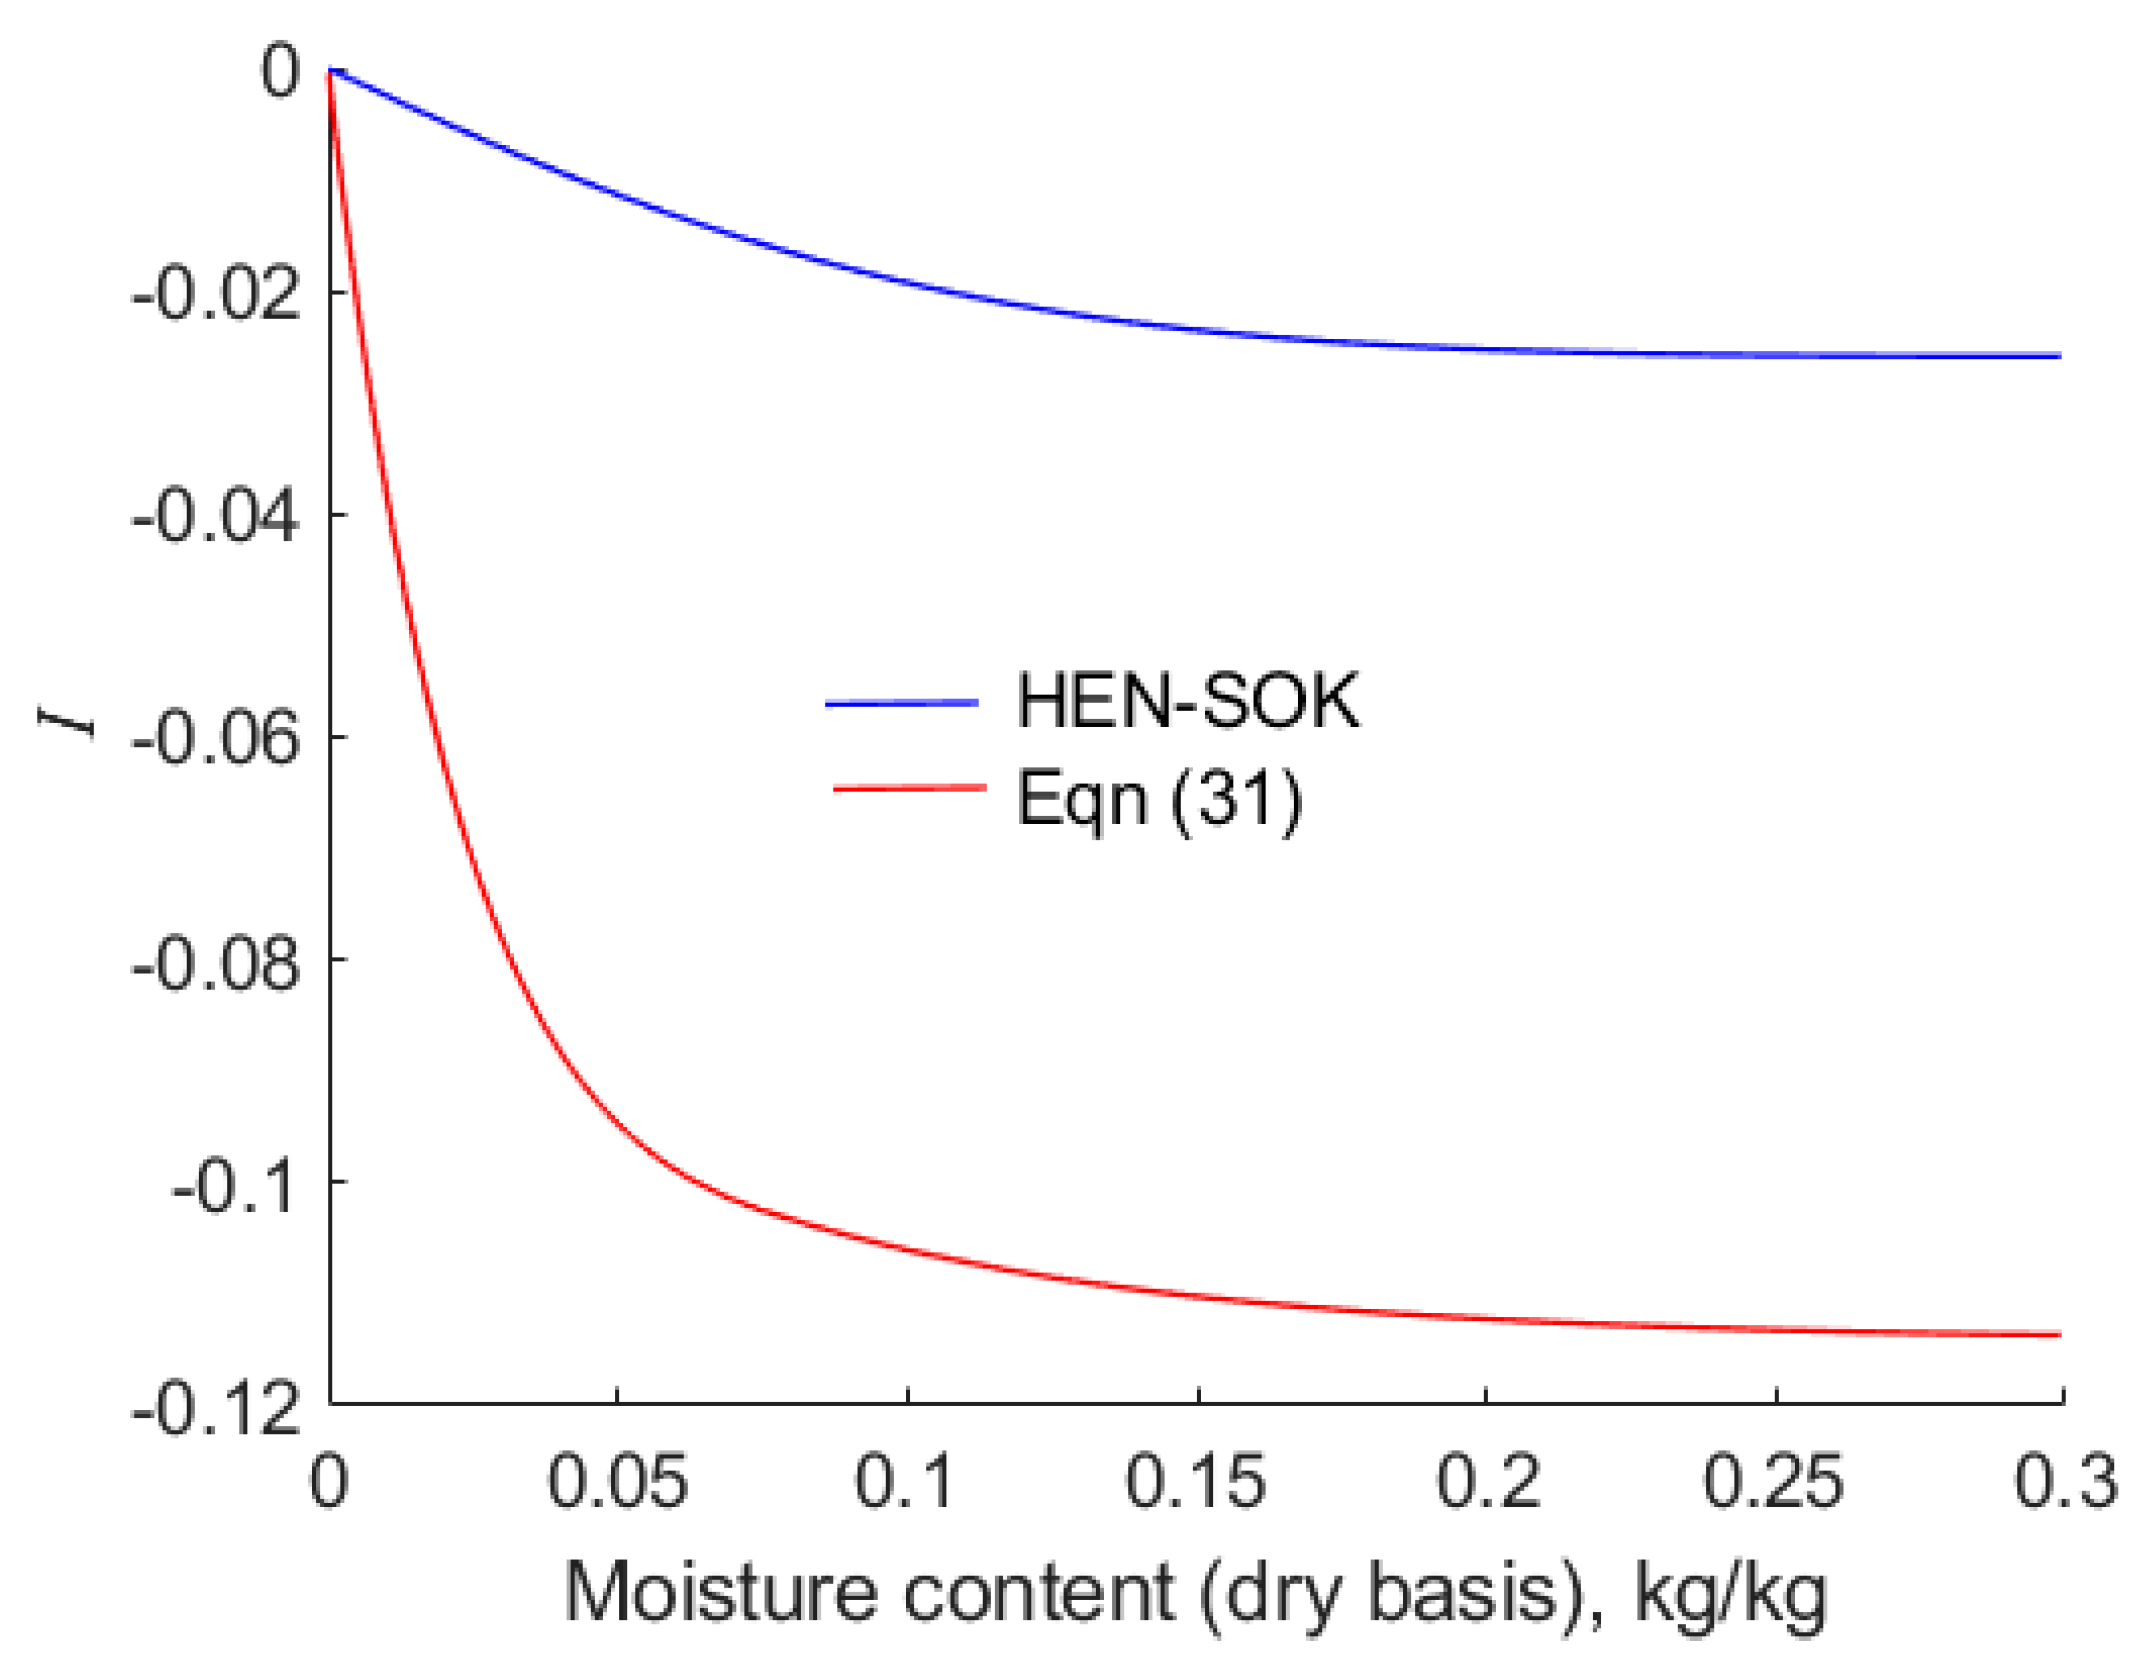
6.3. Dependence of the Heat of Wetting, , on the Forms of Isotherms
The energy that must be expended to break the bonds between water molecules and the solid substrate of the grains is related to the difference in the integral heats of wetting of canola at the initiation and completion of a drying operation. In addition, energy must be expended to vaporise the liberated water and supply sensible heat to the grains. Hence, accurate values of the integral heat of wetting must be known.
The results presented here are for the values
defined by Equation (14). Recall that
.
Figure 8 highlights the contrast between values of
calculated by means of Equations (30) and (31) and the Clausius–Clapeyron method applied to the modified Henderson equation when the empirical constants are as presented by Sokhansanj et al. [
18]. As anticipated from the values of
portrayed in
Figure 7, values of
are considerably lower (more negative) when calculated by the empirical rather than the Clausius–Clapeyron approach. When Halsey’s isotherm is used to calculate the integral heat of wetting, it is found that
as
; hence, in this case, values of
are omitted from
Figure 9. However, Hunter’s [
19] isotherm also predicts that
as
, but in this case, Thorpe et al. [
22] have shown that the integral
remains finite. The values of
map neatly onto the values of
shown in
Figure 7 and
Figure 8.
7. Effect of the Isotherm and the Predicted Performance of Driers
We have established that a variety of sorption isotherms and expressions for the isothermal and integral heats of wetting yield a range of conflicting results. However, a question remains, namely how do these contradictory results affect the degree and rate of the drying of beds of canola? In order to answer this question, a drier operating under the conditions studied by Cenkowski et al. [
14] and the effects of the sorption properties on its performance are established.
7.1. System Considered
The operating conditions and system properties investigated are given in
Table 2.
7.2. Outcomes
The initial temperature
of the canola is 22.5 °C and its moisture content
is 0.251 dry basis. We designate this as state B. It is ventilated with air that has a temperature of 67.5 °C and a specific humidity
of 0.0114 kg water/kg dry air, state A. This is illustrated in
Figure 10.
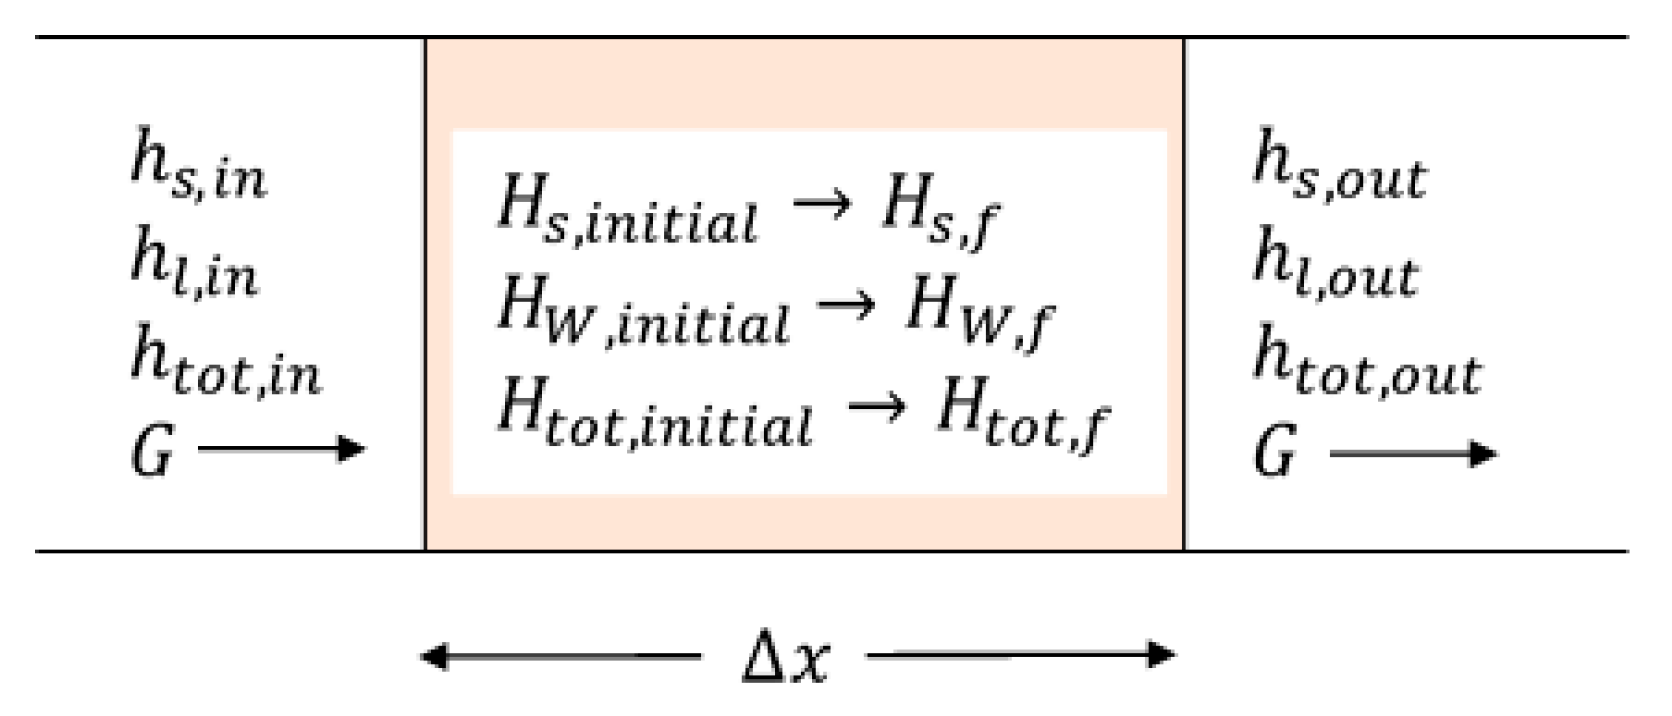
We can gain some insights into drivers of the speed of drying by considering, in a simplified but accurate manner, the enthalpy exchanges that occur in a bed of ventilated canola.
Figure 11 shows an element containing canola that has a length
. The sensible heat component of the enthalpy,
, is associated with moist air flows into the element with a specific mass flow rate,
. The latent component of the enthalpy of the air entering the element is designated
, and the total enthalpy of the air is
. The corresponding enthalpies of the air leaving the element are
,
, and
. The air leaving the element is in equilibrium with canola contained within the element, which has sensible and adsorptive enthalpy components of
and
, respectively. These comprise the total enthalpy of the solid
. After a time
, an exchange front transits the element after which the enthalpies of the solid are finally
and
, and its total enthalpy is
. The figure below demonstrates the enthalpy changes that occur.
Within the element, it is convenient to neglect the change in the enthalpy of the air contained within the element. This is of very little consequence because the density of air is low compared with the bulk density,
, of the solid. Recalling that the velocity,
, of an exchange front is expressed by Equation (19), we obtain
7.3. Drying Front Using Empirical Expression for
Firstly, we will consider the velocity,
, of the drying front between the air inlet state A and the plateau state P. Then, we consider the rate of drying when the empirical equation, Equation (29), is used to calculate the differential, hence integral, heats of wetting. We insert the modelled values of the enthalpies of the air and canola into Equation (61), where the subscripts
in and
f refer to conditions at the inlet to the bed of grain and the plateau state, respectively, rounding the data to 0.1 kJ/kg.
Given that the bulk density of the solid phase is 679.8 kg/m
3 and
, the velocity of the drying front is
It is seen that the sensible heat of the air decreases by 40.6 kJ/kg. This energy is used for two purposes as follows: 30.4 kJ/kg is used to vaporise free water from the grains, and the remainder, 10.2 kJ/kg is available to increase the sensible heat of the grains by 29.6 kJ/kg and provide 177 kJ/kg to break the bonds between adsorbed moisture and the solid. As anticipated, the empirical expression for requires a large amount of energy to desorb moisture that is bound to the solid substrate of canola.
7.4. Drying Front Using Sokhansanj/Henderson and Clausius–Clapeyron Equations
When the Clausius–Clapeyron equation is used to estimate
using the modified Henderson equation with the empirical parameters given by Sokhansanj et al. [
18], the exchanges of enthalpy are given by
This result is strikingly different from that predicted by the empirical equation, Equation (29). For example, a higher proportion of the sensible heat lost by the air stream (39.2 kJ/kg) is used to vaporise free water, 34.5 kJ/kg. Importantly, the Clausius–Clapeyron equation predicts that considerably less energy is required to remove bound water, namely 59.0 kJ/kg, as opposed to the 177.1 predicted by the empirical expression for
. This latter result is to be expected given that Equation (29) predicts high values of
. The overall result is that the velocity of the drying front predicted by the Clausius–Clapeyron approach is greater than that predicted by Equation (29). When the Clausius–Clapeyron equation is implemented, the speed of the drying front is estimated to be
When the empirical equation, Equation (29), is used, the temperature of the plateau state is found to be lower than when the Clausius–Clapeyron equation is used.
7.5. Speed of the Heating Front Using Empirical Expression for
A feature of the heating front is that the moisture content of the grain is higher in the plateau state, P, than in its initial state, B. Prima facie, one might expect that the grains at the initial moisture content would liberate heat when they adsorb moisture from the relatively moist air in the plateau state. This does not happen because the moisture content of the grain at the plateau state, P, is only 0.0041 greater than that the initial state, B. As a result, the difference between the integral defined by Equation (14) at the two moisture contents is negligible. However, the latent heat of the vaporisation of water is greater in the initial state, B, than in the plateau state, P. Hence, recalling that , the integral heat of wetting, , is lower in the initial state than in the plateau state. As the heating wave traverses the grain, energy must be extracted from the air in the plateau state to increase the integral heat of wetting of the grain in the initial state. As a result, the speed of the heating front is not augmented by the heat of wetting, as might be anticipated.
We shall now quantify the predicted changes in enthalpy when the empirical expression, Equation (29), is employed. Under these conditions, the sensible heat contents of the air in the plateau state, P, and initial state, B, are 30.4 kJ/kg and 24.2 kJ/kg, respectively. Hence,
and
Warm air in the plateau state, P, transfers energy to the grain in its initial, cool state, B. We see that 6.2 kJ/kg sensible heat and 15.1 kJ/kg latent heat is transferred from the air. The sensible heat of the canola increases by 12.8 kJ/kg and the integral heat of wetting increases by 1.2 kJ/kg as the heating front propagates through the grain. It is this latter increase in the heat of wetting that is perhaps unexpected. When only the exchange of sensible heat occurs, the velocity,
, of the transfer wave is
This is considerably lower than the m/s calculated when mass transfer between the air and the grains occurs. The increase in the speed of the heating wave when the solid phase, canola, is hygroscopic occurs because the latent heat of condensation of water on the grains augments the transfer of sensible heat from the air. As a result, the speed of the heating front increases when the solid phase is hygroscopic.
7.6. Speed of the Heating Front Using the Clausius–Clapeyron Approach
When the Clausius–Clapeyron equation is used, the following enthalpy balance ensues:
and
As with the empirical equation, the Clausius–Clapeyron equation also predicts that the integral heat of wetting of the grain in the plateau state (−64.6 kJ/kg) is higher than that of the grain in its initial state, namely −71.9 kJ/kg. This is an inherent characteristic of the formulation of the Clausius–Clapeyron equation under these conditions when the Henderson sorption isotherm using Sokhansanj et al.’s [
18] parameters is implemented. Again, the speed of the temperature wave is augmented because some 19.2 kJ/kg of energy is liberated when moisture condenses on the grains.
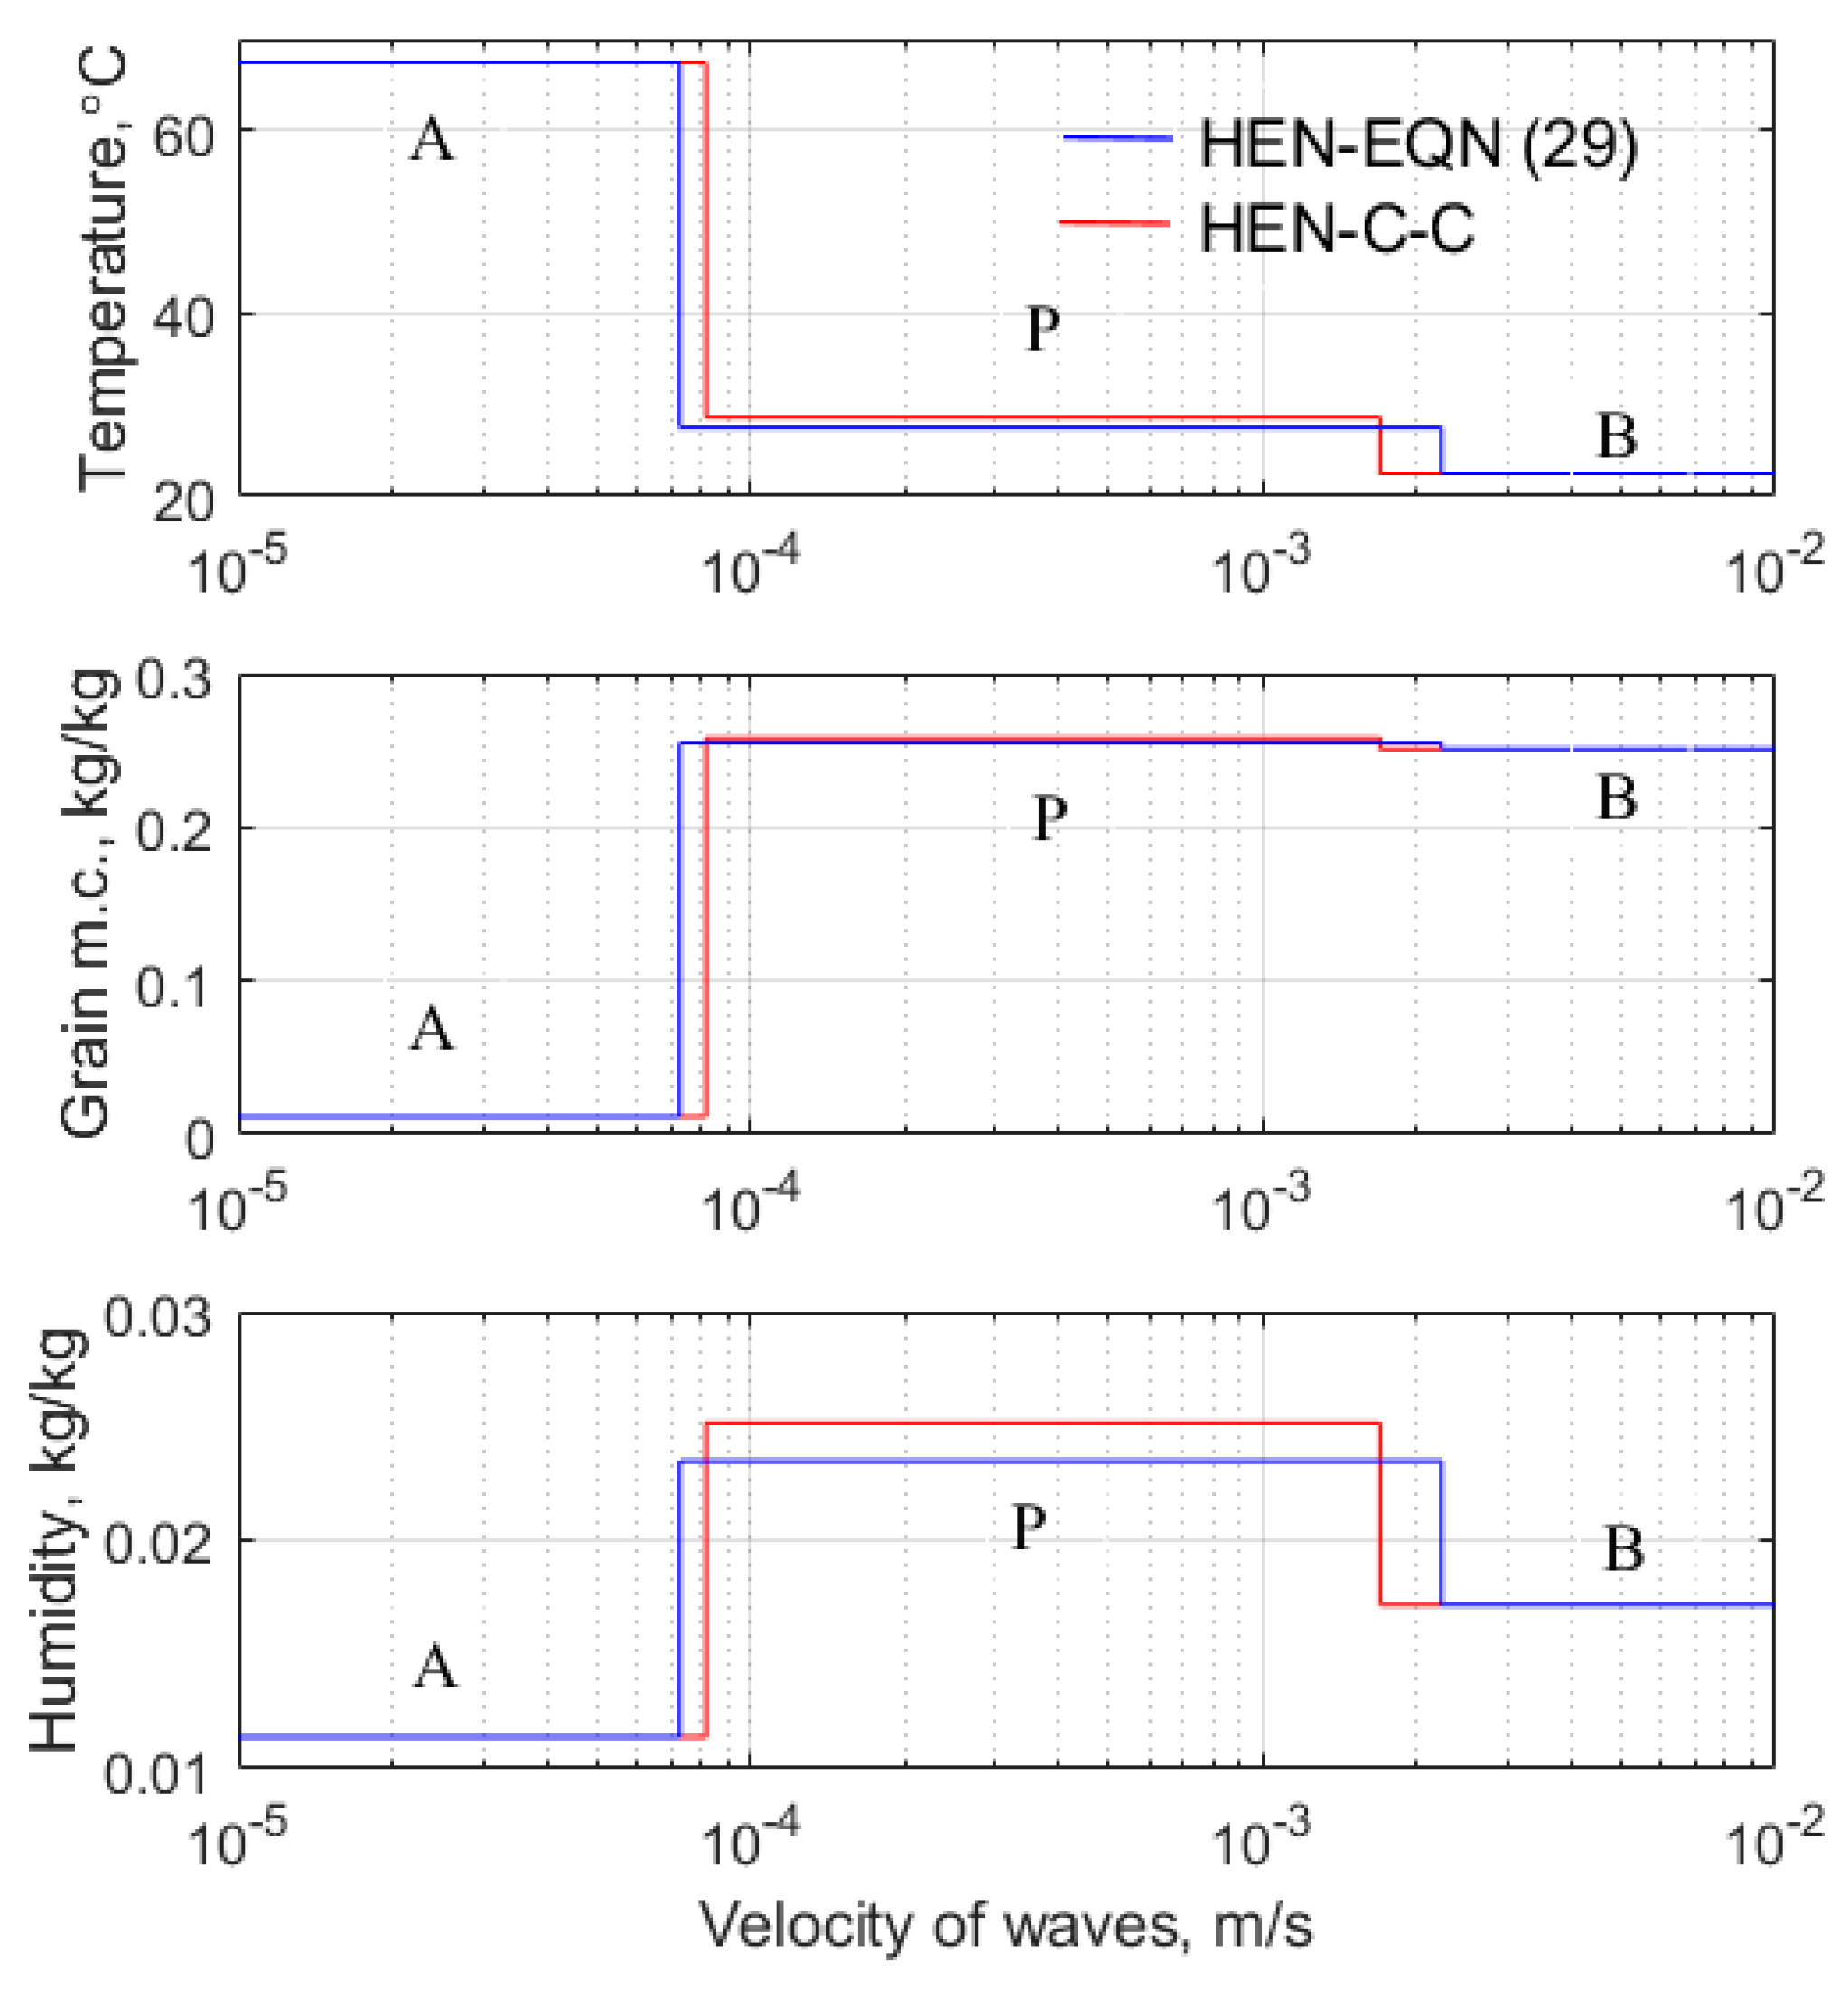
The data shown in
Table 3 reinforce the conclusion that the empirical equation for
, Equation (29), leads to a low velocity,
, of the drying wave. The temperature,
, and humidity,
, are the lowest observed. Cenkowski et al. [
14] measured the plateau temperature and moisture content to be 27.8 °C and 0.256 kg water/kg dry canola, and the corresponding modelled values are 27.5 °C and 0.255 kg/kg. Considering the temperature of air entering the system was 67.5 °C, this is considered to be excellent agreement.
Figure 12 compares the plateau states when the empirical expression, Equation (29), and the Clausius–Clapeyron equation are invoked. The empirical equation predicts higher values of the isothermal differential heat of sorption,
; hence, more energy is required to desorb moisture from the grains. This results in a lower temperature in the plateau state, and the humidity is lower. Because the humidity of the air is lower, it follows that moisture exits the grain at a lower rate. Because the rate at which moisture enters the grain is the same in both cases, a mass balance implies that the overall rate of drying must be lower when the empirical equation is used in place of the Clausius–Clapeyron equation. Note that results using the Halsey equations have been omitted form
Table 3 because the Clausius–Clapeyron approach used in this work results in infinite values of the integral heat of wetting. That the heat of wetting does not enhance the speed of the heating front has no material effect on the design of canola driers. This is because, as indicated in
Table 3, the heat wave has a velocity that is at least two orders of magnitude greater than that of the drying front. As a result, grain in its initial state is very rapidly replaced by grain in the plateau state. The drying takes place across a relatively slow-moving drying front, and this is the time-limiting step.
8. Conclusions
Sorption isotherms provide stored product technologists with indispensable information. They enable the temperature and humidity of process air used to dry agricultural produce to be manipulated to ensure that the desired product moisture content is achieved. Furthermore, information concerning the energy required to remove moisture from the product is subsumed within sorption isotherms.
The scientific literature displays a diversity of sorption isotherms for canola and, importantly, a wide range of experimental results. This work highlights that difficulties arise when sorption isotherms are fitted to experimental data with high fidelity. It is shown that steeper-than-anticipated gradients of moisture contents and temperatures may be predicted. Inaccurate isotherms may lead to commercially significant errors when predicting the performance of driers. For example, if isotherms predict equilibrium humidities of the interstitial air that are too high, then the rate of drying will be over-predicted. In this case, driers would be under-sized.
This work demonstrates that several widely cited sorption isotherms yield anomalous values of the equilibrium moisture content of canola. For example, it is demonstrated that the modified Chung–Pfost isotherm can yield negative values of moisture contents as the relative humidity of the surrounding atmosphere tends to zero. This is an inherent property of the Chung–Pfost isotherm. It is also shown that the modified Halsey isotherm predicts a sharp drop in the moisture content of canola as the relative humidity of the surrounding air approaches zero.
An empirical expression used by Cenkowski et al. [
14] exhibits values of the differential and integral heats of wetting that are considerably higher than those calculated by employing the Clausius–Clapeyron equation. It is also found that the integral heat of wetting cannot be determined by the modified Halsey isotherm when the Clausius–Clapeyron equation is used, because the integral is divergent. When Hunter’s [
19] isotherm is invoked, it is found that
as
, but the integral heat of wetting remains finite.
It is demonstrated that the empirical formulation of the differential heat of wetting given by Cenkowski et al. [
14] results in a lower predicted rate of canola drying than that predicted by the Clausius–Clapeyron formulation. This is because the empirical equation suggests that more energy is required to release moisture that is bound to the solid substrate. It is also shown that neither the empirical nor the Clausius–Clapeyron equations predict that the heat of wetting augments the rate of heating of the initially cool wet canola. This is somewhat counterintuitive, and it arises in part because the latent heat of vaporisation of water is lower in the plateau state than in the initial state of the canola being dried.
This work highlights the need to obtain accurate and consistent sorption data. It is particularly important to garner data on the moisture content of food grains as the relative humidity of air approaches zero and unity. It is also important to obtain values of the differential heat of sorption, both directly by measurement and from sorption data. The ultimate test will be to carry out drying experiments under a wide range of operating conditions.


