
A Novel Validated Method to Determine the Relationship Between Insulation Thickness and the Annual Cooling Cost in Desert Climates


Abstract
1. Introduction
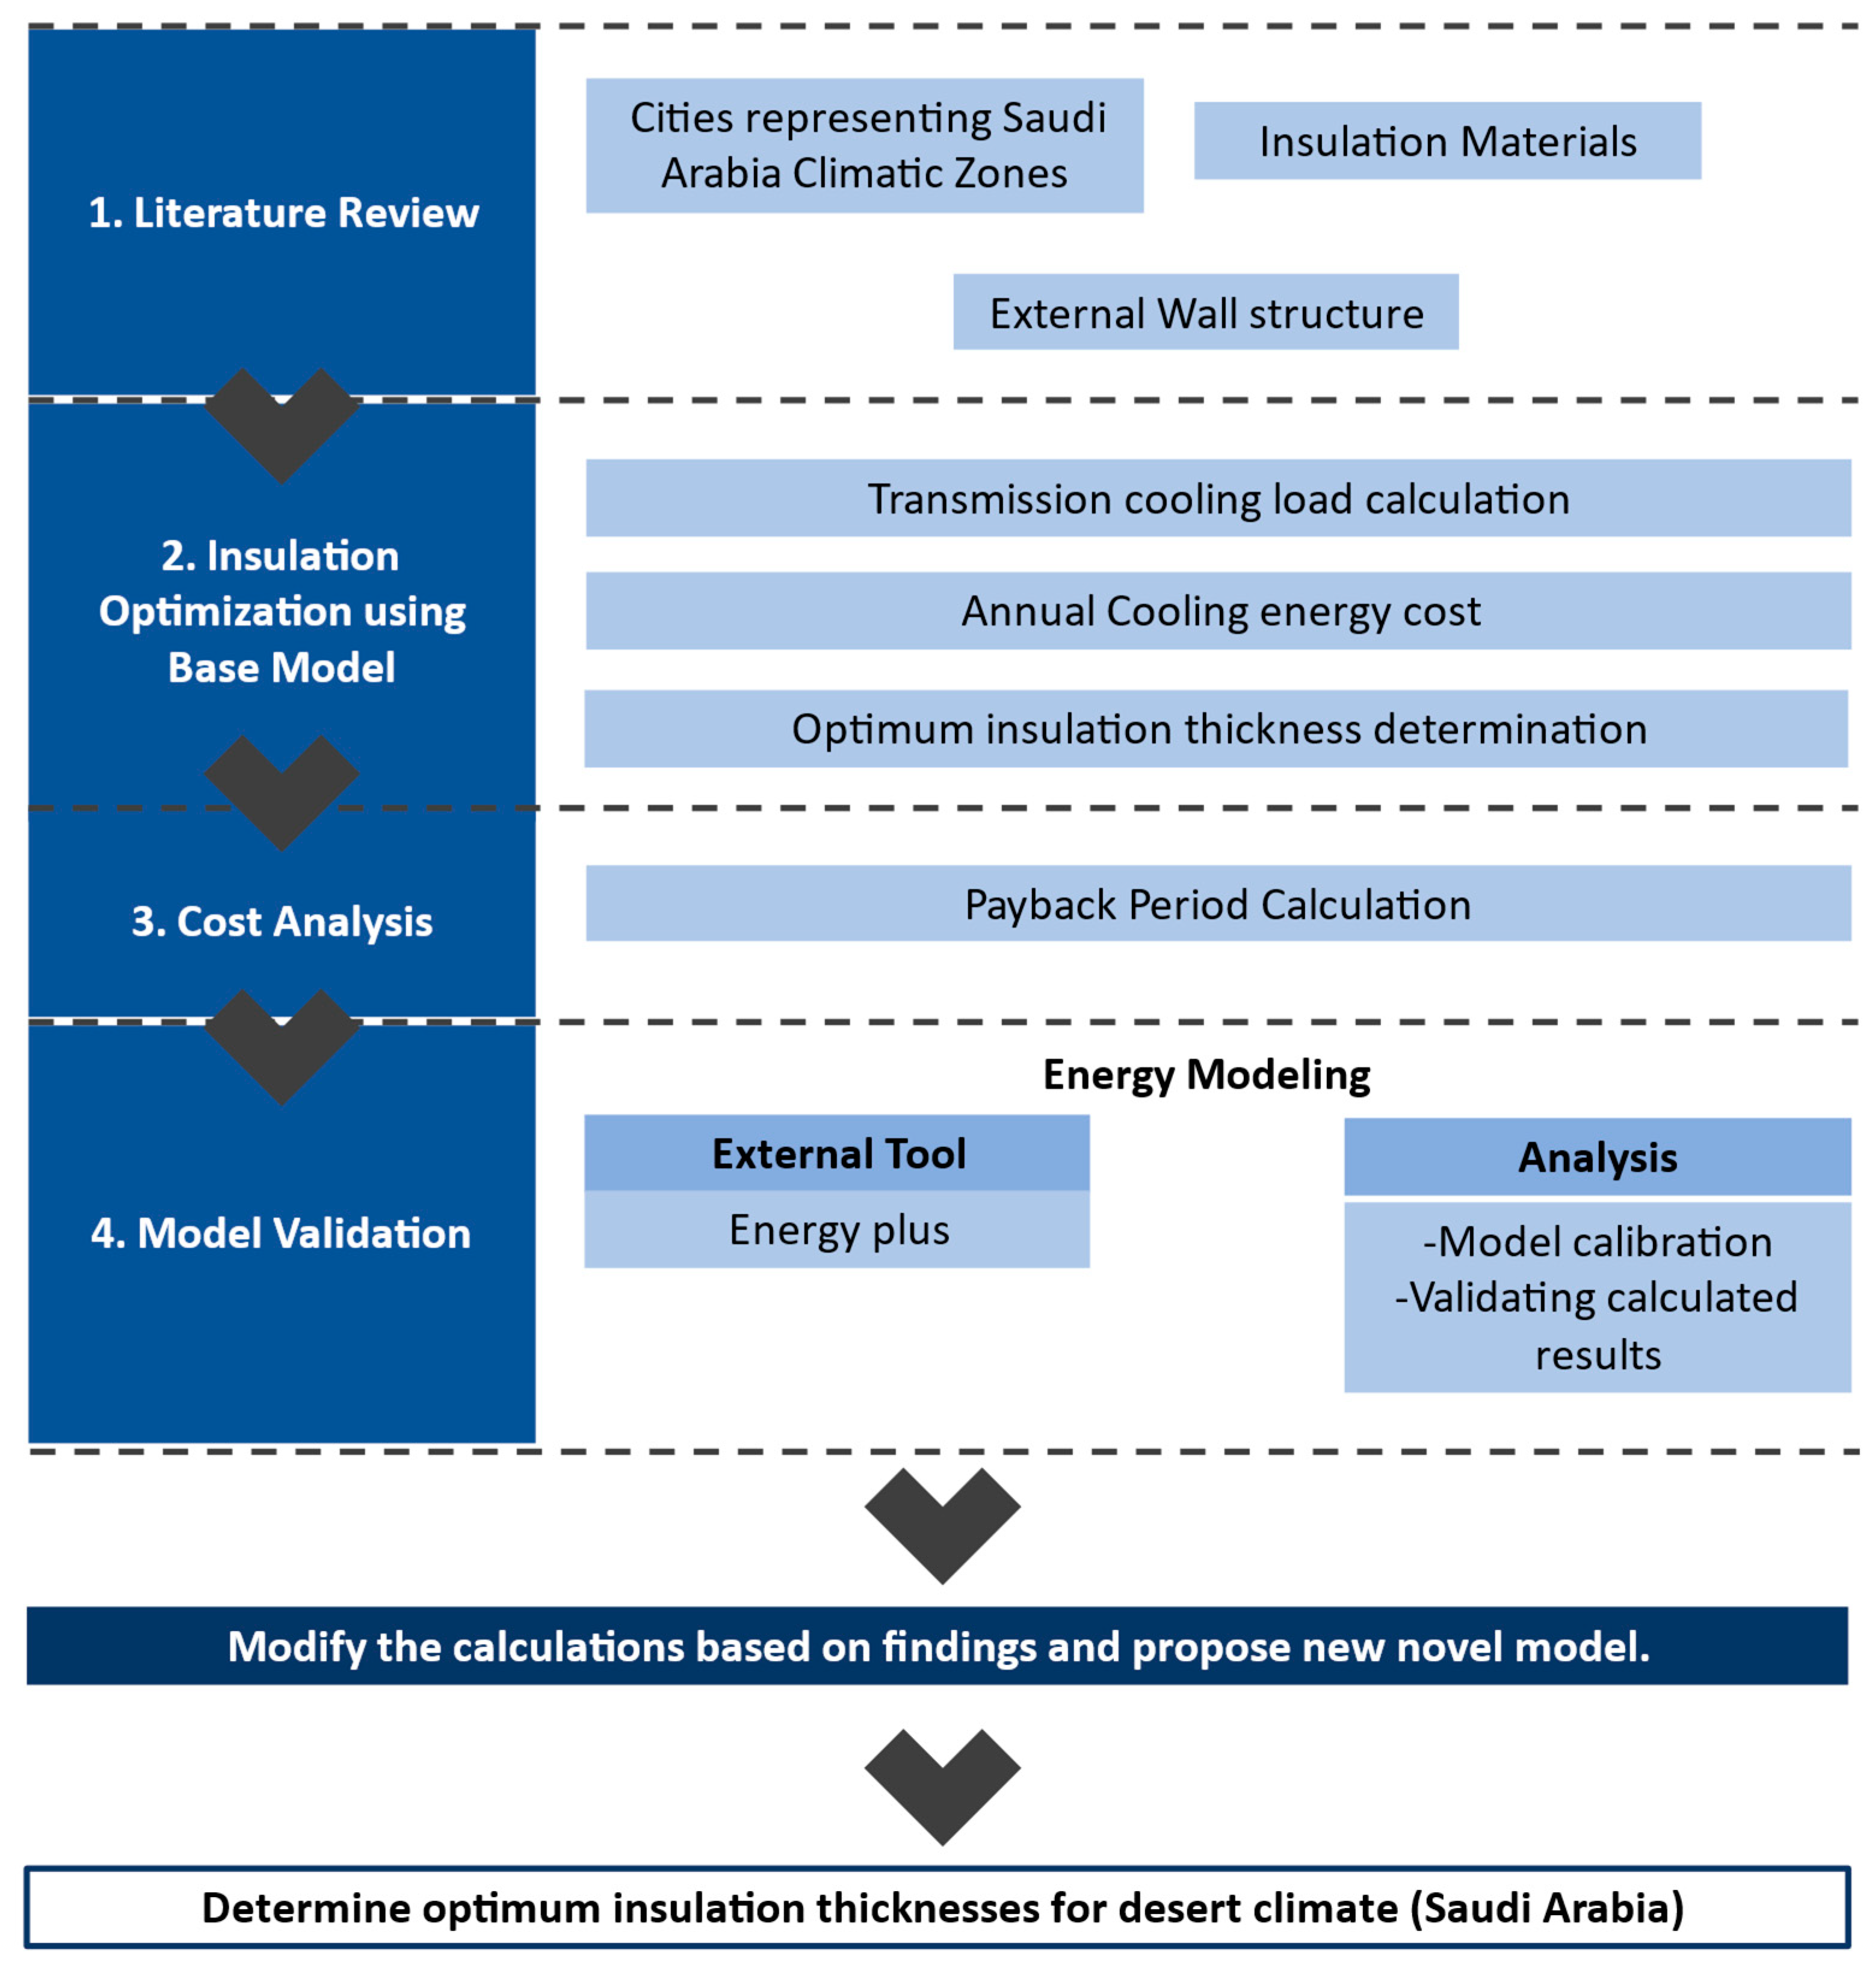
2. Methodology
2.1. Estimation of Annual Heat Gain and Cooling Load
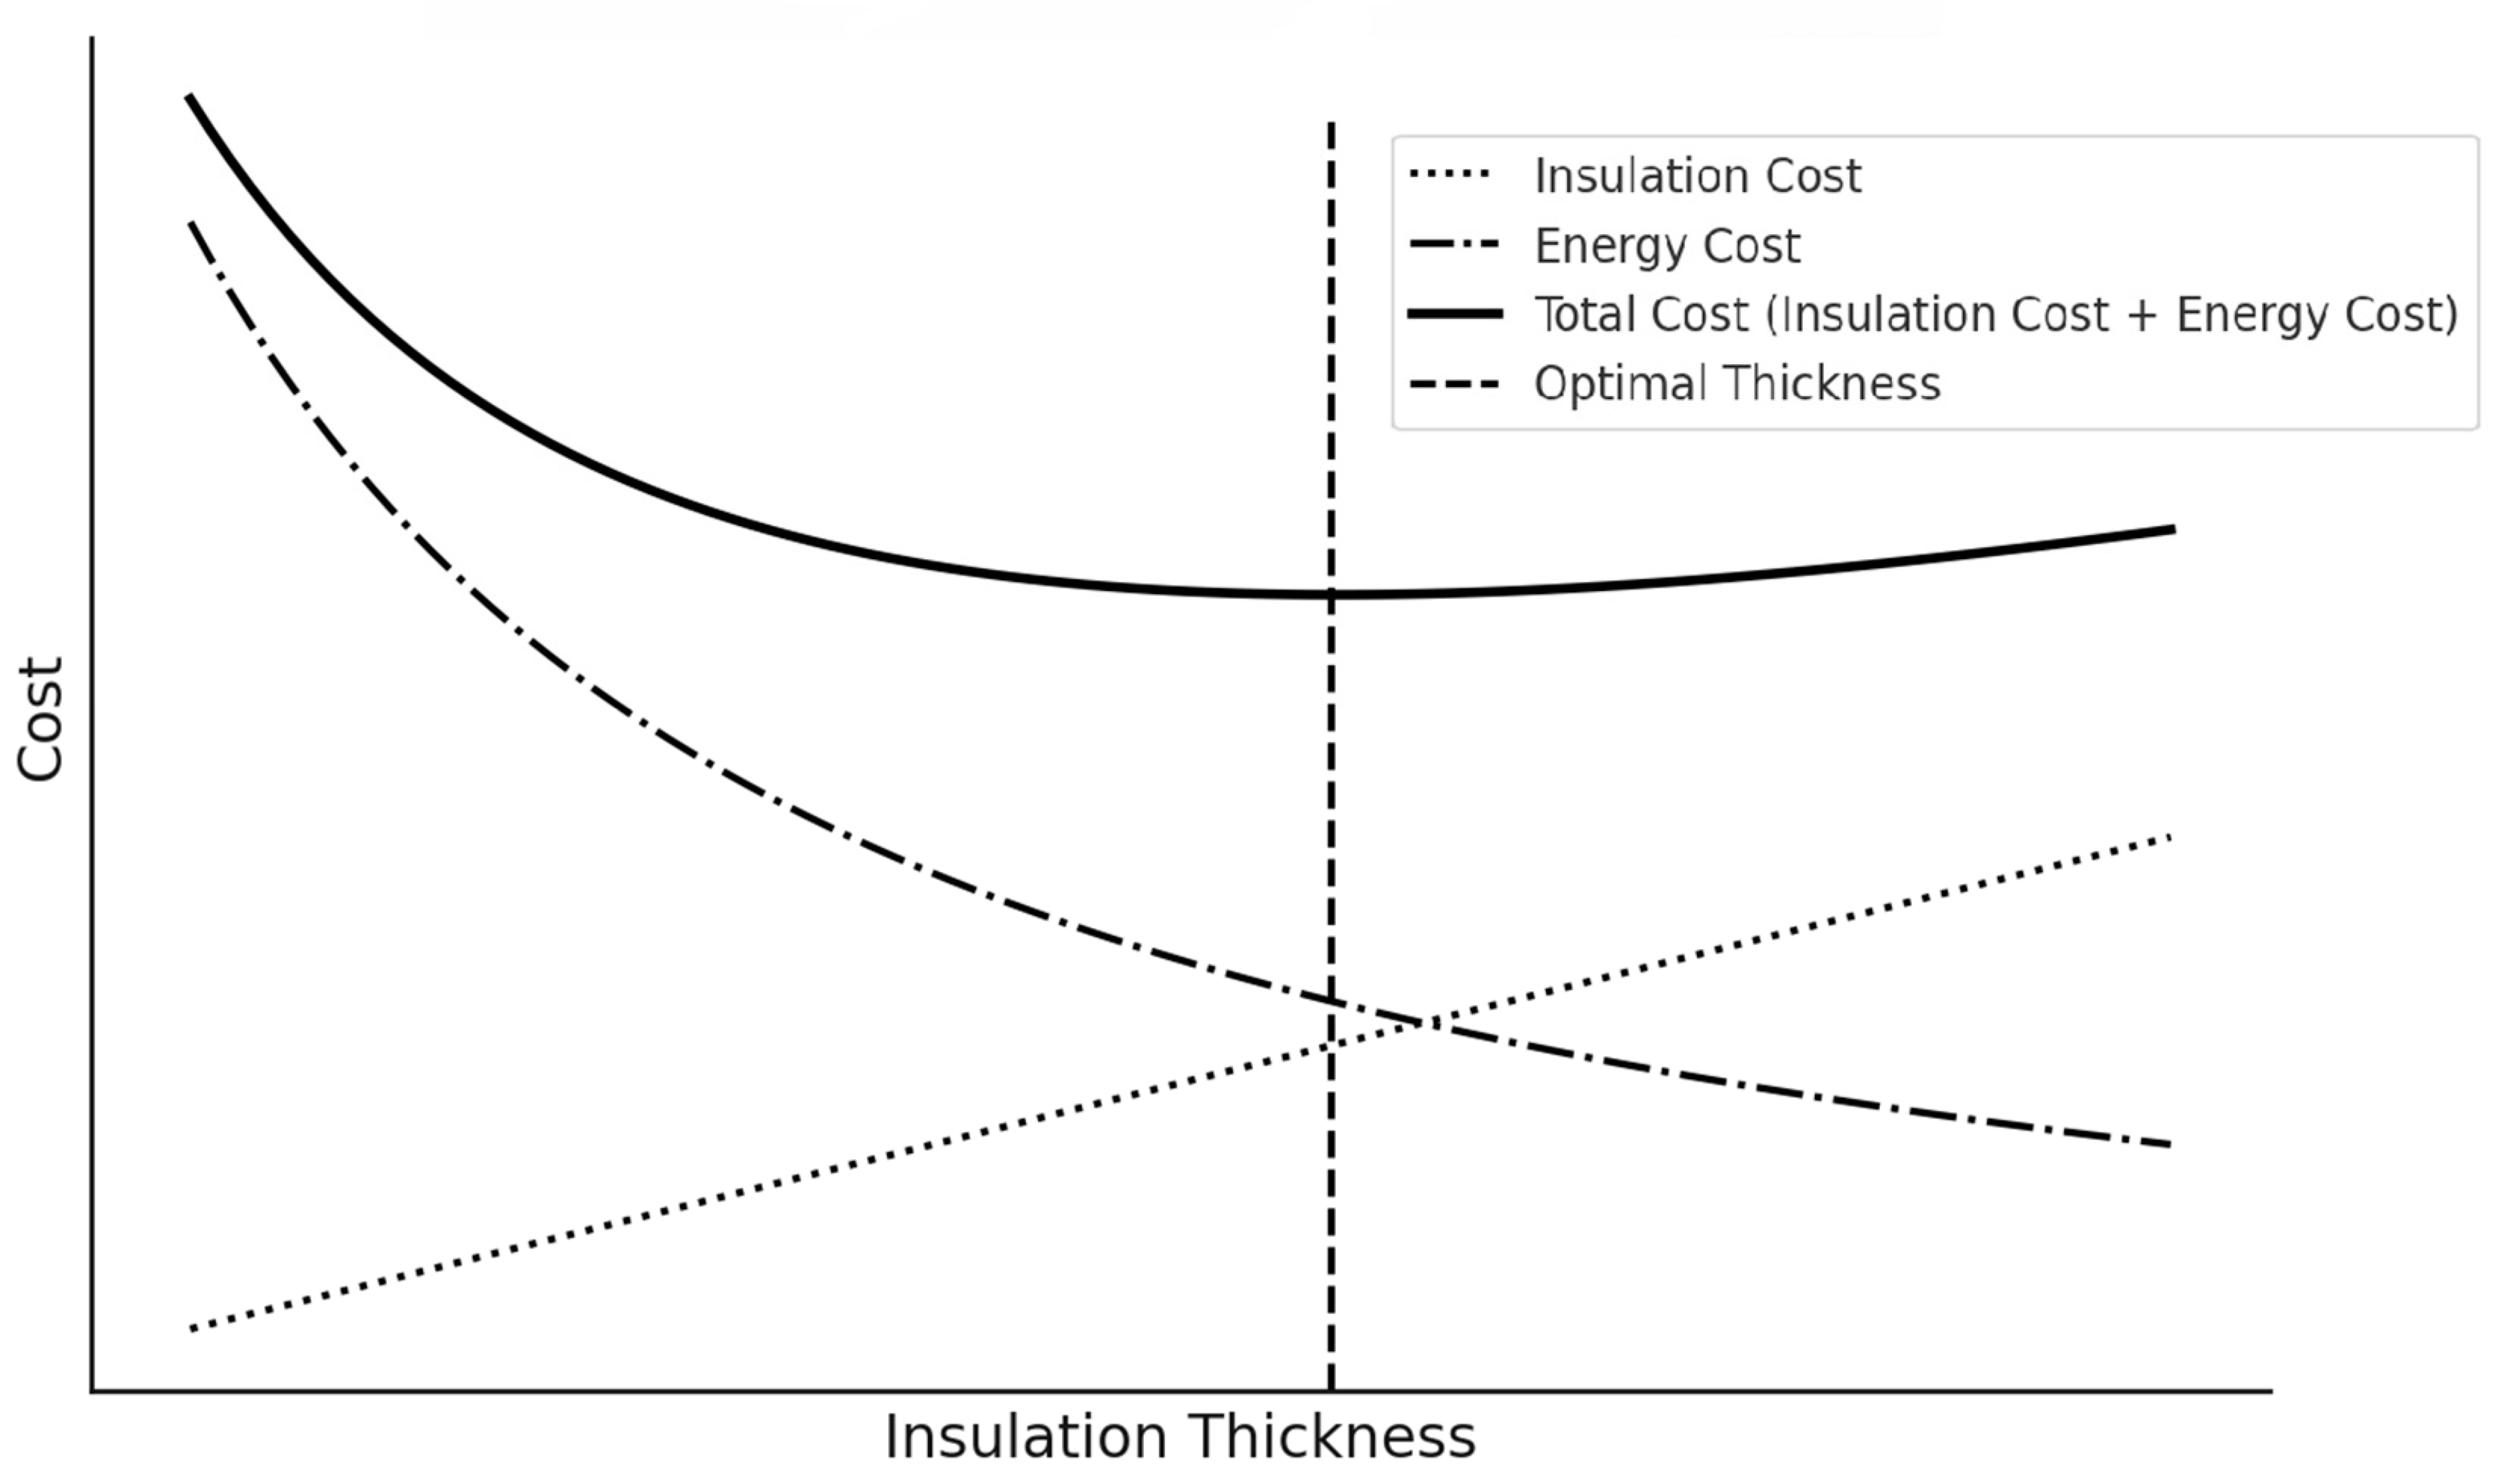
2.2. Calculation of Optimum Insulation Thickness and Annual Energy Cost
2.3. Calculation of the Payback Period

| Parameter | Value |
|---|---|
| Degree-days, DD () | See Table 2 |
| External walls | See Table 3 |
| External insulation materials | See Table 4 |
| Electricity Cost | 0.18 (SAR/kWh) |
| Coefficient of Performance, COP | 3 |
| Interest rate, i | 3.8% |
| Inflation rate, f | 4% |
| Lifetime, N | 10 years |
| City | CDD (°C-Days) | HDD (°C-Days) | |||
|---|---|---|---|---|---|
| Riyadh | 24.9 | 46.7 | 612 | 5688 | 291 |
| Guriat | 31.4 | 37.3 | 499 | 3571 | 985 |
| Dhahran | 26.3 | 50.2 | 17 | 5953 | 142 |
| Jeddah | 21.7 | 39.2 | 12 | 6587 | 0 |
| Khamis Mushait | 18.3 | 42.8 | 2054 | 3390 | 393 |
| Wall Structure | X (m) | k (W/m.K) | R (m2.K/W) |
|---|---|---|---|
| Internal plaster | 0.02 | 0.87 | 0.023 |
| Bricks | 0.13 | 0.45 | 0.289 |
| External plaster (cement-based) | 0.03 | 1.4 | 0.021 |
| Ri inside heat transfer coefficients | 0.13 | ||
| Ro outside heat transfer coefficients | 0.04 | ||
| Rw,t (Total Resistance) | 0.503 |
| Insulation | k (W/m.K) | Cy (SAR/m3) |
|---|---|---|
| Molded polystyrene | 0.034 | $80 * 300 |
| Polyurethane (board) | 0.024 | 200$ * 750 |
| Rock Wool | 0.042 | 88$ * 330 |
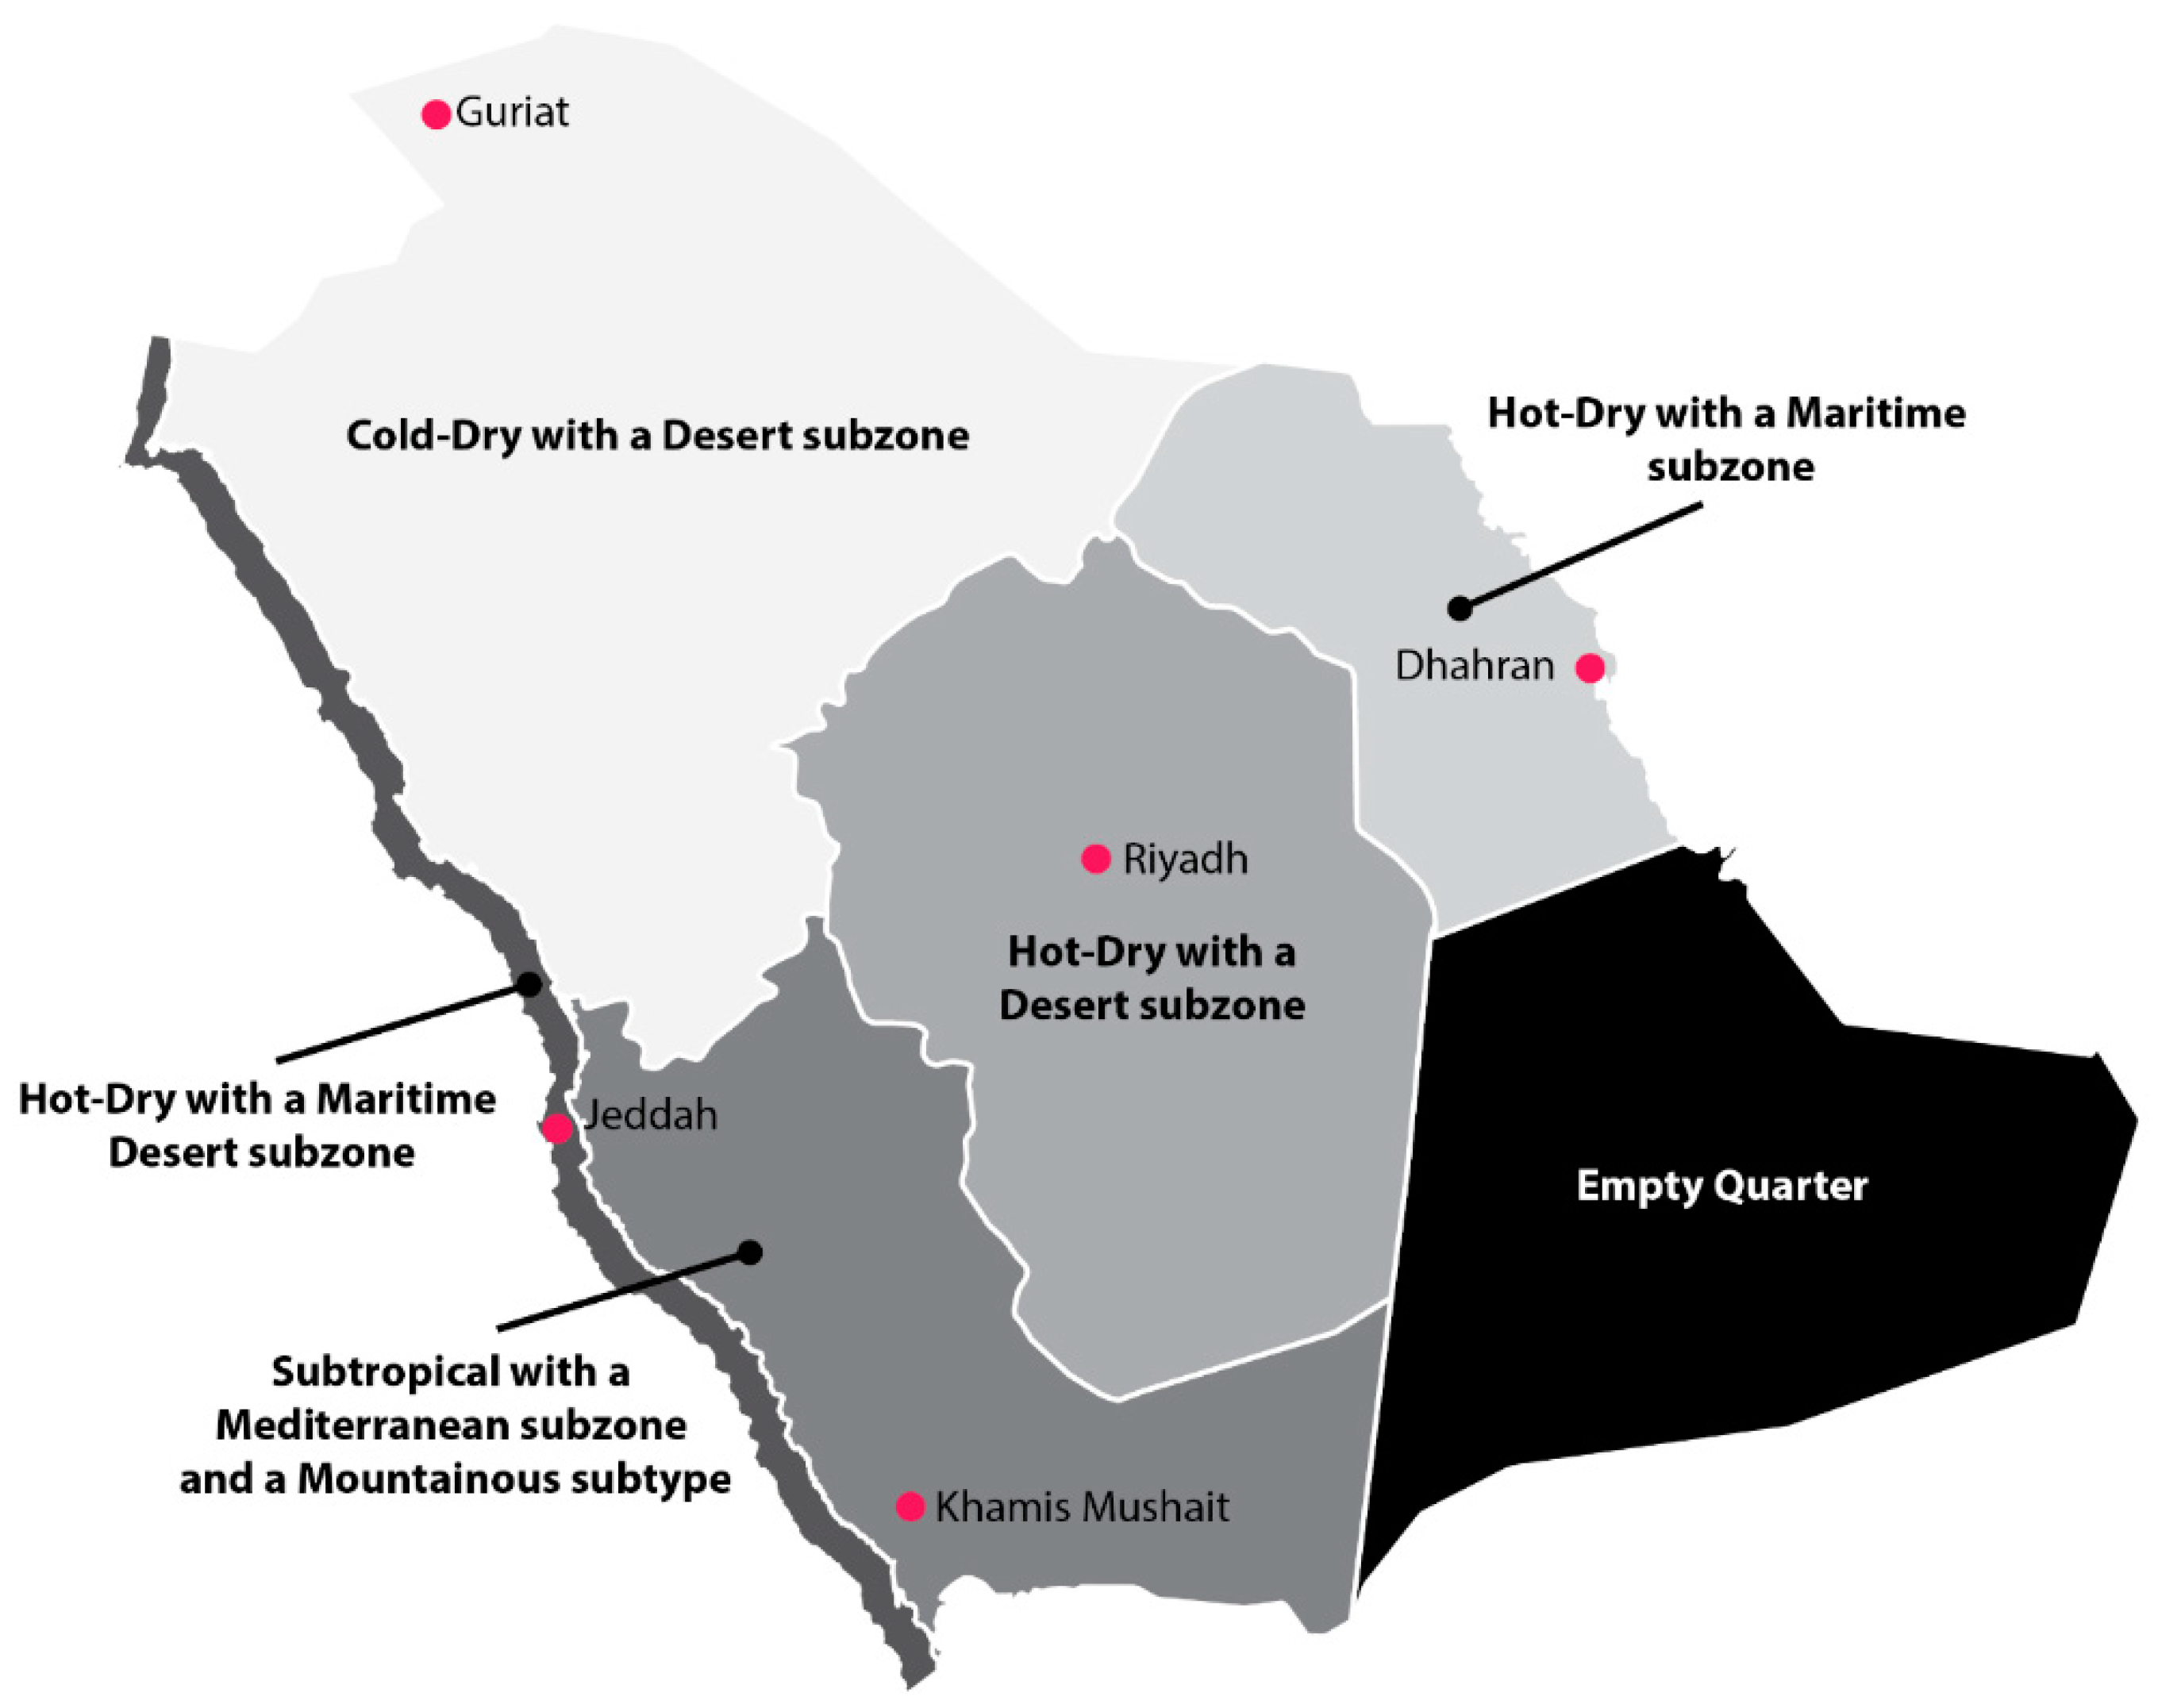
2.4. Selected Cities
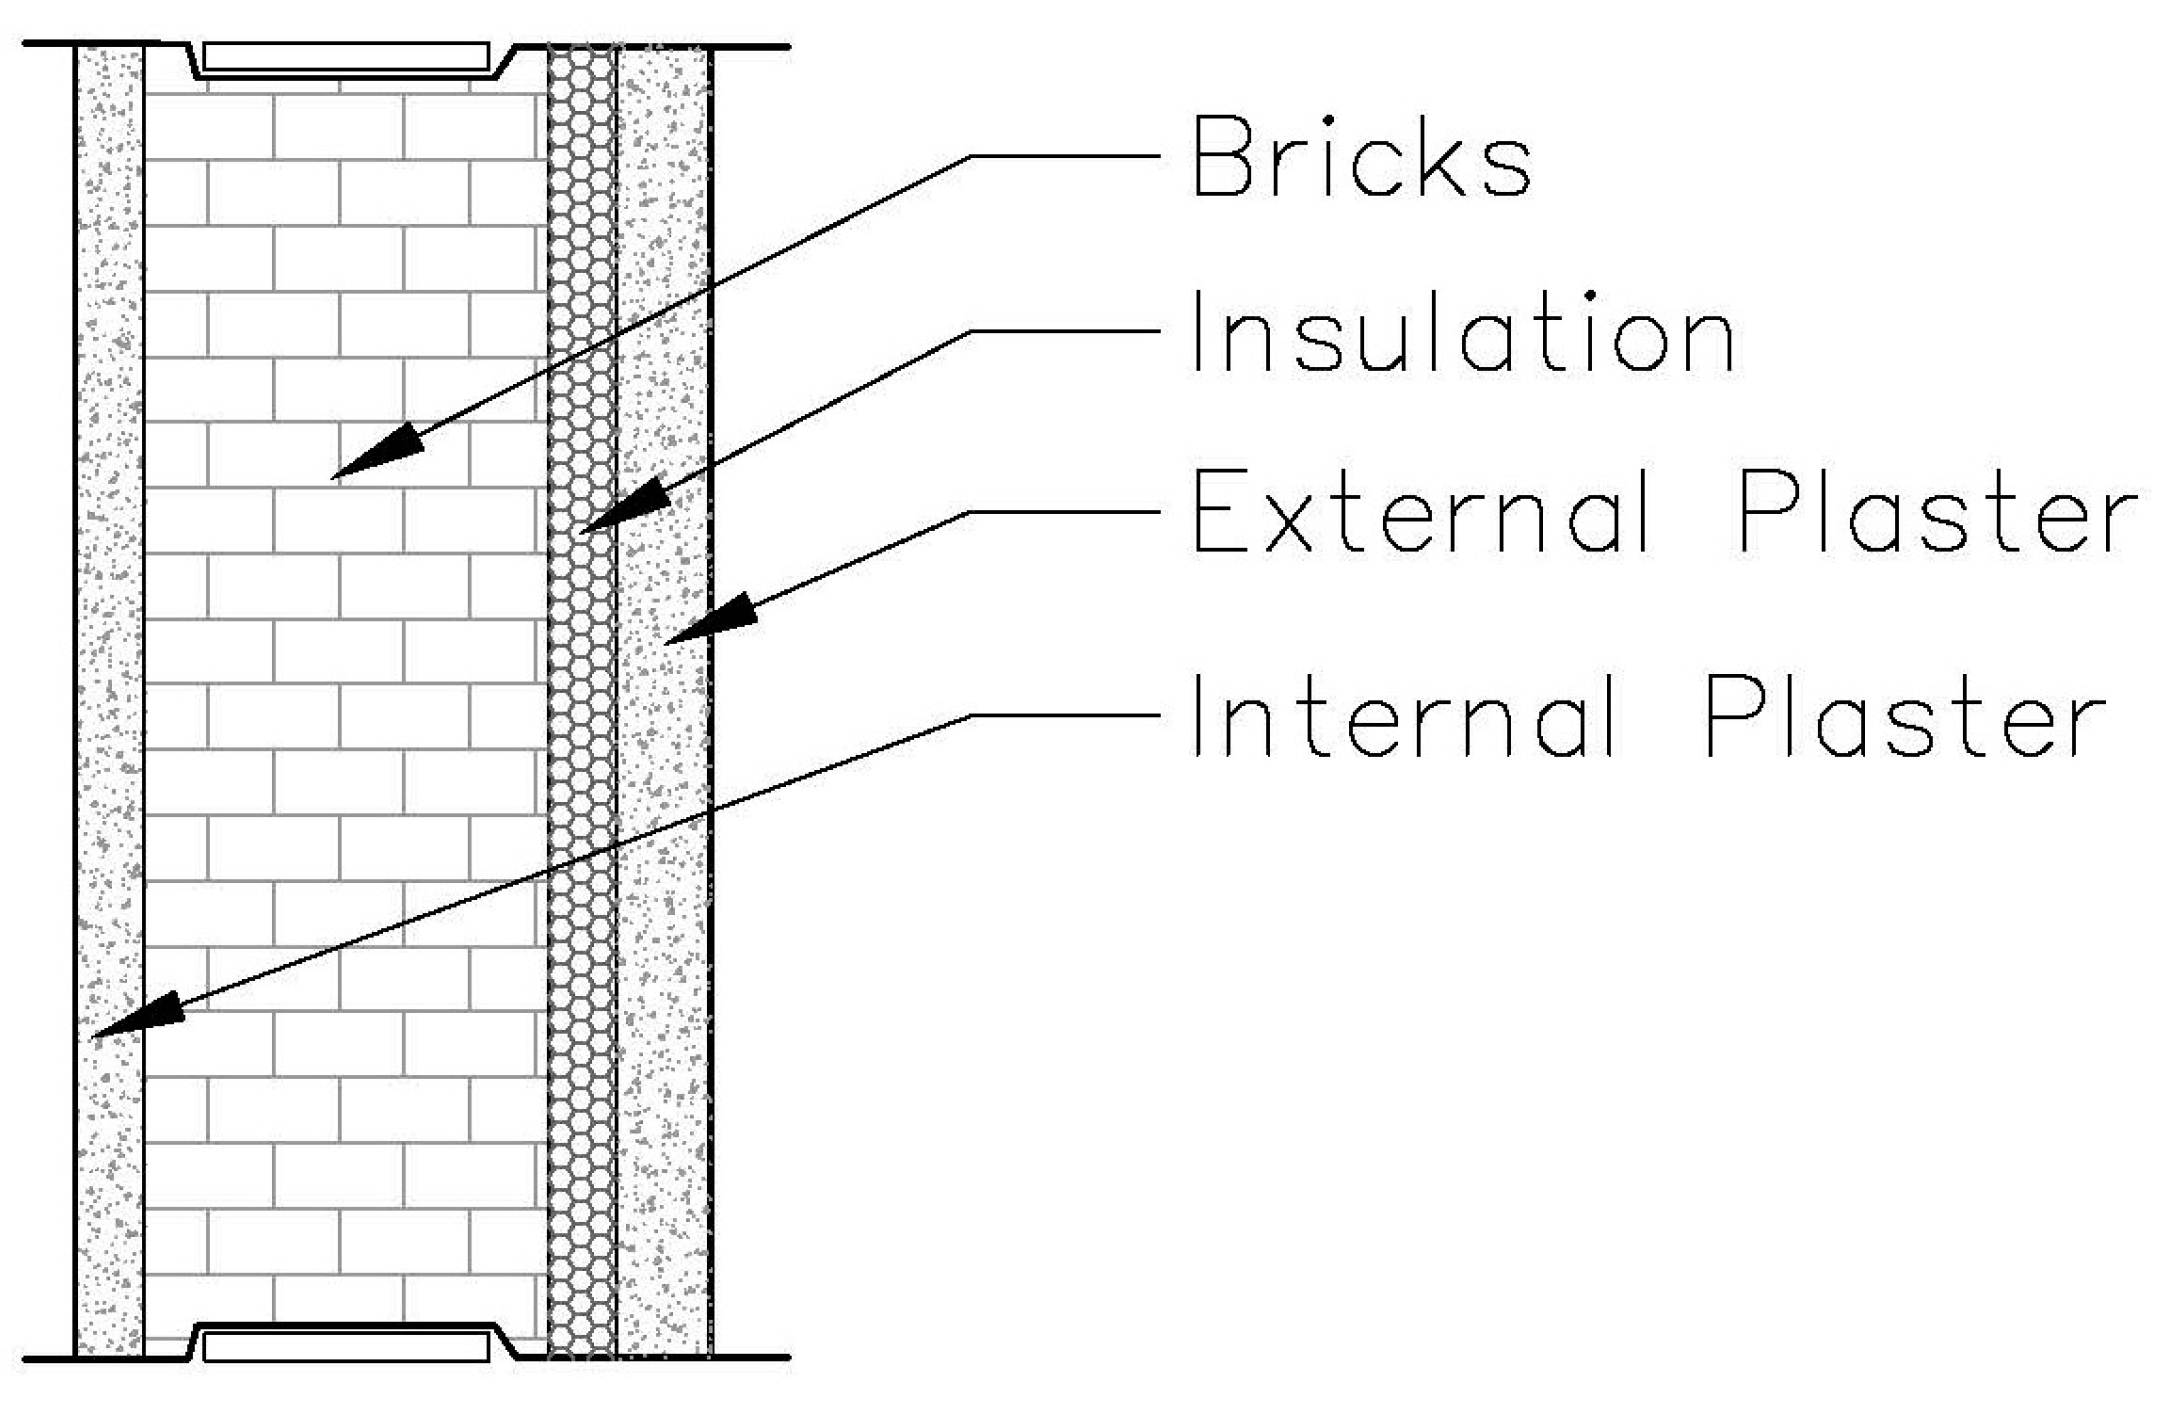
2.5. Structure of the External Wall
2.6. Energy Modeling
3. Results and Discussion
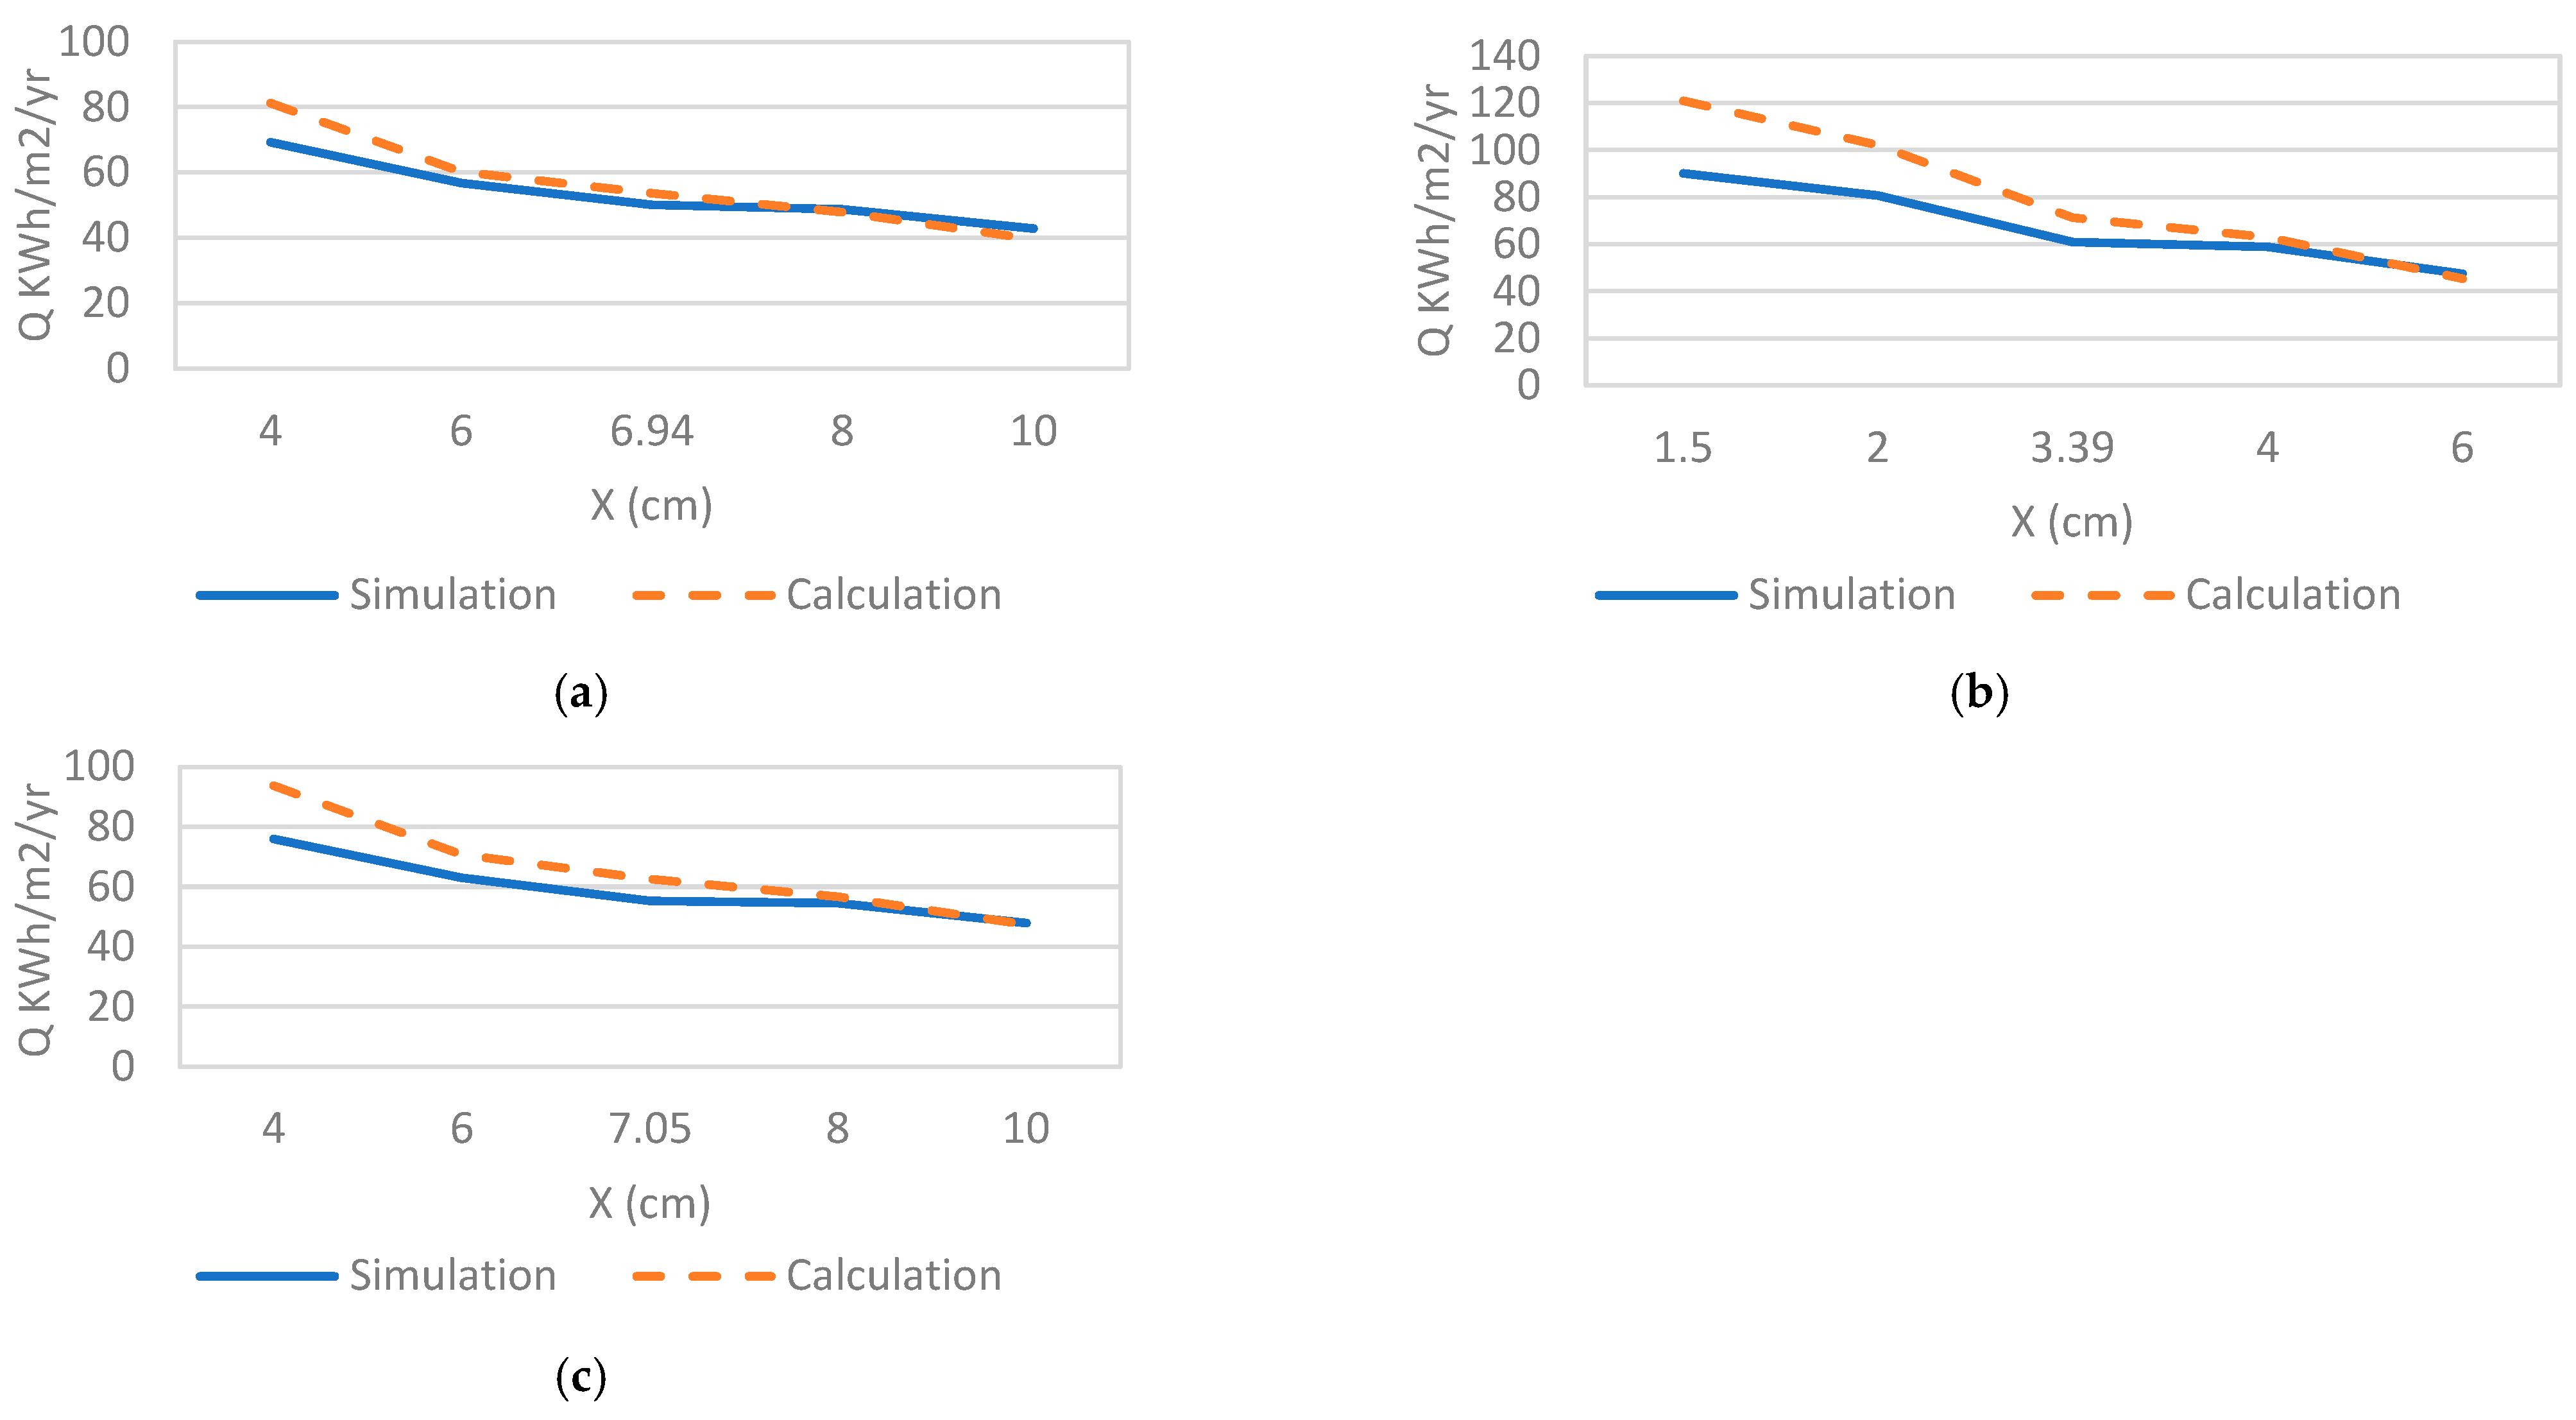
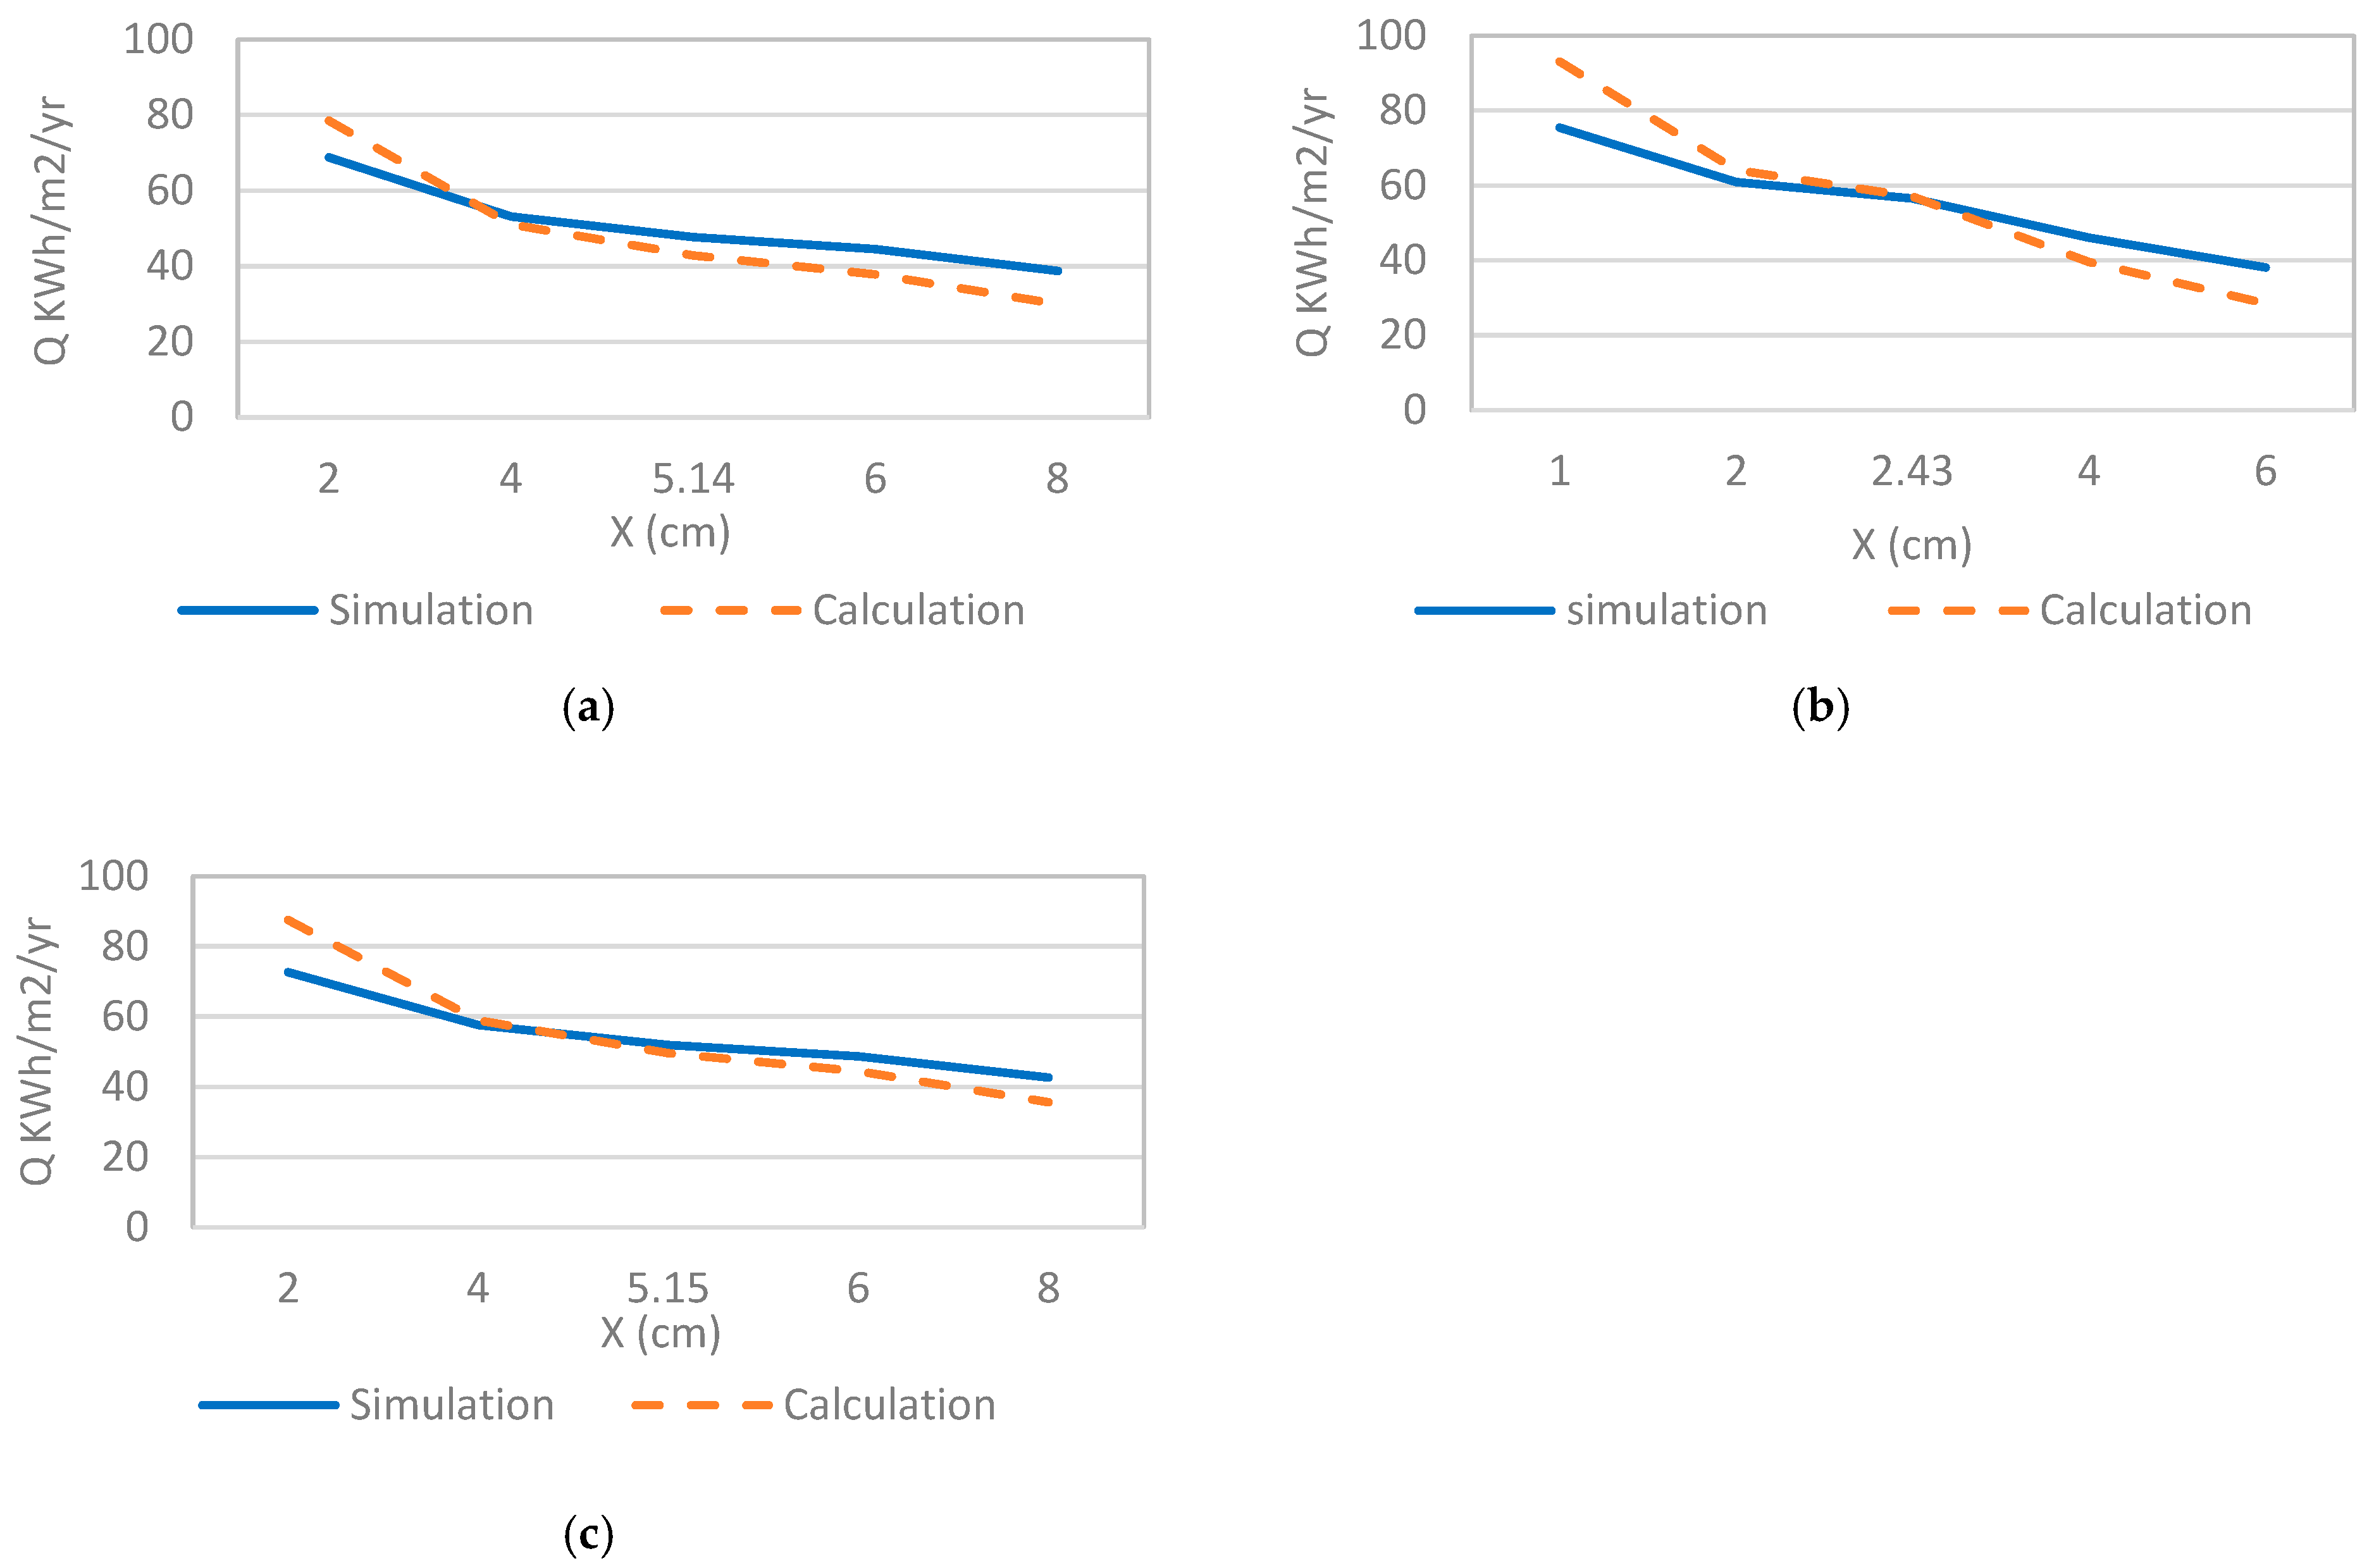
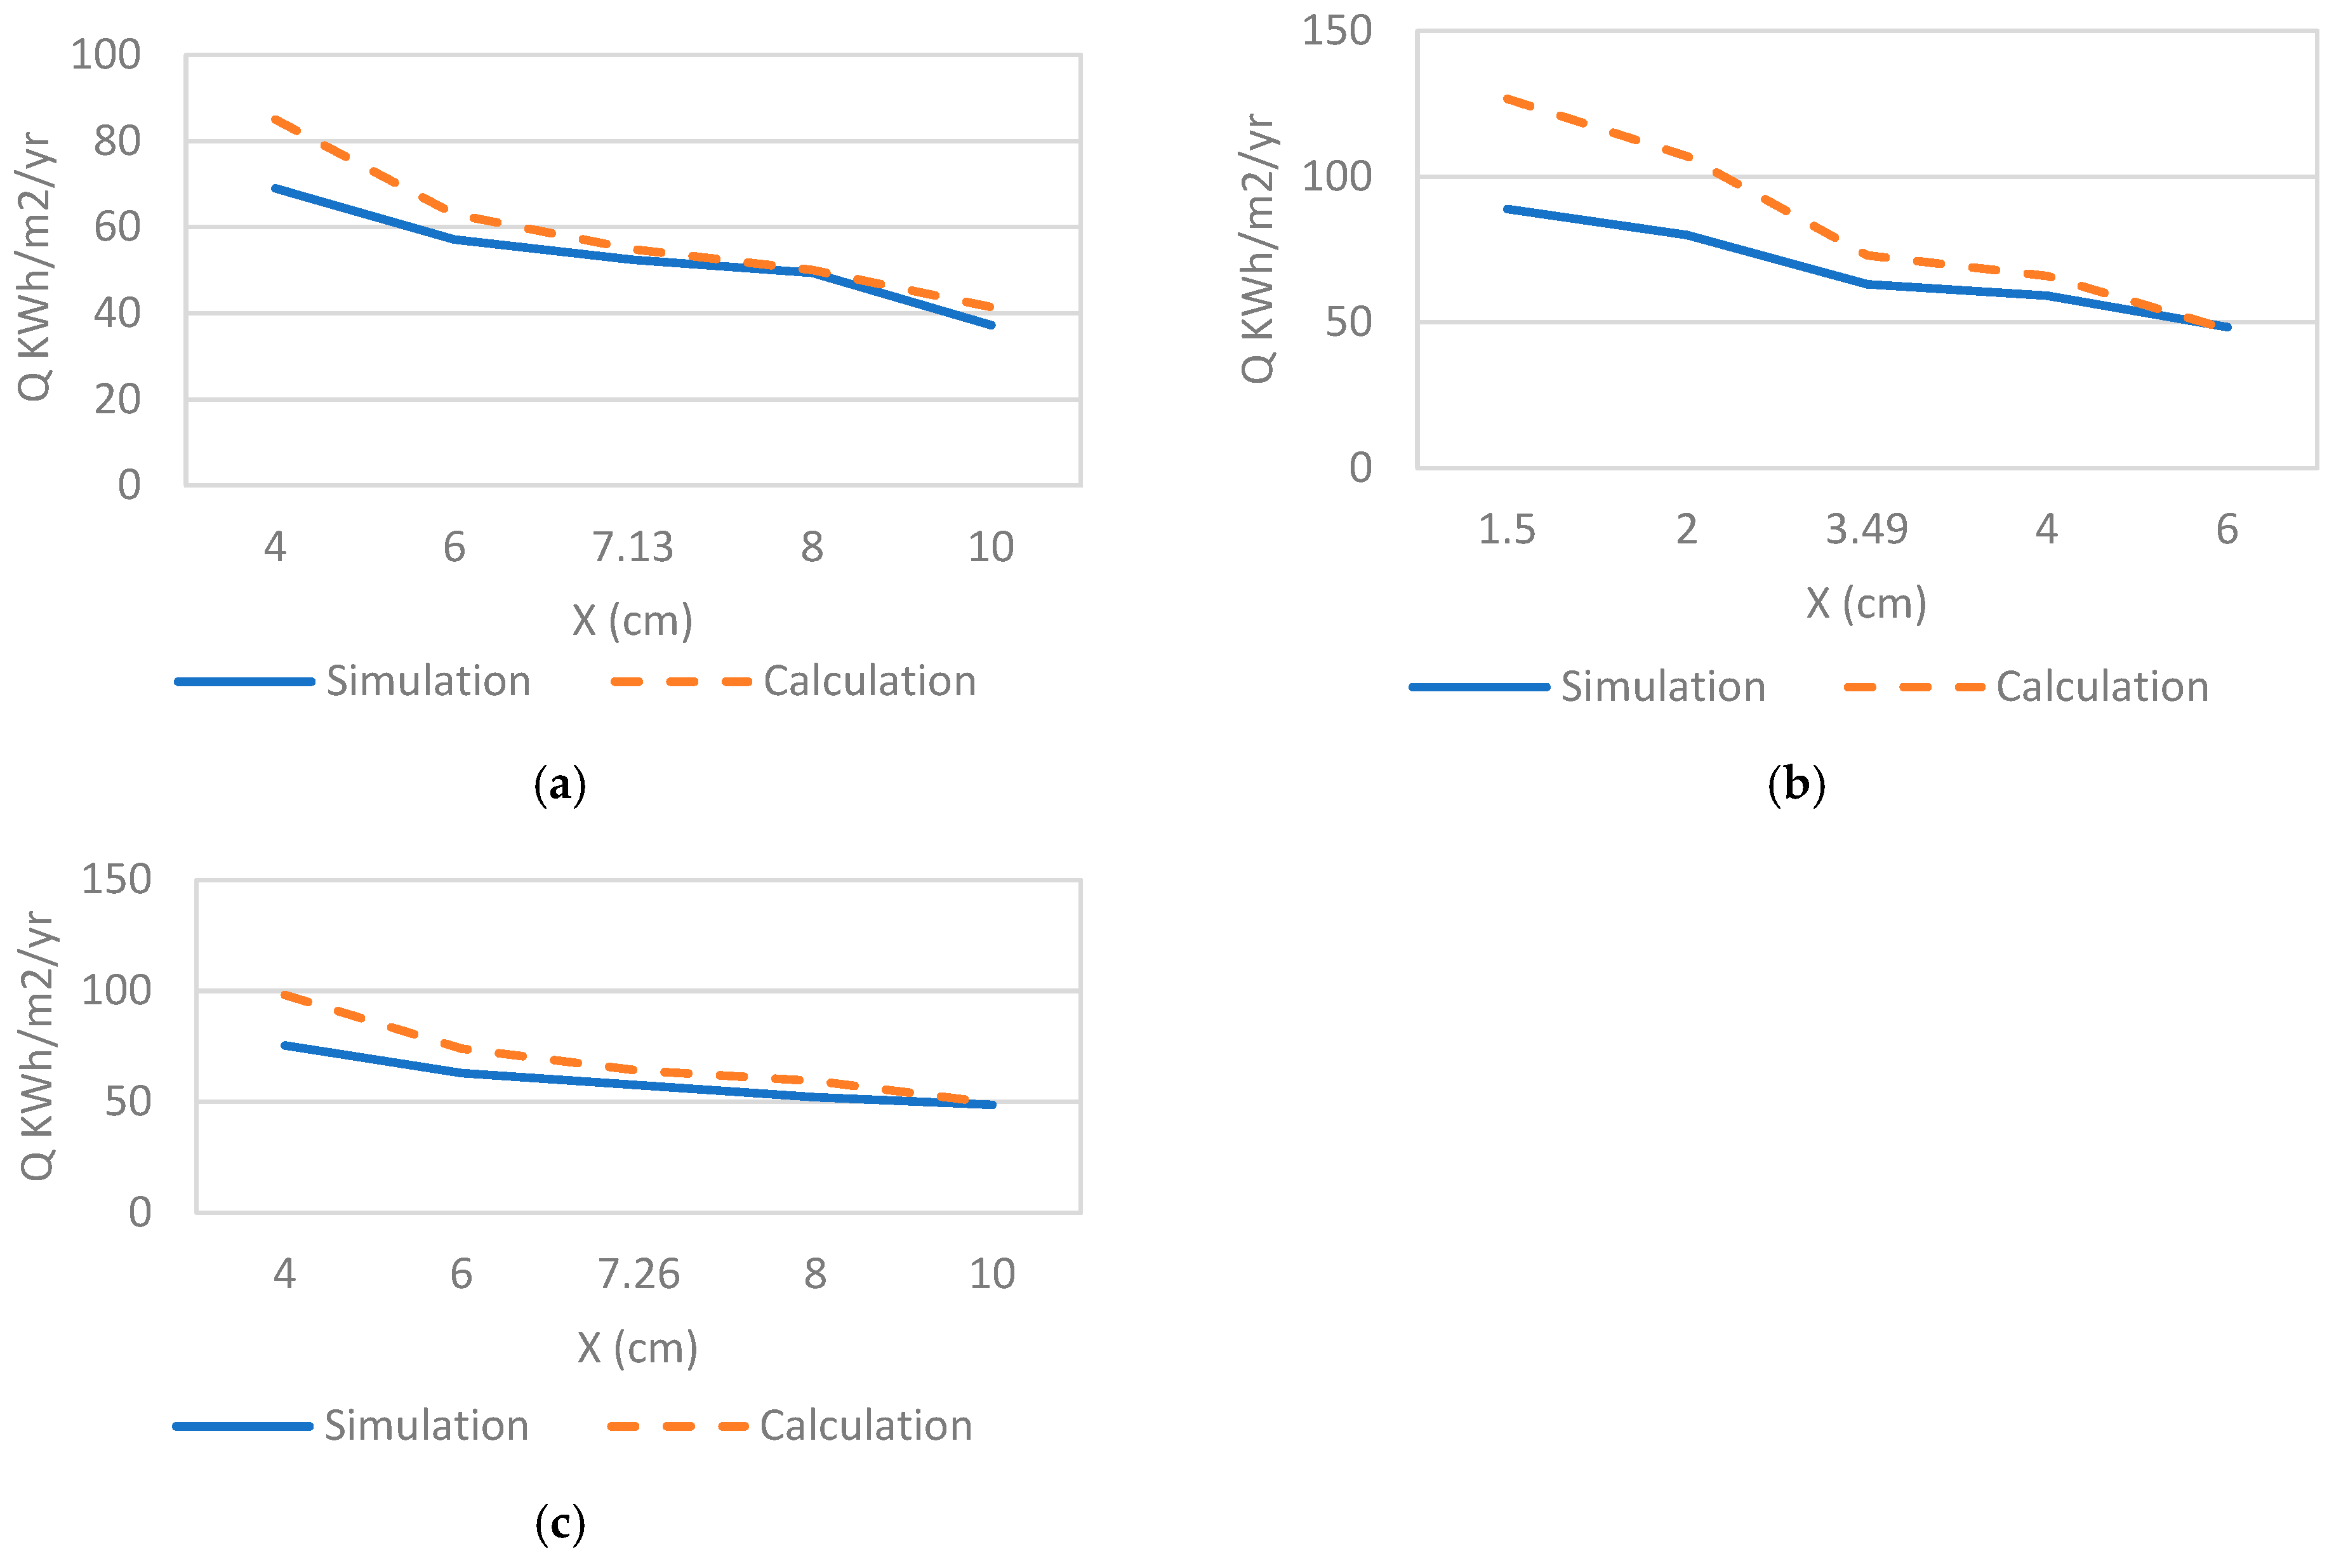
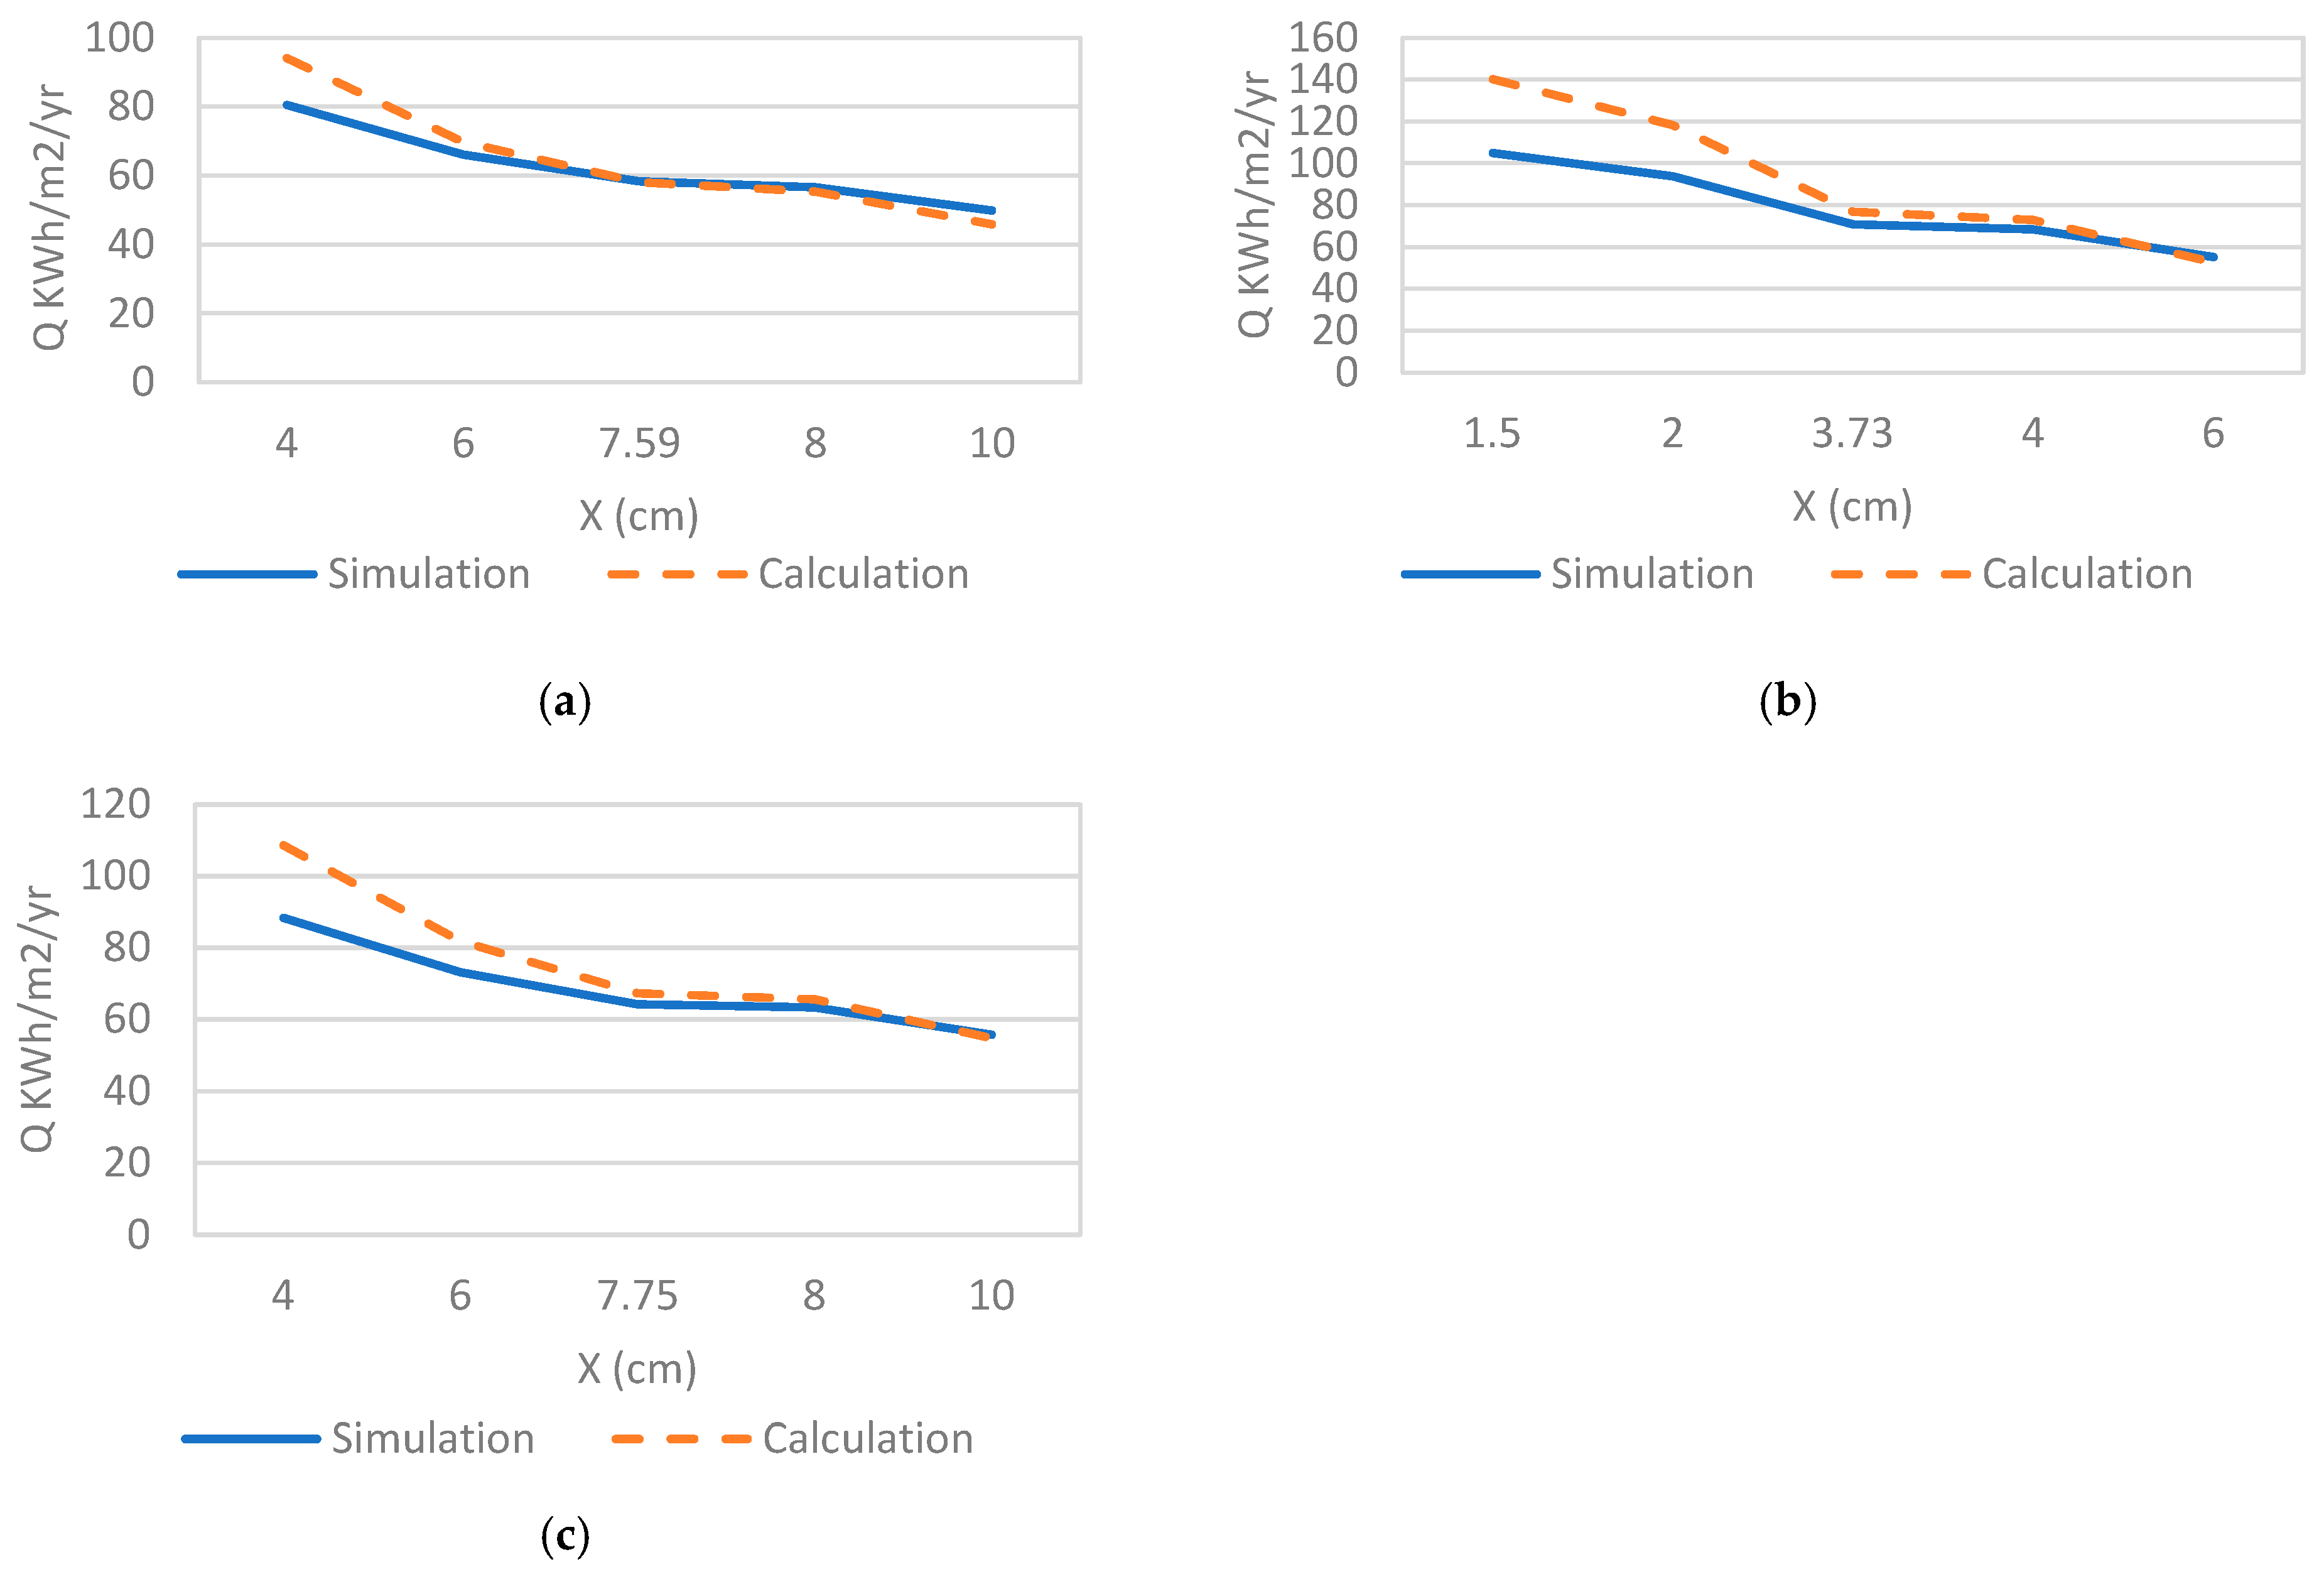
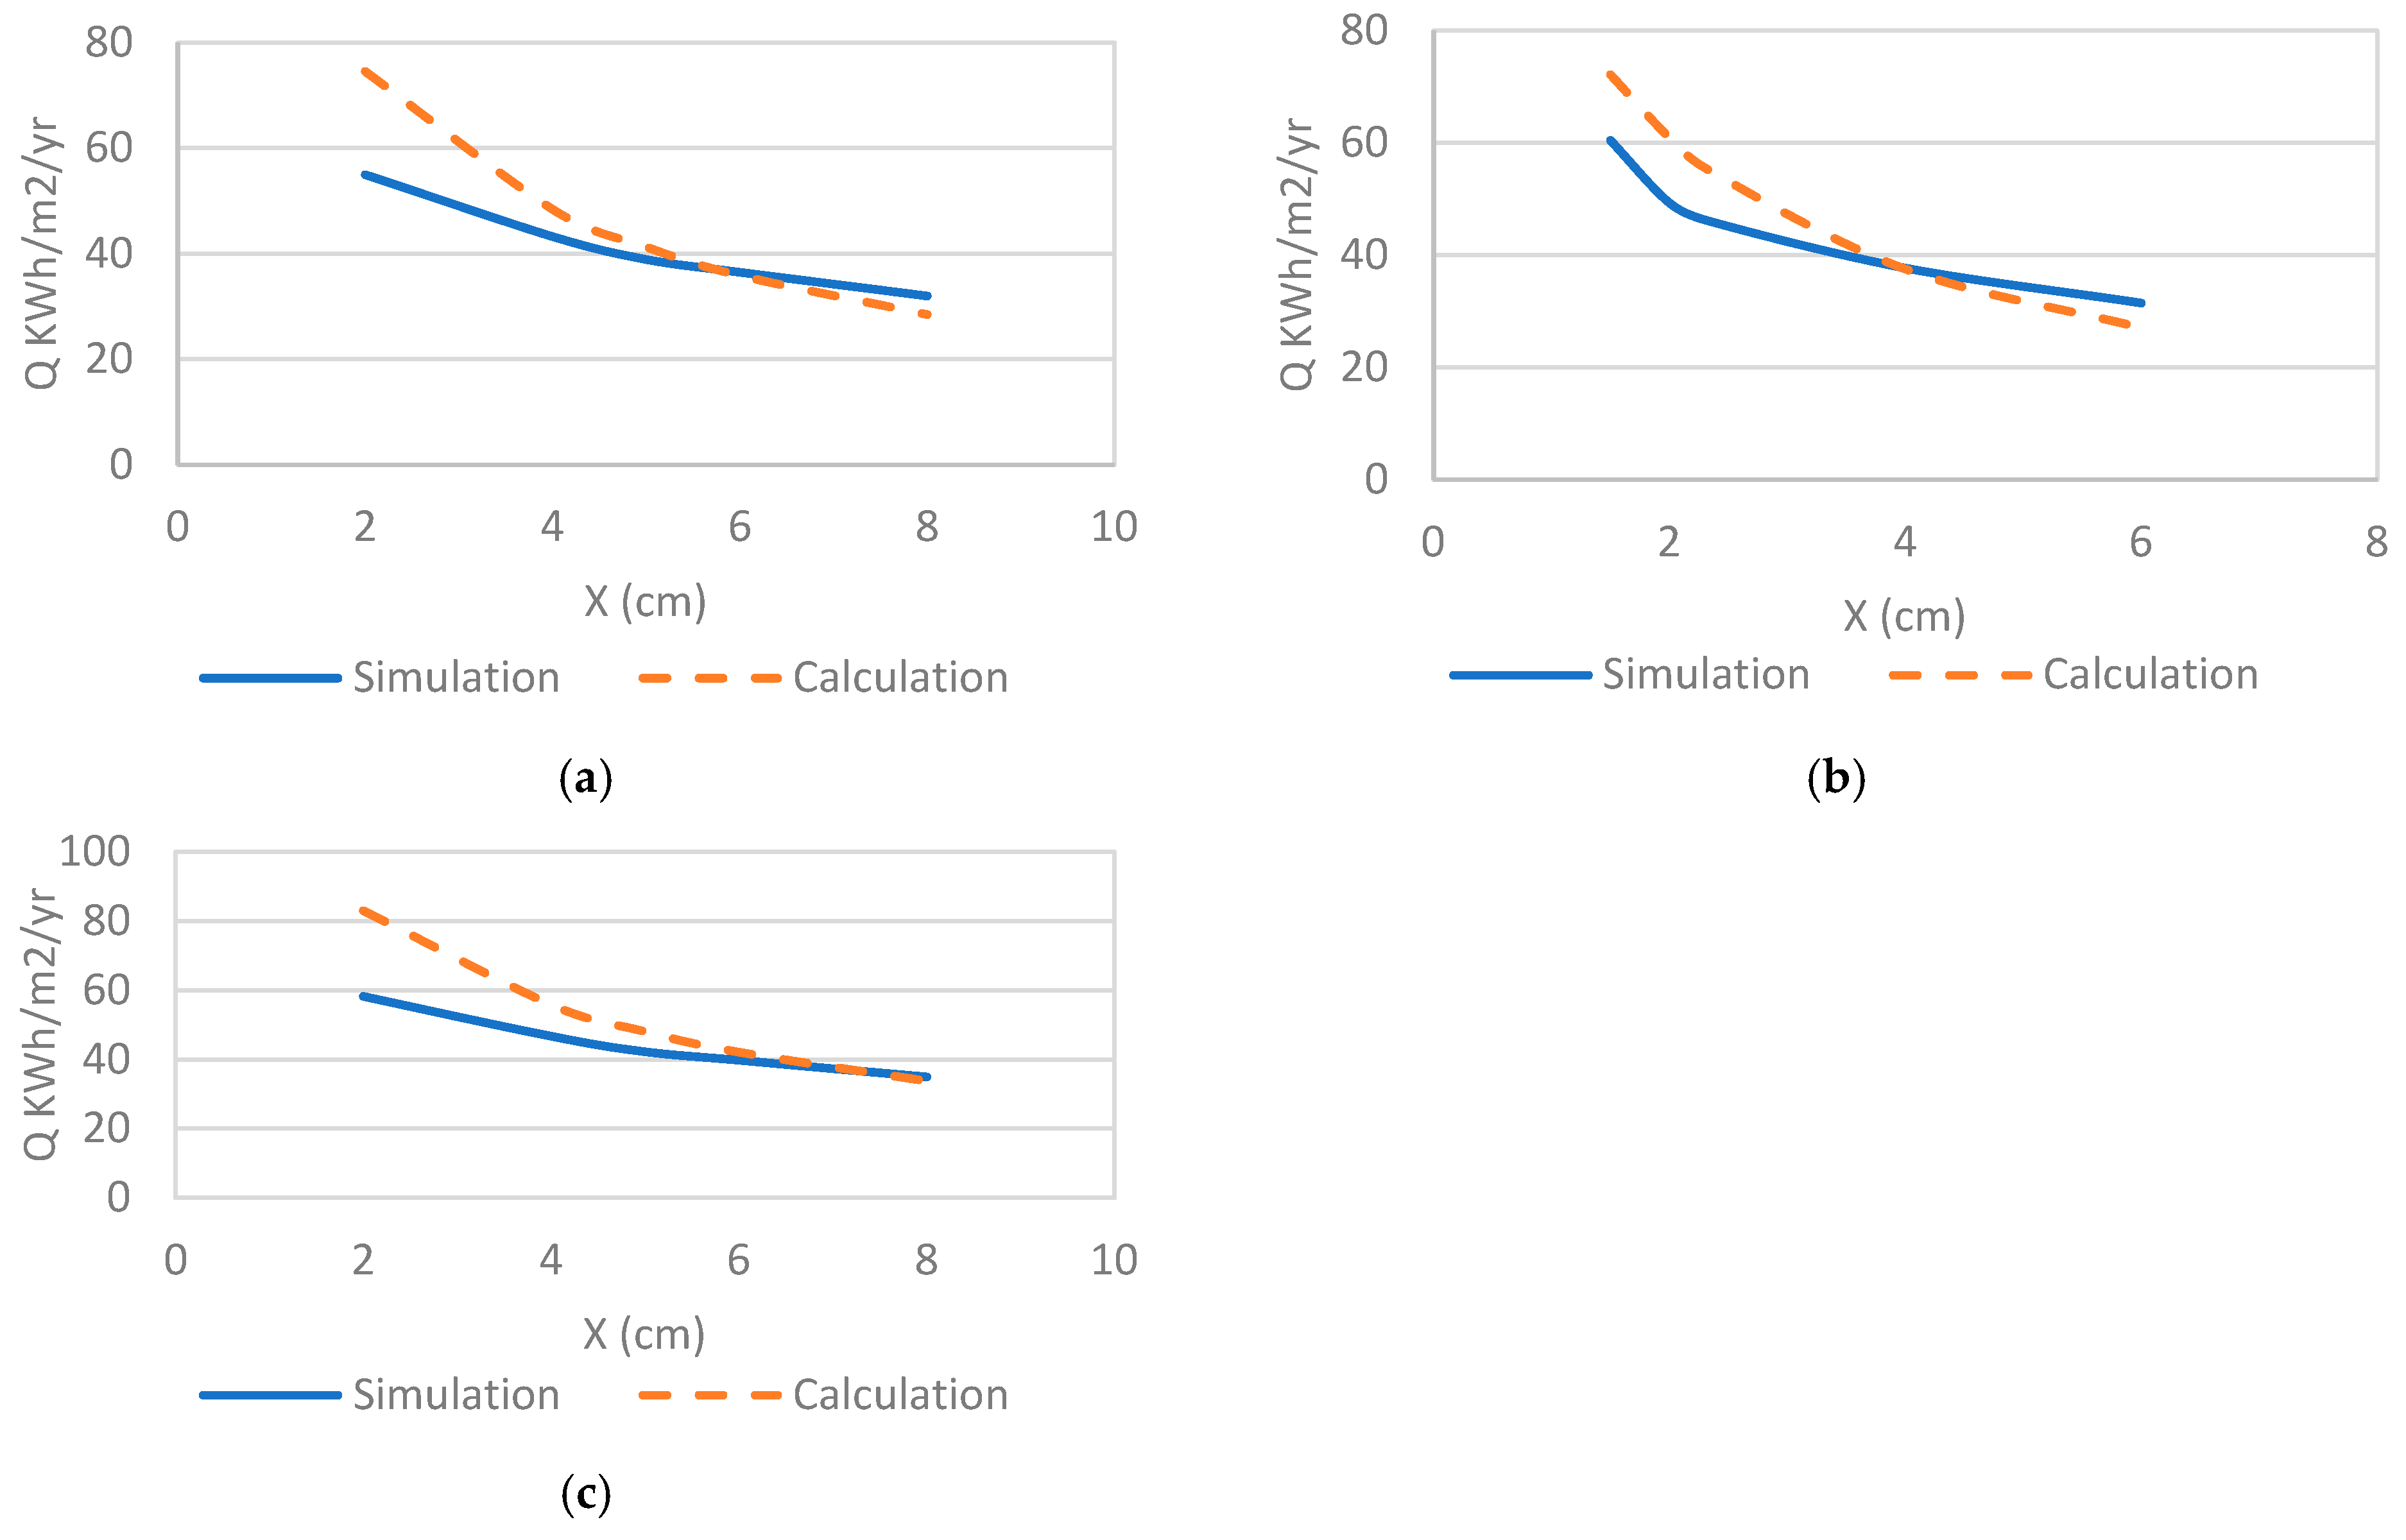
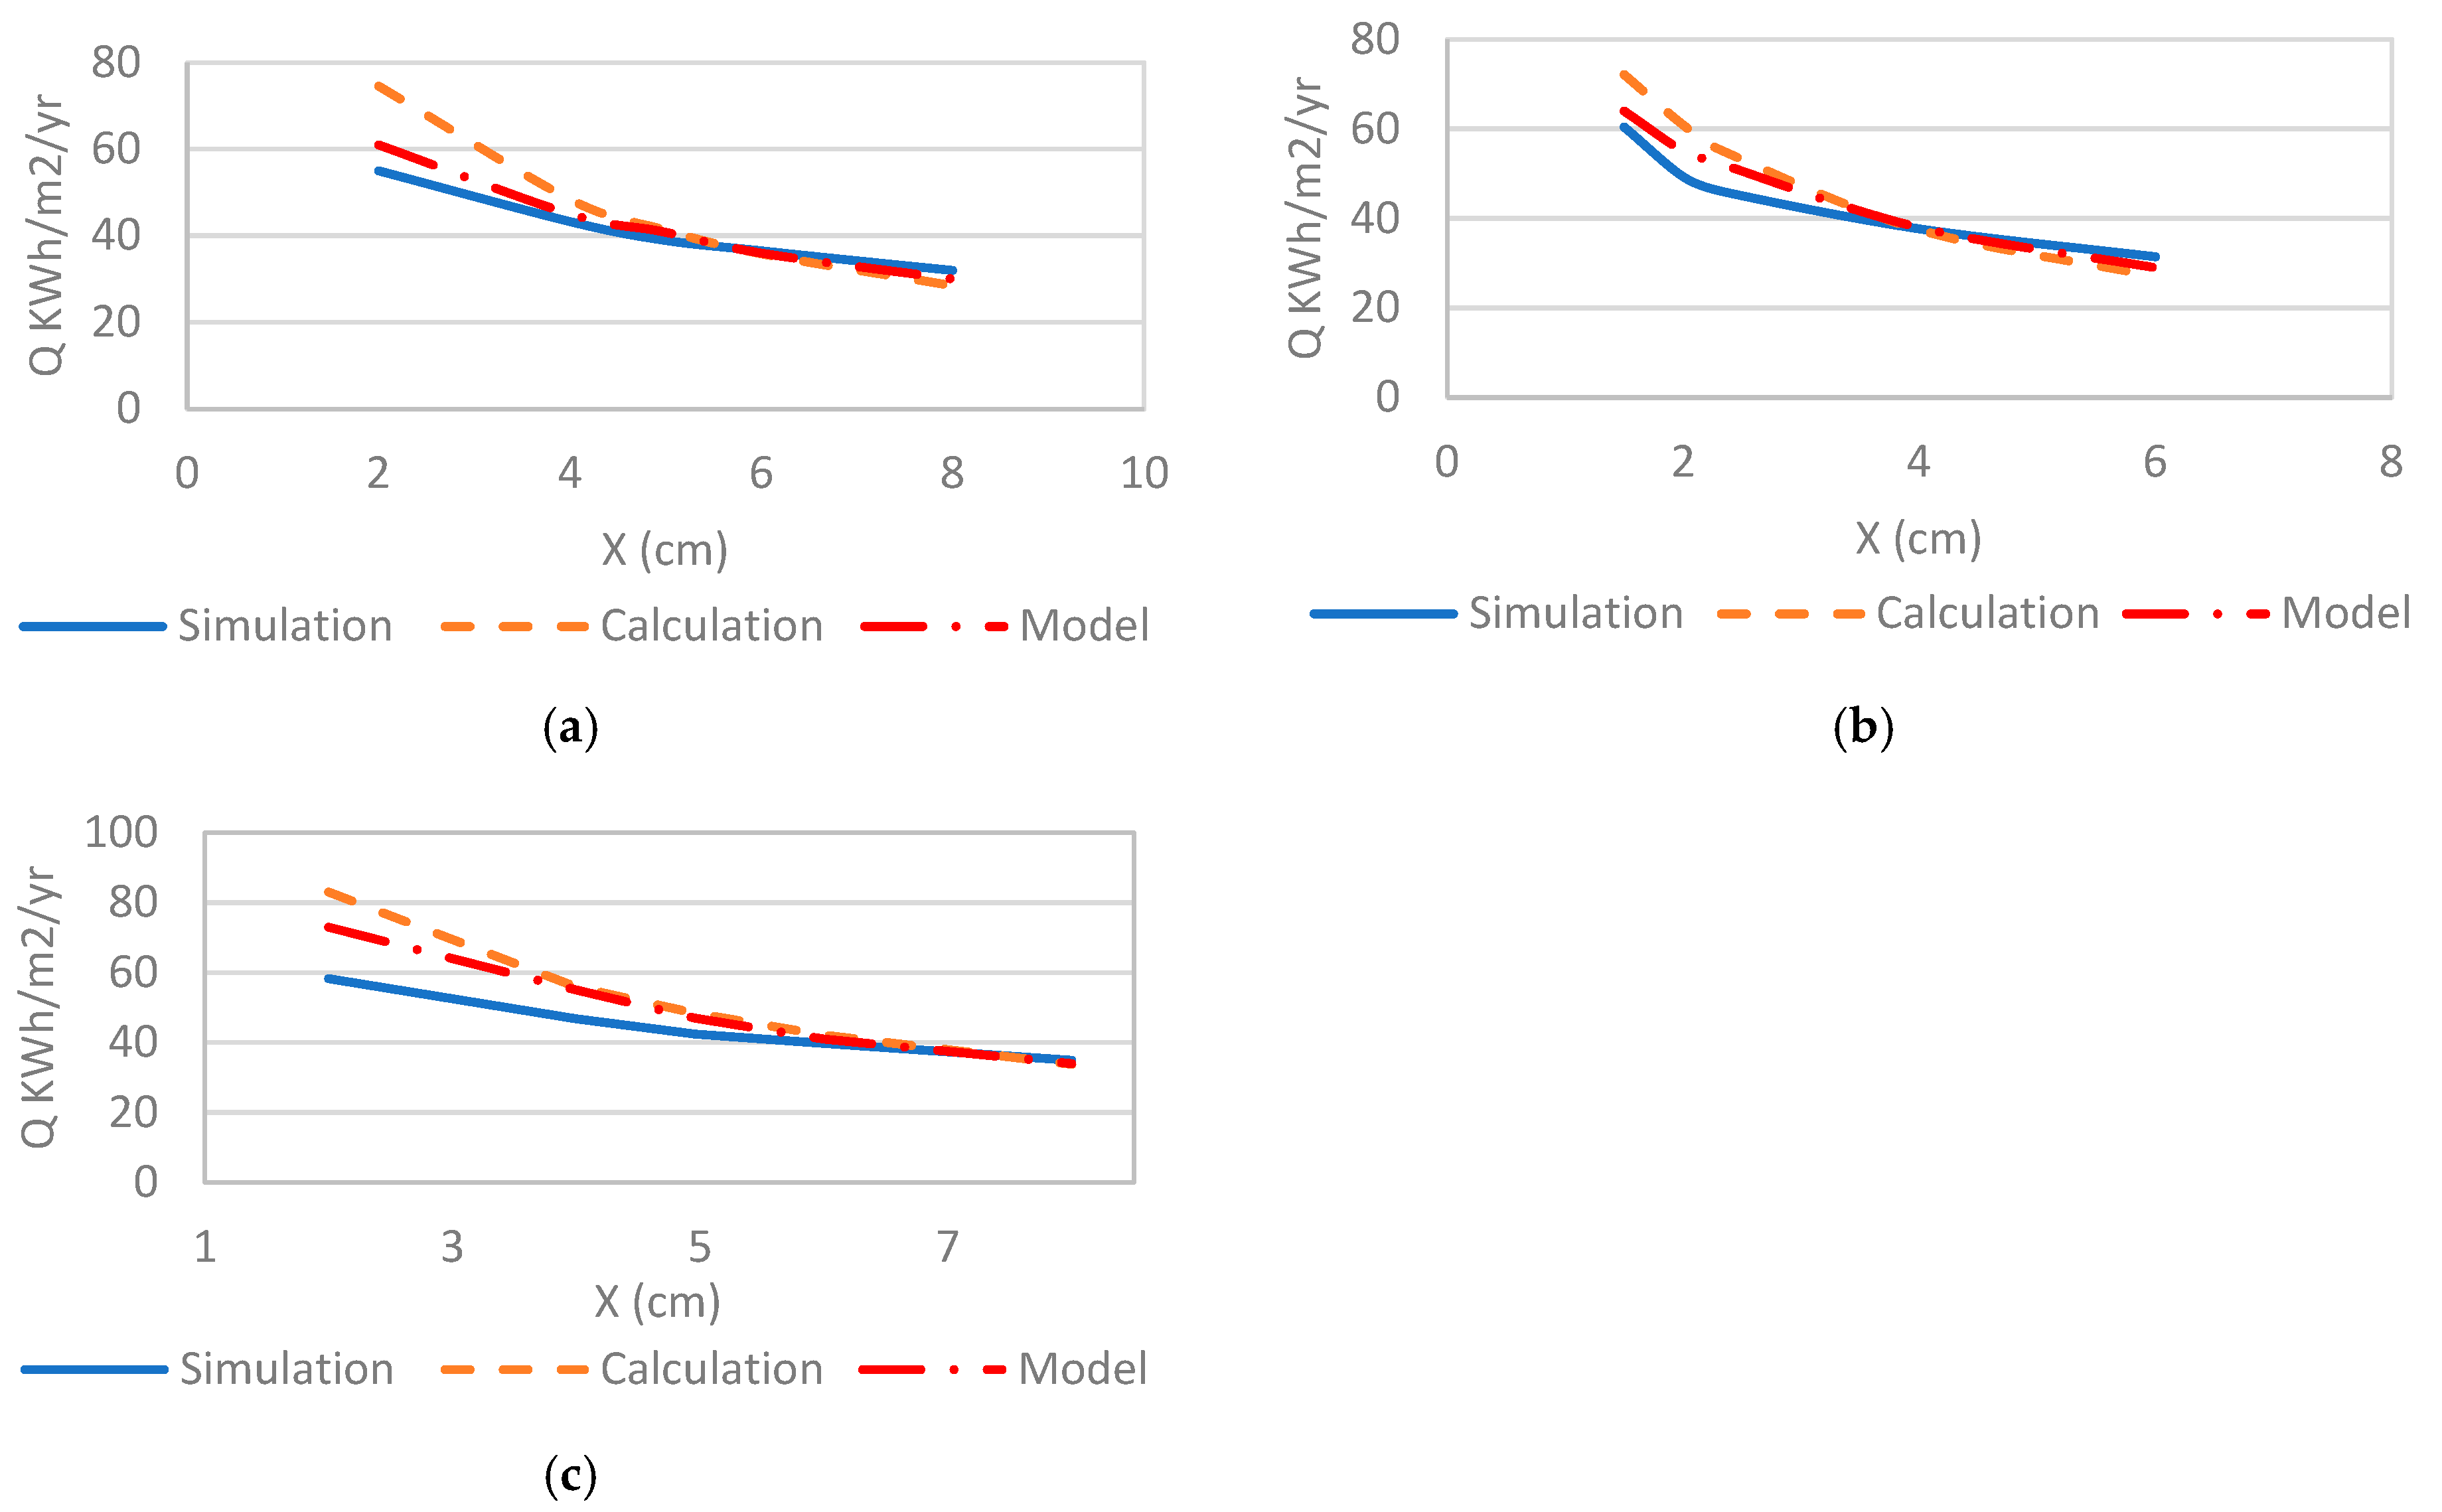
3.1. Simulation and Calculation Results
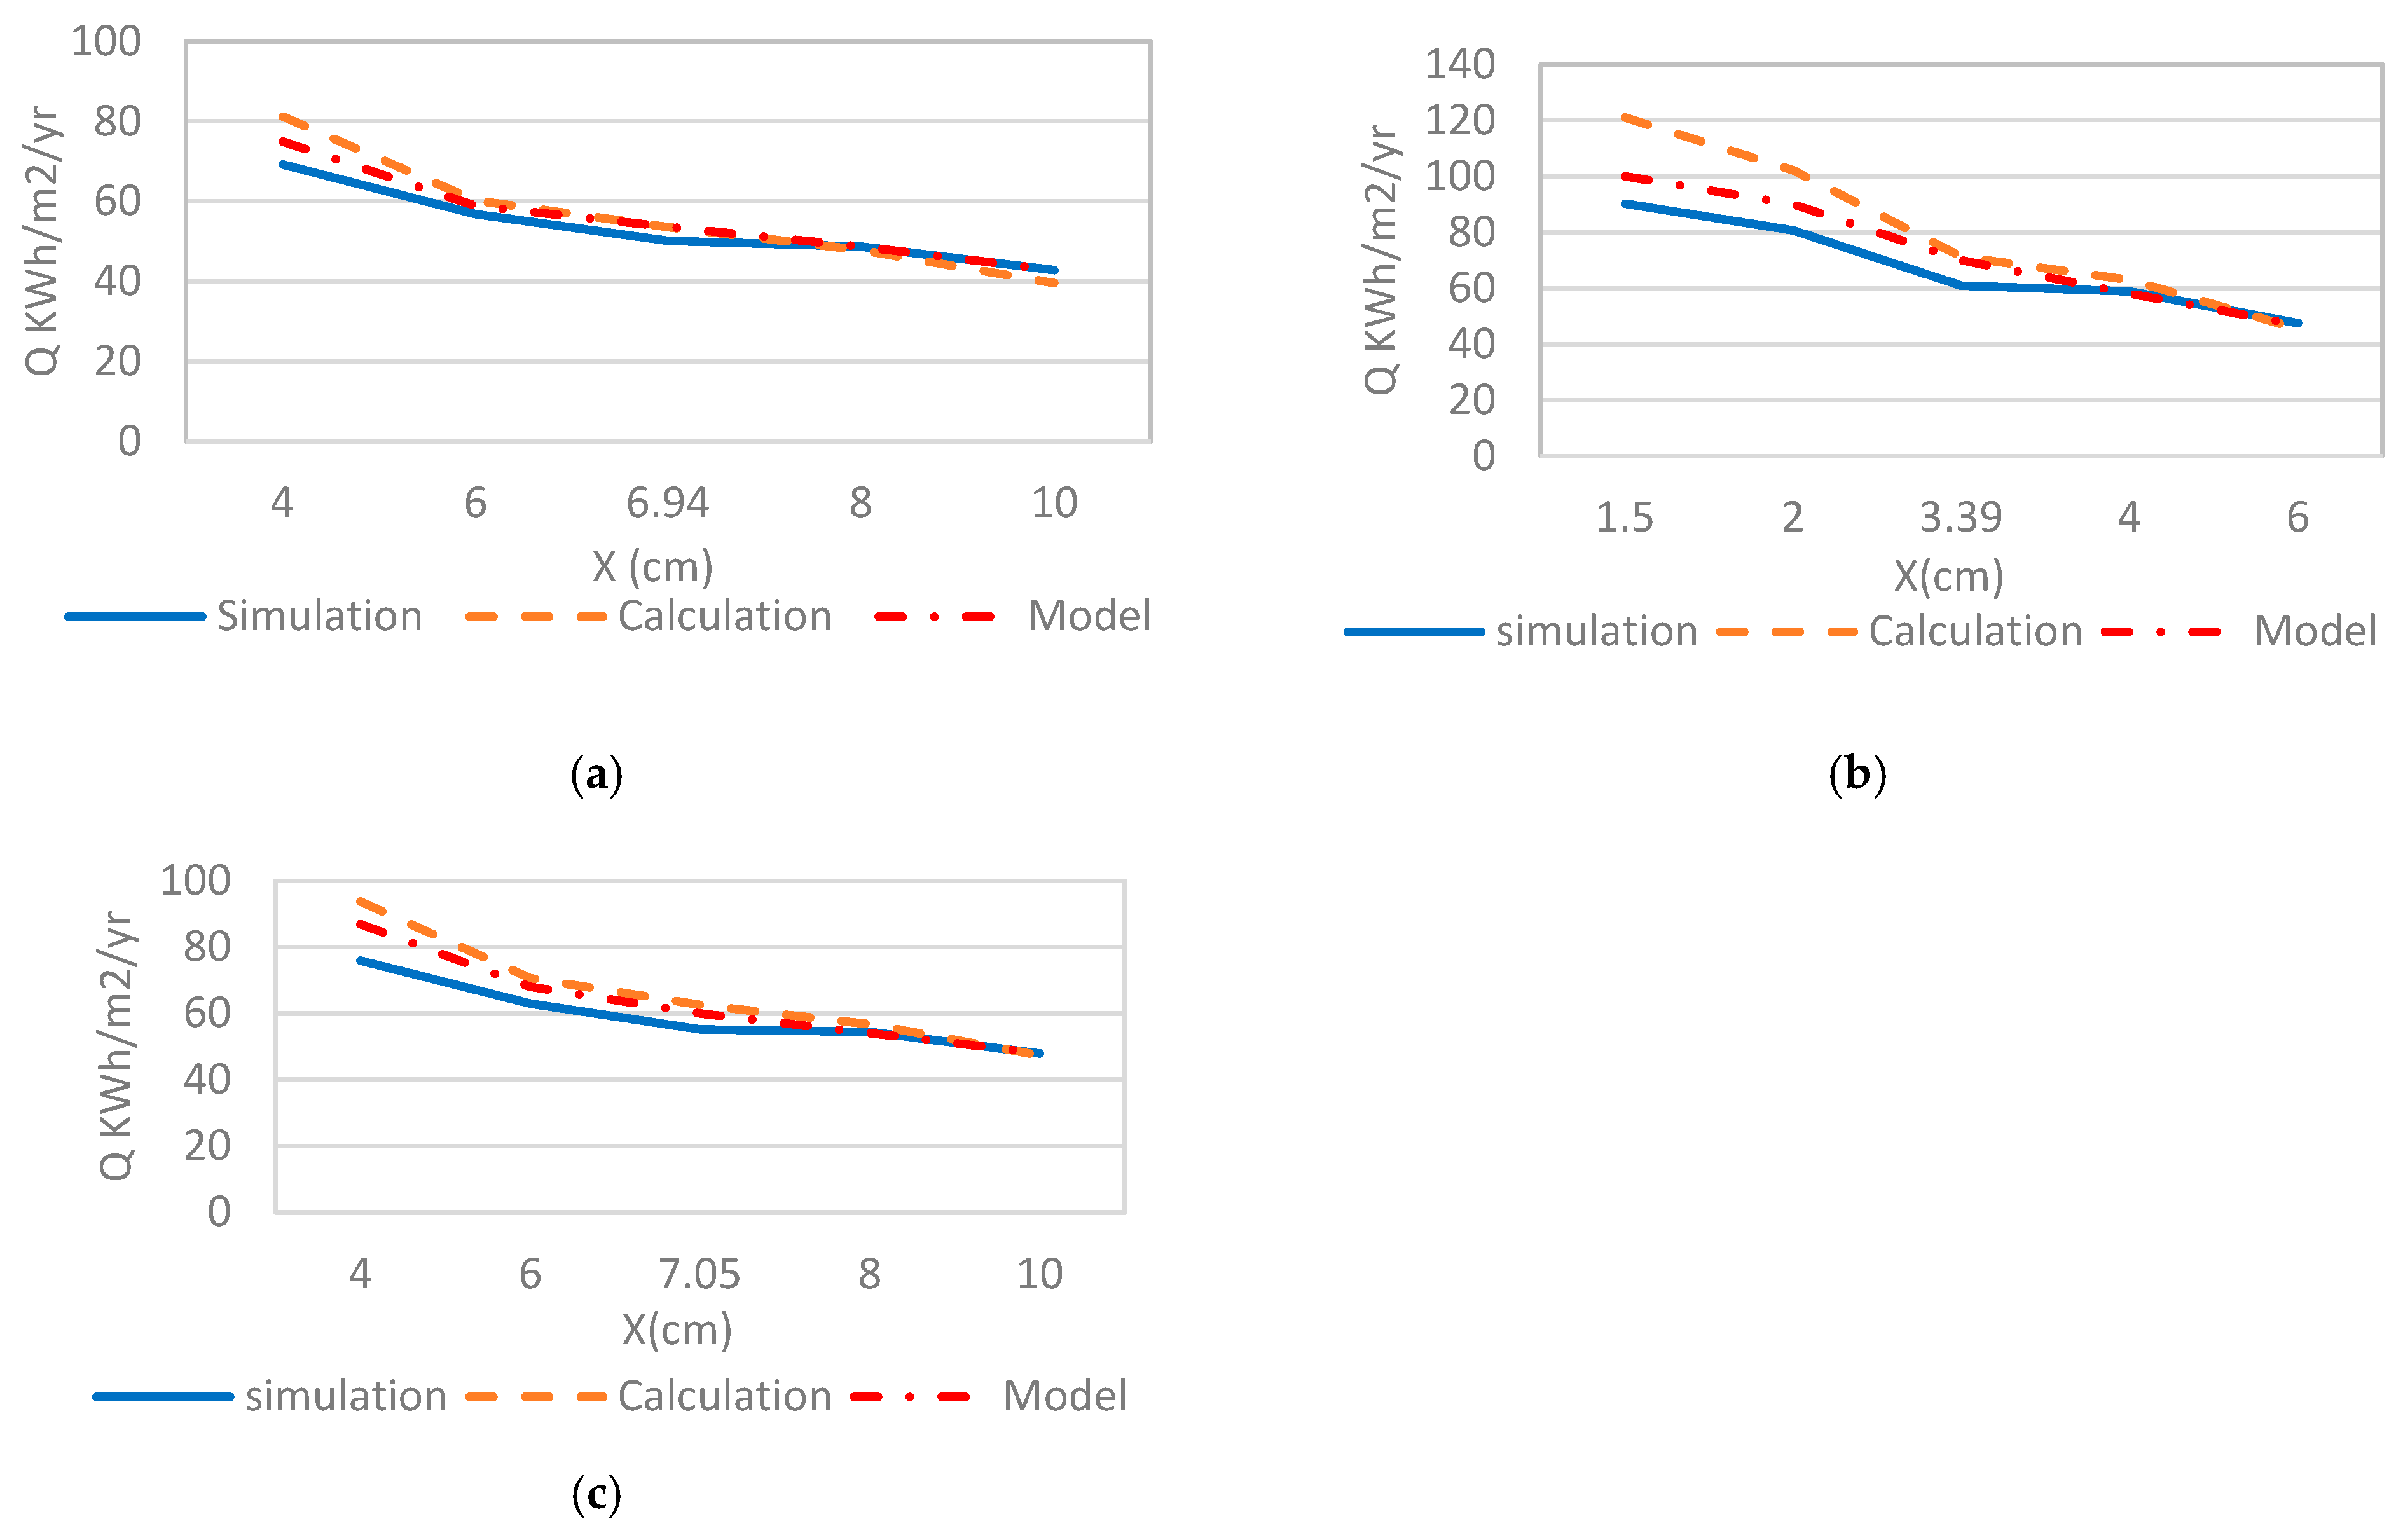
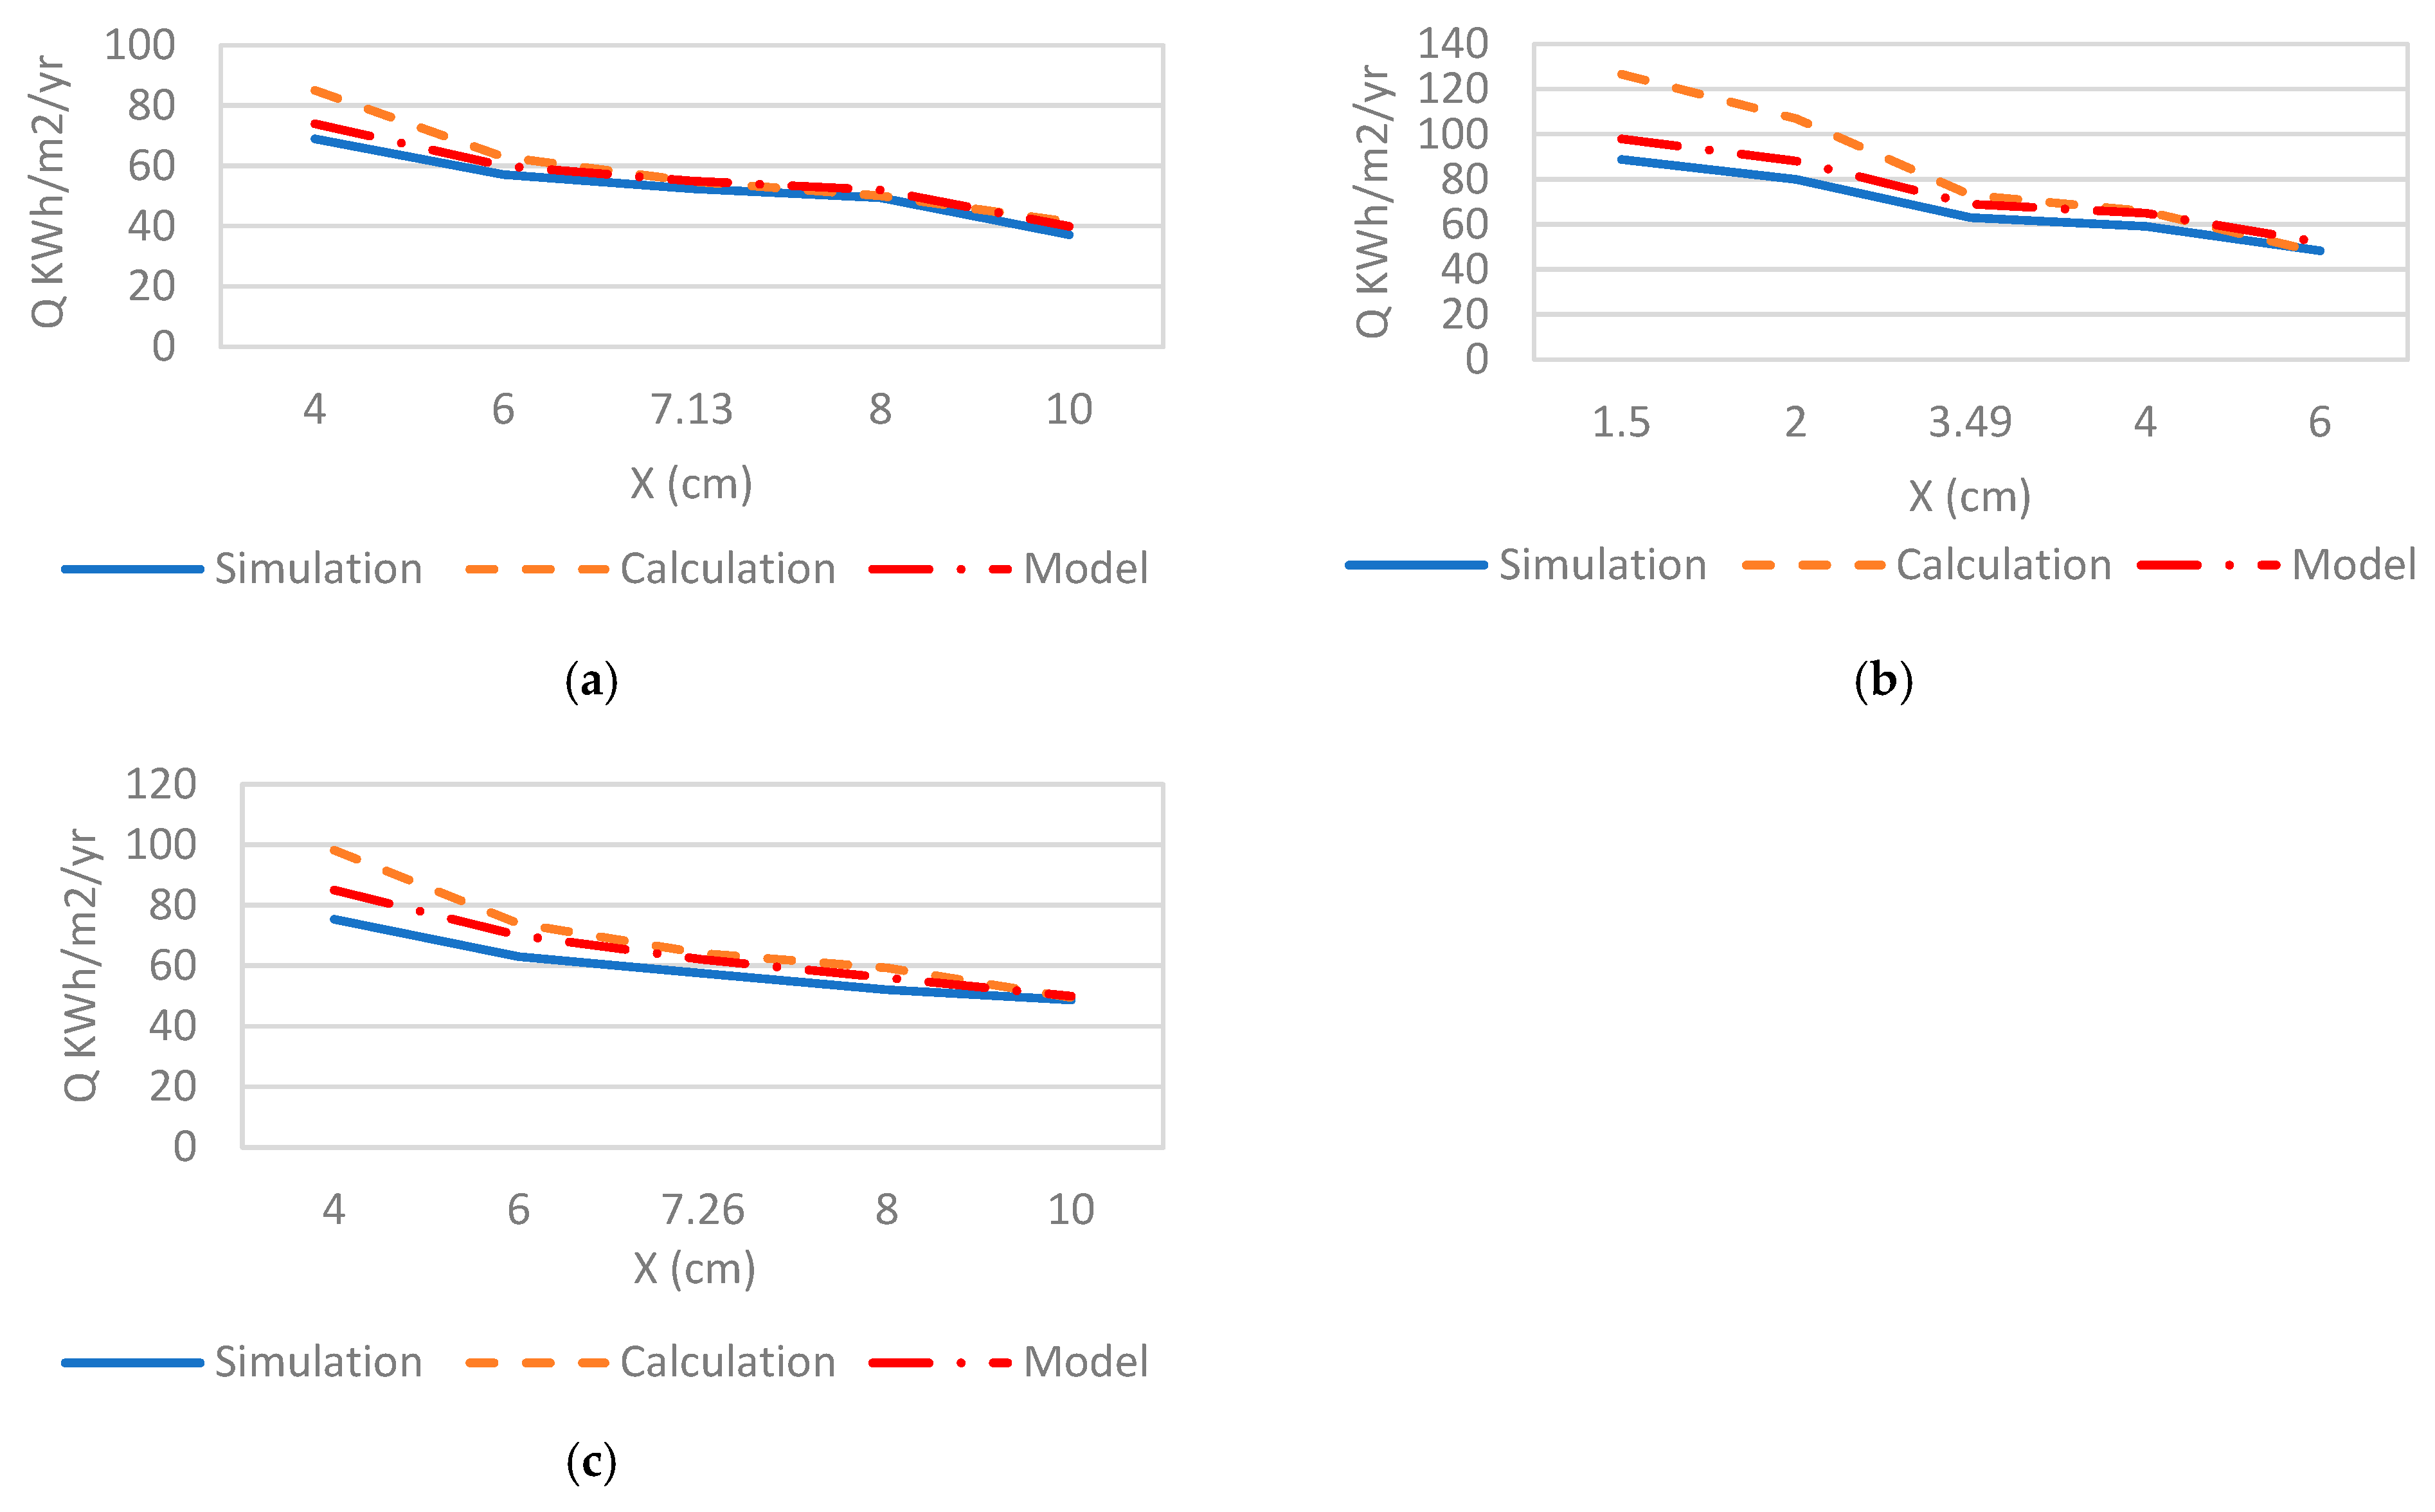
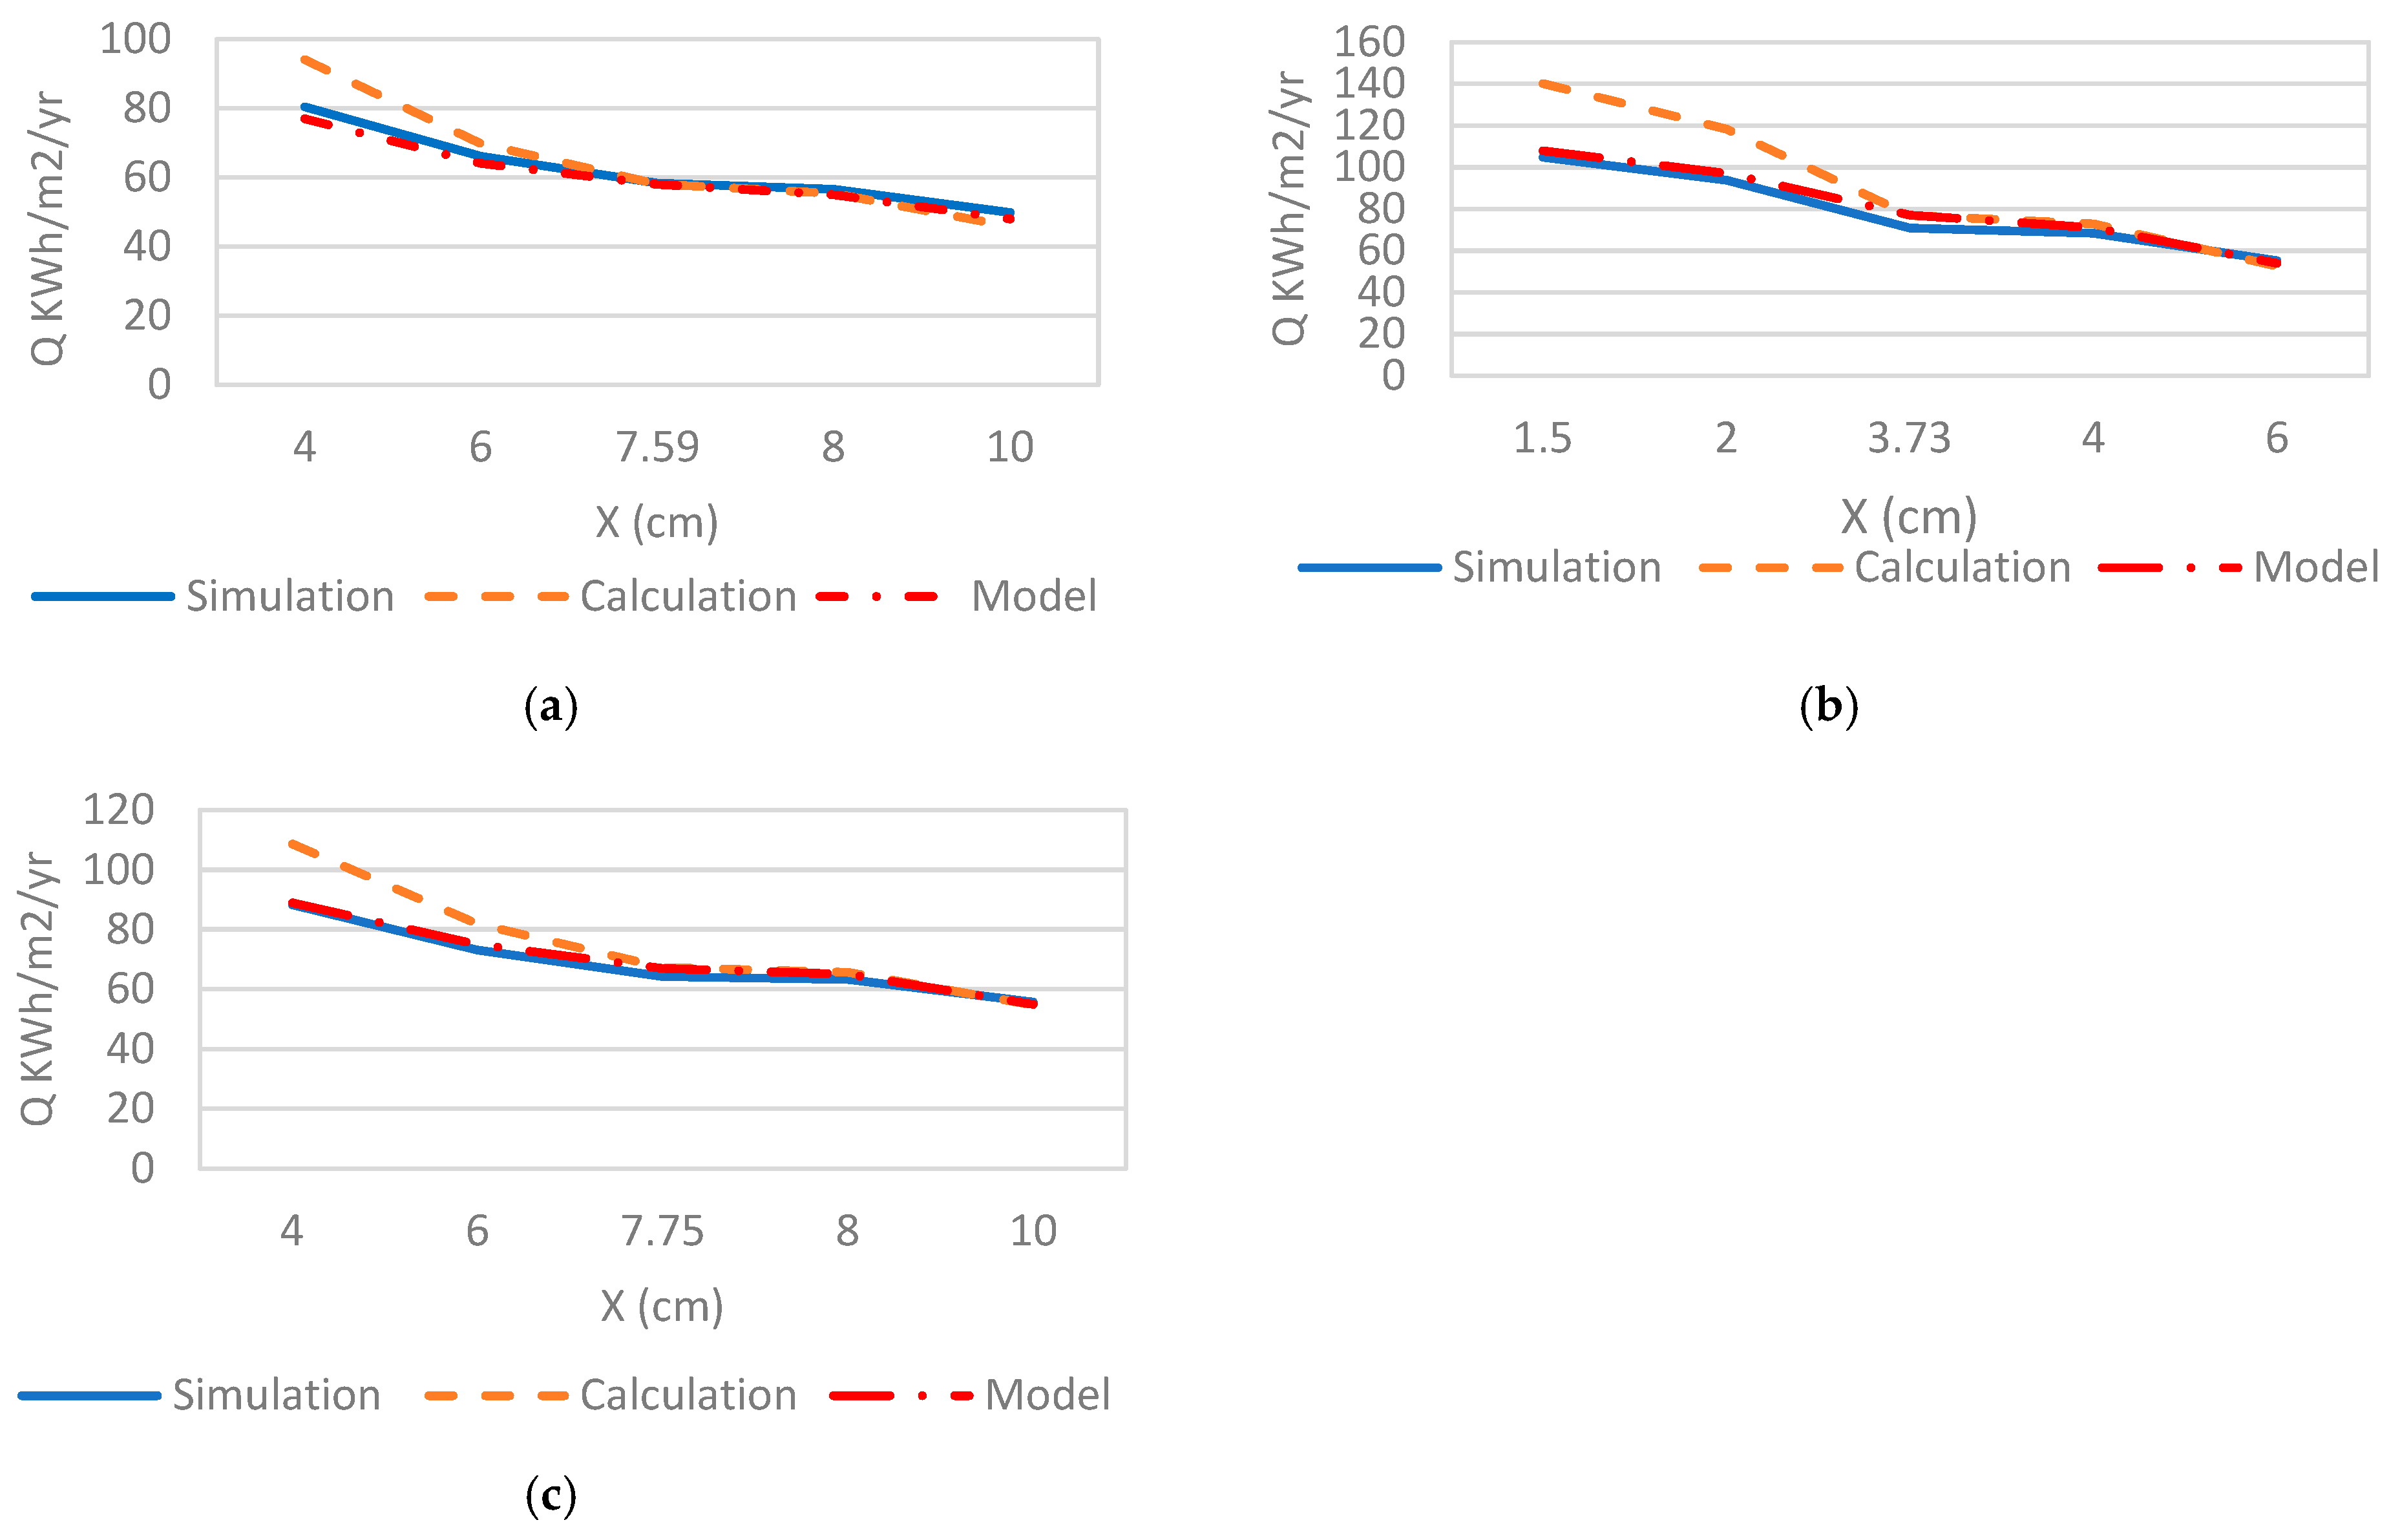
3.2. Adjusted Model
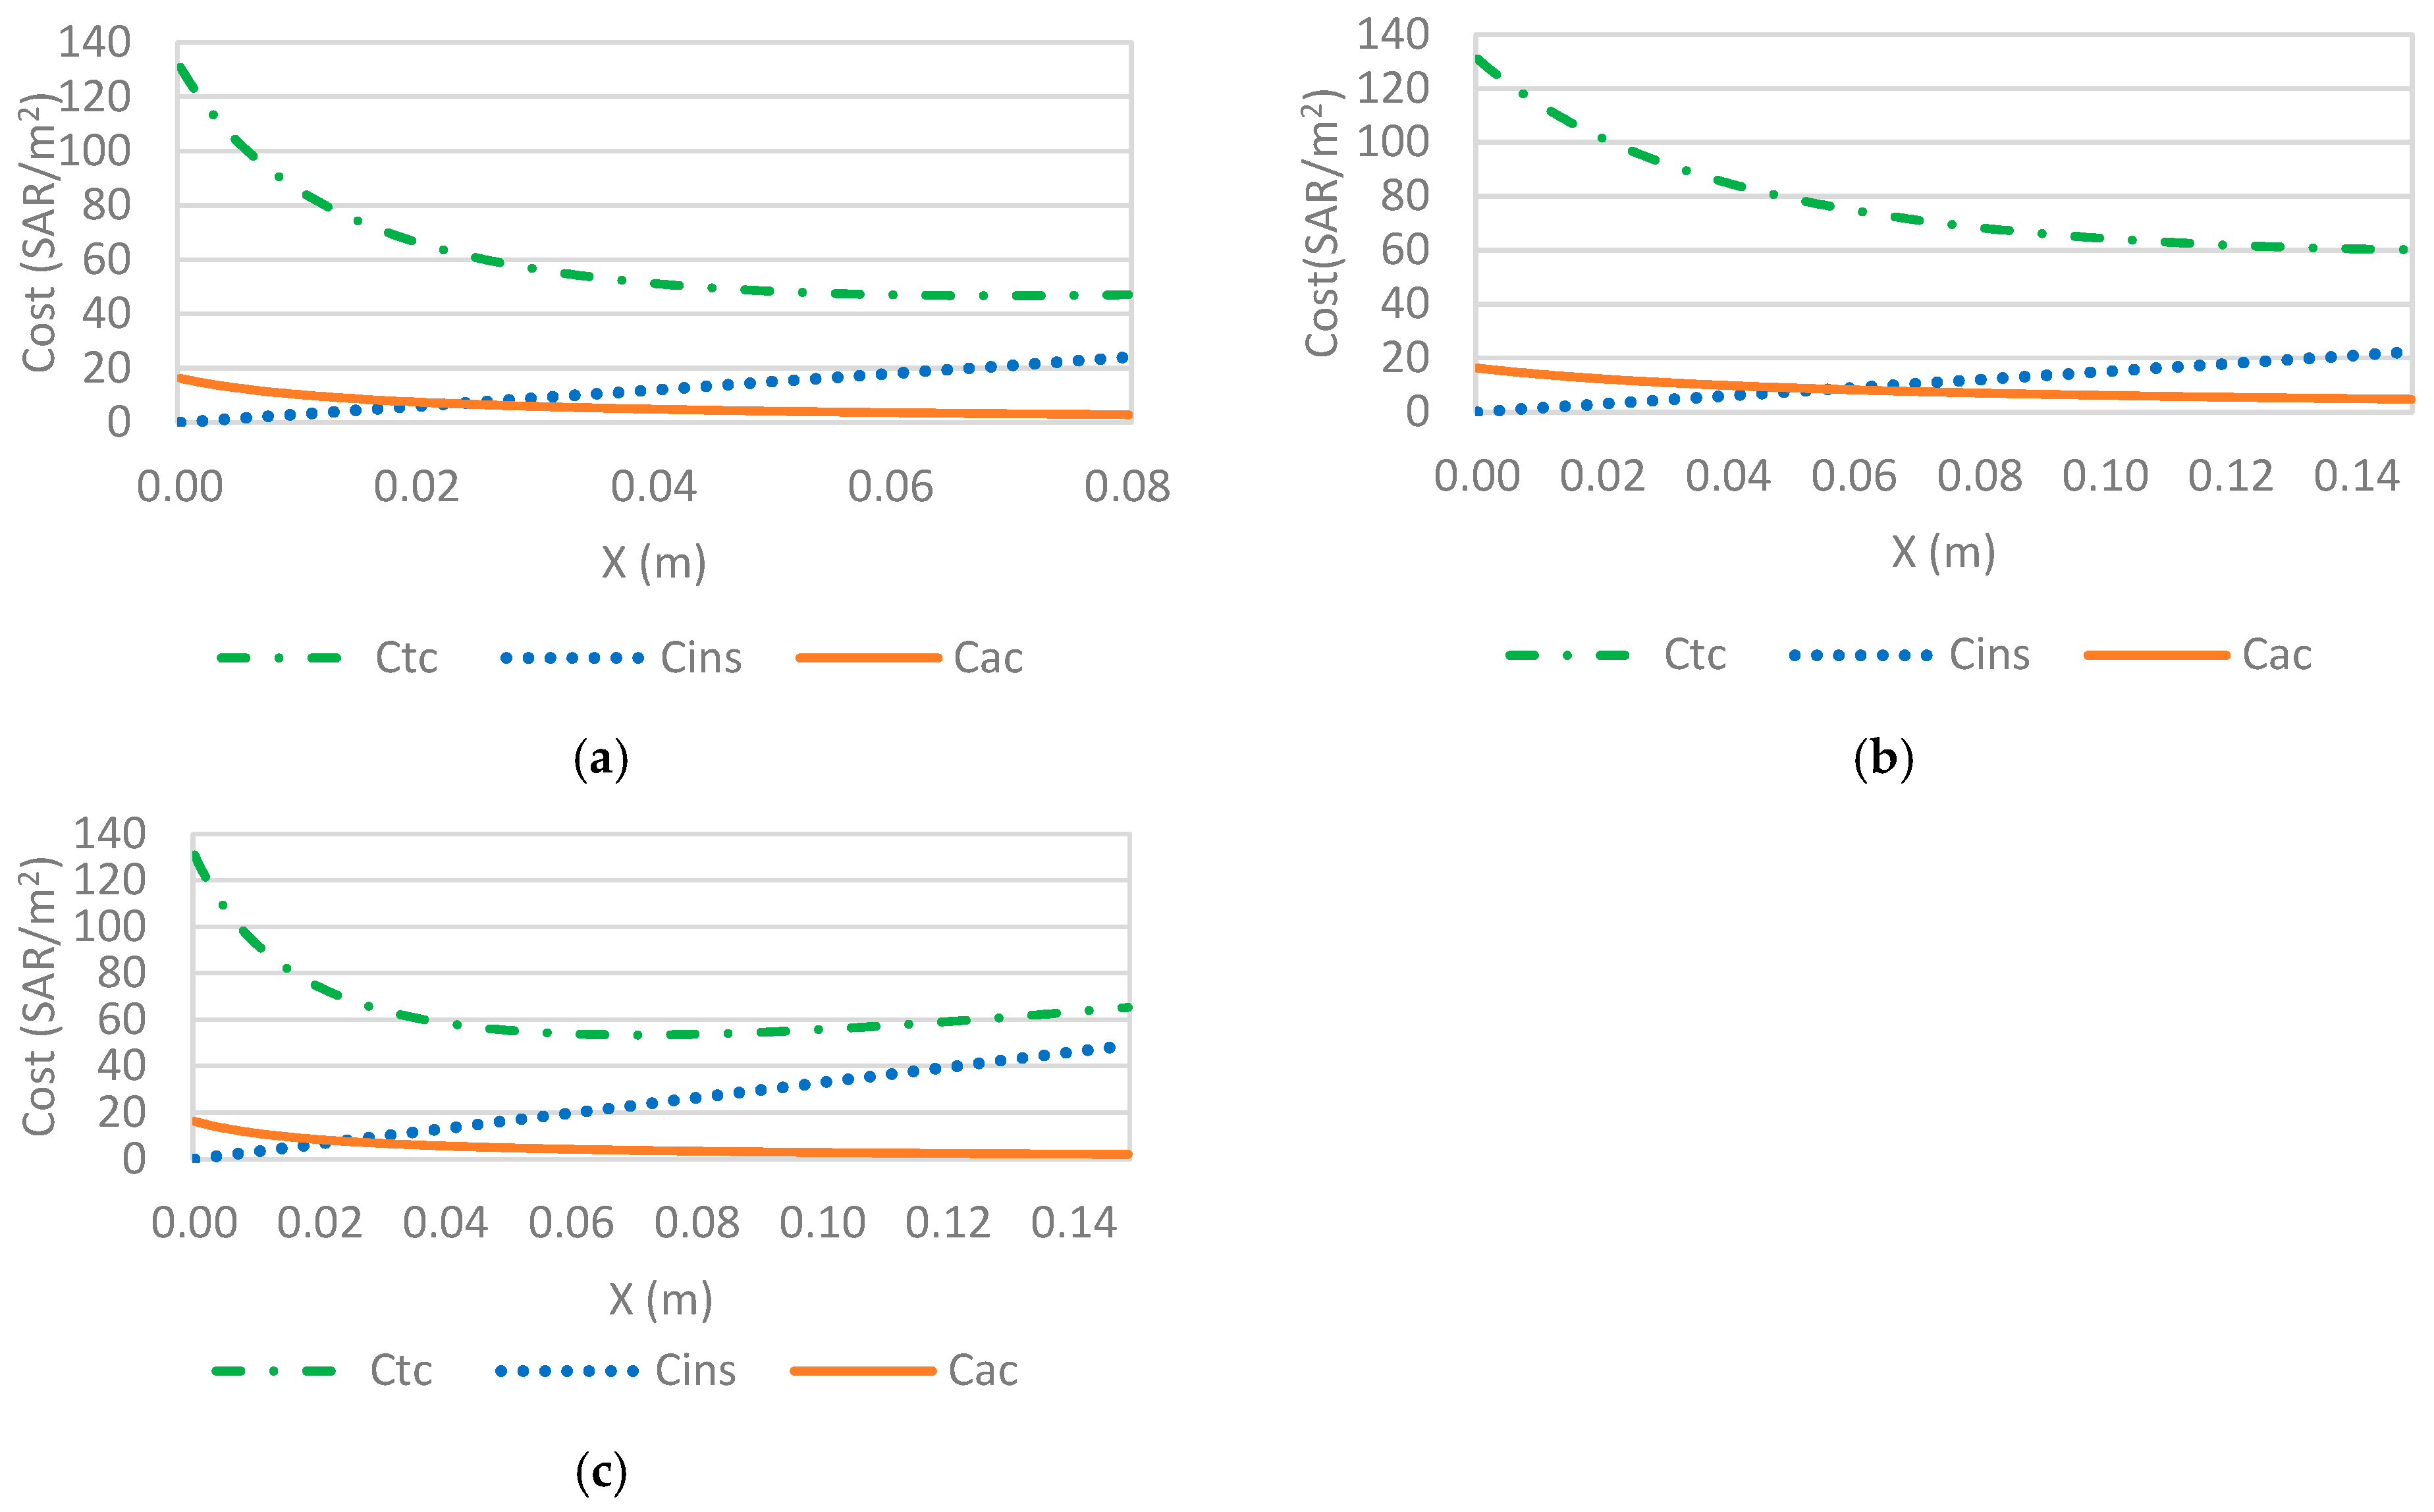
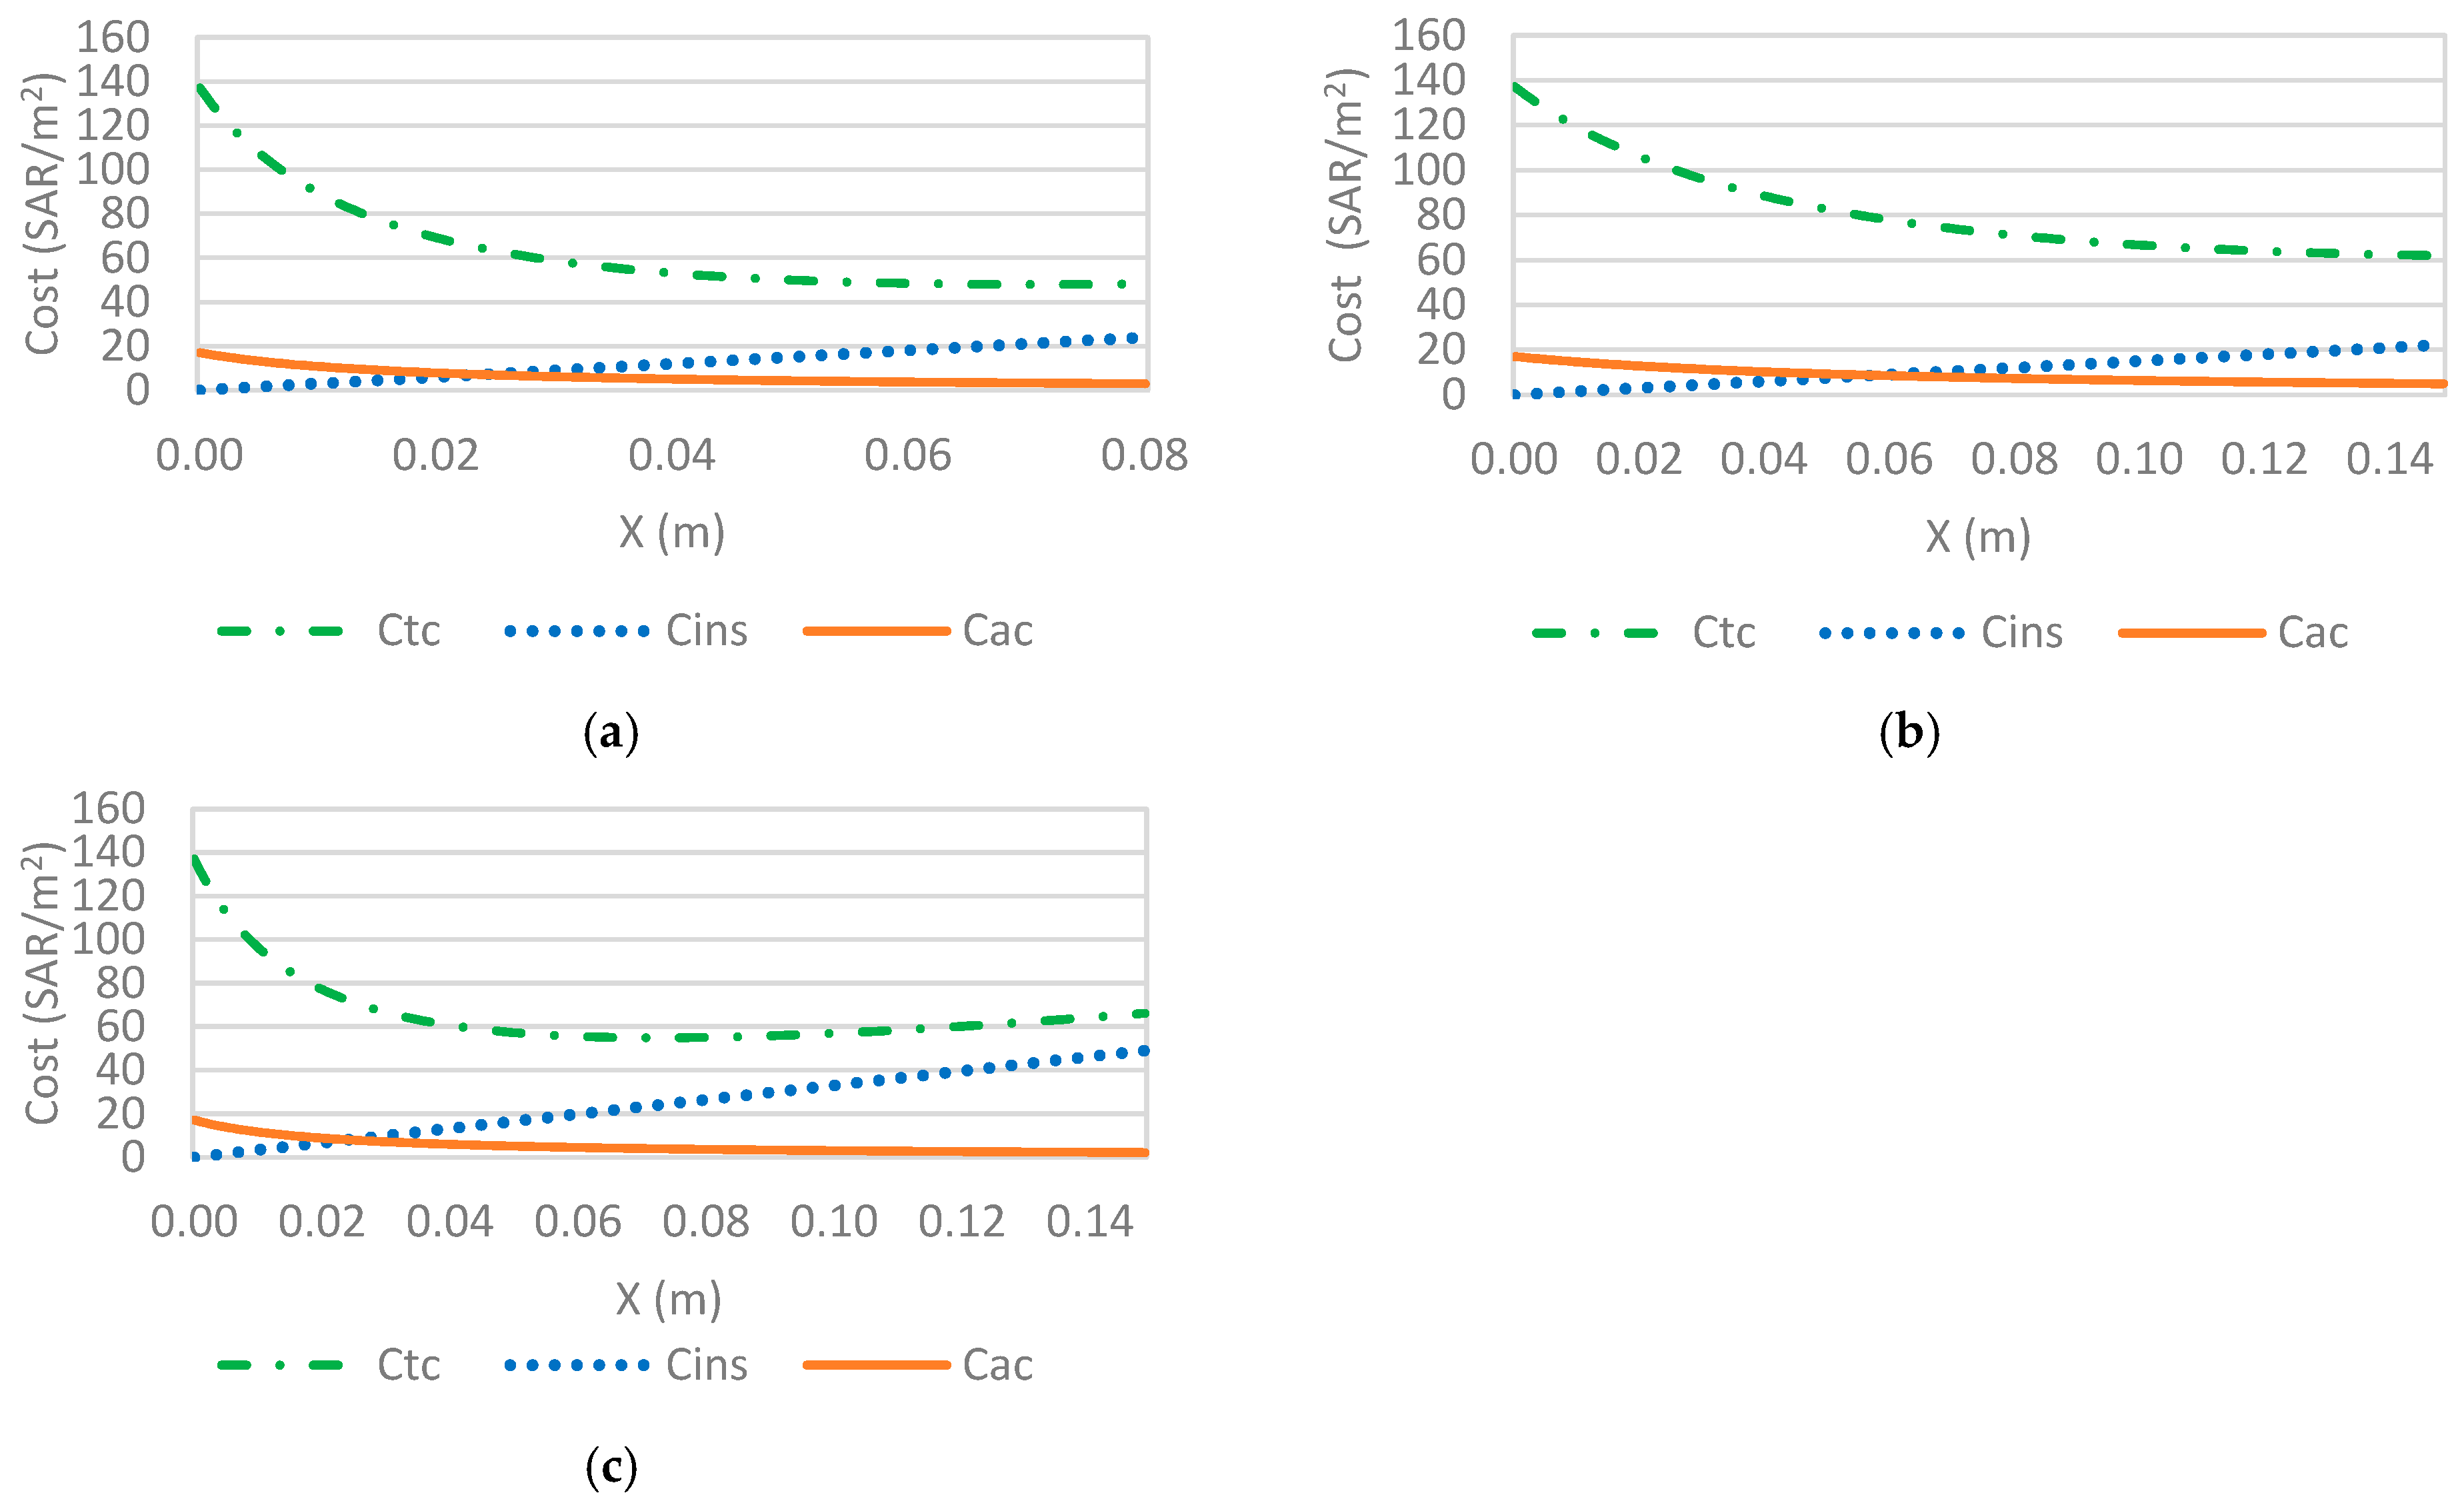
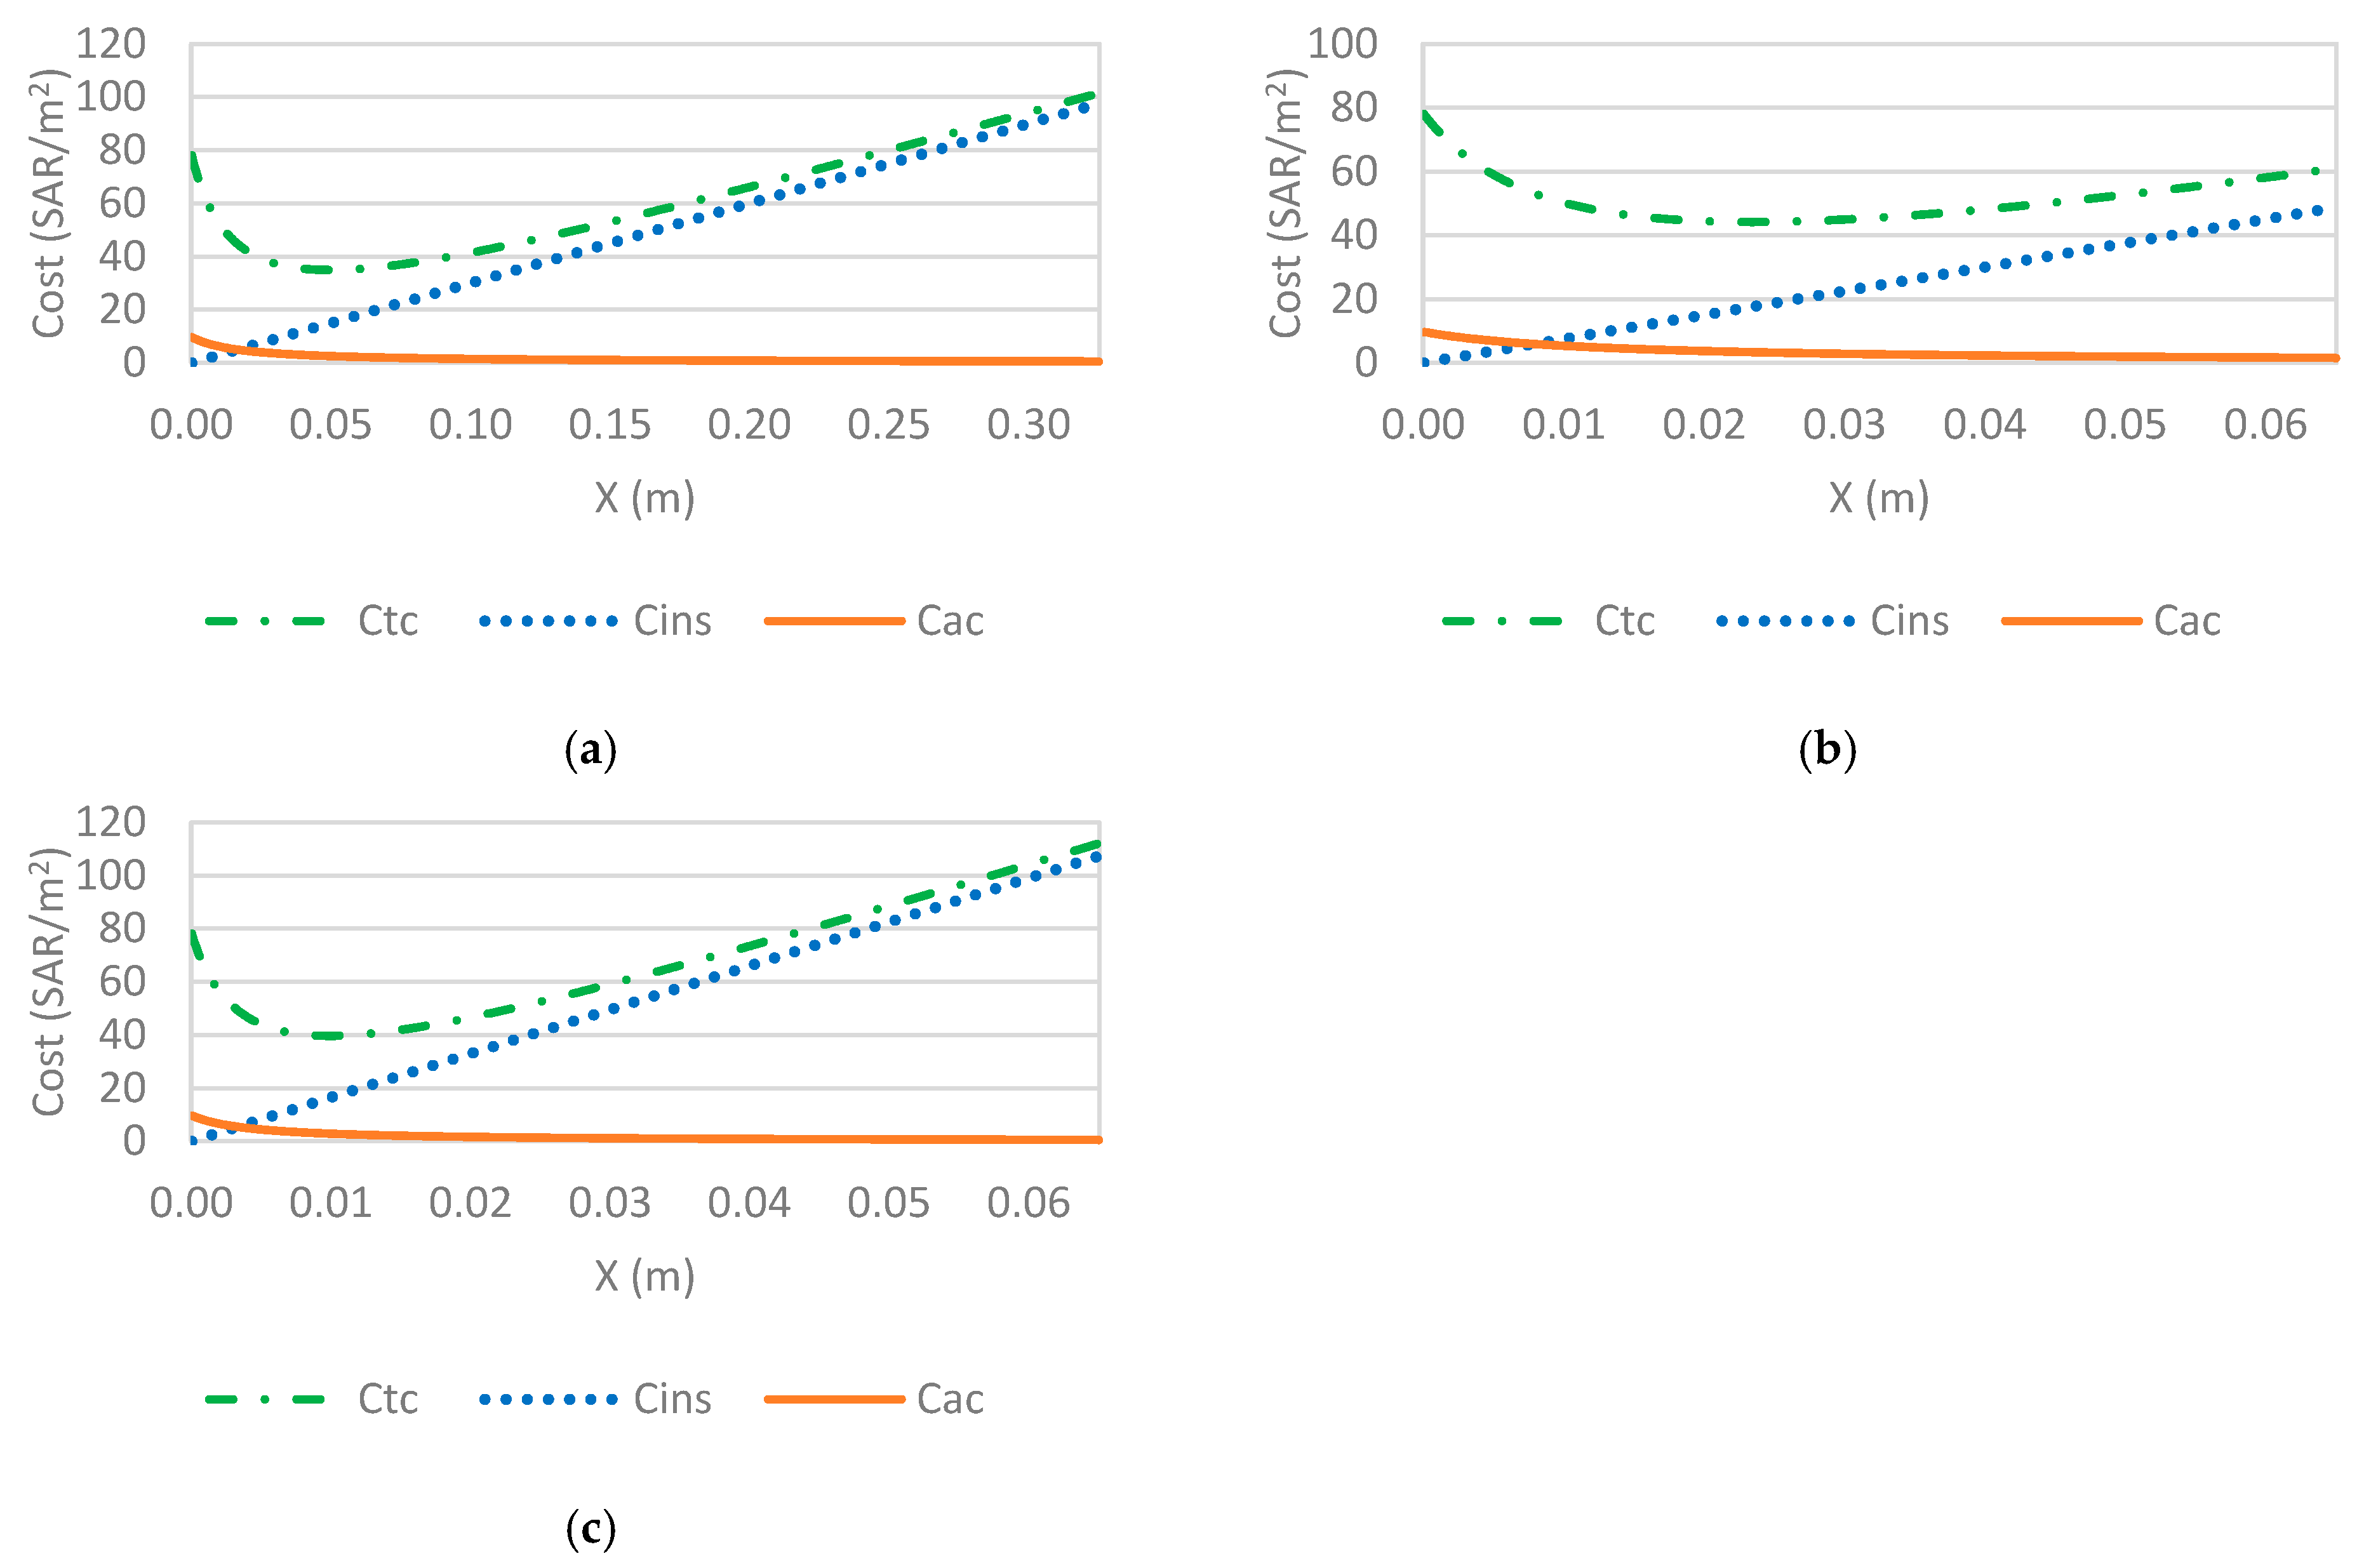
3.3. Optimal Insulation Thickness Results
4. Conclusions
- In all the climatic zones, yearly cooling loads dominate over yearly heating loads. However, heating is absent for Jeddah, while yearly cooling loads are the highest;
- The annual cooling loads proposed in the method are benchmarked against energy simulation;
- Polystyrene gives the lowest total cost (Ct,min) followed by rock wool and polyurethane for all climates. Therefore, polystyrene is the most economical insulation with the shortest payback period. In addition, polyurethane has the lowest thickness among the insulation materials in the five zones;
- The optimal insulation values using molded polystyrene (MP), polyurethane board (PB), and rock wool (RW) as insulation materials were obtained for the five climatic zones of Saudi Arabia. The values of Riyadh, Jeddah, and Dhahran range between 3 and 8 cm, while Guriat and Khamis Mushait, with a moderate climate (i.e., low CDD), range between 2 and 5.5 cm;
- Ct,min, and Xopt values for Dhahran and Riyadh are very close; those for Guriat and Khamis Mushait are almost equal and much smaller. Therefore, the moderate climate of Guriat and Khamis Mushait is much more cost-effective regarding energy consumption;
- Payback periods calculated at Xopt, considering inflation and cost of money, range from about 1 to 3 years, reflecting the high feasibility of applying thermal insulation;
- The study’s findings highlight the significant impact of climatic conditions on the optimal insulation thickness and the corresponding thermal performance metrics, R-value, and U-value. Unlike the Saudi Building Code (SBC 601 and SBC 602), which sets a single standard for maximum U-values and minimum R-values across all regions, our results demonstrate the need for climate-adaptive insulation strategies. The optimal insulation thickness varies considerably between cities, with locations experiencing higher cooling demand requiring thicker insulation to achieve lower U-values. These findings reinforce the necessity of incorporating both economic and climatic considerations when establishing insulation guidelines, ensuring energy-efficient and cost-effective building envelope designs tailored to specific regional conditions. This study provides a more precise methodology for determining the most effective insulation thickness, leading to enhanced energy savings and improved thermal performance in desert climates;
- The effects of thermal bridging, external air film, shading effects, oversimplified thermal boundary conditions, thermal mass, and thermal lag were not explicitly considered in the optimization process. Additionally, the integration of other passive cooling strategies, such as shading devices, natural night ventilation, and roof overhangs, was beyond the scope of this study but holds significant potential for enhancing cooling efficiency. Future research should incorporate these parameters alongside insulation optimization for a more comprehensive evaluation of building energy performance, particularly under dynamic thermal conditions where these factors significantly impact heat transfer and overall energy savings.
Author Contributions
Funding
Institutional Review Board Statement
Informed Consent Statement
Data Availability Statement
Acknowledgments
Conflicts of Interest
Nomenclature
| C | Cost (SAR) |
| Cy | Cost of insulation (SAR/m3) |
| Ce | Cost of electricity (SAR/kWh) |
| CA,C | Annual cost of consumed energy (SAR/m2) |
| CC | Pre-insulation cooling energy cost (SAR/m2) |
| Ct | Total cost of consumed energy and insulation costs (SAR/m2) |
| COP | Coefficient of performance of HVAC system (Dimensionless) |
| Efficiency of the combustion system (Dimensionless) | |
| Annual heat loss and gain (kWh/m2) | |
| Humidity-adjusted annual heat loss and gain | |
| Annual cooling energy (kWh/m2) | |
| k | Thermal conductivity (W/m.K) |
| R | Thermal resistance (K.m2/W) |
| Ropt | Thermal resistance for the optimum insulation thickness (m2.K/W) |
| U | Over all heat transfer coefficient (W/m2.K) |
| Uopt | Overall heat transfer coefficient for the optimum insulation thickness (W/m2.K) |
| X | Layer thickness (m) |
| Xins | Insulation thickness (m) |
| N | Building lifetime (years) |
| PP | Payback period (years) |
| Xopt | Optimum insulation thickness (m) |
| RW | Wall layers heat transfer resistance (K.m2/W) |
| Ro, Ri | Heat transfer coefficients of the outside and inside environments (K.m2/W) |
| PVF | Present Value Factor (dimensionless) |
| qyear | Yearly transmission load (kWh/m2.yr) |
| q | Heat transfer rate (W/m2) |
| i, f | Interest and inflation rates (%) |
| r | Actual interest rate |
| SAR | Saudi Riyal (1 US dollar = 3.75 SAR) |
| T | Temperature (°C) |
| CDD | Cooling Degree Days (°C-day) |
| HDD | Heating Degree Days (°C-day) |
| Ayear,C | Annual total net savings for cooling buildings (SAR/m2) |
| To | Daily mean outdoor air temperature (°C) |
| Tb | Base temperature (°C) |
| AH | Average annual humidity (%) |
References
- Asif, M. Correction to: Energy and Environmental Security in Developing Countries. In Advanced Sciences and Technologies for Security Applications; Masys, A.J., Ed.; Springer Nature: Cham, Switzerland, 2021; pp. 571–586. [Google Scholar] [CrossRef]
- Zhangabay, N.; Tagybayev, A.; Utelbayeva, A.; Buganova, S.; Tolganbayev, A.; Tulesheva, G.; Jumabayev, A.; Kolesnikov, A.; Kambarov, M.; Imanaliyev, K.; et al. Analysis of the influence of thermal insulation material on the thermal resistance of new facade structures with horizontal air channels. Case Stud. Constr. Mater. 2023, 18, e02026. [Google Scholar] [CrossRef]
- Kaynakli, O. A review of the economical and optimum thermal insulation thickness for building applications. Renew. Sustain. Energy Rev. 2012, 16, 415–425. [Google Scholar] [CrossRef]
- Wang, H.; Chen, W.; Shi, J. Low carbon transition of global building sector under 2- and 1.5-degree targets. Appl. Energy 2018, 222, 148–157. [Google Scholar] [CrossRef]
- IEA. World Energy Outlook 2019, IEA, Paris. 2019. Available online: https://www.iea.org/reports/world-energy-outlook-2019 (accessed on 1 December 2024).
- Ahmed, W.; Asif, M.; Alrashed, F. Application of building performance simulation to design energy-efficient homes: Case study from Saudi Arabia. Sustainability 2019, 11, 6408. [Google Scholar] [CrossRef]
- Abdul Mujeebu, M.; Alshamrani, O.S. Prospects of energy conservation and management in buildings—The Saudi Arabian scenario versus global trends. Renew. Sustain. Energy Rev. 2016, 58, 1647–1663. [Google Scholar] [CrossRef]
- Al-Homoud, M.S.; Krarti, M. Energy efficiency of residential buildings in the kingdom of Saudi Arabia: Review of status and future roadmap. J. Build. Eng. 2021, 36, 102143. [Google Scholar] [CrossRef]
- Ahmed, W.; Asif, M. BIM-based techno-economic assessment of energy retrofitting residential buildings in hot humid climate. Energy Build. 2020, 227, 110406. [Google Scholar] [CrossRef]
- Krarti, M.; Howarth, N. Transitioning to high efficiency air conditioning in Saudi Arabia: A benefit cost analysis for residential buildings. J. Build. Eng. 2020, 31, 101457. [Google Scholar] [CrossRef]
- Tunçbilek, E.; Komerska, A.; Arıcı, M. Optimisation of wall insulation thickness using energy management strategies: Intermittent versus continuous operation schedule. Sustain. Energy Technol. Assess. 2022, 49, 101778. [Google Scholar] [CrossRef]
- Wang, Y.; Liu, K.; Liu, Y.; Wang, D.; Liu, J. The impact of temperature and relative humidity dependent thermal conductivity of insulation materials on heat transfer through the building envelope. J. Build. Eng. 2022, 46, 103700. [Google Scholar] [CrossRef]
- Kölsch, B.; Walker, I.S.; Schiricke, B.; Delp, W.W.; Hoffschmidt, B. Quantification of air leakage paths: A comparison of airflow and acoustic measurements. Int. J. Vent. 2021, 22, 101–121. [Google Scholar] [CrossRef]
- Hou, J.; Zhang, T.; Liu, Z.; Hou, C.; Fukuda, H. A study on influencing factors of optimum insulation thickness of exterior walls for rural traditional dwellings in northeast of Sichuan hills, China. Case Stud. Constr. Mater. 2022, 16, e01033. [Google Scholar] [CrossRef]
- Rosti, B.; Omidvar, A.; Monghasemi, N. Optimal insulation thickness of common classic and modern exterior walls in different climate zones of Iran. J. Build. Eng. 2020, 27, 100954. [Google Scholar] [CrossRef]
- Daouas, N.; Hassen, Z.; Aissia, H. Ben Analytical periodic solution for the study of thermal performance and optimum insulation thickness of building walls in Tunisia. Appl. Therm. Eng. 2010, 30, 319–326. [Google Scholar] [CrossRef]
- Daouas, N. A study on optimum insulation thickness in walls and energy savings in Tunisian buildings based on analytical calculation of cooling and heating transmission loads. Appl. Energy 2011, 88, 156–164. [Google Scholar] [CrossRef]
- Ozel, M. Effect of wall orientation on the optimum insulation thickness by using a dynamic method. Appl. Energy 2011, 88, 2429–2435. [Google Scholar] [CrossRef]
- Ozel, M. Determination of optimum insulation thickness based on cooling transmission load for building walls in a hot climate. Energy Convers. Manag. 2013, 66, 106–114. [Google Scholar] [CrossRef]
- D’Agostino, D.; de’ Rossi, F.; Marigliano, M.; Marino, C.; Minichiello, F. Evaluation of the optimal thermal insulation thickness for an office building in different climates by means of the basic and modified “cost-optimal” methodology. J. Build. Eng. 2019, 24, 100743. [Google Scholar] [CrossRef]
- Alsayed, M.F.; Tayeh, R.A. Life cycle cost analysis for determining optimal insulation thickness in Palestinian buildings. J. Build. Eng. 2019, 22, 101–112. [Google Scholar] [CrossRef]
- Yu, J.; Yang, C.; Tian, L.; Liao, D. A study on optimum insulation thicknesses of external walls in hot summer and cold winter zone of China. Appl. Energy 2009, 86, 2520–2529. [Google Scholar] [CrossRef]
- Kaynakli, O. A study on residential heating energy requirement and optimum insulation thickness. Renew. Energy 2008, 33, 1164–1172. [Google Scholar] [CrossRef]
- Axaopoulos, I.; Axaopoulos, P.; Gelegenis, J.; Fylladitakis, E.D. Optimum external wall insulation thickness considering the annual CO2 emissions. J. Build. Phys. 2019, 42, 527–544. [Google Scholar] [CrossRef]
- Kallioğlu, M.A.; Ercan, U.; Avcı, A.S.; Fidan, C.; Karakaya, H. Empirical modeling between degree days and optimum insulation thickness for external wall. Energy Sources Part A Recover. Util. Environ. Eff. 2020, 42, 1314–1334. [Google Scholar] [CrossRef]
- Gülten, A. Determination of optimum insulation thickness using the entransy based thermoeconomic and environmental analysis: A case study for Turkey. Energy Sources Part A Recover. Util. Environ. Eff. 2020, 42, 219–232. [Google Scholar] [CrossRef]
- Jalil, J.M.; Salih, S.M. The optimum thickness of paraffin wax insulator filling a double glazed window. In Proceedings of the IOP Conference Series: Materials Science and Engineering, Sozopol, Bulgaria, 10–13 September 2020. [Google Scholar] [CrossRef]
- Kallioğlu, M.A.; Sharma, A.; Chinnasamy, V.; Chauhan, R.; Singh, T. Optimum insulation thickness assessment of different insulation materials for mid-latitude steppe and desert climate (BSH) region of India. Mater. Today Proc. 2020, 44, 4421–4424. [Google Scholar] [CrossRef]
- Küçüktopcu, E.; Cemek, B. The use of artificial neural networks to estimate optimum insulation thickness, energy savings, and carbon dioxide emissions. Environ. Prog. Sustain. Energy 2021, 40, e13478. [Google Scholar] [CrossRef]
- Raimundo, A.M.; Sousa, A.M.; Oliveira, A.V.M. Assessment of Energy, Environmental and Economic Costs of Buildings’ Thermal Insulation–Influence of Type of Use and Climate. Buildings 2023, 13, 279. [Google Scholar] [CrossRef]
- Al-Sanea, S.A.; Zedan, M.F.; Al-Ajlan, S.A. Effect of electricity tariff on the optimum insulation-thickness in building walls as determined by a dynamic heat-transfer model. Appl. Energy 2005, 82, 313–330. [Google Scholar] [CrossRef]
- Al-Sanea, S.A.; Zedan, M.F. Improving thermal performance of building walls by optimizing insulation layer distribution and thickness for same thermal mass. Appl. Energy 2011, 88, 3113–3124. [Google Scholar] [CrossRef]
- Al-Sanea, S.A.; Zedan, M.F.; Al-Mujahid, A.M.; Al-Suhaibani, Z.A. Optimum R-values of building walls under different climatic conditions in the Kingdom of Saudi Arabia. Appl. Therm. Eng. 2016, 96, 92–106. [Google Scholar] [CrossRef]
- Al-Hadhrami, L.M. Comprehensive review of cooling and heating degree days characteristics over Kingdom of Saudi Arabia. Renew. Sustain. Energy Rev. 2013, 27, 305–314. [Google Scholar] [CrossRef]
- Akan, A.E. Determination and Modeling of Optimum Insulation Thickness for Thermal Insulation of Buildings in All City Centers of Turkey. Int. J. Thermophys. 2021, 42, 49. [Google Scholar] [CrossRef]
- Turner, W.C.; Doty, S. Energy Management Handbook, 6th ed.; The Fairmont Press, Inc.: Fayetteville, GA, USA, 2006. [Google Scholar]
- Alrashed, F.; Asif, M. Climatic Classifications of Saudi Arabia for Building Energy Modelling. Energy Procedia 2015, 75, 1425–1430. [Google Scholar] [CrossRef]
- Alaidroos, A.; Krarti, M. Optimal design of residential building envelope systems in the Kingdom of Saudi Arabia. Energy Build. 2015, 86, 104–117. [Google Scholar] [CrossRef]
- Kurekci, N.A. Determination of optimum insulation thickness for building walls by using heating and cooling degree-day values of all Turkey’s provincial centers. Energy Build. 2016, 118, 197–213. [Google Scholar] [CrossRef]
- Alyami, S.H.; Alqahtany, A.; Ashraf, N.; Osman, A.; Aldossary, N.A.; Almutlaqa, A.; Al-Maziad, F.; Alshammari, M.S.; Al-Gehlani, W.A.G. Impact of Location and Insulation Material on Energy Performance of Residential Buildings as per Saudi Building Code (SBC) 601/602 in Saudi Arabia. Materials 2022, 15, 9079. [Google Scholar] [CrossRef]
- Ahmad, E.H. Cost analysis and thickness optimization of thermal insulation materials used in residential buildings in Saudi Arabia. In Proceedings of the 6th Saudi Engineering Conference, KFUPM, Dhahran, Saudi Arabia, 14–17 December 2002. [Google Scholar]


| Jeddah (%) | Riyadh (%) | Dhahran (%) | Guraiat (%) | Khamis M. (%) | |
|---|---|---|---|---|---|
| January | 66 | 45 | 68 | 65 | 67 |
| February | 67 | 34 | 63 | 56 | 60 |
| March | 61 | 26 | 48 | 43 | 55 |
| April | 57 | 24 | 45 | 37 | 53 |
| May | 53 | 17 | 33 | 31 | 45 |
| June | 55 | 21 | 29 | 30 | 36 |
| July | 50 | 15 | 31 | 29 | 44 |
| August | 58 | 16 | 43 | 36 | 46 |
| September | 70 | 19 | 48 | 39 | 35 |
| October | 68 | 20 | 58 | 42 | 38 |
| November | 70 | 39 | 62 | 53 | 59 |
| December | 70 | 47 | 68 | 62 | 66 |
| AH | 62.1 | 26.9 | 49.7 | 43.6 | 50.3 |
| City | Insulation | Ct,min (SAR/m2) | PP (Year) | Xopt (cm) | Ropt (m2.K/W) | Uopt (W/m2.K) |
|---|---|---|---|---|---|---|
| Khamis M. (CDD = 3390 °C-day) | MP | 34.89 | 2.06 | 4.96 | 1.46 | 0.69 |
| PB | 44.12 | 2.74 | 2.34 | 0.98 | 1.03 | |
| RW | 39.69 | 2.4 | 4.96 | 1.18 | 0.85 | |
| Guriat (CDD = 3571 °C-day) | MP | 35.95 | 2.01 | 5.14 | 1.51 | 0.66 |
| PB | 45.52 | 2.65 | 2.43 | 1.01 | 0.99 | |
| RW | 40.92 | 2.34 | 5.15 | 1.23 | 0.82 | |
| Riyadh (CDD = 5688 °C-day) | MP | 46.72 | 1.6 | 6.94 | 2.04 | 0.49 |
| PB | 59.82 | 2.12 | 3.39 | 1.41 | 0.71 | |
| RW | 53.47 | 2.86 | 7.05 | 1.68 | 0.60 | |
| Dhahran (CDD = 5953 °C-day) | MP | 47.91 | 1.63 | 7.13 | 2.10 | 0.48 |
| PB | 61.41 | 2.07 | 3.5 | 1.46 | 0.69 | |
| RW | 54.86 | 1.8 | 7.2 | 1.71 | 0.58 | |
| Jeddah. (CDD = 6587 °C-day) | MP | 50.66 | 1.48 | 7.59 | 2.23 | 0.45 |
| PB | 65.07 | 1.97 | 3.74 | 1.56 | 0.64 | |
| RW | 58.07 | 1.73 | 7.75 | 1.85 | 0.54 |
Disclaimer/Publisher’s Note: The statements, opinions and data contained in all publications are solely those of the individual author(s) and contributor(s) and not of MDPI and/or the editor(s). MDPI and/or the editor(s) disclaim responsibility for any injury to people or property resulting from any ideas, methods, instructions or products referred to in the content. |
© 2025 by the authors. Licensee MDPI, Basel, Switzerland. This article is an open access article distributed under the terms and conditions of the Creative Commons Attribution (CC BY) license (https://creativecommons.org/licenses/by/4.0/).
Share and Cite
Makawi, M.A.; Ahmed, W.; Kenawy, H.S.; Abd El Fattah, A. A Novel Validated Method to Determine the Relationship Between Insulation Thickness and the Annual Cooling Cost in Desert Climates. Appl. Sci. 2025, 15, 2839. https://doi.org/10.3390/app15052839
Makawi MA, Ahmed W, Kenawy HS, Abd El Fattah A. A Novel Validated Method to Determine the Relationship Between Insulation Thickness and the Annual Cooling Cost in Desert Climates. Applied Sciences. 2025; 15(5):2839. https://doi.org/10.3390/app15052839
Chicago/Turabian StyleMakawi, Mohamed A., Wahhaj Ahmed, Habibelrahman Sherif Kenawy, and Ahmed Abd El Fattah. 2025. "A Novel Validated Method to Determine the Relationship Between Insulation Thickness and the Annual Cooling Cost in Desert Climates" Applied Sciences 15, no. 5: 2839. https://doi.org/10.3390/app15052839
APA StyleMakawi, M. A., Ahmed, W., Kenawy, H. S., & Abd El Fattah, A. (2025). A Novel Validated Method to Determine the Relationship Between Insulation Thickness and the Annual Cooling Cost in Desert Climates. Applied Sciences, 15(5), 2839. https://doi.org/10.3390/app15052839