Article

Development of Modified Gas Composition for Atmosphere Packaging of Sliced Apple Chips

by
Jarosław Wyrwisz
1,*,
Małgorzata Moczkowska-Wyrwisz
2 and
Marcin A. Kurek
1
1
Department of Technique and Food Development, Institute of Human Nutrition Sciences, Warsaw University of Life Sciences, 02-776 Warsaw, Poland
2
Department Food Gastronomy and Food Hygiene, Institute of Human Nutrition Sciences, Warsaw University of Life Sciences, 02-776 Warsaw, Poland
*
Author to whom correspondence should be addressed.
Appl. Sci. 2025, 15(5), 2832; https://doi.org/10.3390/app15052832
Submission received: 13 February 2025 / Revised: 27 February 2025 / Accepted: 4 March 2025 / Published: 6 March 2025
(This article belongs to the Special Issue Advanced Technologies for Food Packaging and Preservation)

Abstract

:
In this study, we report the development of mixed gas composition for packaging dried apple slices in a modified atmosphere to extend their shelf life and maintain their quality. We used the response surface methodology to optimize oxygen and carbon dioxide concentrations in the mixture for packaging in a modified atmosphere based on the changes in mass, hardness, browning index, polyphenols, and vitamin C content during apple chip storage. Studies have shown that the optimal concentration of oxygen should be 2.663% and carbon dioxide 3.785% when packaging dried apple slices in a modified atmosphere to obtain minimal changes in the measured quality attributes. These findings can be applied in food processing and storage, providing a useful guideline for improving the preservation and nutritional value of dried fruits.

1. Introduction

One of the most popular and widely processed fruits is apples. A leading European country in global apple production and export is Poland. In 2023 alone, almost 3.9 million tons of apples were harvested [1]. The average monthly fruit consumption in Polish households increased from 3.46 kg/per capita in 2010 to 3.71 kg/per capita in 2023 [2]. Apples are a source of dietary fiber (2–2.4 g/100 g), vitamin C (3–23 mg/100 g), and microelements such as calcium (6 mg/100 g), potassium (107 mg/100 g), and zinc (0.04 mg/100 g [3,4,5]. Apples are especially rich in polyphenols (66.2–211.9 mg/100 g) [6,7]. Moreover, these compounds exhibit antioxidant properties. Levels of particular elements differ between apple varieties and depend on cultivation conditions [8,9,10]. Considering the sensory and nutritional values of apples, these fruits are good materials for further processing.
The shelf-life of seasonal fruits and vegetables should be prolonged using appropriate processing techniques that preserve their natural values [11,12]. Moreover, growing consumer consciousness and nutritional knowledge drive them to search for high-quality products rich in beneficial substances. As a result, convenient and functional food is more desirable [13]. Technologies aimed at minimizing food processing while preserving its sensory, nutritional, and textural properties—ensuring both efficiency and safety—are being used. Emerging green methods are expected to be cost-effective, energy-efficient, and adaptable to different types of food and processing methods. However, many current green technologies do not fully meet these expectations, prompting the food industry to seek alternatives free from synthetic chemicals [14].
Convection drying is a basic and commonly used food shelf-life prolongation process aiming to reduce water activity. It extends the shelf-life of the product and maintains its nutritional value. However, high temperatures can damage thermolabile bioactive compounds, cause discoloration, influence the texture, appearance, etc. [15]. Most food products are heat sensitive and drying procedures should be carefully conducted. Research has shown that drying at lower temperatures contributes to lower losses of nutritional compounds [16]. Fruits are one of the most commonly dried products. An example of a dehydrated food is dried sliced apple chips, which have become a popular snack recently [17]. This form of apples is very convenient and ready to eat, as the fruit has already been washed and/or peeled before further processing. Likewise, dried apple chips are lighter than fresh fruits and can be easily transported without bruising. Due to the water evaporation during drying, the change of matrix from apples to apple chips makes the compounds share higher because of its concentration [18].
Considering product quality, one of the most important attributes is color and shrinkage [16]. These parameters are connected with food quality evaluation and decide consumer satisfaction. The product’s appearance gives information about its freshness, taste, aroma, moisture content, and nutritional value [19,20]. Apples and their processed forms, such as dried or apple chips, are particularly vulnerable to quality deterioration due to oxidation and microbial activity. The slicing process damages the cellular structure, leading to accelerated enzymatic browning and changes in texture and flavor [21,22]. The enzymatic browning causes color changes due to the oxidase reaction of phenolic compounds with atmospheric oxygen which diffuses into fruit tissue. To prevent this negative impact, anti-browning agents such as citric acid are used [23]. During drying, either enzymatic and non-enzymatic color changes occur. These could enhance the negative effect and affect the acceptability of dried and semi-dried products [24]. Another fundamental quality determinant is texture. The drying process intensively influences the fruit’s microstructure so there is a risk of receiving products of undesirable texture. The most important textural parameter of dried apples is hardness which is associated with moisture content [18]. Optimizing process parameters is crucial for achieving a satisfactory final product quality.
The modern food market imposes increasingly stringent requirements regarding food products’ quality, shelf life, and safety. In response to these demands, innovative packaging technologies are being developed to extend product shelf life while maintaining high sensory and nutritional values. One effective method for extending the shelf life of food is modified atmosphere packaging (MAP), which involves replacing air with a specifically designed gas mixture suited to the product [25,26,27]. Modified atmosphere packaging helps maintain product quality and additionally extends its shelf life. The usage of MAP packaging to control changes in fruits and vegetables during storage (ripening, browning, etc.) [28]. It also reduces the respiration rate. The following gases are currently in use: O2, CO2 and N2. Creating a suitable gas mixture for a specific product is essential [27,29,30]. There is little research taking into consideration the MAP gas composition used for apple storage [31].
Therefore, our research aimed to develop and optimize the gas composition in modified atmosphere packaging of apple dry slices to extend their shelf life without deterioration of quality. To our knowledge, there is little research investigating the physicochemical changes during storage in terms of dried apple slices in modified atmosphere packaging where different concentrations of oxygen and carbon dioxide have been used. Since this study aims to determine the optimal gas composition for storing dried apple slices, the results could be beneficial for scientific and industrial entities, as well as consumers who seek high-quality products with an extended shelf life, without the need for artificial preservatives.

2. Materials and Methods

2.1. Apple Dried Slice Preparation

The experimental material comprised apples Malus domestica cultivar Egremont Russet. Apples, harvested during the same period (October) and originating from a local orchard (Grójec, Mazovia, Poland) stored at 4 °C until the moment of the experiment. The apples were selected based on their appearance and stage maturity, which was evaluated using a dry basis, reflective index, and acidity. Table 1 shows the chosen parameters of fresh apples. Apples were washed, drained, and cored using a cork borer (25 mm diameter) and then mechanically cut perpendicular to the fruit axis into 4 mm-thick slices using a slicer machine (model 210p CE, Ma-Ga, Bydgoszcz, Poland). Only the eight central slices of each apple were used. To avoid enzymatic browning reactions, the slices were immersed in a 0.1% citric acid solution immediately after cutting until drying (approx. 1 min) and were blotted with filter paper.

2.2. Convective Drying

Air-drying of apple slices was performed in a drying oven (model FED 115, Binder, Tuttlingen, Germany) at 70 °C with forced convection (air velocity 1.5 m/s, 35–40% RH). Samples were placed on the perforated tray positioned perpendicular to airflow. The drying process was carried on until the equilibrium weight state (about 11% water content in dried samples).

2.3. Modified Atmosphere Packaging

After cooling at ambient temperature for 1 h in the desiccator with silica gel, dried apple sliced chips were packed in transparent polypropylene bags (PP package, thickness 550 µm) and covered with PET/CPP/AF laminate (thickness 44 µm).
The apple chips were packed at 1050 mbar pressure and supplied with following an initial gas mixture: 100% N2, 2% O2/2% CO2 in N2, 2% O2/4% CO2 in N2, 4% O2/2% CO2 in N2, 4% O2/4% CO2 in N2 (prepared by Air Liquide, Cracow, Poland) with using packing machine (Sealpac M3, Oldenburg, Germany) and stored in the protected from light, at ambient temperature. Sampling was performed on 0, 15, 30 days.

2.4. Measurement of Dry Basis, Reflation Index, and Acidity

The dry basis of raw apples was measured gravimetrically by drying the samples at 105 °C. The reflective index, as sugar, was determined in apple juice using a hand-held optical refractometer (model WS-B80, ATAGO Co., Ltd., Tokyo, Japan) and expressed as °Brix. Titratable acidity was determined by titration against a 0.1 N NaOH solution to pH 8.1 and the acidity was expressed as mEq NaOH/100 g.

2.5. Color Measurement and Browning Index

The color of dried apple sliced chips was instrumentally measured using a Minolta CR-400 colorimeter (Konica Minolta Inc., Osaka, Japan). The following parameters were determined L* (lightness, L* = 0 black, L* = 100 white), a* (−a* = greenness; +a* = redness) and b* (−b* = blueness; +b* = yellowness). To achieve accurate results the calibration was done with a white reference standard (L* = 98.45, a* = 0.10, b* = 0.13). The colorimeter was set to a measurement area of 8 mm, illuminant D65, and standard observers 2°. Every sample (0, 15, and 30 days of storage in different atmospheres) was measured in three different locations of ten chips.
The color changes during storage were determined using the color difference coefficient (ΔE), which was calculated from the following Equation (1):
E = L x * L 0 * 2 + a x * a 0 * 2 + b x * b 0 * 2
where L*0, a*0, and b*0 are the initial color coordinates of dried apple sliced chips (day 0) and L*x, a*x, and b*x were the color coordinates of dried apple sliced chips after storage 15 or 30 d.
Browning index (BI) was also reported. This indicator shows changes in brown color in food products containing sugar. Results were calculated according to the equations below (2 and 3, respectively) [23].
B I = [ 100 x 0.31 ] 0.17
where
x = ( a * + 1.75 L * ) ( 5.645 L * + a * 3.012 b * )

2.6. Textural Properties

The maximum force required to puncture the dried apple slice chips was used as a parameter to determine the textural properties. The force at fracture (hardness) was measured in apple slices chips by a puncture test using a universal testing machine Instron (Model 5965, Norwood, MA, USA). For the puncture test, apple chips were placed on a platform and a cylindrical 8 mm diameter probe was used to puncture the samples in the center at a crosshead speed of 60 mm/min (load cell 500 N) until the sample was penetrated through the whole height of the tissue (displacement of the probe 5 mm).

2.7. Total Phenol Content

Dried apple slices were analyzed for total phenol content according to the Folin–Ciocalteu assay [32]. Samples were prepared as described by Sudha et al. [33] with authors modifications. Three grams of homogenized material was defatted with 40 mL of ether/chloroform mixture (1:1 v/v). After drying, 0.5 g of sample was weighed and 5 mL of water (for aqueous extraction) was added. Then, test tubes were mixed for 3 min and centrifuged for 10 min. For each sample 0.1 mL of its water extracted supernatants was diluted with 0,9 mL of water followed by the addition of 1 mL Folin–Ciocalteau’s reagent and 2 mL of 10% sodium carbonate solution. After 1 h of mixing in a tube rotator and incubation at room temperature, absorbance was measured at 765 nm with a UV-VIS spectrophotometer (Shimadzu UV-1800, Kyoto, Japan). The results of the total phenol content examination were expressed as milligrams of gallic acid equivalent (GAE) per gram of dry weight.

2.8. Vitamin C Content

The vitamin C content was determined using the HPLC method, with results calculated on a dry basis [34]. The vitamin C content was determined using the high-performance liquid chromatography (HPLC) method with a Shimadzu Prominence system equipped with a diode array detector (DAD). The chromatographic separation was performed on a Restek C18 column (4.6 mm × 250 mm, 5 μm; Restek Corporation, Bellefonte, PA, USA). The mobile phase consisted of a mixture of 0.1% metaphosphoric acid in water and methanol (95:5, v/v) with an isocratic flow rate of 1.0 mL/min. The column temperature was maintained at 25 °C, and the detection wavelength was set at 245 nm. The injection volume was 20 μL. For method validation, the limit of detection (LOD) and the limit of quantification (LOQ) were determined. The LOD was established at 0.05 mg/L, while the LOQ was 0.15 mg/L. The method’s precision was assessed by repeatability tests, showing relative standard deviations (RSD) below 2%. L-ascorbic acid (Sigma-Aldrich, St. Louis, MO, USA) was used as a standard for the calibration curve. Standard solutions were prepared in 0.1% metaphosphoric acid, and calibration curves were constructed within the concentration range of 0.5–50 mg/L, yielding a correlation coefficient (R2) above 0.999. The results were calculated on a dry basis and expressed in mg of vitamin C per 100 g of sample.

2.9. Consumer Acceptance

The consumer acceptance test of apple chips was carried out according to Velickova et al. [35] with several modifications. The consumer acceptance test of apple chips was conducted with 42 consumers (28 females and 14 males). These consumers were aged between 21 and 43 years old. All subjects declared themselves as consumers of chips and other crispy products. The chip samples were evaluated at room temperature 4 h after drying (control sample). A sample consisted of three intact chips of each type of packaging. The presented samples, placed in separate disposable closed dishes, were labeled with a three-digit code. Consumers were asked to evaluate their overall acceptance using a hedonic 10 cm unstructured scale with defined marginal values (0—dislike significantly and 10—like extremely) according to European Norm PN-EN ISO 11136:2017-08 [36] and PN-EN ISO 5492:2009 [37].

2.10. Statistics

The statistics included employing response surface methodology with the design of the experiment based on the historical data. Two factors (O2 and CO2 concentrations) influenced eight responses (mass loss, hardness, lightness, browning index, ΔE, total phenol content, vitamin C content, and overall quality). The results were calculated using Design Expert 10 (Stat-Ease Inc., Minneapolis, MN, USA). The responses obtained for the assays were subject to the central composite rotational design (CCRD), which was used to study the effects of the variables—to model the optimal concentration of used gases. The behavior of responses was presented as contour plots. After the successful analysis of statistical models, the point-prediction calculations were performed to compare the predicted and experimental data, which were compared with the ANOVA statistical test with a significance level of α = 0.05.

3. Results and Discussion

Currently, consumer expectations are focused on high-quality food with a positive impact on health and extending shelf-life [30]. Therefore, the food industry should be looking for preservation methods that minimally process raw food. Drying is the most common form of food preservation [38,39]. During the drying process, many physicochemical changes occur [40] such as water loss and shrinkage of the material, which affect the hardness and mechanical properties of tissue [41]. However, drying improves food stability by considerably reducing the water content and microbiological activity of the material, while minimizing physical and chemical changes during storage [42]. The selection of appropriate storage conditions and packaging methods is the final step in producing dried fruit [43]. The application of modified atmosphere packaging may help reduce further losses of bioactive components, as well as maintain the adequate texture of dried apples.

3.1. Mass Loss

The mass loss (ML) during the storage process of dried apple slices is presented in Figure 1. There is a tendency to show that there were insignificant differences between the sample of apple slices stored for 15 and 30 days. However, there were significant differences in ML when different concentrations of O2 and CO2 were taken into consideration. The highest ML was observed when the highest concentration of O2 was used independently of storage duration (6.8% and 8.2%, respectively; p = 0.001). The concentration of CO2 was the factor influencing significantly the ML of dried apple slices but the significance was lower (p = 0.017). The plot in Figure 1 proves that the interaction factor between the two used gases was visible as well.

3.2. Hardness

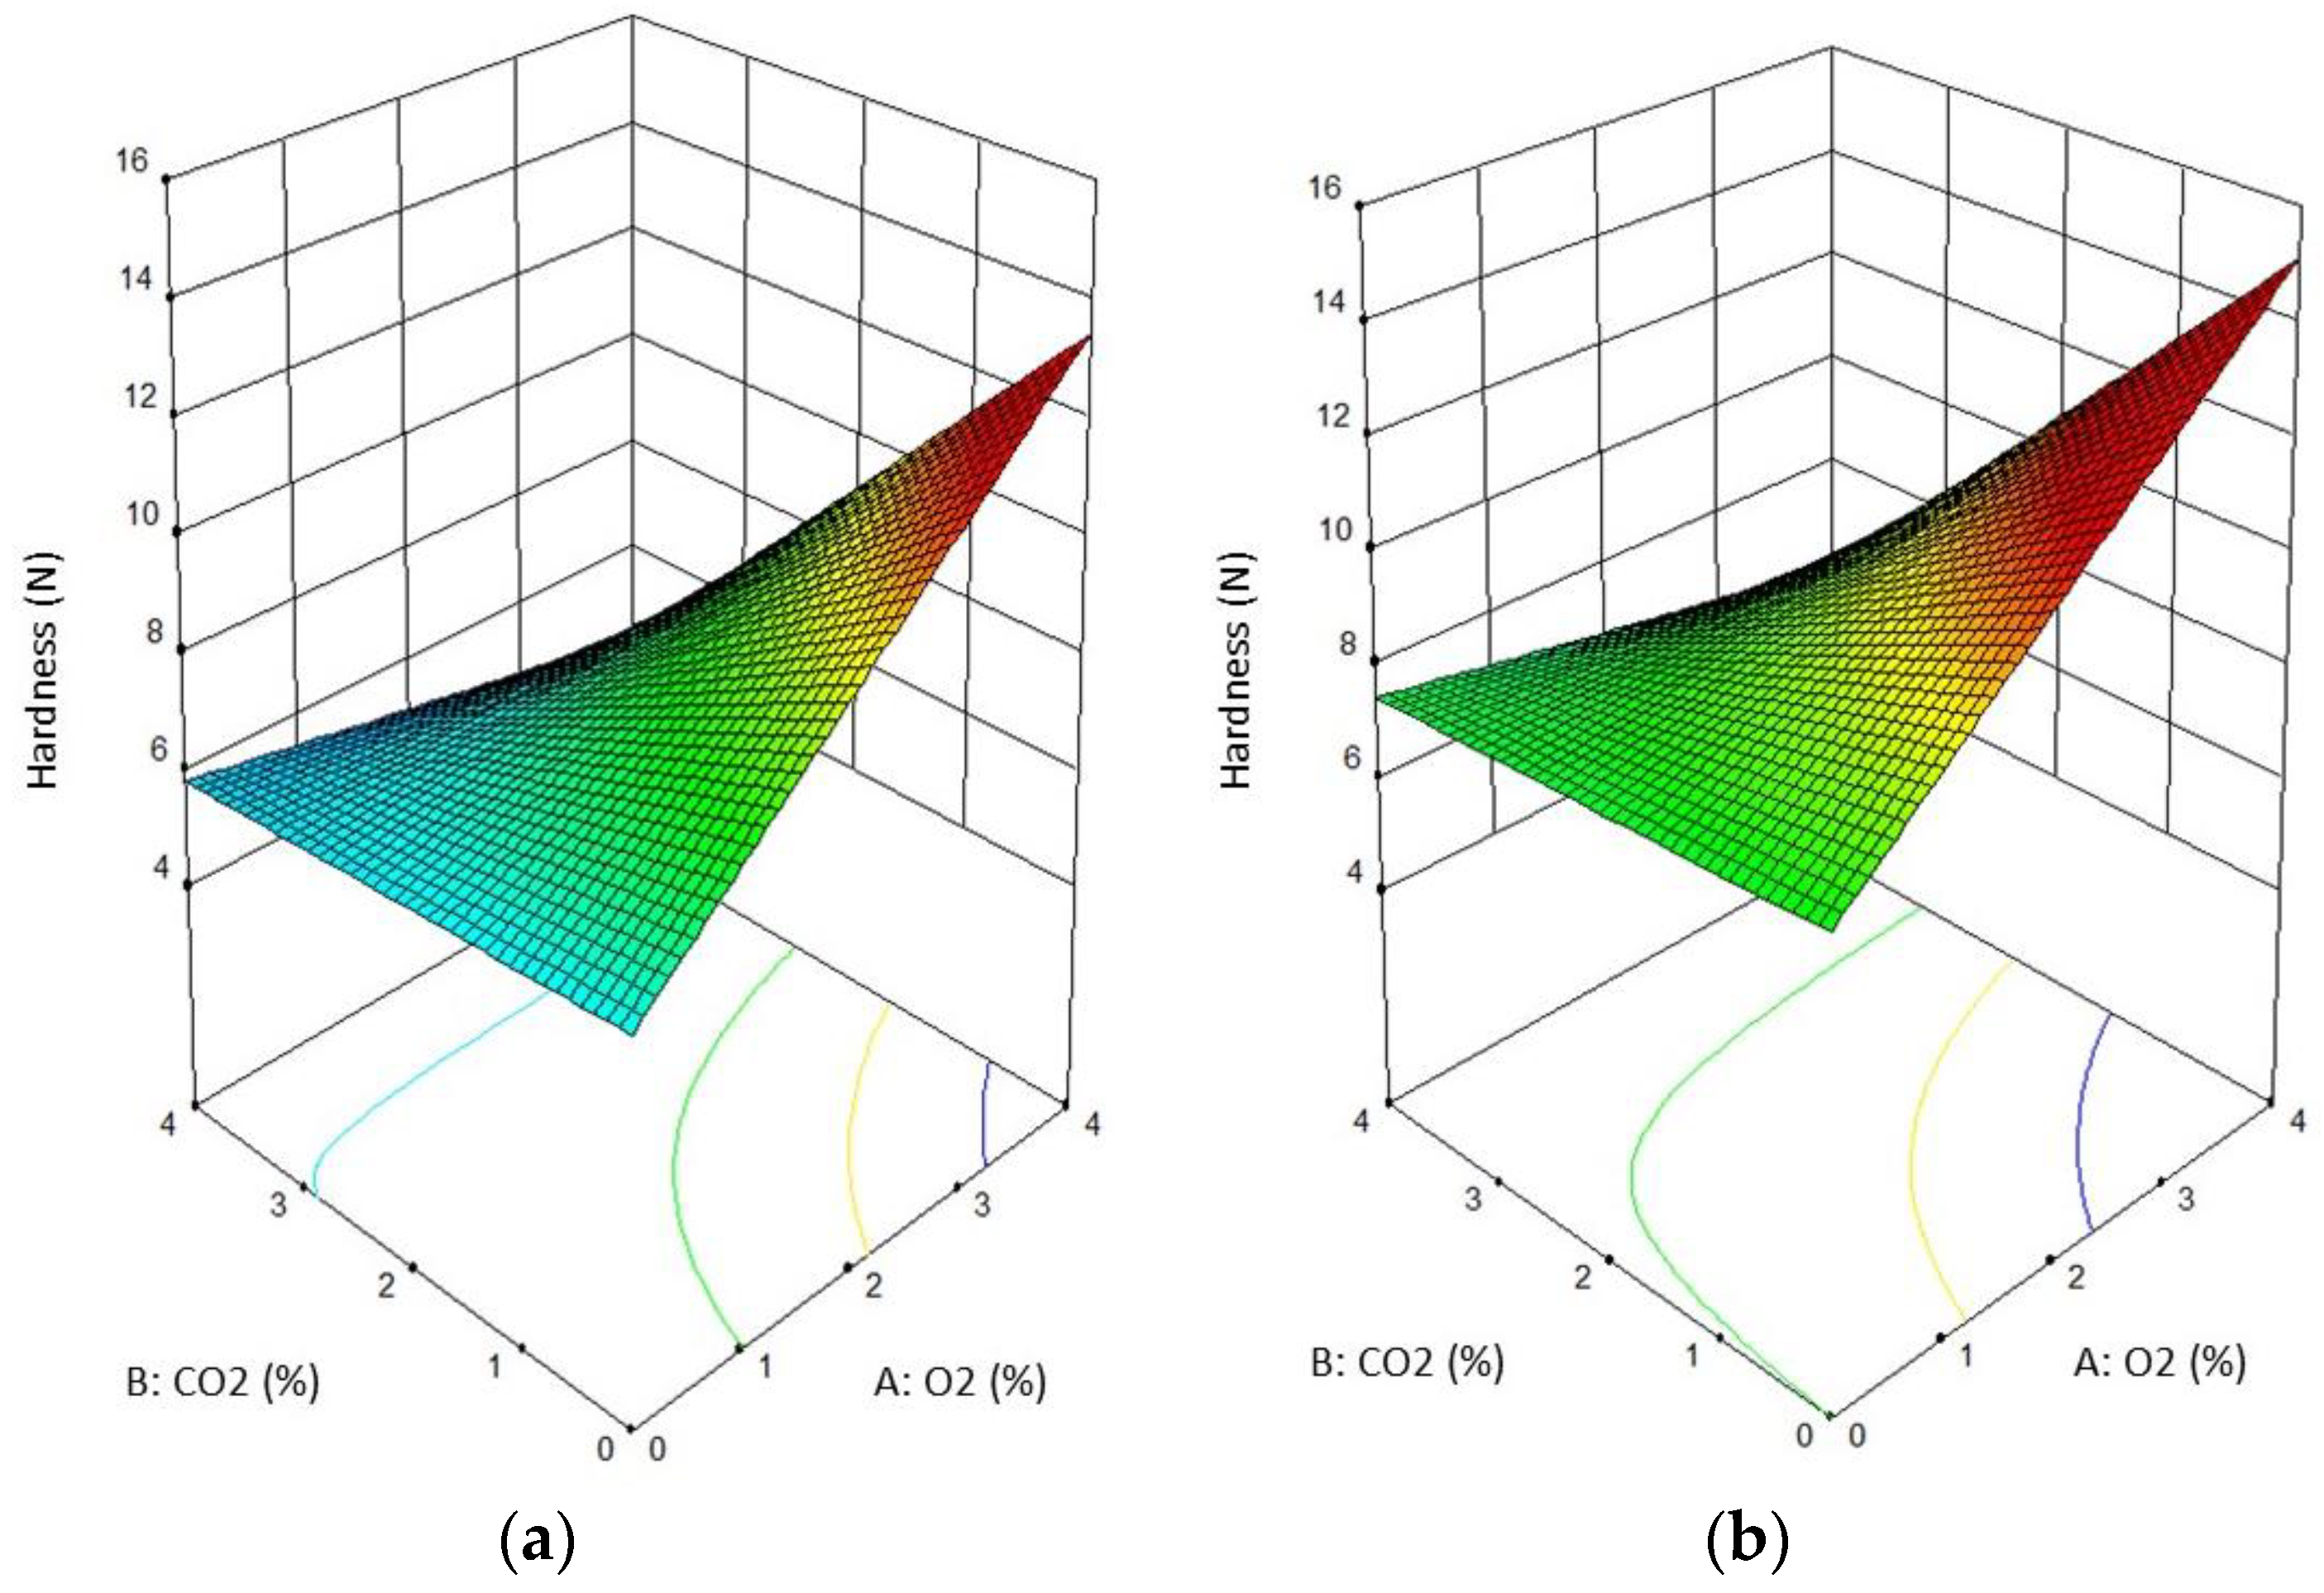
Hardness was measured as the value widely conceived as the most vital parameter regarding dried products. The examination revealed that hardness was highest in the samples with the highest O2 concentration (13.6 N after 15 days of storage and 15.1 N after 30 days) (Figure 2). Nevertheless, the influence of CO2 was more significant (p = 0.001) than the influence of oxygen (p = 0.007). Here, the day of storage affected the hardness values as well, but on the lowest level of significance (p = 0.021). The case of fresh apples stored in a modified atmosphere demonstrated a positive effect on texture properties (hardness) and the beneficial role of this packaging system in extending its shelf life [44,45]. The lower O2 content and higher CO2 content in MA composition resulted in better product quality and shelf life [44]. For dried fruit, a crunchy sensation/feeling is important due to the increasing popularity of this group of food as snacks [46,47]. One way to maintain acceptable textural properties of food products is the use a packaging system with a modified atmosphere [48]. Different gases which fill the package are used depending on the type of product. In the case of fruits and vegetables, the natural interaction between the respiration rate of the product and the transfer of gases through the packaging material is most commonly used [30].

3.3. Color Attributes

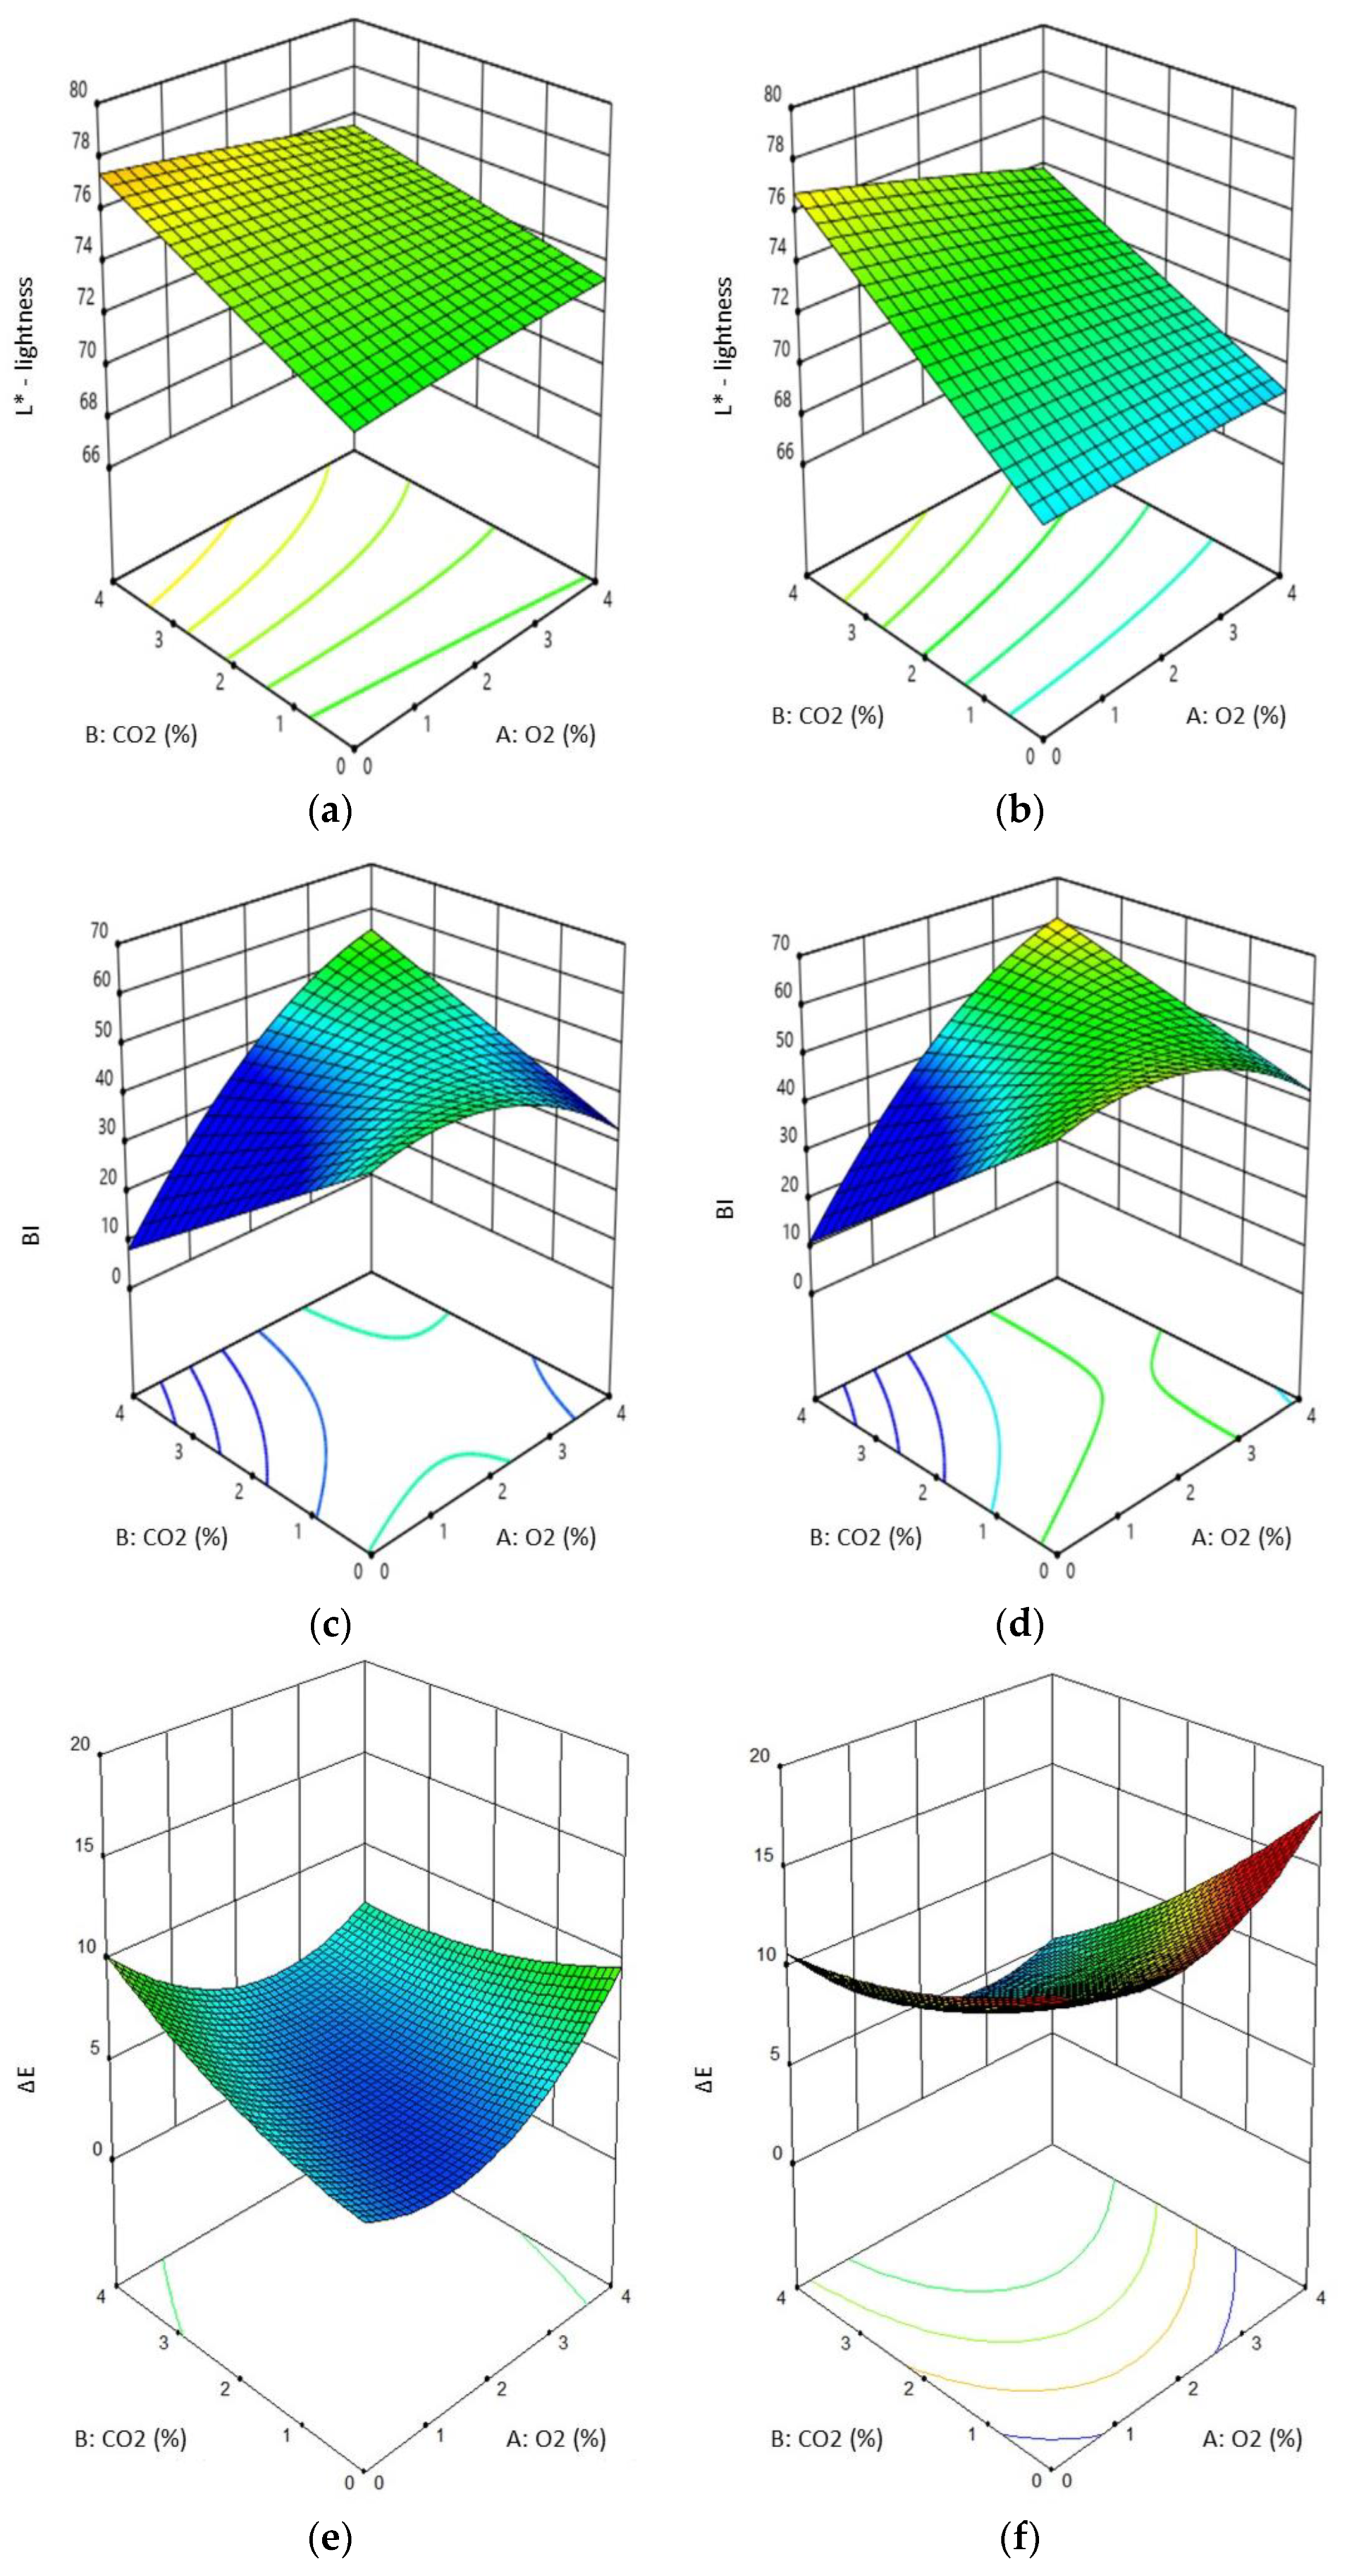
The color attributes regarding the L*—lightness, browning index (BI), and ΔE are presented in Figure 3. The L* of the dried apple slices is regarded as one of the most important visual parameters for the customers. While using the modified atmosphere packaging, it is most valuable to counteract the changes during the storage of the product and approximate the attributes at the end of storage to ones from the beginning.
The color and lightness of the product depend on the presence of the compounds of brown solid, which can be determined by examining the potential of browning. During the drying of the apple tissue, enzymatic and non-enzymatic browning reactions occur, significantly affecting the content of brown pigments in dried apples, regardless of the method and drying parameters [49]. The smallest changes in the L* color coordinate of measured dried apple slices were observed when a concentration of 2% of oxygen and 4% of carbon dioxide and either concentration on the 4% level were used (Figure 3a,b). The concentration of oxygen was the key point in this observation because the influence of oxygen was estimated on the level p = 0.48 and the concentration of carbon dioxide was insignificant (p = 0.384).
The enzymes and chemical structure of apples determine this product as less durable to enzymatic browning. Thus, the BI of the dried apple slices was calculated to examine whether the used gases could prevent the dried apple slices from browning. The results provided us with the information that the least significant change of this parameter was observed while storing the dried apples in the concentration of 2% oxygen and 4% carbon dioxide (Figure 3c,d).
Due to the long storage of dried apple slices, the change between the samples collected on the first day of storage before packaging was examined considering the a* and b* color coordinates. Due to better comparison of results, the ΔE value was calculated, and the results are presented in Figure 3e,f. As is visible from the L* parameters, here, the most significant factor influencing the ΔE was the day of storage (p = 0.13). The presented plot shows that the concentration of used gases was an insignificant factor (O2p = 0.510, CO2p = 0.157). The concentration of carbon dioxide was the most important factor shaping the color of storage dried apple slices.

3.4. Chemical Composition

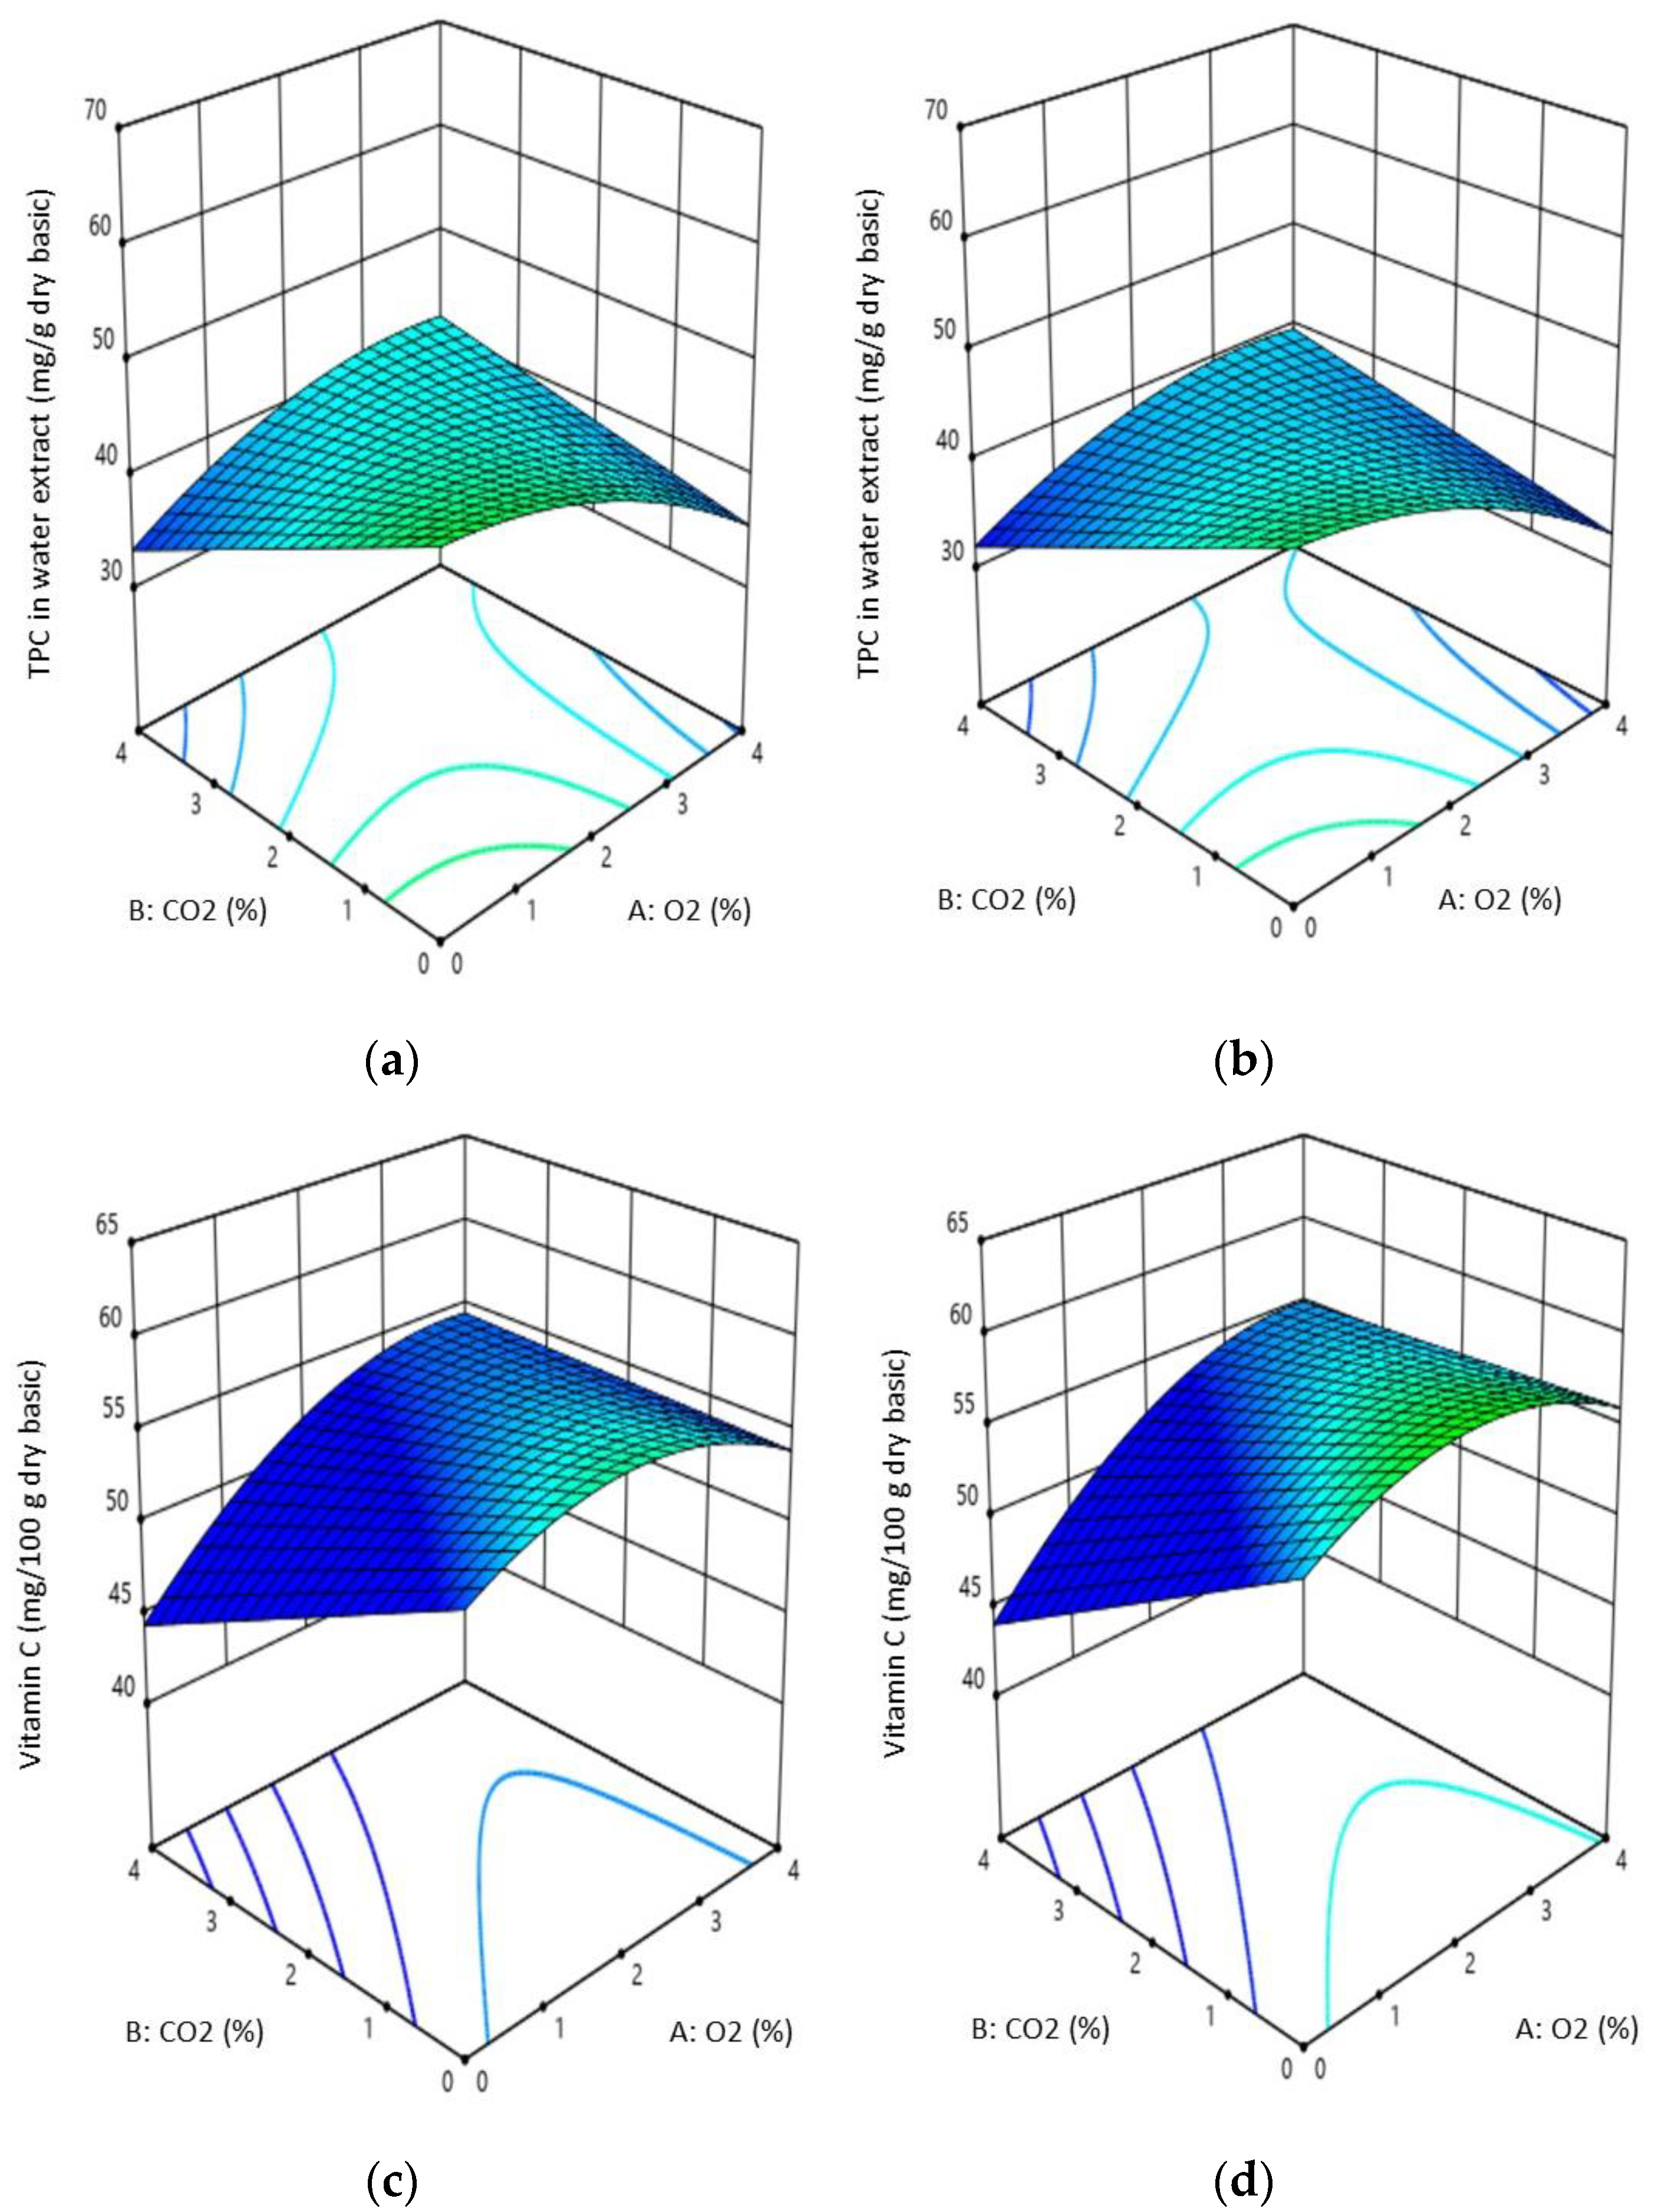
The chemical composition of the dried apple slices is presented in Figure 4. The total phenolic content (TPC) was estimated using water as the extract solution. The TPC in water was at least affected by the two extreme concentrations (0 and 4%) (Figure 4a,b). Considering the entire matrix of results, it was statistically proven that the concentration of CO2 was a significant factor influencing the TPC (p = 0.053). The degree of change in storage of dried products mainly depends on the water content of the dried product, temperature, and storage time. With a long duration of storage, nutrient content decreases [50,51]. Studies carried out on dried fruit [52] indicate that a significant loss of TPC is followed by storage. Accordingly, the loss of vitamins and changes of polyphenolic compounds during storage considerably reduced antioxidant activity. The antioxidant activity is one of the most important characteristics of plant material [52,53]. The factor determining the effectiveness of antioxidants is the composition of fruits, as well as the technological process conditions [52,54]. However, Lavelli and Vantaggi [51] found that dried apples were relatively stable during storage and had optimal conservation of antioxidants when the right packaging methods were used. Also, Udomkun et al. [43] showed that ascorbic acid concentration was significantly affected by both storage time and packaging system. Very promising results were observed in terms of vitamin C content, as insignificant differences during storage were found in three out of five examined concentrations (Figure 4c,d). The factor that influenced the vitamin C content was CO2 concentration (p = 0.0104).

3.5. Overall Quality

The overall quality was assessed in the hedonic scale and is presented in Figure 5a,b. The scale is enlarged in the plots to make them more visible. The general trend was that the overall quality of the dried apple slices was less acceptable to the consumers on the last day of storage. The second factor that influenced the quality was the concentration of CO2 (p = 0.041). The overall acceptance of apple chips may have been influenced by changes in their lightness L* and BI, as well as their hardness, depending on the gas mixture composition and storage time.

3.6. The Optimization of the Gas Concentration

Due to the different data achieved from this research, we decided to statistically model the concentration of gases that could be used in modified atmosphere packaging. As the response variables, we decided to minimize the mass loss, hardness, and browning index while maximizing the nutritional value and quality of dried apple slices. The results from the model gave the information that the optimal concentration of oxygen should be 2.663% and carbon dioxide—3.785%.

3.7. Verification of the Models

The verification of the model was completed in the following way. A gas mixture used in the final product contained O2—2.663% and CO2—3.785% in N2. Then, the ML, hardness, L*, BI, ΔE, TPC, and vitamin C content and overall quality of apple chips stored for 15 and 30 days were measured and applied to the model based on regression and contour plots. The calculated and measured parameters were then compared, as listed in Table 2. No significant differences were found between the predicted and measured values, confirming positive verification of the fitted models. Therefore, the bias factors for almost all responses would suggest a strong association between the predicted and experimental factors. The exception was overall quality, where significantly higher measured values were recorded than predicted values (p ≤ 0.05). This could be attributed to the fact that consumer evaluations tend to be highly subjective and have lower repeatability than instrumental measurement methods.

4. Conclusions

Dried apple slices could be used as an alternative source of vitamins, polyphenols, and other nutritional elements. In our study, we conducted a series of measurements to prevent the apple slices from decreasing in quality over time by using modified atmosphere packaging. We used different gas (oxygen and carbon dioxide) concentrations. By employing the response surface methodology, we were able to optimize these parameters and provide products that were insignificantly different from the control sample. We demonstrated that the optimal concentration of oxygen should be 2.663% and carbon dioxide—3.785%. With this knowledge, the optimized gas mixture could be used by researchers and food technologists to maintain the desired physicochemical properties of dried apple slices. The results of this study could lead to better control of packaging parameters, enhancing both shelf life and consumer acceptance of dried apple products.

Author Contributions

J.W.: conceptualization, formal analysis, data curation, investigation, methodology, laboratory work, writing—original draft, writing—review and editing; M.A.K.: conceptualization, laboratory work, investigation, methodology, writing—original draft; M.M.-W.: laboratory work, writing—original draft. All authors have read and agreed to the published version of the manuscript.

Funding

This research was funded by the Polish Ministry of Science and Higher Education with funds from the Institute of Human Nutrition Sciences, Warsaw University of Life Science (WULS), for scientific research.

Institutional Review Board Statement

Not applicable.

Informed Consent Statement

Not applicable.

Data Availability Statement

The datasets generated for this study are available on request to upon request from the corresponding author.

Conflicts of Interest

The authors declare no conflicts of interest.

References

  1. Rynek Owoców i Warzyw. Available online: https://kups.org.pl/wp-content/uploads/2024/01/Rynek-owocow-i-warzyw_63_2023_Poprawny.pdf (accessed on 30 January 2025).
  2. Statistical Yearbook of Agriculture 2024, Warsaw, Poland. Available online: https://stat.gov.pl/en/topics/statistical-yearbooks/statistical-yearbooks/statistical-yearbook-of-agriculture-2024,6,19.html (accessed on 31 January 2025).
  3. Lemmens, E.; Alós, E.; Rymenants, M.; De Storme, N.; Keulemans, W.J. Dynamics of ascorbic acid content in apple (Malus x domestica) during fruit development and storage. Plant Physiol. Biochem. 2020, 151, 47–59. [Google Scholar] [CrossRef]
  4. Kaleta, A.; Górnicki, K. Evaluation of drying models of apple (var. Ligol) dried in a fluidized bed dryer. Int. J. Food Sci. Technol. 2010, 45, 891–898. [Google Scholar] [CrossRef]
  5. Apple Nutritional Composition. Public Health England. McCance and Widdowson’s The Composition of Foods Seventh Summary Edition. Royal Society of Chemistry. 2015. Available online: https://www.britishapplesandpears.co.uk/apple-nutritional-composition/ (accessed on 15 January 2025).
  6. Rothwell, J.A.; Pérez-Jiménez, J.; Neveu, V.; Medina-Ramon, A.; M’Hiri, N.; Garcia Lobato, P.; Manach, C.; Knox, K.; Eisner, R.; Wishart, D.; et al. Phenol-Explorer 3.0: A major update of the Phenol-Explorer database to incorporate data on the effects of food processing on polyphenol content. Database 2013, 2013, bat070. [Google Scholar] [CrossRef] [PubMed]
  7. Kschonsek, J.; Wolfram, T.; Stöckl, A.; Böhm, V. Polyphenolic Compounds Analysis of Old and New Apple Cultivars and Contribution of Polyphenolic Profile to the In Vitro Antioxidant Capacity. Antioxidants 2018, 7, 20. [Google Scholar] [CrossRef]
  8. Pissard, A.; Fernández Pierna, J.A.; Baeten, V.; Sinnaeve, G.; Lognay, G.; Mouteau, A.; Dupont, P.; Rondia, A.; Lateur, M. Non-destructive measurement of vitamin C, total polyphenol and sugar content in apples using near-infrared spectroscopy. J. Sci. Food Agric. 2013, 93, 238–244. [Google Scholar] [CrossRef]
  9. Soriano-Maldonado, A.; Hidalgo, M.; Arteaga, P.; de Pascual-Teresa, S.; Nova, E. Effects of regular consumption of vitamin C-rich or polyphenol-rich apple juice on cardiometabolic markers in healthy adults: A randomized crossover trial. Eur. J. Nutr. 2014, 53, 1645–1657. [Google Scholar] [CrossRef] [PubMed]
  10. Khanizadeh, S.; Tsao, R.; Rekika, D.; Yang, R.; Charles, M.R.; Rupasinghe, H.P.V. Journal of Food Composition and Analysis Polyphenol composition and total antioxidant capacity of selected apple genotypes for processing. J. Food Compos. Anal. 2008, 21, 396–401. [Google Scholar] [CrossRef]
  11. Hamid, A.A.; Aiyelaagbe, O.O.; Usman, L.A.; Ameen, O.M.; Lawal, A. Antioxidants. Its medicinal and pharmacological applications. J. Pure Appl. Chem. 2010, 4, 142–151. [Google Scholar]
  12. Leong, S.Y.; Oey, I. Effects of processing on anthocyanins, carotenoids and vitamin C in summer fruits and vegetables. Food Chem. 2012, 133, 1577–1587. [Google Scholar] [CrossRef]
  13. Rupasinghe, H.; Wang, L.; Huber, G.; Pitts, N. Effect of baking on dietary fibre and phenolics of muffins incorporated with apple skin powder. Food Chem. 2007, 107, 1217–1224. [Google Scholar] [CrossRef]
  14. Onyeaka, H.N.; Nwabor, O.F. Chapter 8—Green technology in food processing and preservation. In Food Preservation and Safety of Natural Products; Onyeaka, H.N., Nwabor, O.F., Eds.; Academic Press: Cambridge, MA, USA, 2022; pp. 87–118. [Google Scholar] [CrossRef]
  15. Huang, L.; Zhang, M.; Mujumdar, A.S.; Lim, R. Comparison of four drying methods for re-structured mixed potato with apple chips. J. Food Eng. 2011, 103, 279–284. [Google Scholar] [CrossRef]
  16. Sturm, B.; Vega, A.N.; Hofacker, W.C. Influence of process control strategies on drying kinetics, colour and shrinkage of air dried apples. App. Therm. Eng. 2014, 62, 455–460. [Google Scholar] [CrossRef]
  17. Vega-Gálvez, A.; Ah-Hen, K.; Chacana, M.; Vergara, J.; Martínez-Monzó, J.; García-Segovia, P.; Lemus-Mondaca, R.; Di Scala, K. Effect of temperature and air velocity on drying kinetics, antioxidant capacity, total phenolic content, colour, texture and microstructure of apple (var. Granny Smith) slices. Food Chem. 2012, 132, 51–59. [Google Scholar] [CrossRef]
  18. Martynenko, A.; Janaszek, M. Texture Changes During Drying of Apple Slices. Dry Technol. 2014, 32, 567–577. [Google Scholar] [CrossRef]
  19. Mayor, L.; Sereno, A.M. Modelling shrinkage during convective drying of food materials: A review. J. Food Eng. 2004, 61, 373–386. [Google Scholar] [CrossRef]
  20. Pedreschi, F.; León, J.; Mery, D.; Moyano, P. Development of a computer vision system to measure the color of potato chips. Food Res. Int. 2006, 39, 1092–1098. [Google Scholar] [CrossRef]
  21. Caleb, O.J.; Mahajan, P.V.; Al-Said, F.A.; Opara, U.L. Modified Atmosphere Packaging Technology of Fresh and Fresh-cut Produce and the Microbial Consequences-A Review. Food Bioprocess Technol. 2013, 6, 303–329. [Google Scholar] [CrossRef]
  22. Volpe, S.; Cavella, S.; Torrieri, E. Biopolymer Coatings as Alternative to Modified Atmosphere Packaging for Shelf Life Extension of Minimally Processed Apples. Coatings 2019, 9, 569. [Google Scholar] [CrossRef]
  23. Perez-Gago, M.B.; Serra, M.; del Río, M.A. Color change of fresh-cut apples coated with whey protein concentrate-based edible coatings. Postharvest Biol. Technol. 2006, 39, 84–92. [Google Scholar] [CrossRef]
  24. Kutyła-Olesiuk, A.; Nowacka, M.; Wesoły, M.; Ciosek, P. Evaluation of organoleptic and texture properties of dried apples by hybrid electronic tongue. Sens. Actuators B Chem. 2013, 187, 234–240. [Google Scholar] [CrossRef]
  25. Kumar, P.; Sethi, S. Influence of Modified Atmospheres on Shelf Life and Quality of Fresh-Cut Apples. J. Package Technol. Res. 2021, 5, 209–216. [Google Scholar] [CrossRef]
  26. Fang, Y.; Wakisaka, M.A. Review on the Modified Atmosphere Preservation of Fruits and Vegetables with Cutting-Edge Technologies. Agriculture 2021, 11, 992. [Google Scholar] [CrossRef]
  27. Cortellino, G.; Gobbi, S.; Bianchi, G.; Rizzolo, A. Modified atmosphere packaging for shelf life extension of fresh-cut apples. Trends Food Sci. Technol. 2015, 46, 320–330. [Google Scholar] [CrossRef]
  28. Fonseca, S.C.; Oliveira, F.A.R.; Brecht, J.K. Modelling respiration rate of fresh fruits and vegetables for modified atmosphere packages: A review. J. Food Eng. 2002, 52, 99–119. [Google Scholar] [CrossRef]
  29. Chung, H.; Moon, K. Browning characteristics of fresh-cut “Tsugaru” apples as affected by pre-slicing storage atmospheres. Food Chem. 2009, 114, 1433–1437. [Google Scholar] [CrossRef]
  30. Oliveira, M.; Abadias, M.; Usall, J.; Torres, R.; Teixidó, N.; Viñas, I. Application of modified atmosphere packaging as a safety approach to fresh-cut fruits and vegetables—A review. Trends Food Sci. Technol. 2015, 46, 13–26. [Google Scholar] [CrossRef]
  31. Mangaraj, S.; Goswami, T.K. Modified Atmosphere Packaging of Fruits and Vegetables for Extending Shelf-Life: A Review. Fresh Prod. 2009, 3, 1–31. [Google Scholar]
  32. Singleton, V.L.; Orthofer, R.; Lamuela-Raventós, R.M. [14] Analysis of total phenols and other oxidation substrates and antioxidants by means of folin-ciocalteu reagent. Methods Enzym. 1999, 299, 152–178. [Google Scholar] [CrossRef]
  33. Sudha, M.L.; Baskaran, V.; Leelavathi, K. Apple pomace as a source of dietary fiber and polyphenols and its effect on the rheological characteristics and cake making. Food Chem. 2007, 104, 686–692. [Google Scholar] [CrossRef]
  34. Odriozola-Serrano, I.; Hernandez-Jover, T.; Martin-Belloso, O. Comparative evaluation of UV-HPLC methods and reducing agents to determine vitamin C in fruits. Food Chem. 2007, 105, 1151–1158. [Google Scholar] [CrossRef]
  35. Velickova, E.; Winkelhausen, E.; Kuzmanova, S. Physical and sensory properties of ready to eat apple chips produced by osmo-convective drying. J. Food Sci. Technol. 2014, 51, 3691–3701. [Google Scholar] [CrossRef]
  36. PN-EN ISO 11136:2017-08; Analiza Sensoryczna. Metodyka. Ogólne Wytyczne Przeprowadzania Testów Hedonicznych z Konsumentami na Obszarze Kontrolowanym. Polish Committee for Standardization: Warszawa, Poland, 2017. (In Polish)
  37. PN-EN ISO 5492:2009; Analiza Sensoryczna. Terminologia. Polish Committee for Standardization: Warszawa, Poland, 2009. (In Polish)
  38. Doymaz, İ. Effect of citric acid and blanching pre-treatments on drying and rehydration of Amasya red apples. Food Bioprod. Process 2010, 88, 124–132. [Google Scholar] [CrossRef]
  39. Zotarelli, M.F.; Porciuncula, B.D.A.; Laurindo, J.B. A convective multi-flash drying process for producing dehydrated crispy fruits. J. Food Eng. 2012, 108, 523–531. [Google Scholar] [CrossRef]
  40. Mabrouk, S.B.; Benali, E.; Oueslatia, H. Experimental study and numerical modelling of drying characteristics of apple slices. Food Bioprod. Process 2012, 90, 719–728. [Google Scholar] [CrossRef]
  41. Lewicki, P.P.; Jakubczyk, E. Effect of hot air temperature on mechanical properties of dried apples. J. Food Eng. 2004, 64, 307–314. [Google Scholar] [CrossRef]
  42. Hatamipour, M.S.; Kazemi, H.H.; Nooralivand, A.; Nozarpoor, A. Drying characteristics of six varieties of sweet potatoes in different dryers. Food Bioprod. Process 2007, 85, 171–177. [Google Scholar] [CrossRef]
  43. Udomkun, P.; Nagle, M.; Argyropoulos, D.; Mahayothee, B.; Latif, S.; Müller, J. Compositional and functional dynamics of dried papaya as affected by storage time and packaging material. Food Chem. 2016, 196, 712–719. [Google Scholar] [CrossRef]
  44. Rocculi, P.; Romani, S.; Dalla Rosa, M. Evaluation of physicochemical parameters of minimally processed apples packed in non-conventional modified atmosphere. Food Res. Int. 2004, 37, 329–335. [Google Scholar] [CrossRef]
  45. Cocci, E.; Rocculi, P.; Romani, S.; Rosa, M.D. Changes in nutritional properties of minimally processed apples during storage. Postharvest Biol. Technol. 2006, 36, 265–271. [Google Scholar] [CrossRef]
  46. Farris, S.; Gobbi, S.; Torreggiani, D.; Piergiovanni, L. Assessment of two different rapid compression tests for the evaluation of texture differences in osmo-air-dried apple rings. J. Food Eng. 2008, 88, 484–491. [Google Scholar] [CrossRef]
  47. Rizzolo, A.; Vanolia, M.; Cortellino, G.; Spinelli, L.; Torricelli, A. Quality characteristics of air-dried apple rings: Influence of storage time and fruit maturity measured by time-resolved reflectance spectroscopy. Procedia Food Sci. 2011, 1, 216–223. [Google Scholar] [CrossRef]
  48. Ward, G. Modified Atmosphere Packaging for Extending Storage Life of Fresh Fruits and Vegetables. In Reference Module in Food Science; Elsevier: Amsterdam, The Netherlands, 2016. [Google Scholar] [CrossRef]
  49. Moreno, J.; Simpson, R.; Pizarro, N.; Pavez, C.; Dorvil, F.; Petzold, G.; Bugueño, G. Influence of ohmic heating/osmotic dehydration treatments on polyphenoloxidase inactivation, physical properties and microbial stability of apples (cv. Granny Smith). Innov. Food Sci. Emerg. Technol. 2013, 20, 198–207. [Google Scholar] [CrossRef]
  50. Wang, S.Y. Fruits with high antioxidant activity as functional foods. In Functional Food Ingredients and Nutraceuticals: Processing Technologies; Shi, J., Ed.; Taylor & Francis Group: Boca Raton, FL, USA, 2007; pp. 371–413. [Google Scholar] [CrossRef]
  51. Lavelli, V.; Vantaggi, C. Rate of antioxidant degradation and color variations in dehydrated apples as related to water activity. J. Agric. Food Chem. 2009, 10, 4733–4738. [Google Scholar] [CrossRef] [PubMed]
  52. Bennett, L.E.; Jegasothy, H.; Konczak, I.; Frank, D.; Sudhamarajan, S.; Clingeleffer, P.R. Total phenolics and anti0oxidant properties of selected dried fruits and relationships to drying conditions. J. Funct. Foods 2011, 3, 115–124. [Google Scholar] [CrossRef]
  53. Leeratanarak, N.; Devahastin, S.; Chiewchan, N. Drying kinetics and quality of potato chips undergoing different drying technics. J. Food Eng. 2006, 77, 635–643. [Google Scholar] [CrossRef]
  54. Chang, S.K.; Alasalvar, C.; Shahidi, F. Review of dried fruits: Phytochemicals, antioxidant efficacies, and health benefits. J. Funct. Foods 2016, 21, 113–132. [Google Scholar] [CrossRef]
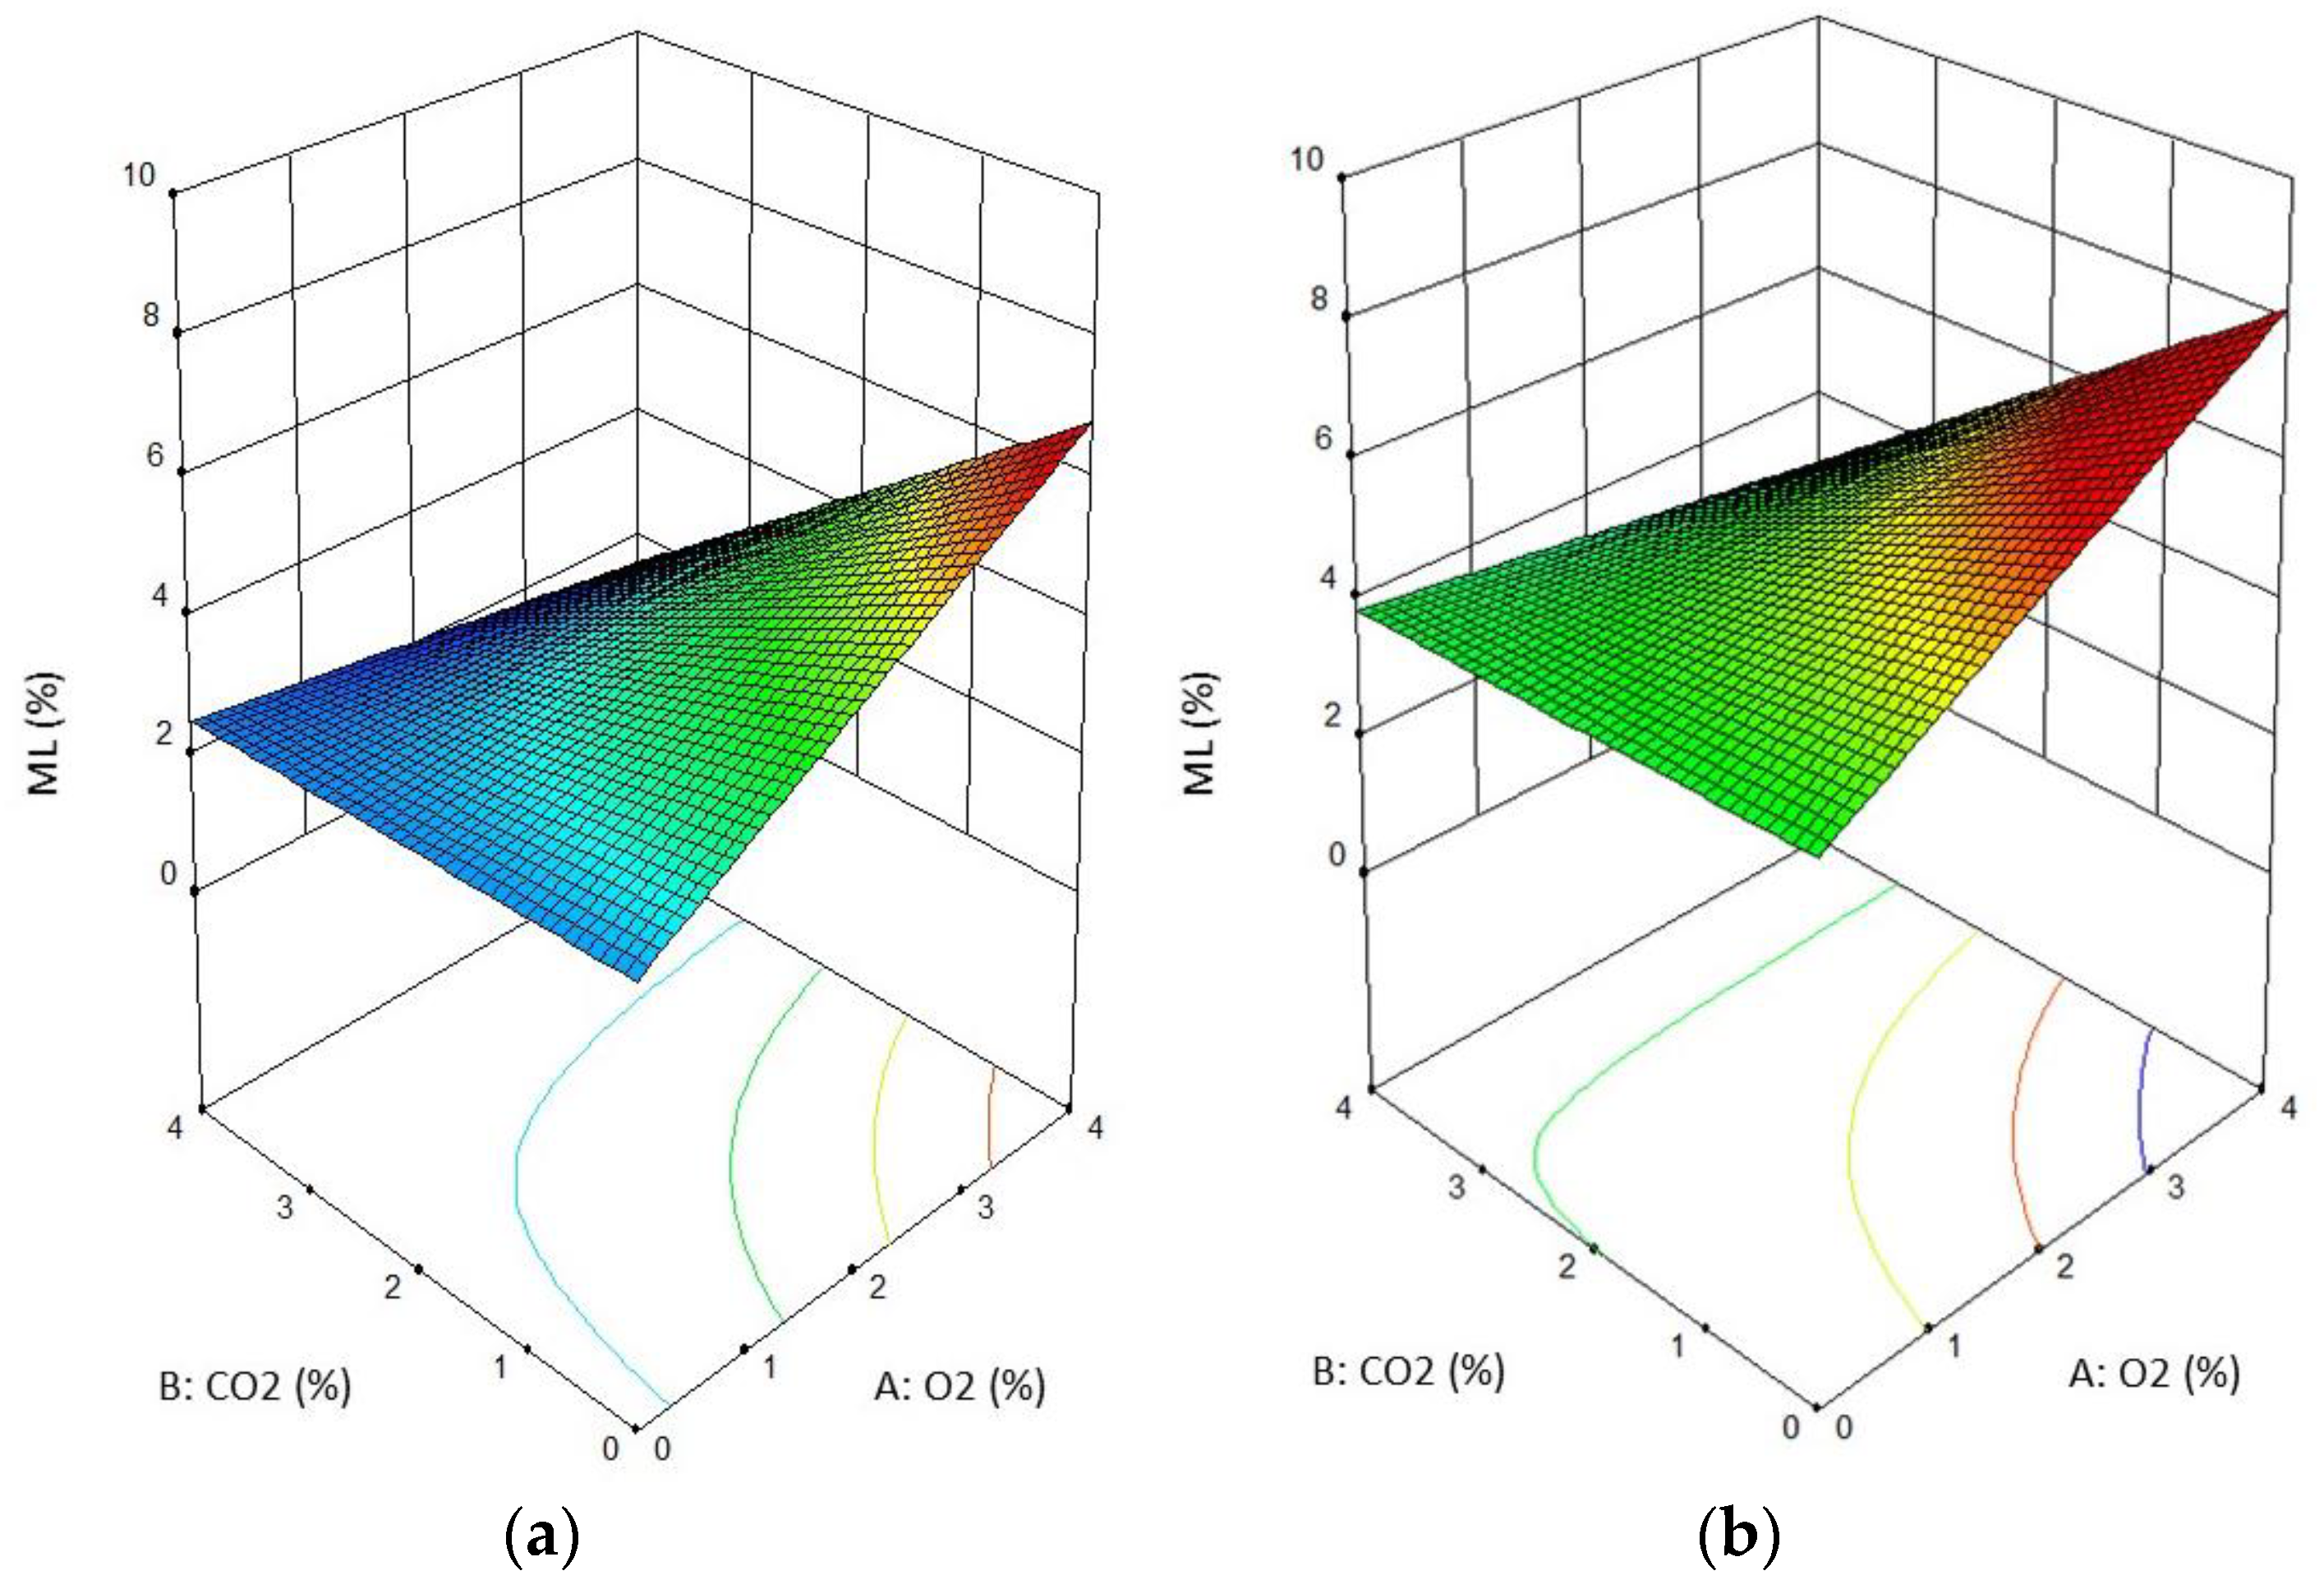
Figure 1. Response surface of ML of dried apple slices stored (a) 15 days, (b) 30 days in the atmosphere with different O2 (factor A) and CO2 (factor B) concentrations. Lower values on the color scale appear in blue and green, transitioning through yellow and orange to red for the highest ML. Contour line colors indicate ML levels, changing with the gradient at the graph’s edges.
Applsci 15 02832 g001
Figure 2. Response surface of the hardness of dried apple slices stored (a) 15 days, (b) 30 days in the atmosphere with different O2 (factor A) and CO2 (factor B) concentrations. Lower values on the color scale appear in blue and green, transitioning through yellow and orange to red for the highest hardness. Contour line colors indicate hardness levels, changing with the gradient at the graph’s edges.
Applsci 15 02832 g002
Figure 3. Response surface of L*, BI, and ΔE of dried apple slices stored, respectively: (a,c,e) 15 days, (b,d,f) 30 days in the atmosphere with different O2 (factor A) and CO2 (factor B) concentrations. Lower L* values on the color scale appear in light blue and green, transitioning through yellow to orange for the highest L*. Lower BI values on the color scale appear in blue, transitioning through light blue to green (15-day storage) or yellow (30-day storage) for the highest BI. Lower ΔE values on the color scale appear in blue, transitioning through light blue to green (15-day storage) or transitioning through green to red (30-day storage) for the highest ΔE. Contour line colors indicate L*, BI, and ΔE levels, changing with the gradient at the graph’s edges.
Applsci 15 02832 g003
Figure 4. Response surface of the total phenols and vitamin C of dried apple slices stored, respectively: (a,c) 15 days, (b,d) 30 days in the atmosphere with different O2 (factor A) and CO2 (factor B) concentrations. Lower values on the color scale appear in blue, transitioning through light blue to green for the highest TPC in water extract and vitamin C content. Contour line colors indicate TPC in water extract and vitamin C content levels, changing with the gradient at the graph’s edges.
Applsci 15 02832 g004
Figure 5. Response surface of overall quality of dried apple slices stored (a) 15 days, (b) 30 days in the atmosphere with different O2 (factor A) and CO2 (factor B) concentrations. Lower values on the color scale appear in blue or light blue, transitioning through green and yellow to red for the highest overall quality. Contour line colors indicate overall quality levels, changing with the gradient at the graph’s edges.
Applsci 15 02832 g005
Table 1. Mean and standard deviation of chosen parameters of fresh apples.
Mean ± SD
Dry Basis (%)16.03 ± 1.72
Reflective index (°Brix)14.23 ± 1.16
Acidity (mEq NaOH/100 g)10.54 ± 0.93
Vitamin C content (mg/100 g dry basis)64.26 ± 1.45
Total phenols content in water extract (mg/g dry basis)71.12 ± 2.02
Table 2. The verification of the model with the measured values of mass loss (ML), hardness, L*, browning index (BI), ΔE, total phenols content (TPC), vitamin C content, and overall quality of apple chips stored 15 and 30 days.
O2 (%)CO2 (%)Storage Period (d) ML (%)Hardness (N)L*
(%)
BIΔETPC
(mg/g Dry Basis)
Vitamin C Content (mg/100 g Dry Basis)Overall Quality
2.6633.78515C *2.085.1875.4940.465.1841.2253.787.64 a
M **2.025.1275.8840.905.2441.6753.678.26 b
30C3.596.3274.6842.884.4641.0253.425.86 a
M3.686.4775.0243.164.5841.5553.256.25 b
*—calculated, **—measured; (a, b)—different letters show a significant difference (p < 0.05).
Disclaimer/Publisher’s Note: The statements, opinions and data contained in all publications are solely those of the individual author(s) and contributor(s) and not of MDPI and/or the editor(s). MDPI and/or the editor(s) disclaim responsibility for any injury to people or property resulting from any ideas, methods, instructions or products referred to in the content.