1. Introduction
Observing meteors is vital for studying interplanetary bodies, providing key information about their size, structure, and chemical composition. Precise analyzes of light curves, which represent the time-varying brightness of meteors, provide an important tool for understanding the ablation processes occurring during their passage through the atmosphere [
1,
2,
3,
4].
Although meteors are short-lived phenomena characterized by variable brightness and rapid movement across the sky, technological developments have made it possible to create global observation networks. These networks use inexpensive, light-sensitive video cameras, which have contributed significantly to advances in meteor measurements [
5,
6,
7,
8]. A number of software packages have also been developed for analyzing meteor video data, including photometric data reduction [
9,
10]. Nevertheless, the traditional camera imaging approach has its limitations. For example, CCD/CMOS images of meteors can be ambiguous: accurately reproducing brightness changes based solely on individual pixels is often problematic (see [
11] and the references therein).
Moreover, using CCD/CMOS cameras in high-speed mode can generate vast amounts of data overnight, leading to high storage and analysis costs. It is worth mentioning that the number of bright meteors observable during a night is typically small. On the other hand, CCD/CMOS pixels have limited charge capacity, making it nearly impossible to measure the full range of meteor brightness accurately [
12]. To maintain high pixel sensitivity, camera gain must be increased, which results in the saturation of pixels during the observation of bright meteors (so-called bolides).
In recent years, there has been a significant increase in the number of satellites placed in Earth’s orbit, driven by the development of space technology and the growing demand for satellite communications, Earth observations, and scientific space experiments. Unfortunately, this trend also presents challenges for astronomical observations. Satellites often produce “flares” or “glints”—reflections of sunlight that can be mistaken for meteors in CCD/CMOS images [
13]. This phenomenon causes false detections and poses challenges for scientists analyzing night-sky images. As the number of satellites grows almost exponentially, the problem of false detections becomes increasingly significant, particularly in meteor imaging.
This paper presents an innovative approach to meteor observations using photodiode-based detectors. These detectors allow rapid recording of brightness changes at a frequency of 100 Hz, offering deeper insight into the dynamics of meteors. The proposed system can avoid false detections produced by CCD/CMOS systems, which result from overflying satellites or other objects that create streaks mimicking meteors. Moreover, the storage space needed for the photodiode’s one-dimensional data is markedly smaller than for camera-based systems. This solution has the potential to become a valuable addition to existing meteor stations, offering new opportunities to better understand the nature of interplanetary meteoroids and their passage through Earth’s atmosphere.
This paper is organized as follows. In
Section 2, we review and evaluate previously proposed concepts and implementations of photometers designed for meteor observations.
Section 3 presents our device concept in detail, including its electronic circuits and the measured noise characteristics.
Section 4 describes the preliminary observation results obtained on 11–12 August 2023. Finally, we discuss these initial findings in
Section 5 and draw our conclusions in
Section 6.
2. Existing Instruments
A review of the current literature reveals several conference papers relevant to this study. For instance, in [
14], the authors developed a device for radiometric data acquisition with a large dynamic range (meteor apparent magnitues within [−4, −20]) and a sampling frequency of 1000 samples per second. This setup employs a single Hamamatsu S1337-1010BR photodiode (Hamamatsu Corporation, Bridgewater, NJ, USA) with a 100 mm
2 photosensitive area, a spectral response range of 340–1100 nm, and a peak at 960 nm. A logarithmic converter ADL5304 by Analog Devices (Norwood, MA, USA), interfaced with a 24-bit resolution sigma-delta A/D converter, ADS1255 (Texas Instruments, Dallas, TX, USA), was used to amplify the photodiode signal. However, the authors did not include an electrical schematic. The device’s operation was tested only through the acquisition of radiometric data from a single event lasting 0.9 s without simultaneous camera imaging. This limitation prevents correlating the recorded time sequence with the actual event, which is crucial given the high variability and peaks observed in the data (suggested to be from multiple successive strikes). Additionally, the authors attributed the 50 Hz oscillations in their data to streetlight illumination, but these could also result from measurement path disturbances (e.g., poor voltage filtering, external interference, lack of shielding). The absence of a time sequence with the photodiode fully covered is a missed opportunity to analyze the system’s intrinsic noise sources and values, essential in such applications. Despite these issues, the authors expressed hope for further development of this intriguing initial prototype in their conclusion.
Another solution presented in a conference paper should be regarded as a description of the challenges encountered during the development of a large dynamic range and very fast radiometer [
15]. The system employed 16 cheap BPW34 photodiodes, each with a radiant sensitive area of 7.5 mm
2. These diodes were divided into four groups, with each group containing four elements connected in parallel. Transimpedance amplifiers were used to convert the current from each group. Subsequently, the output signals from the four transimpedance amplifiers were summed using an operational amplifier with a fixed gain, operating in an inverting configuration.
In the final part of their paper, the authors emphasize that the radiometer is still under development, primarily due to the low signal-to-noise ratio. They suggest that more effective isolation between the analog and digital parts of the system could be a solution. While this is true, the influence of noise from components such as resistors, photodiodes, and operational amplifiers cannot be overlooked in such designs. The presented solution is suboptimal in this regard. In each of the four channels, 10 M
resistors were used to convert the photodiode current to voltage. Importantly, the thermal noise of these resistors is typically the dominant component (see
Section 3.3). Given that this multi-channel system sums the output signals of each transimpedance amplifier, the noise characteristics of the solution are very unfavorable (it is unfortunate that the output signal with complete darkness was not presented, as it could shed light on this issue). Additionally, it is worth noting that the system has a fixed gain, which adversely affects the ability to observe low-intensity phenomena (while high gain increases sensitivity, it leads to the saturation of the output amplifier, a problem discussed in
Section 3.2).
The potential for building a low-cost system for radiometric observations of meteors is the focus of another conference paper by [
16]. This case involves an early-stage prototype. The device uses a single BPW34 photodiode, an Arduino Uno board, a data acquisition module board with a 16-bit A/D converter (AD7705), and a simple transimpedance amplifier based on the LMC6462 component (Texas Instruments, Dallas, TX, USA). The primary drawback of this device is the need to adjust the gain, set via a potentiometer, according to observational conditions. This approach is impractical as it requires constant human supervision. Additionally, each adjustment of the potentiometer necessitates recalibration to ensure the results provide useful information about the intensity of the phenomenon.
Several design errors were found. Firstly, using a potentiometer in a sensitive measurement path is not recommended, as the potentiometer wiper bouncing along the resistive track while being adjusted introduces noise spikes. Secondly, the amplifier lacks filters to limit gain, causing the system to amplify unwanted signals and have a tendency to oscillate. Thirdly, the quality of the power supply is crucial in sensitive measurement systems. While battery power was used for the transimpedance amplifier to address this issue, the power supply for the A/D converter module was neglected. According to the schematic, it is powered from the Arduino Uno’s +5 V line. Optimal performance of the converter requires extensive power supply filtering, appropriate PCB trace routing, and separation of analog and digital grounds, which were not implemented. This omission likely results from using pre-made modules connected with wires rather than a dedicated PCB.
The authors also failed to provide convincing evidence of the device’s proper functioning. No synchronous recording of the device’s output signal and camera images was achieved, despite attempts. The only tests conducted, such as moving a hand in front of the sensor, have limited practical significance. It is regrettable that a basic test under conditions of complete photodiode darkness was not performed, as it is simple to execute and provides valuable information about the system’s parameters.
The efforts of the authors in towards creating a more advanced device are noteworthy [
17]. The radiometer consists of nine photodiodes, grouped in three triplets. In every triplet, three BPW34 photodiodes are used, each with its own transimpedance amplifier. An operational amplifier in a non-inverting configuration is used to sum the signals from the individual channels, with its gain manually set via a potentiometer. Thus, the significant drawback of the previous version remains unresolved (though the authors mention that they plan to introduce automatic gain control in the next version).
A crucial and beneficial change is the implementation of digital filtering to improve signal quality. However, it is unfortunate that these actions were not preceded by a deeper analysis of the analog section. By optimizing for noise and adding additional filtering, the signal-to-noise ratio (SNR) could be improved even before signal sampling. Importantly, this time the authors verified the device’s performance by comparing the radiometric signal of fireballs with their photometric light curves.
The topic of building an all-in-one camera and radiometer system for meteor surveillance is also addressed in a master’s thesis [
18]. This comprehensive work includes not only a description of the hardware and software components but also a detailed analysis of the Bolide Event on 13 April 2021, which occurred between Florida and Grand Bahama Island.
Evaluating this work is challenging because the event was recorded using an early version of the radiometer, which, as stated by the author, did not meet the expected standards. Due to insufficient data recording speed, a large gap was observed in the recorded signal. Additionally, the output signal was characterized by an unacceptable level of noise and interference because this earlier radiometer build was unable to filter out light pollution from various sources, as well as circuit noise. Consequently, the obtained radiometric data hold little value.
Importantly, the thesis attempts to address these issues. A new version of the radiometer was proposed and implemented. However, the master’s thesis does not present results of the radiometer’s performance in the presence of a bolide. Only descriptions of tests conducted in a darkroom setup are provided.
In summary, the current instrumental solutions in the field of meteor radiometry are either in the developmental stage or suffer from significant flaws due to the neglect of best practices in the construction of sensitive analog electronic systems. Additionally, many have not been verified with a substantial number of confirmed meteor events, limiting their observations to only a few occurrences. This creates an opportunity for proposing new, improved instruments that should be tested on a significant number of events, with simultaneous video recordings to confirm the presence of meteors at the observed times. Only through such comprehensive testing and verification can we establish the reliability and effectiveness of these instruments.
3. Concept
In this chapter, we will present the general concept of the sensor used for meteor observation. The presented device is designed to complement existing CCD/CMOS meteor observation systems by functioning as an all-sky, high-speed photometer. The one-dimensional brightness data it produces require significantly less storage compared to standard CCD/CMOS imagery, enabling simultaneous data acquisition alongside camera recordings. Furthermore, its relatively low cost makes it an attractive option for straightforward integration into already operational meteor CCD/CMOS-based stations. Rather than replacing traditional imaging approaches, the device supplements them by providing continuous photometric data that can aid in event classification and enhance the overall accuracy of meteor observations.
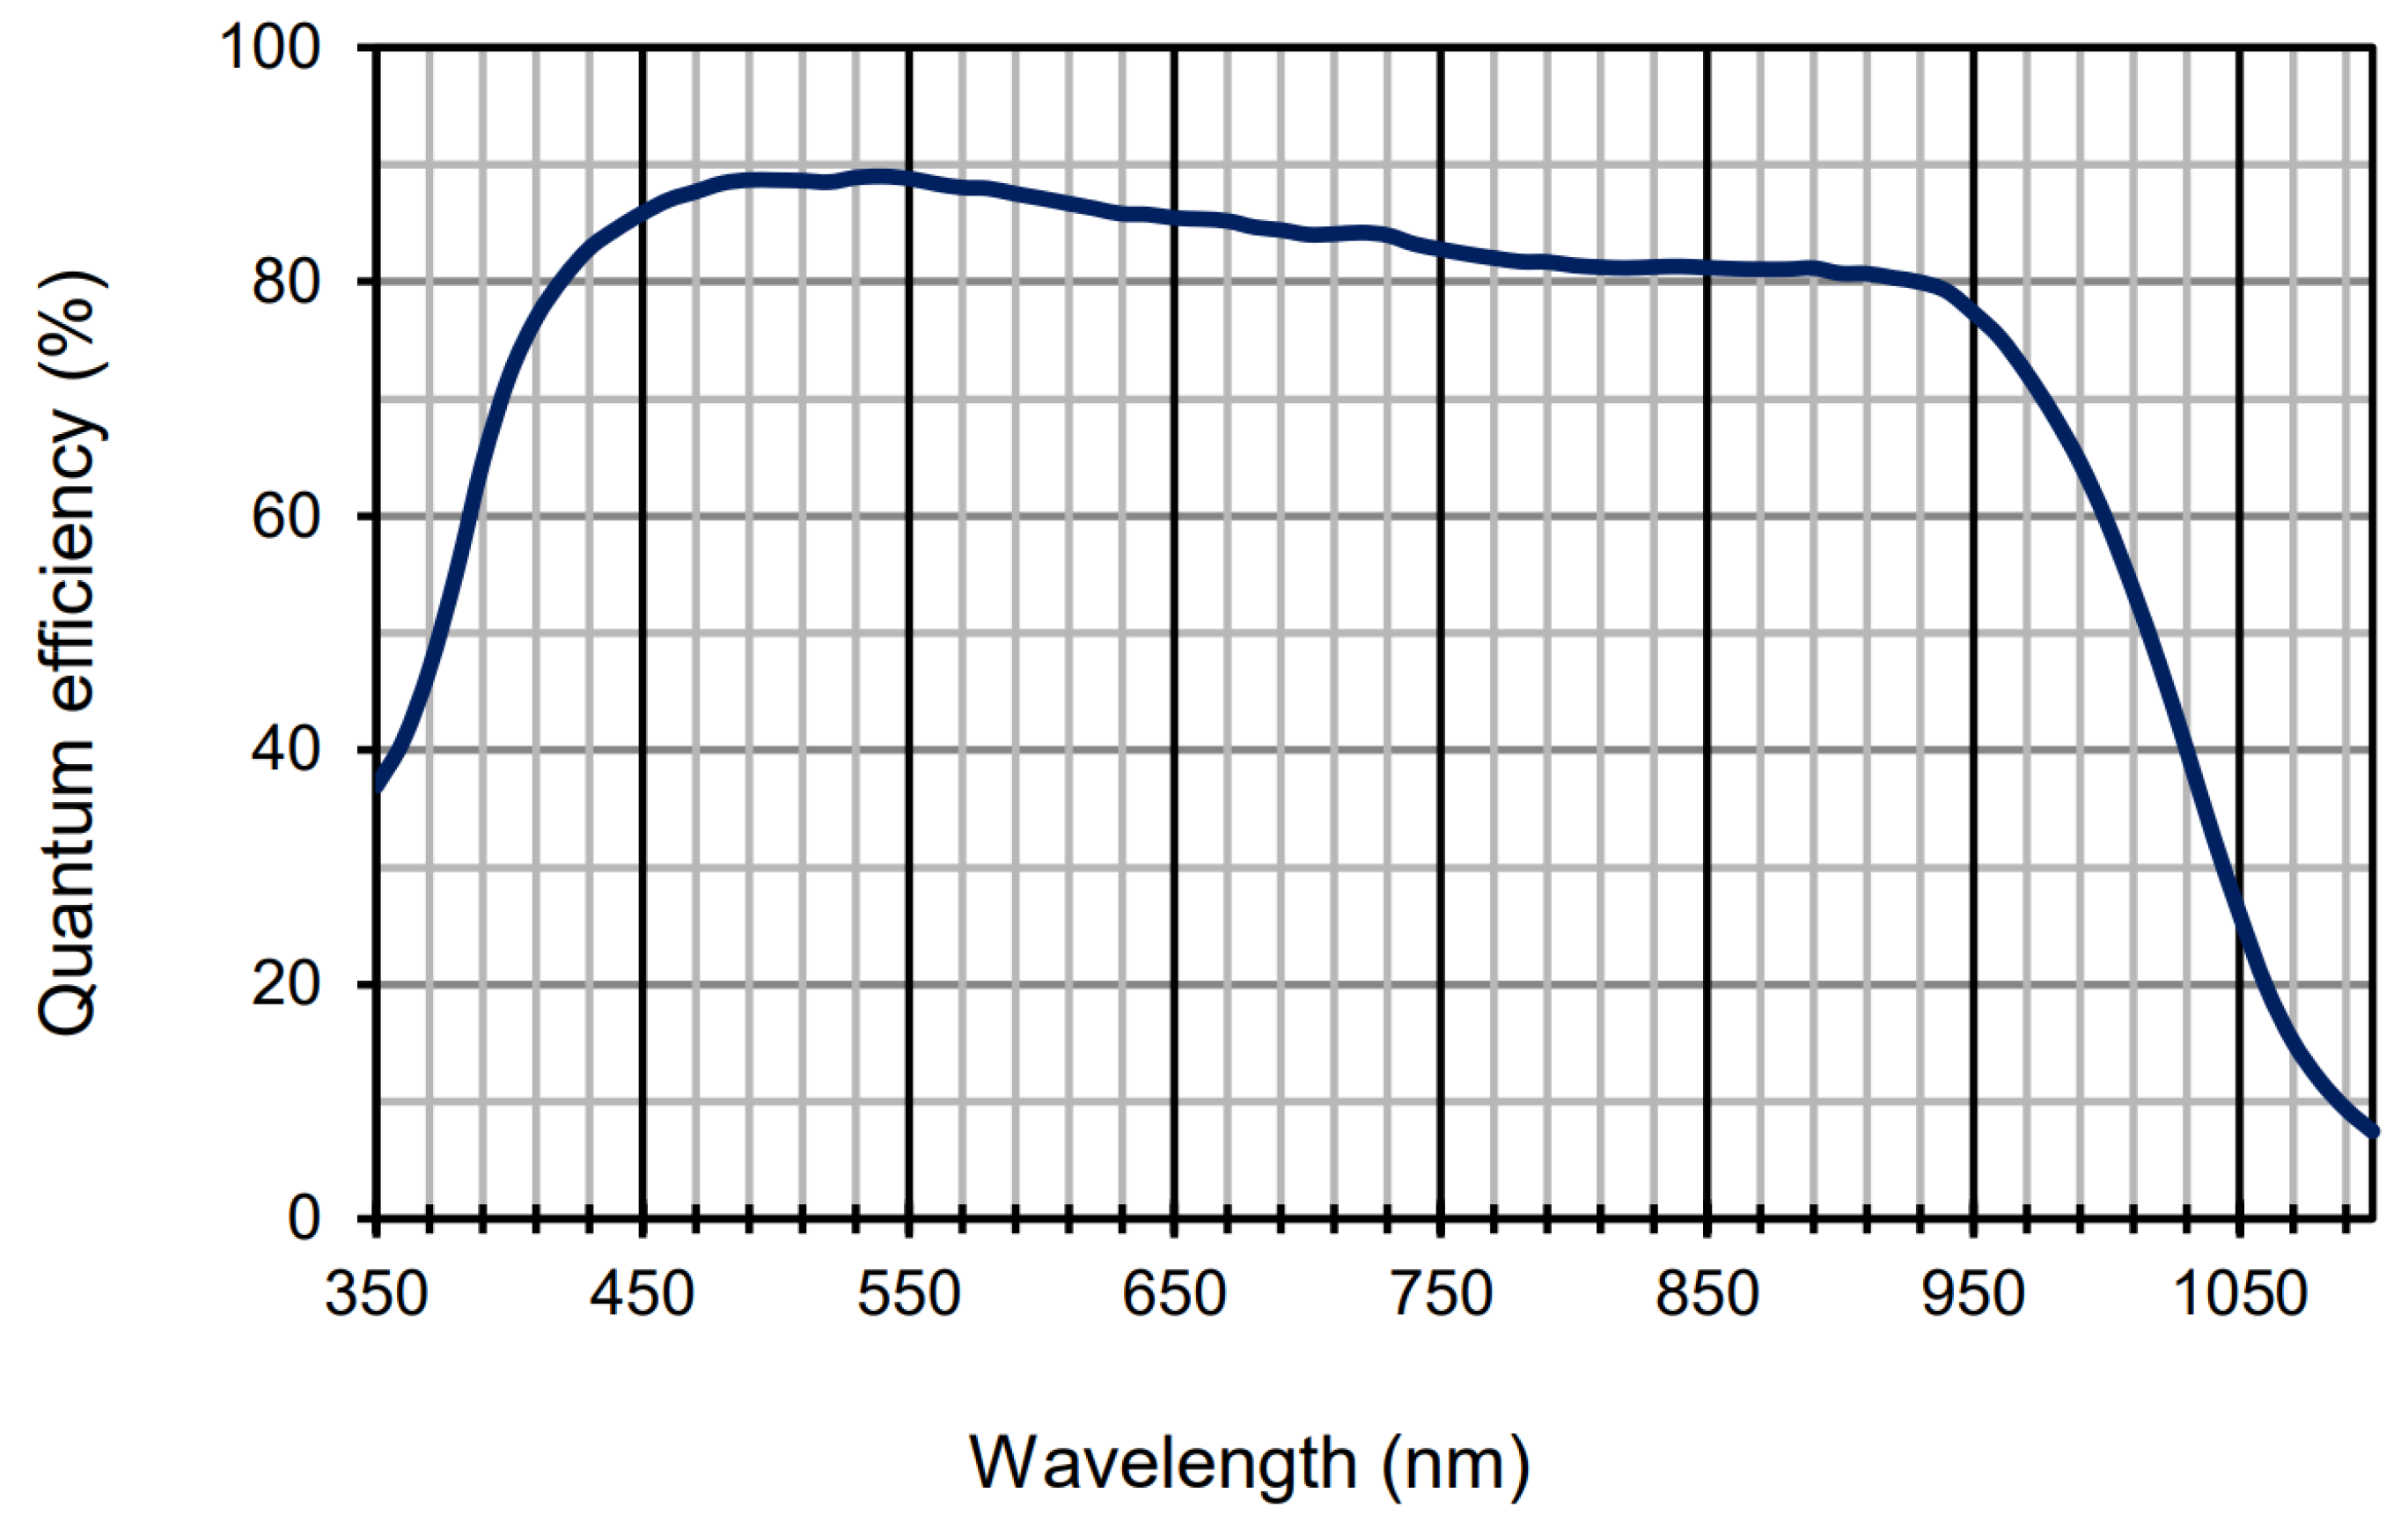
The key sensing element is the PS100-6b photodiode (TE Connectivity
https://eu.mouser.com/datasheet/2/418/9/PS100_6_THD_3001054-3304769.pdf, accessed date: 2 March 2025). It features a 10 mm × 10 mm light-collecting area and, according to the manufacturer’s specifications, achieves up to 90% quantum efficiency with a low dark current.
Table 1 presents the main device parameters taken directly from the datasheet, while
Figure 1 shows the typical spectral sensitivity as provided by the manufacturer.
The meteor detection system we designed utilizes photodiodes facing the zenith to allow light to fall directly upon them without the use of additional lenses. This approach is both judicious and advantageous for several reasons. Firstly, the primary objective of our sensors is not to create images but to record fluctuations in light intensity from the night sky. In this context, the collecting area of the sensor is crucial, determining its capability to detect faint light sources. Using short focal-length lenses (e.g., 2–3 mm) would significantly reduce the photodiode’s effective collecting area. Even for lenses with a high brightness (e.g., F# = 1), the lens’s collecting area would be incomparably smaller than that of a 10 mm × 10 mm in our photodiodes. Secondly, wide-angle lenses with very short focal lengths and large collecting areas tend to be costly. Our aim is to increase the number of detectors while maintaining the affordability of each module, making cost-effectiveness a priority.
Each photodiode is connected to an operational amplifier, which converts the small currents (pico amperes) generated by the diode into voltages. Each module, consisting of a diode and two operational amplifiers, was placed on an independent PCB. The design of these boards was intended to minimize any kind of noise given the extremely small currents generated by the diode when recording the night sky.
Four independent photodiode-amplifier modules are connected to a single ADuC7020 microcontroller (Analog Devices, Norwood, MA, USA). Voltages from each module are sampled at 2000 Hz in a multiplexed manner, digitized (12-bit) by an ADC, digitally filtered in real time, then decimated to 100 Hz, and finally sent to a computer via RS232.
The decision to use four modules in our observation system was based on several key considerations. First and foremost, the use of four independent modules allowed us to carefully examine the nature of the observed signals and distinguish between authentic signals coming from the sky and the noise generated by the sensors themselves. If all four modules record almost identical correlations during observations, the influence of the sensor’s own noise can be considered minimal or even negligible, since this noise, being an independent phenomenon for individual modules, would not be correlated between the modules. In addition, the use of four modules allows verification that the observed light impulse is not the result of the registration of a high-energy particle, also known as a cosmic ray. This type of event is generally detected by only one of the sensors and would be a source of false detections if only a single module was used.
Second, we plan to use three of the four modules for observations with optical filters in different spectral ranges, related to the presence of three main elements in meteors: magnesium, sodium, and calcium [
19]. The fourth module will be used for broadband observations without filtering, showing the highest sensitivity to fainter meteors. Moreover, this wide-band signal will be used to confirm or reject phenomena observed in the other wavelengths. This configuration should allow us to analyze the signals in a more complex way and gain a deeper understanding of the observed phenomena. Such experiments are planned for the next years of research activity as the module will be sent to our remote station in Spain.
Another argument for using four modules is the specification of the ADuC7020 microcontroller used, which allows the connection of up to four sources of analog signals and perform multiplexed sampling. Thanks to this, we can efficiently and economically manage data from different modules while maximizing the capabilities of our observation unit.
Our system is equipped with an ASI ZWO 178MM camera (Suzhou ZWO Co., Ltd., Suzhou, China) with a 2.5 mm fisheye lens, which allows 360-degree image recording. Taking exposures of 60 s, this camera serves as a verification unit for the meteor light pulses recorded by the photodiode modules. The camera is connected to an Intel NUC computer via a USB interface and operated with use of Python (version 3.8) script incorporating ASI ZWO libraries. The images from the camera and the data transferred from photodiode modules are received and synchronized by Python script running on Intel NUC to keep maximal correlation of both data types.
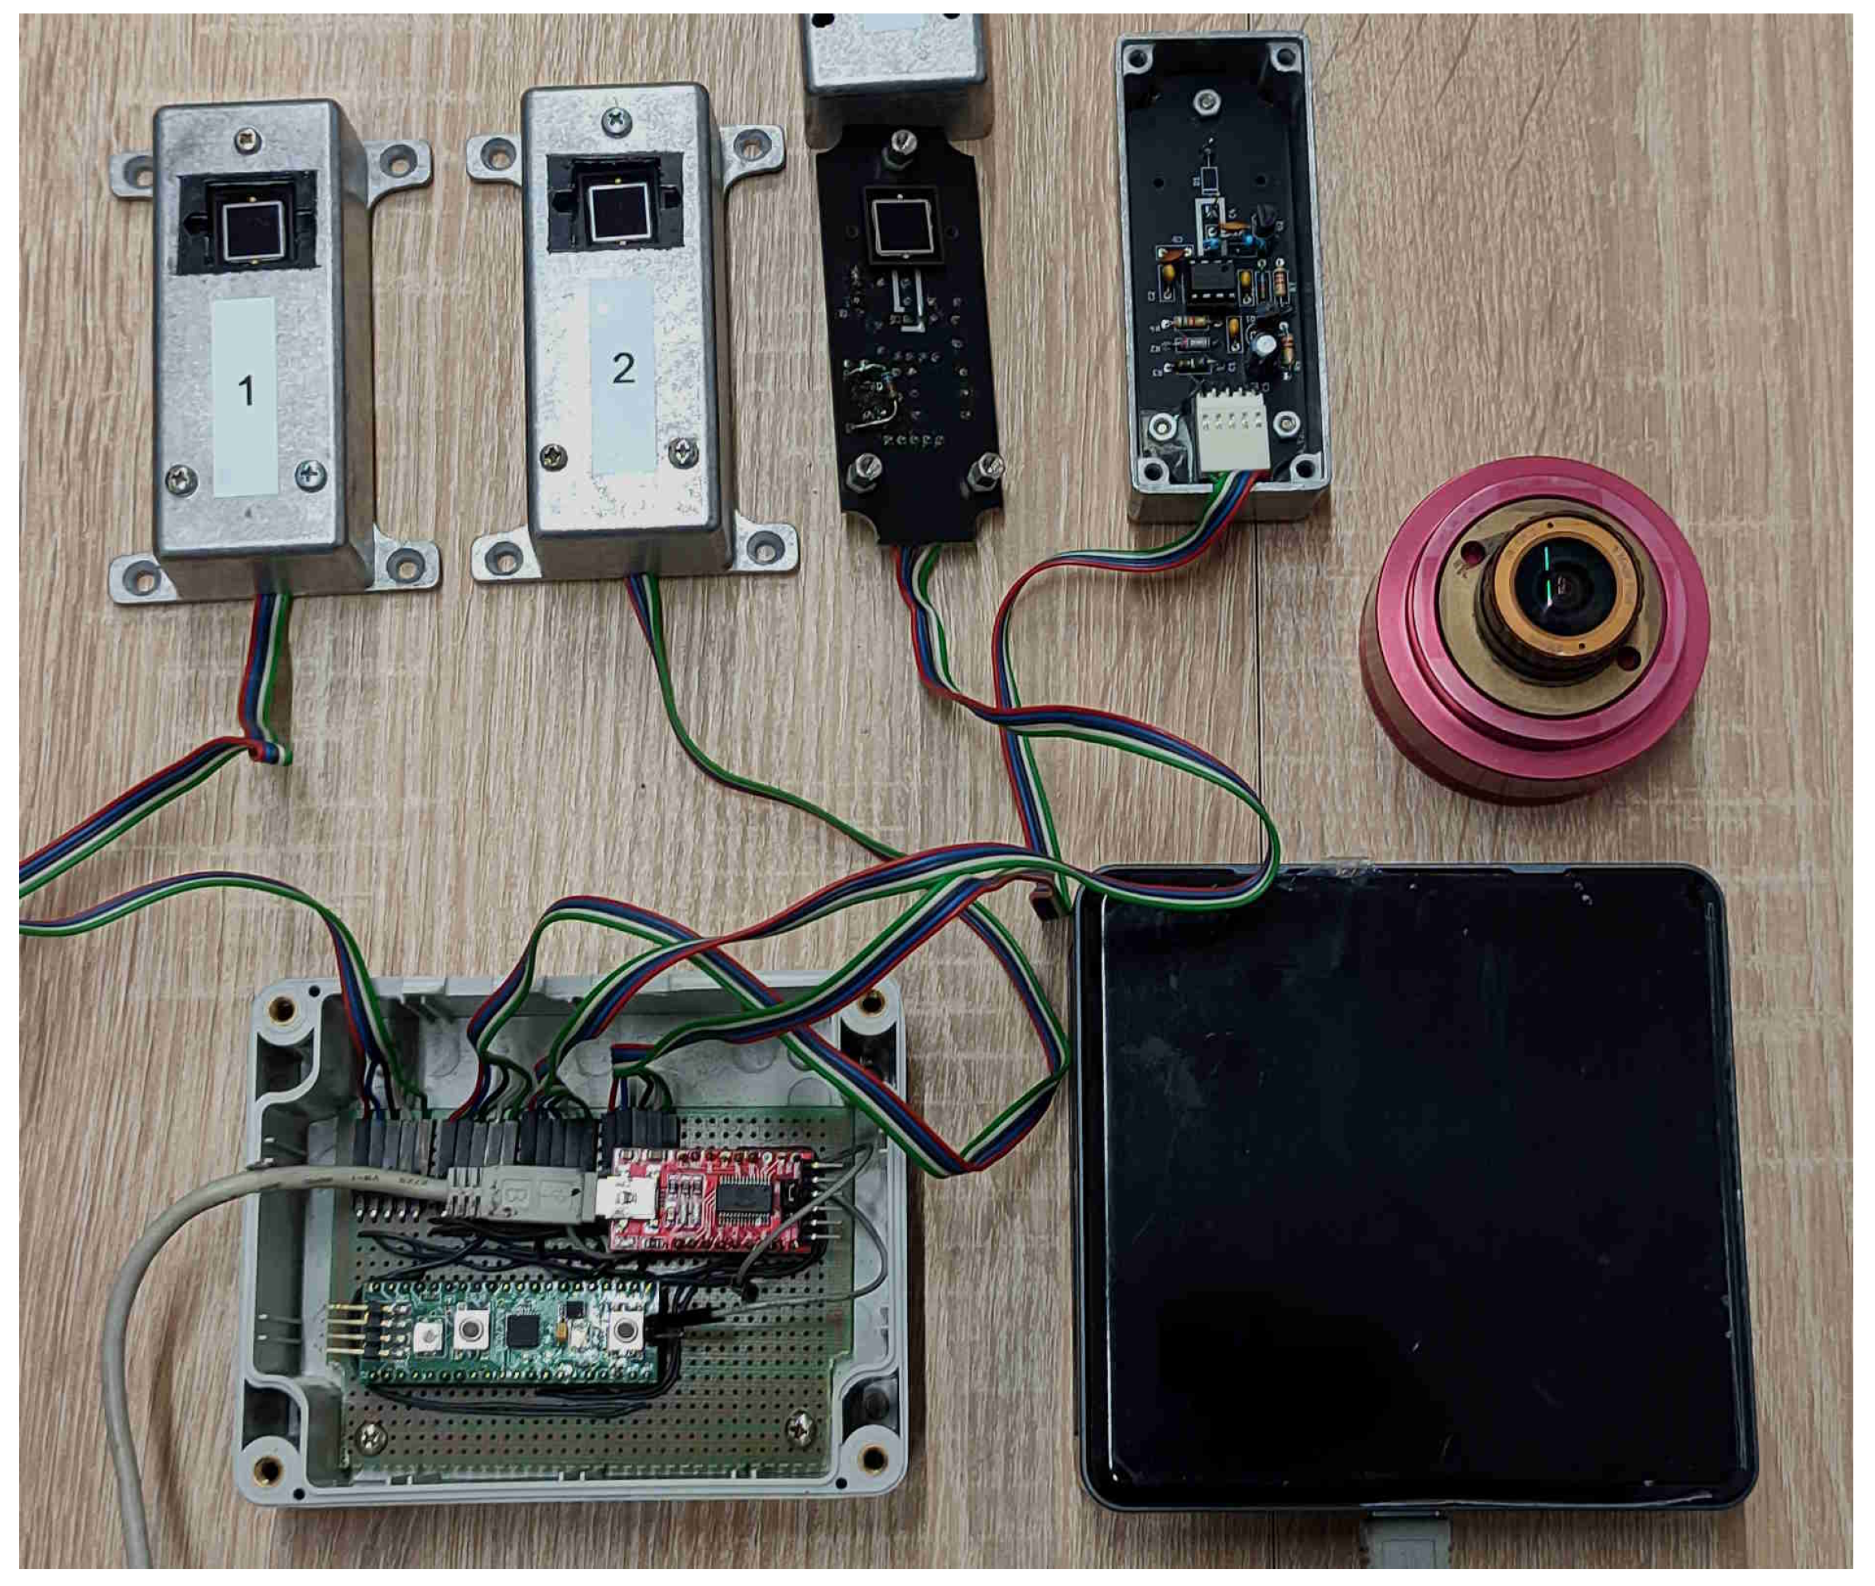
The entire system, including the photodiode modules, camera, all electronics, and Intel NUC, was housed in a specially constructed box. This box is equipped with a system for ventilating and heating the components to prevent dew from settling on the components. It also has a large window made of BK-7 glass, allowing light to reach both the photodiodes and the camera. The small housings for the individual diode modules have also windows (BK-7 glass) of about 20 mm × 20 mm through, which light can reach a photodiode. All four modules and the camera are placed horizontally, with the camera and photodiodes directed to the zenith. The system with the main elements extracted from the housing and opened to reveal the interiors is presented in
Figure 2.
3.1. Electronic Circuits
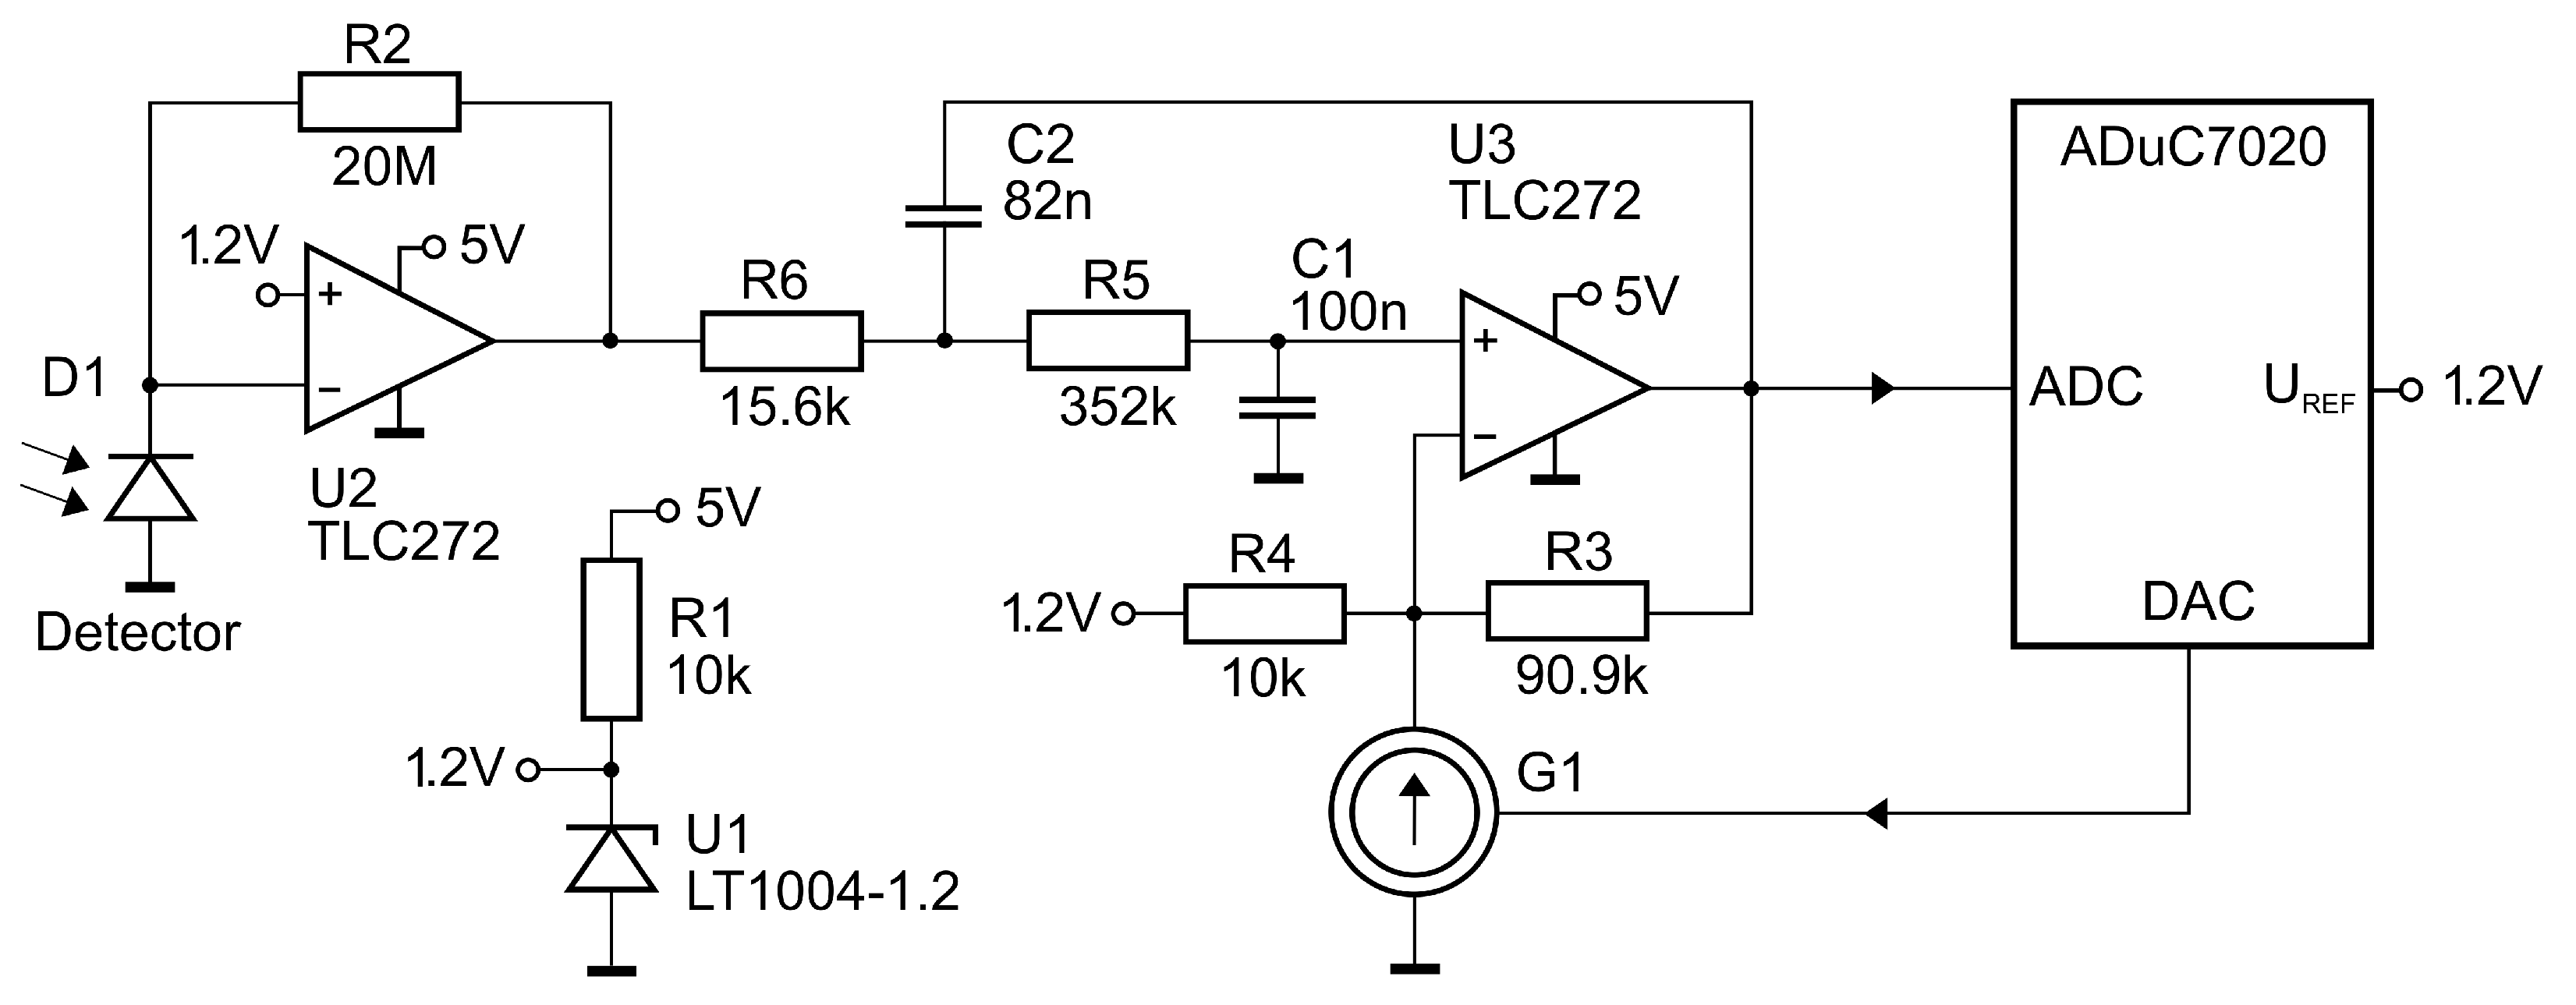
The detector was built based on a small dark current (1 nA) photodiode of the PS100-6b type, shown as a D1 element in
Figure 3. The detector circuit is made up of a transimpedance amplifier, an analog anti-aliasing filter based on an amplifier, and a digital signal processing circuit in an ADuC7020 microcontroller. The detector schematic is shown in
Figure 3. The transimpedance amplifier was realized classically on a TLC272 operational amplifier marked on
Figure 3 as U2, which converts the photodiode current to a voltage on a resistor of 20 M
. The resistor was chosen to ensure that the U2 amplifier is not saturated under typical nighttime conditions. The diode (detector) was polarized with a reverse voltage of 1.2 V, which provides a small junction capacitance and thus a higher response rate (a circuit with U1 diode produces this 1.2 V voltage).
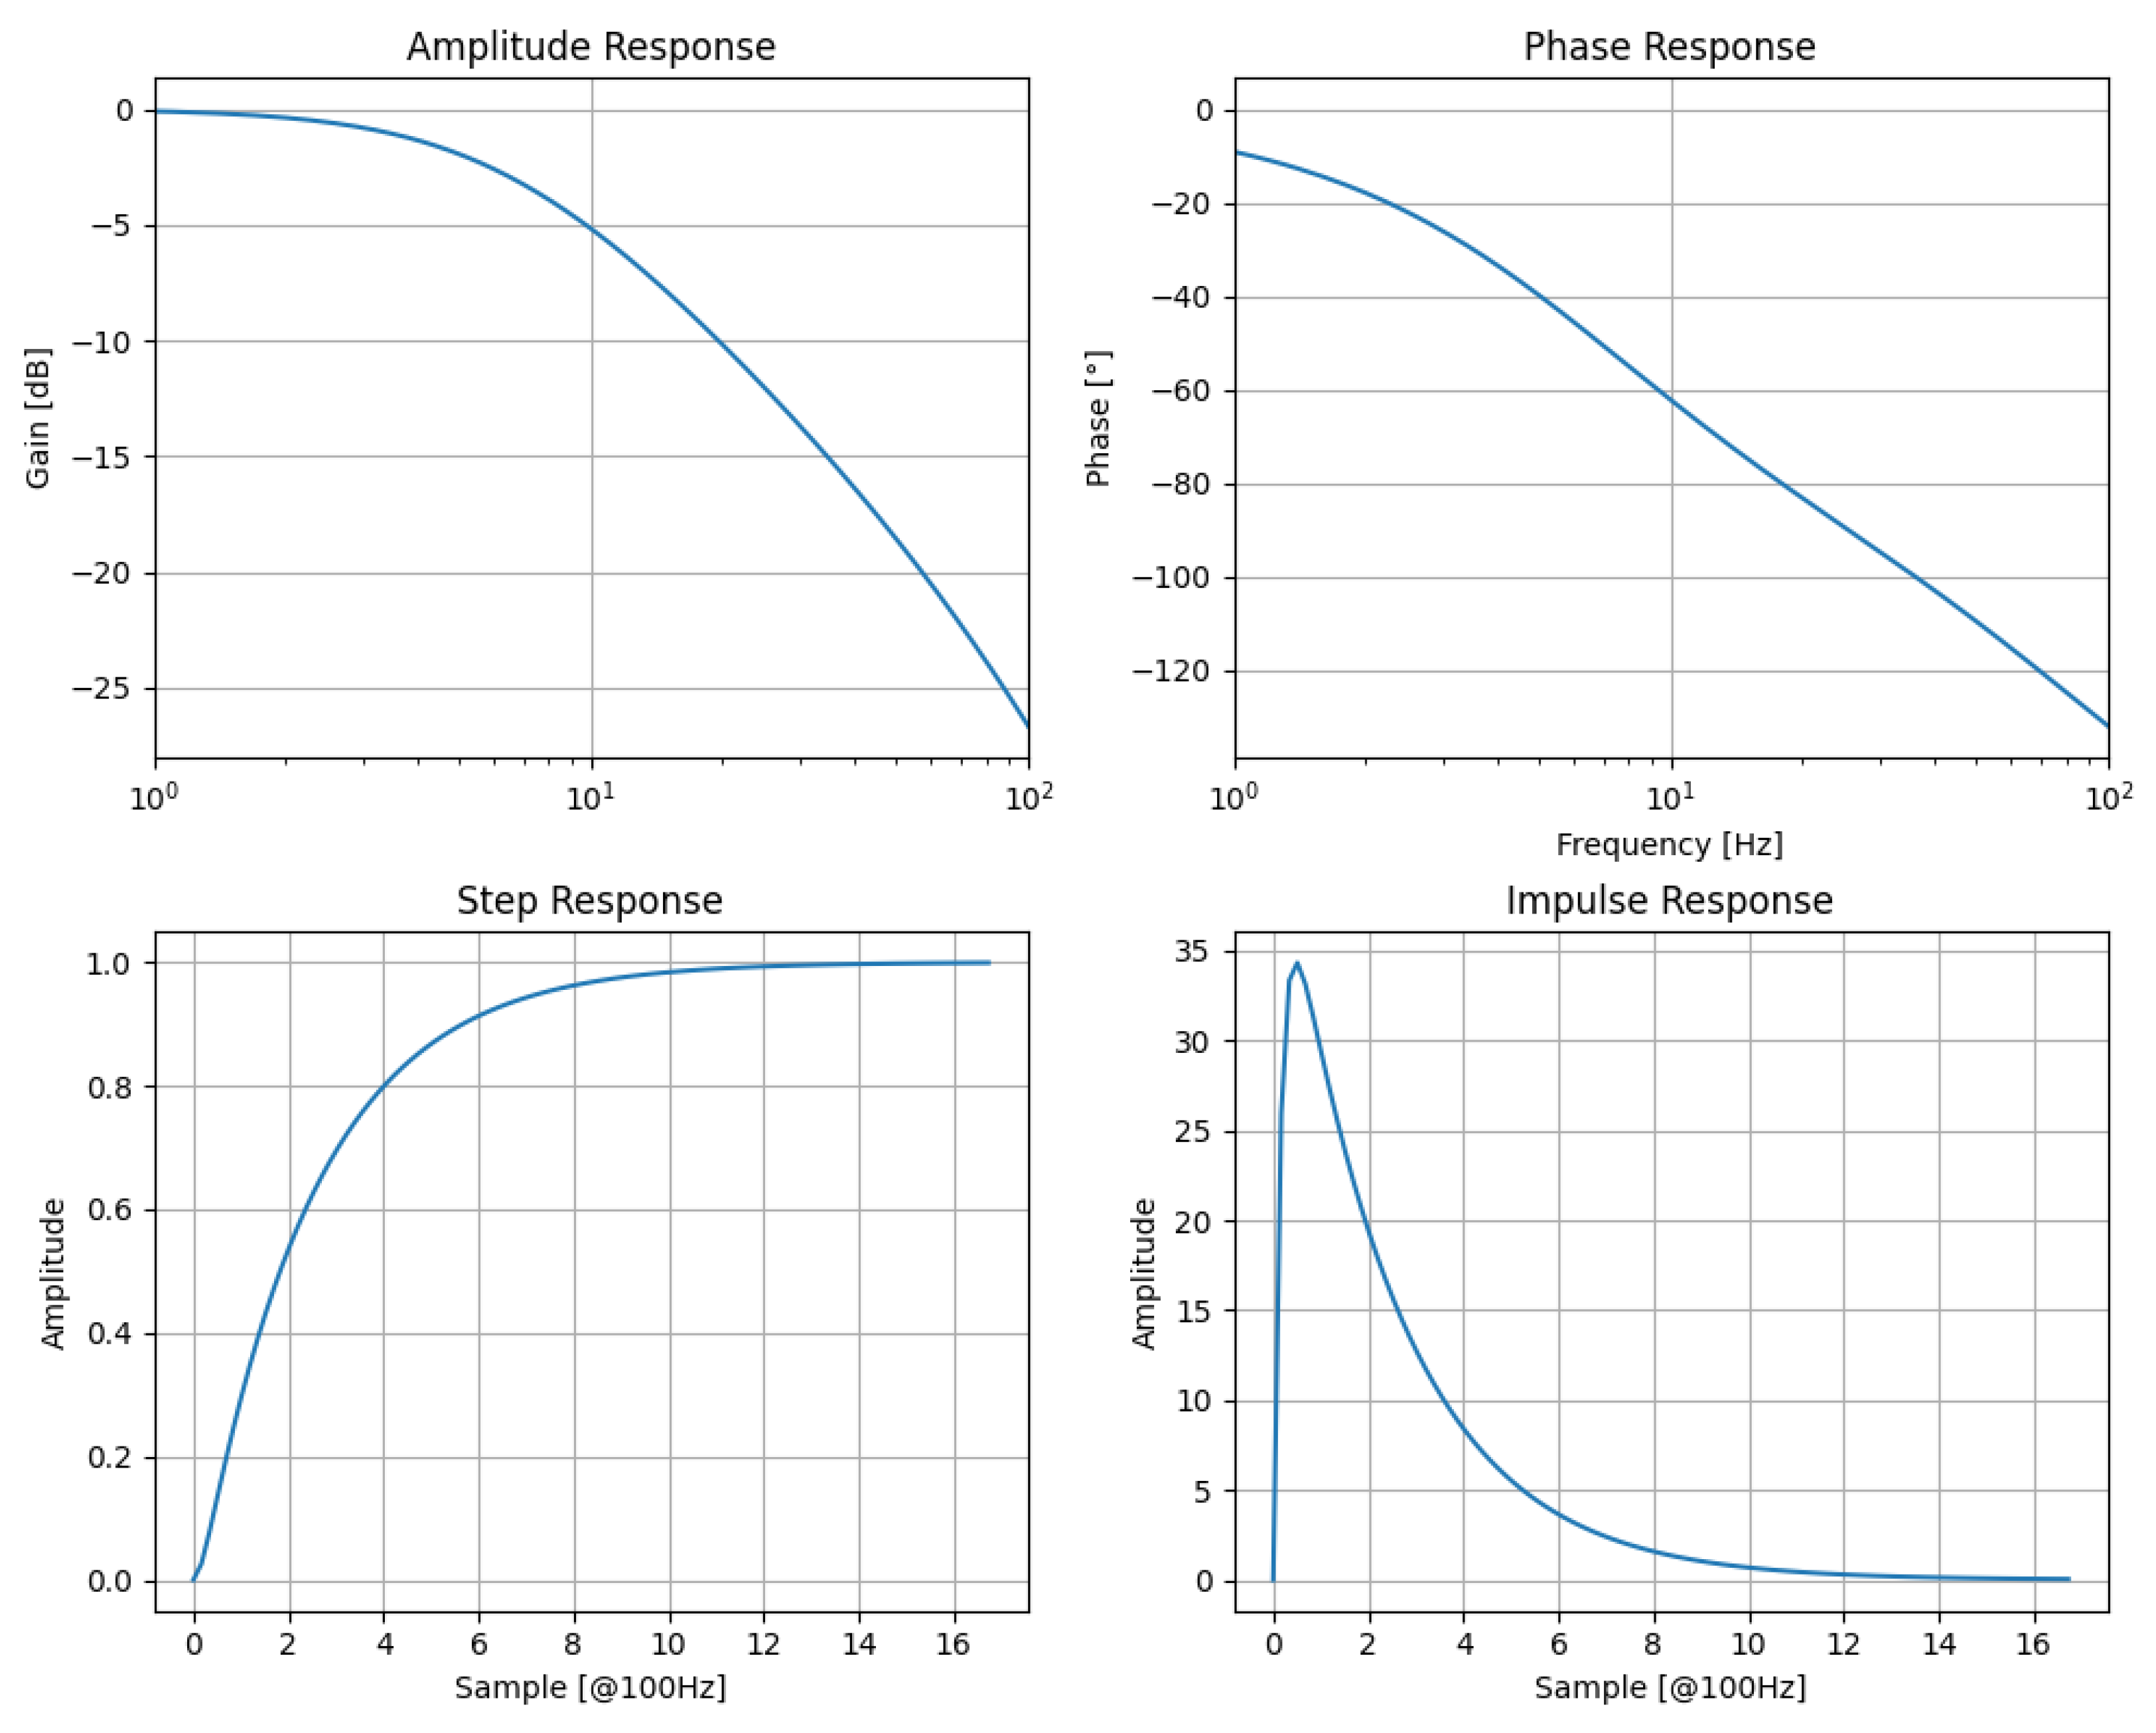
The signal from the transimpedance amplifier (U2) is given to the input of a low-pass, antialiasing Sallen–Key filter with a gain of 10 and Bessel-type characteristics. The Bessel characteristic was chosen to provide the step response of the filter without oscillations. Possible oscillations of the filter itself could deform the waveforms coming from objects in the sky. The full characteristics with step and impulse response of this filter are given in
Figure 4. To maintain consistency across time-domain plots within the paper, and due to the discrete nature of the signal processing involved, we present both step and impulse responses as functions of sample number at a fixed sampling rate of 100 Hz, which is the effective rate of collected data.
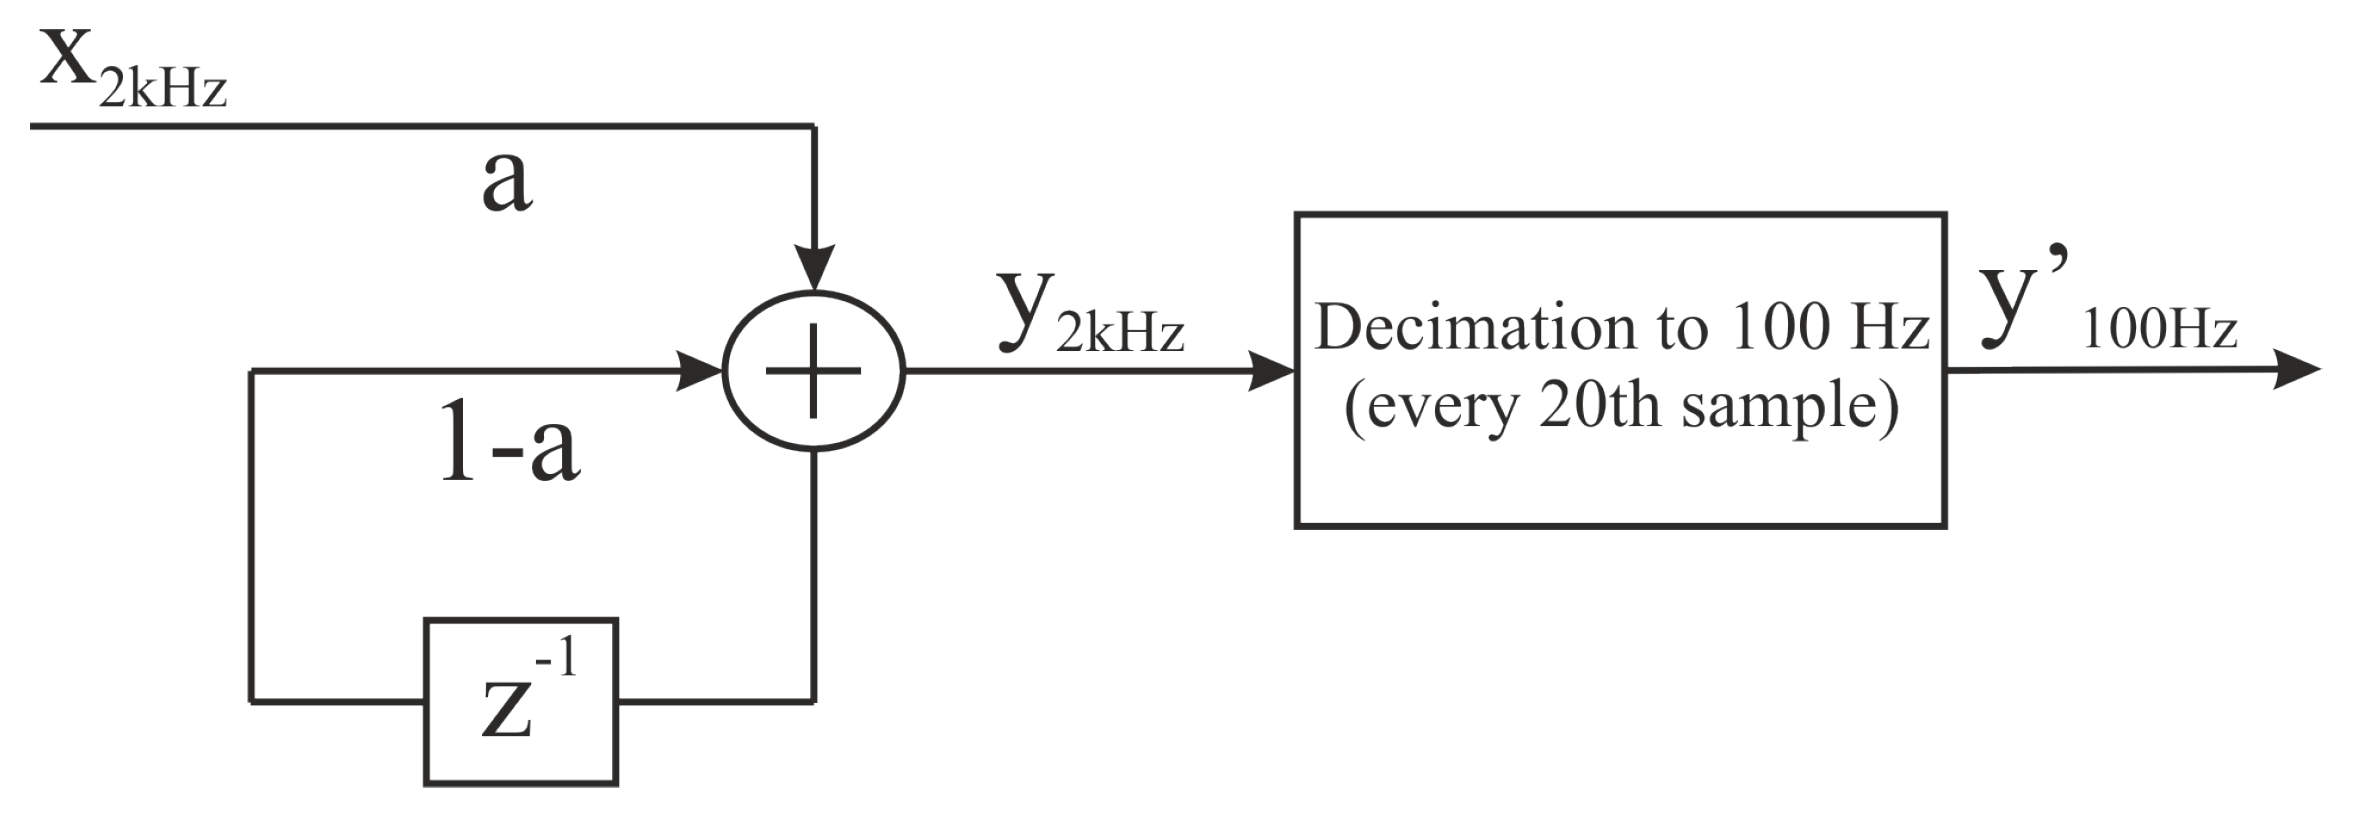
The output signal from the low-pass Sallen–Key filter is connected to the input of an A/D converter in the ADuC7020 microcontroller. The converter multiplexedly samples successive channels at a rate of 8 ksps and a resolution of 12 bits. Effectively, each channel is thus sampled at a rate of 2000 Hz with a resolution of 1.22 mV. The sampled signal is filtered with digital filter of IIR type (infinite impulse response). The role of this filter (in contrast to Sallen–Key which is antialiasing filter) is the reduction of noise associated with the A/D conversions and increasing measurement resolution (smoothing the final signal). The first-order IIR can be described by the following differential equation and the schematic of the IIR filter algorithm is given in
Figure 5.
This filter acts as a discrete equivalent of a first-order RC low-pass filter. The parameter
a is equivalent to the time constant of the filter—the smaller the value of
a, the longer the time constant. The choice of the parameter
a involved some compromise in the system. Smaller values of
a resulted in lower noise of the recorded waveform at the price of a slower step response, while larger values of
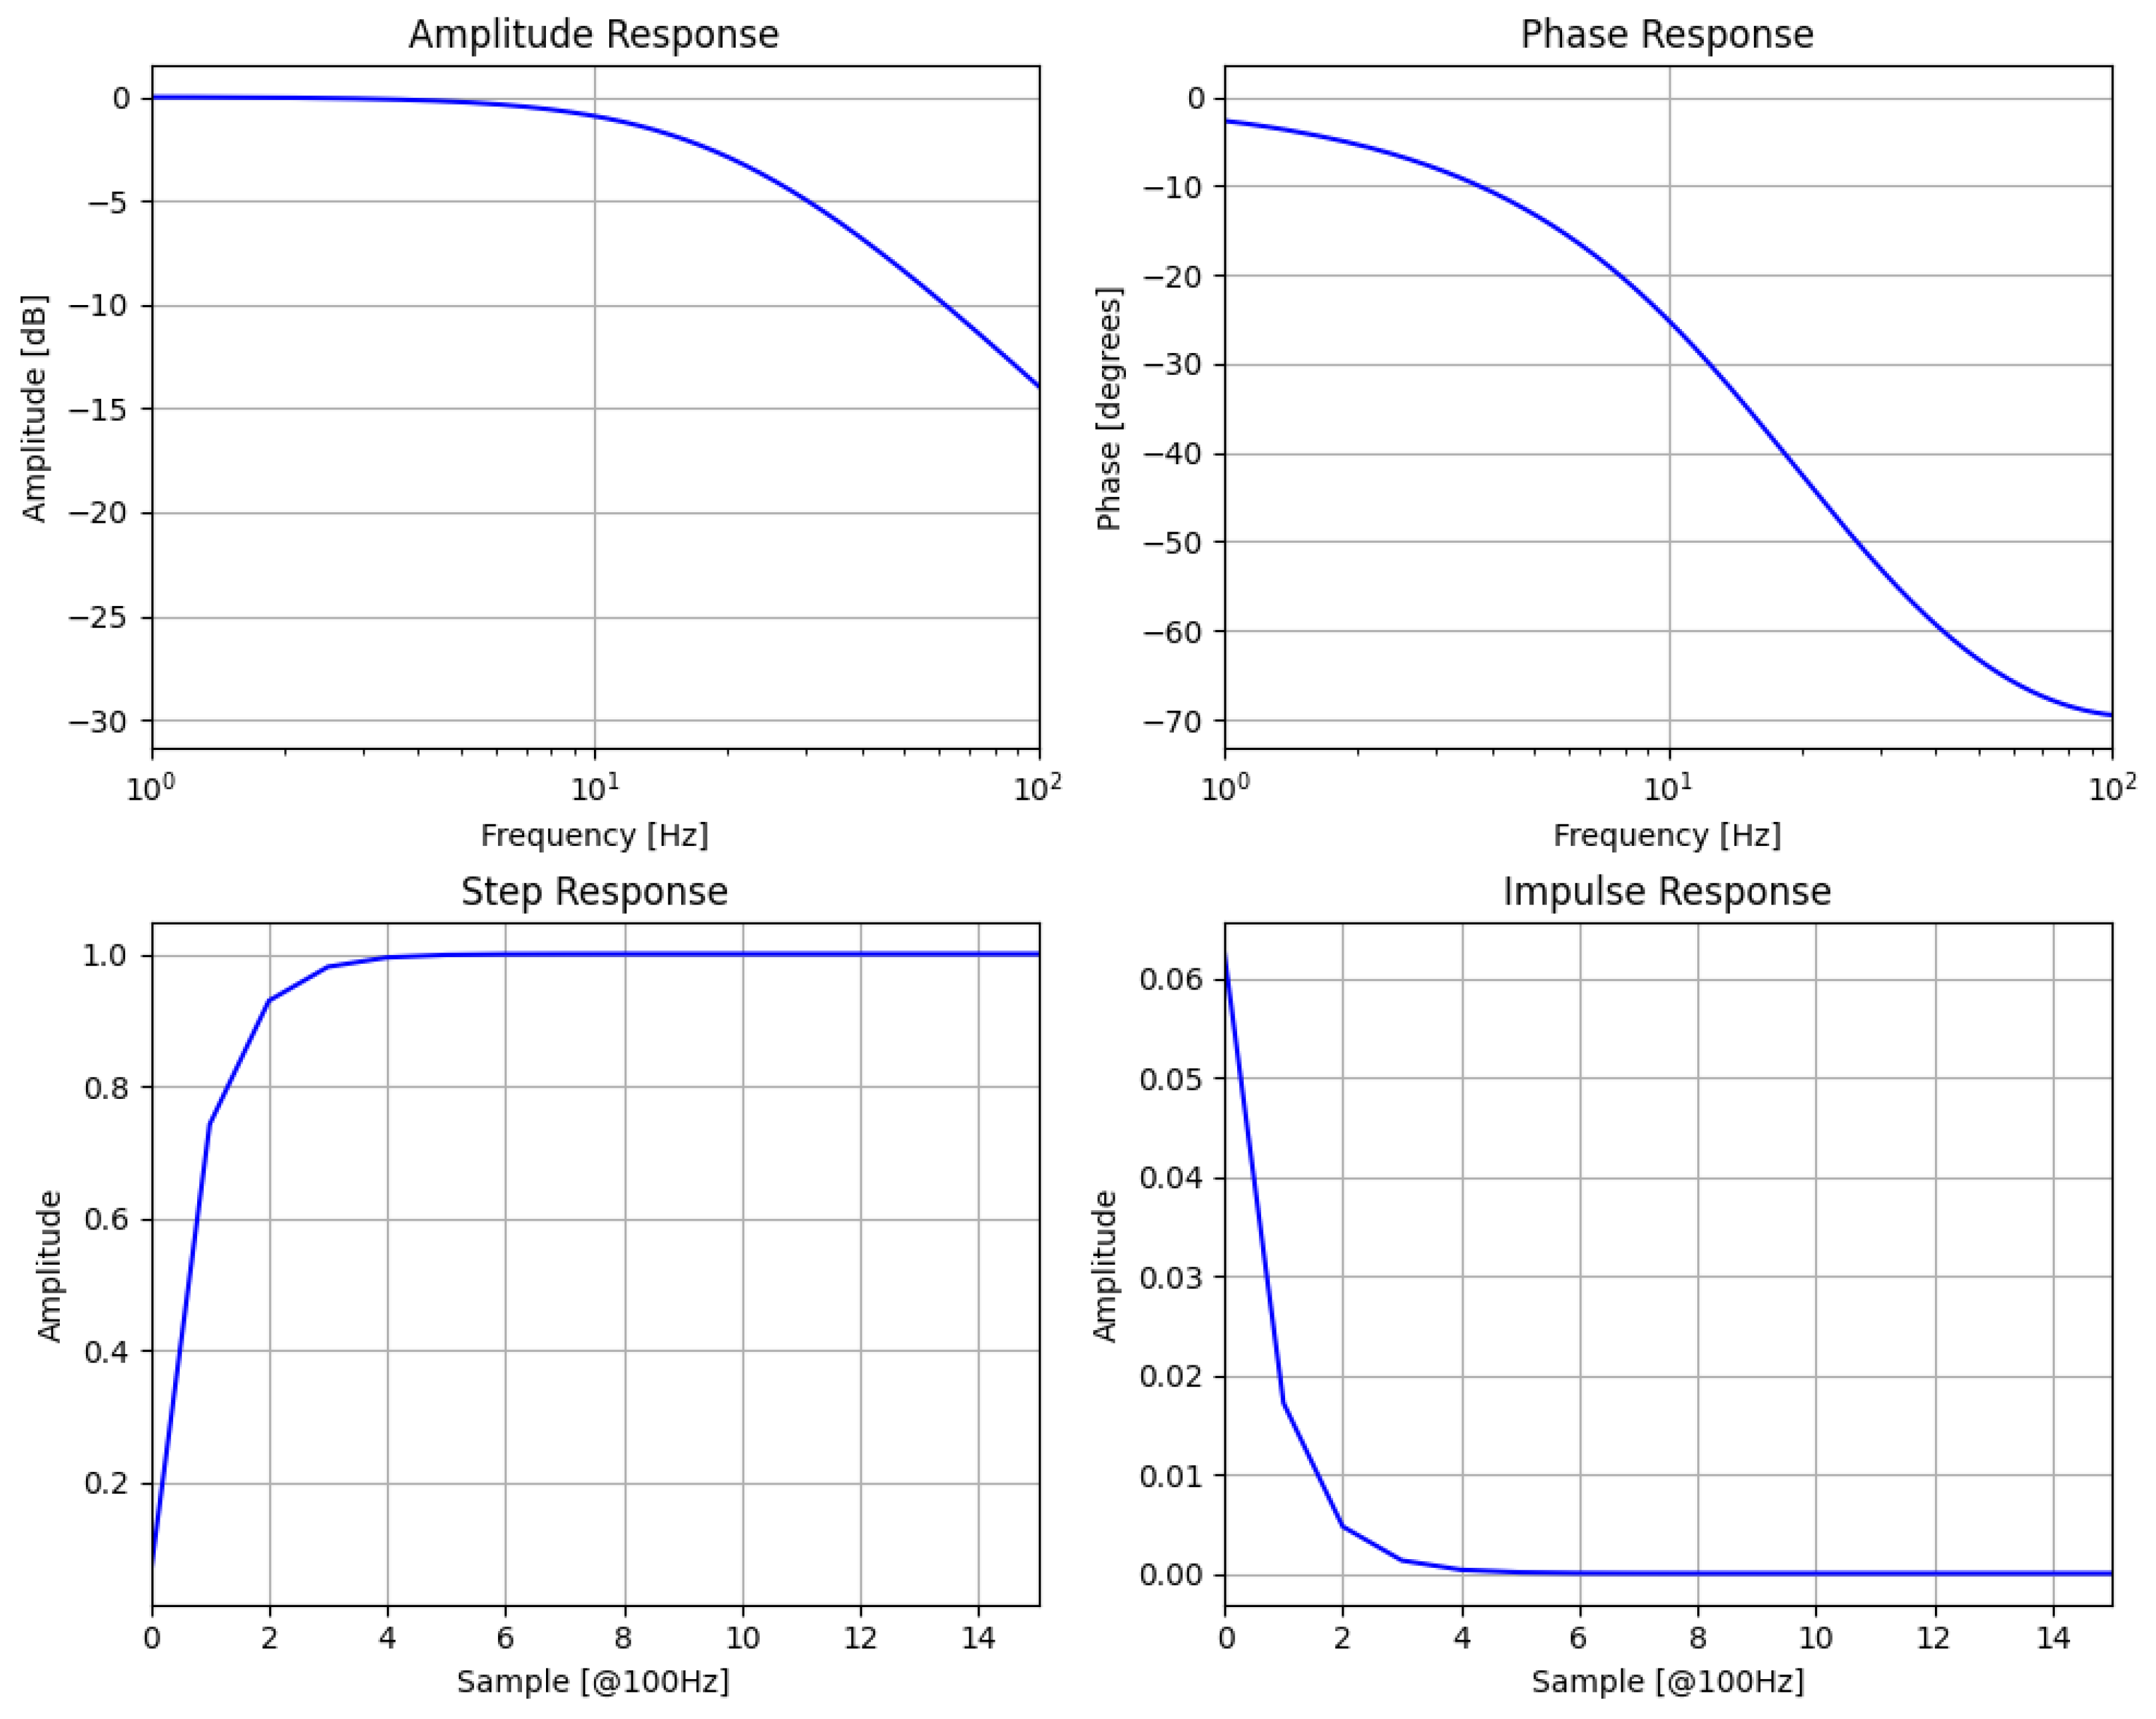
a gave a faster step response with higher noise. We selected a value of 1/16, which does not disturb the signals (its cutoff 3 dB frequency is about 20 Hz while it is 7 Hz for analog antialiasing filter) while reduce mainly gaussian and 50 Hz noise before sending data to PC. The samples from these filters are decimated by 20 to have a final rate of 100 Hz. The value of 100 Hz allowed us to send all the required information from the module at the maximal speed of RS232 port—115.2 kbps. It appeared to be also satisfactory from the point of view of the observed phenomena and their dynamics. An additional advantage of this filter is that the output data samples are float numbers instead of 12-bit numbers (with 1.22 mV resolution), as received from the A/D unit. The characteristics and responses of this filter are given in
Figure 6. For the consistency with the characteristics of Sallen–Key filter, we used presentation of both step and impulse response in the resulting sampling 100 Hz instead of the initial sampling rate of 2000 Hz.
3.2. Baseline Drift Correction
The final stage in the detector (
Figure 3) is the DC voltage correction circuit. During the night, due to the effects of various interference light sources (moonlight, dusk/dawn effect, changing atmospheric transparency and light pollution), some DC components may appear at the output of the transimpedance amplifier (marked in
Figure 3 as U2). This additional, unwanted DC drift can saturate the second amplifier (marked in
Figure 3 as U3) in the Sallen–Key low-pass filter. To avoid this, a PI (proportional-integral) regulator was realized in the microprocessor circuit, which observes the DC voltage at the input of the A/D converter and develops a DC voltage at the output of the DAC. This output voltage from the PI regulator controls the current source (G1 in
Figure 3), which is connected to the divider at the amplifier’s inverting input. The current source has no effect on the gain of the circuit and only on the DC component at the output of the filter (marked in
Figure 3 as Out from U3). Additionally, the value of the DC component from the output of the PI controller contains information about the background level (average intensity of the sky illumination) and is collected as auxiliary data during acquisition.
The PI-based reduction in offset is activated only when the A/D converter measures values above ±200 mV and is deactivated once the ADC reads below ±5 mV. This threshold-based operation compensates for the offset for only a very short period, typically a few seconds, allowing for undisturbed signal observation for most of the time. In practical applications, the PI controller is employed only during dusk and dawn when the total brightness of the sky changes gradually. It is also utilized during nights with a full moon, additionally 2–3 times per night. These occasional corrections are easily distinguishable from meteor detections by either signal processing or a human investigator since they occur when the signal exceeds a well-defined 200 mV threshold.
3.3. Noise Analysis
Our analysis indicates that, excluding the diode itself, the dominant noise contributors in the detector are the thermal noise of resistor R2 within the transimpedance amplifier, the equivalent input noise voltages of amplifiers U2 and U3, as well as the equivalent input noise current of amplifier U2. Other sources, including the thermal noises of the resistors in the low-pass filter, are considered negligible.
Table 2 presents the values of the predominant noise sources along with their impact on the mean square voltage at the detector’s output.
Based on the information from
Table 2, we can deduce that the most significant source of noise is thermal noise, which has a value of
for the resistor R2 and the voltage noise of Reference U1. The effective voltage of the noise at the output is obtained by multiplying the RMS voltage by the bandwidth and rooting. Assuming an effective bandwidth of 25 Hz, we obtain an output noise RMS value of
V. One can see that this value is more than an order of magnitude lower than the resolution of the A/D converter used, 1.22 mV.
The internal noise associated with A/D conversion and with the IIR filter on, were measured by disconnecting the diode module from ADuC microcontroller and connecting reference 1.2 V, stable DC voltage, to the A/D converter inputs. We measured the RMS digital signals received from the IIR filter at V. Eventually, the expected noise level of our detection circuit should be V. It should be emphasized that this is the lower limit of the noise level that one expects to see in the final detection circuit.
The estimated noise levels lead to the conclusion that the system has been designed to maintain minimal intrinsic noise. The noise level post-A/D conversion is comparable to the largest noise component in the analog signal path, indicating that there is no unnecessary or unwanted amplification of the measurement noise. This outcome underlines the effectiveness of our design in preserving the integrity of the signal, ensuring that the noise characteristics are predominantly determined by the inherent properties of the analog components, rather than by the digital conversion process.
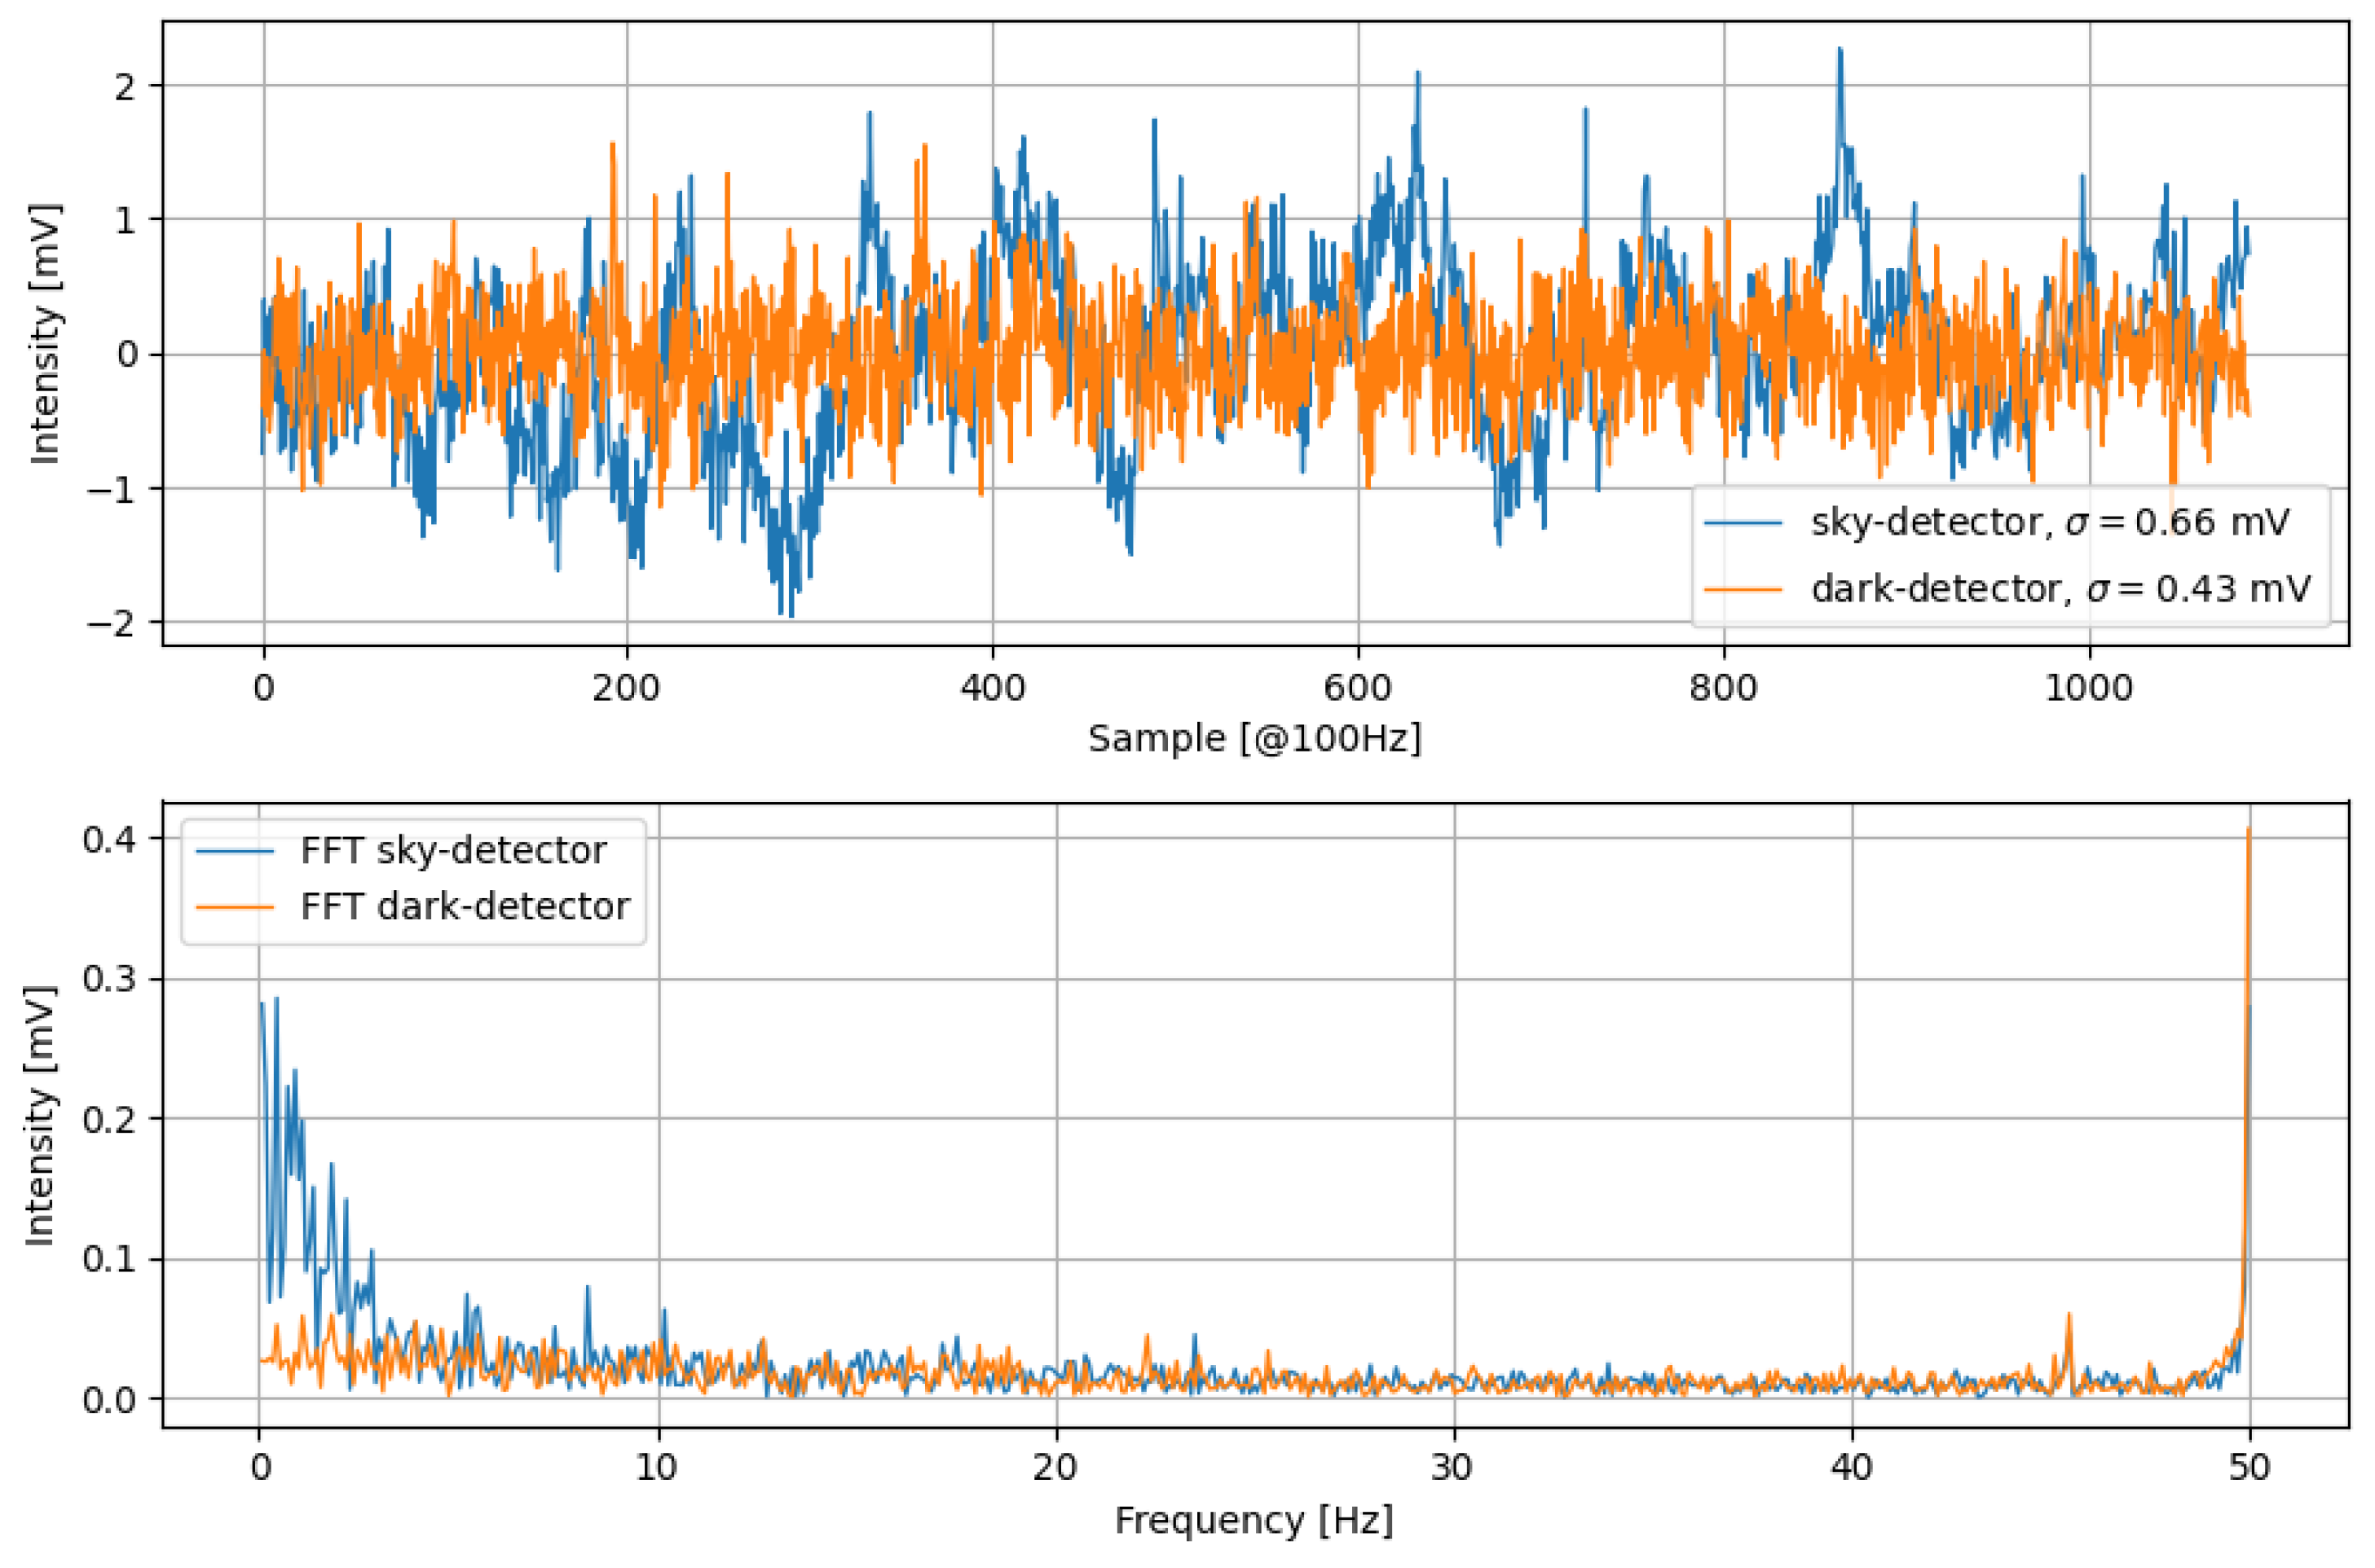
To verify the noise level under real-world conditions, one photodiode was fully shielded from light, allowing us to capture the system’s inherent noise. A 10-s segment from sample night observations was chosen for the noise power analysis. During this time, the signals on the light-detecting diodes were least noisy, i.e., devoid of any abrupt brightness spikes that could arise from various external sources. We also selected the best possible night, without moonlight and with very good visual transparency. Therefore, we can treat this sample series as good example of recording with minimal ambient noise. The RMS values were compared for the diode observing the sky (one of three diodes—all showed very similar signals) and for the diode with the light access blocked. The time series and the corresponding spectra are presented in
Figure 7. The mean value of both signals was removed before plotting.
The real noise appeared to be approximately 10 times larger than the expected 46 V and reached V for module protected from light and V for the diode observing night sky. Assuming that noise from module and sky noise are uncorrelated (i.e., ), we can derive that the noise from the sky background equals V. The noise associated with the varying nighttime conditions shows mostly low frequencies, well below 5 Hz. The spectra for the two diodes, starting from 10 Hz, look very similar and flat. The strongest component is present at 50 Hz, which is the effect of residual interference from the mains, which remained in the system.
The experimentally determined real noise values suggest that the level of the smallest ambient noises (i.e., originating from various light sources) registered in our experiments exceeds the inherent noise level of the system. The observed order-of-magnitude increase in noise level might be attributed to various electromagnetic effects inducing additional currents in the sensitive analog circuit. Even picoamperes can lead to distortions and the emergence of extra noise in such finely tuned systems. Additionally, environmental conditions like humidity can significantly affect the performance. Moisture in the air can lead to condensation on the circuit components, potentially causing minute short-circuits or changes in the electrical properties of the circuit, thus contributing to the noise. Furthermore, the proximity to electronic devices or power lines might result in electromagnetic interference, amplifying the noise levels. Given the highly sensitive nature of the system, such external factors, though seemingly minor, can have a substantial impact on the overall noise profile. Summarizing, although the measured intrinsic noise is higher than the theoretical predictions, our detector can still be considered as a device introducing a minimal amount of additional noise, which is smaller than the fluctuations of the signals from the clear-sky dark night.
4. Preliminary Results
On the night of 11–12 August 2023, our proprietary meteor detection device was deployed on the roof of the observatory in Pyskowice (50.33° N, 18.62° E), which is managed by the SUTO (Silesian University of Technology Observatories) research group, which specializes in technical aspects of astronomical imaging. The device was powered and connected to the Internet, which allowed continuous data transfer of both photodiode waveforms and camera images directly to the Silesian University of Technology’s servers.
Observational conditions during the experiment were rather average. Pyskowice, being a small city, unfortunately generates some sky brightening caused by nearby streetlights and other human activity, which could have affected the quality of the observations. In most cases, the fainter meteors could not be recorded due to the elevated brightness of the sky background, which contributed to the noise present in both the camera and the photodiodes.
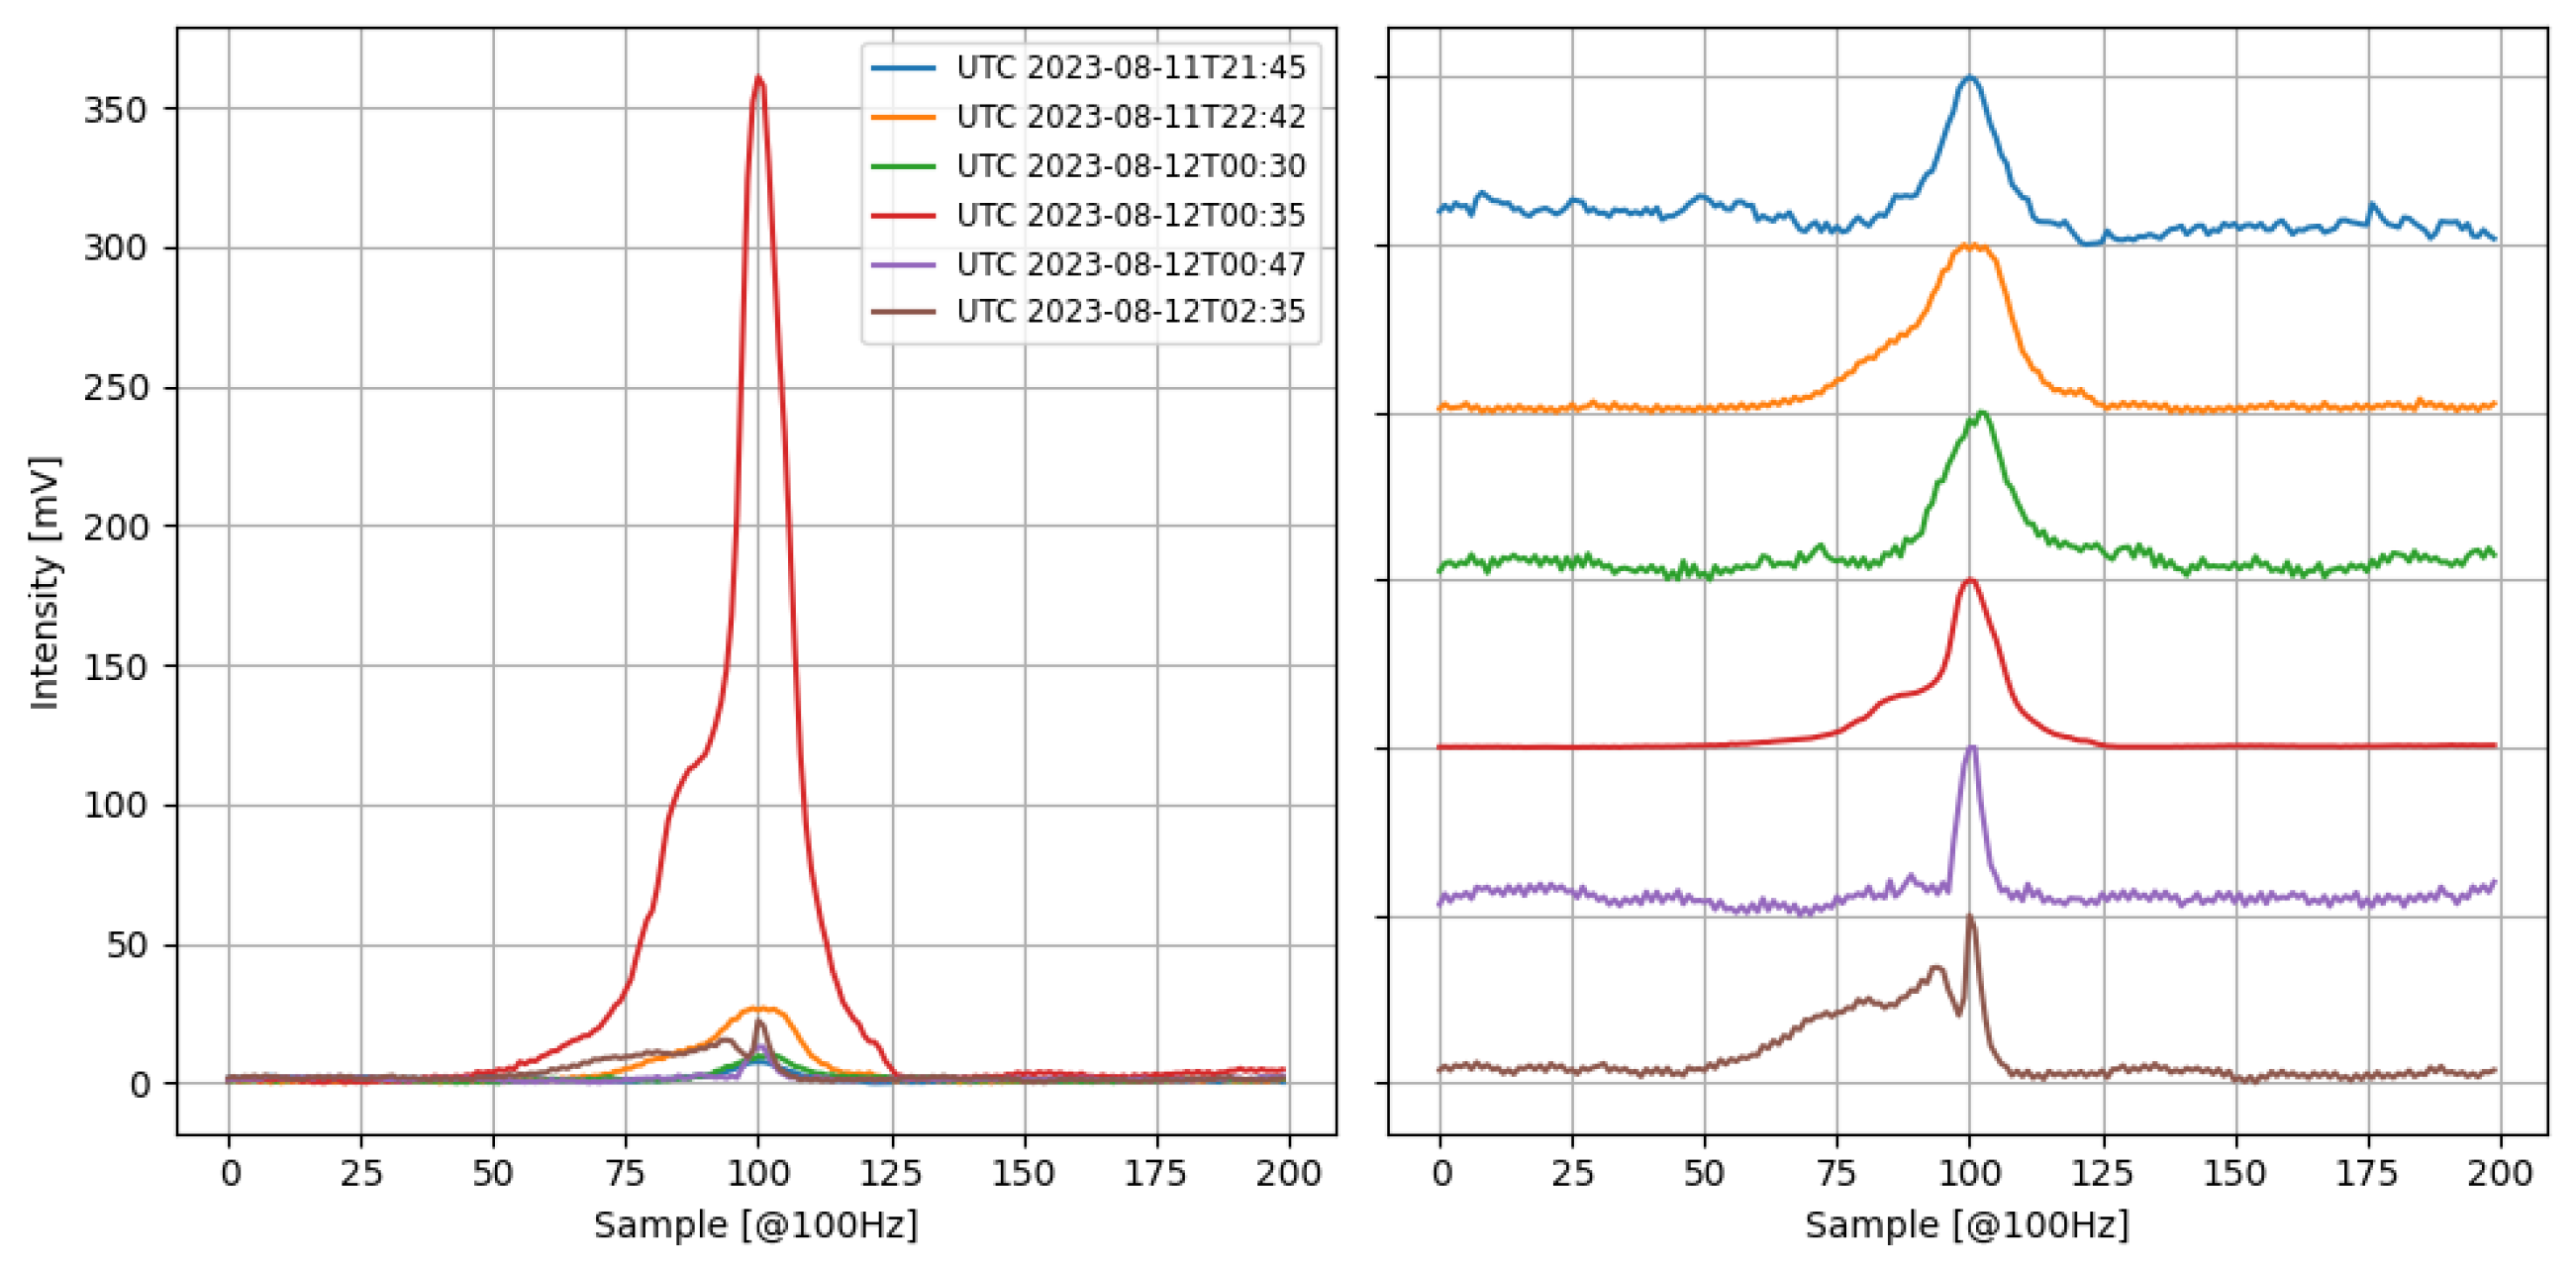
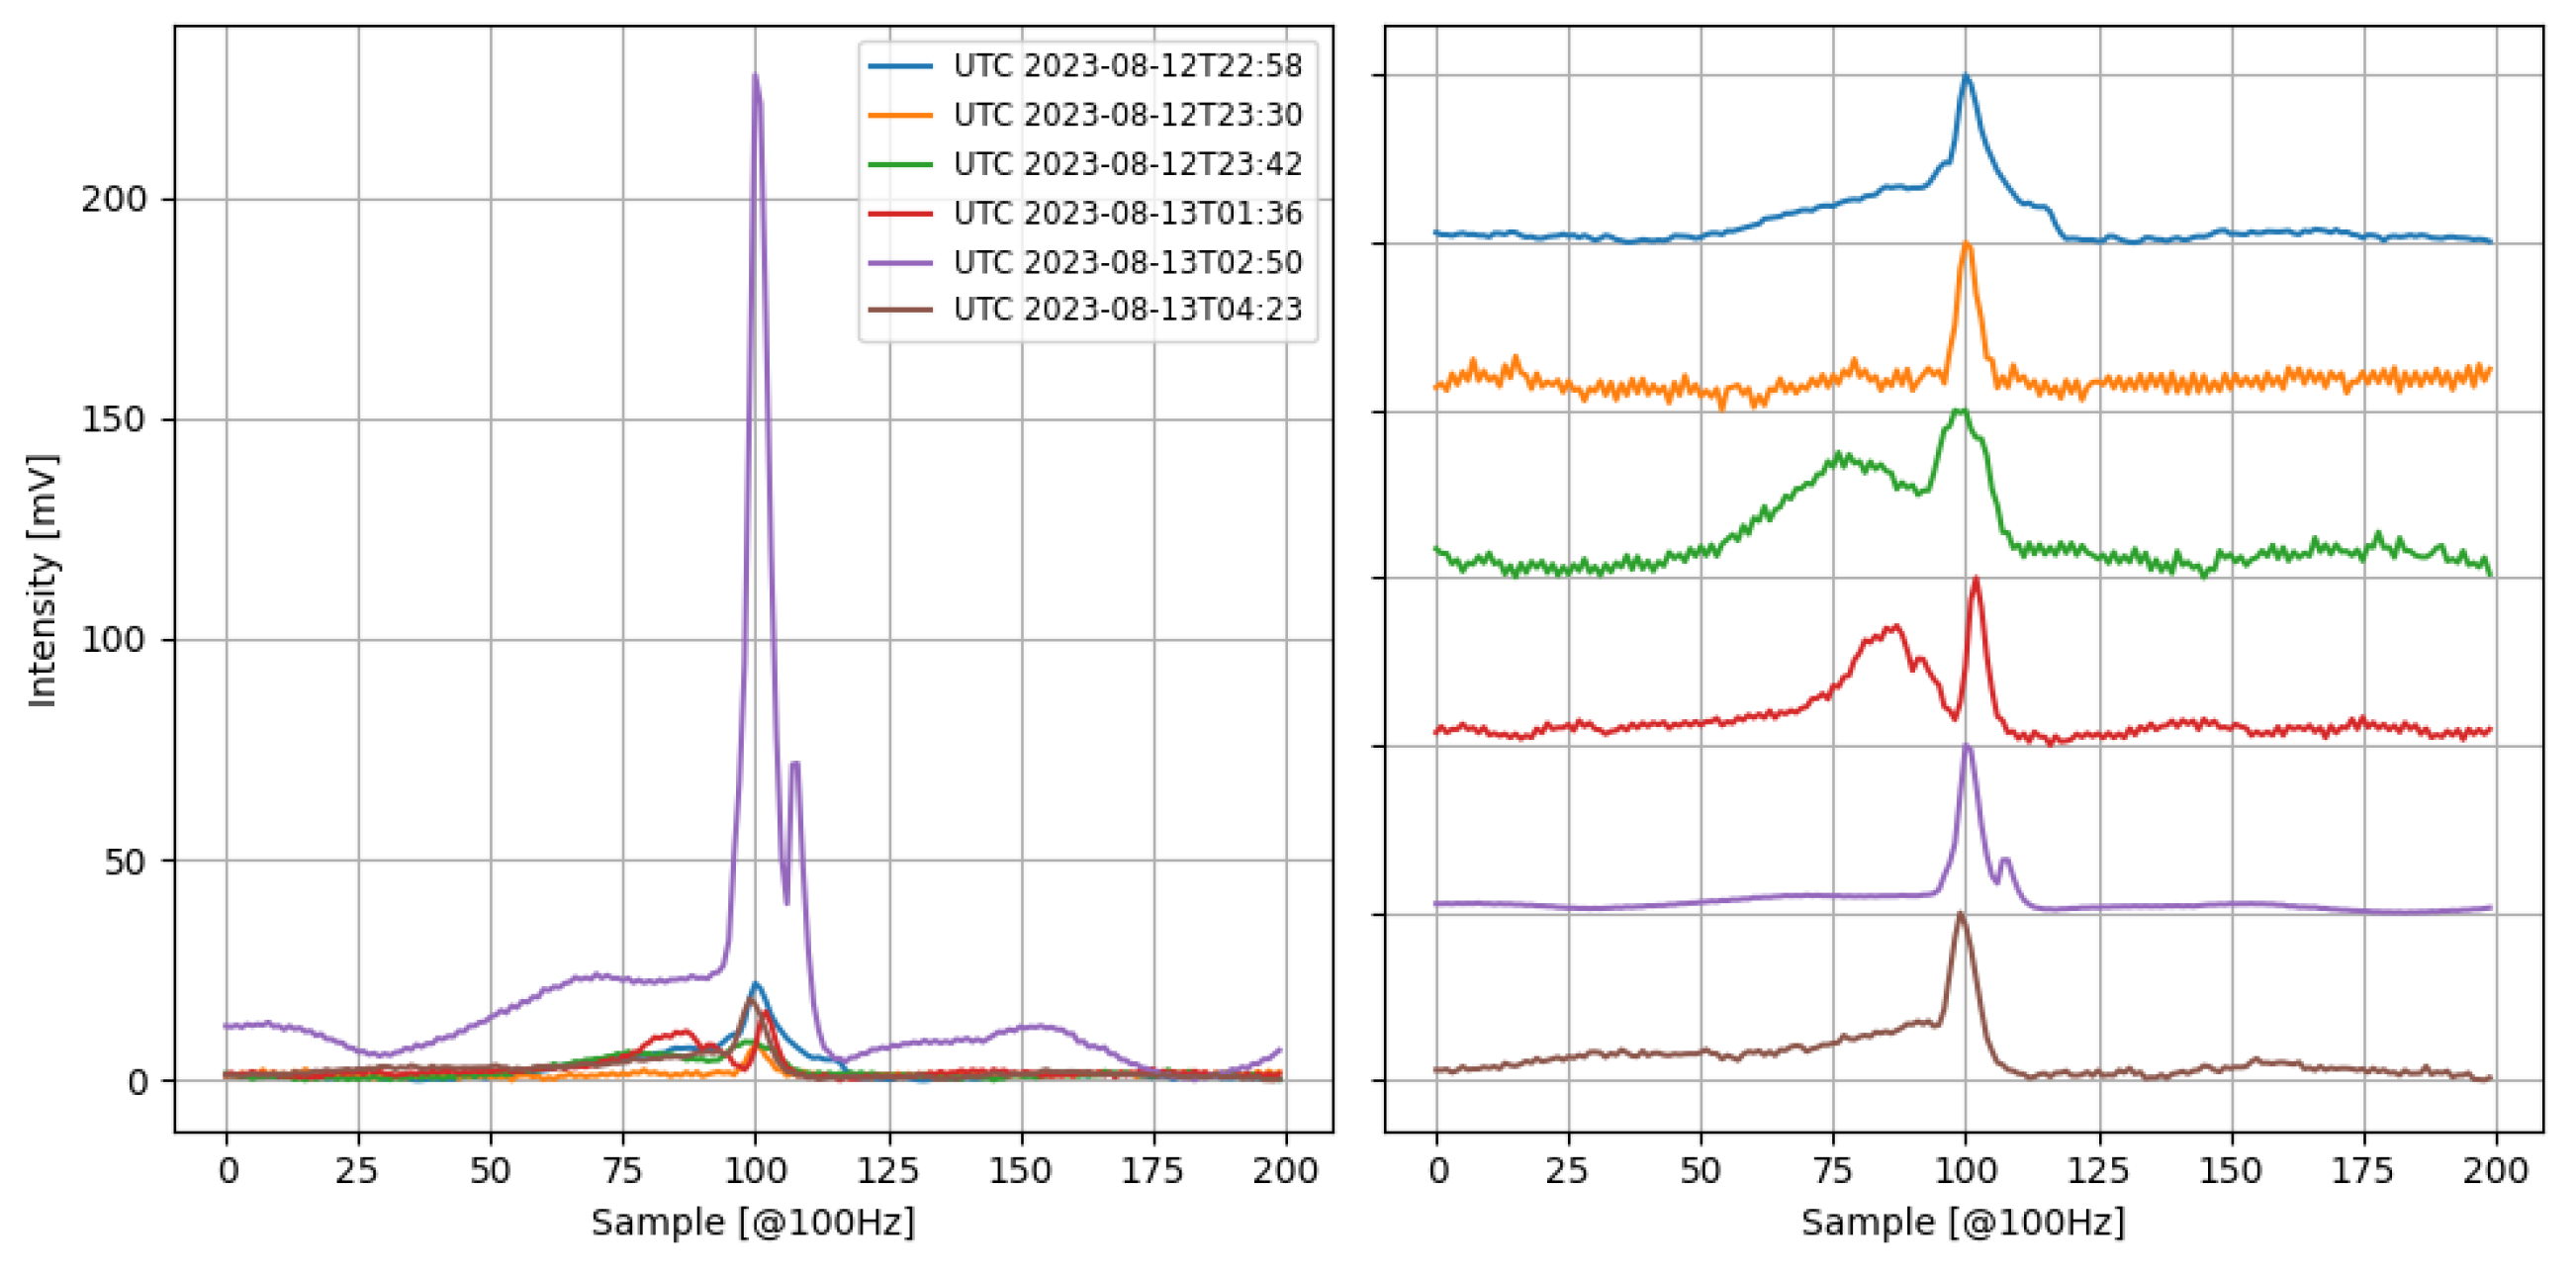
Data analysis was carried out after the observations were completed. It was performed manually (visual inspection) and consisted of reviewing the photodiode waveforms and analyzing the recorded images in parallel. Places where sudden jumps in brightness values were observed in the photodiode signals were carefully analyzed in the corresponding images to detect the presence of the meteor. The results of sample detections from the first and second days of the Perseid maximum are presented in
Figure 8 and
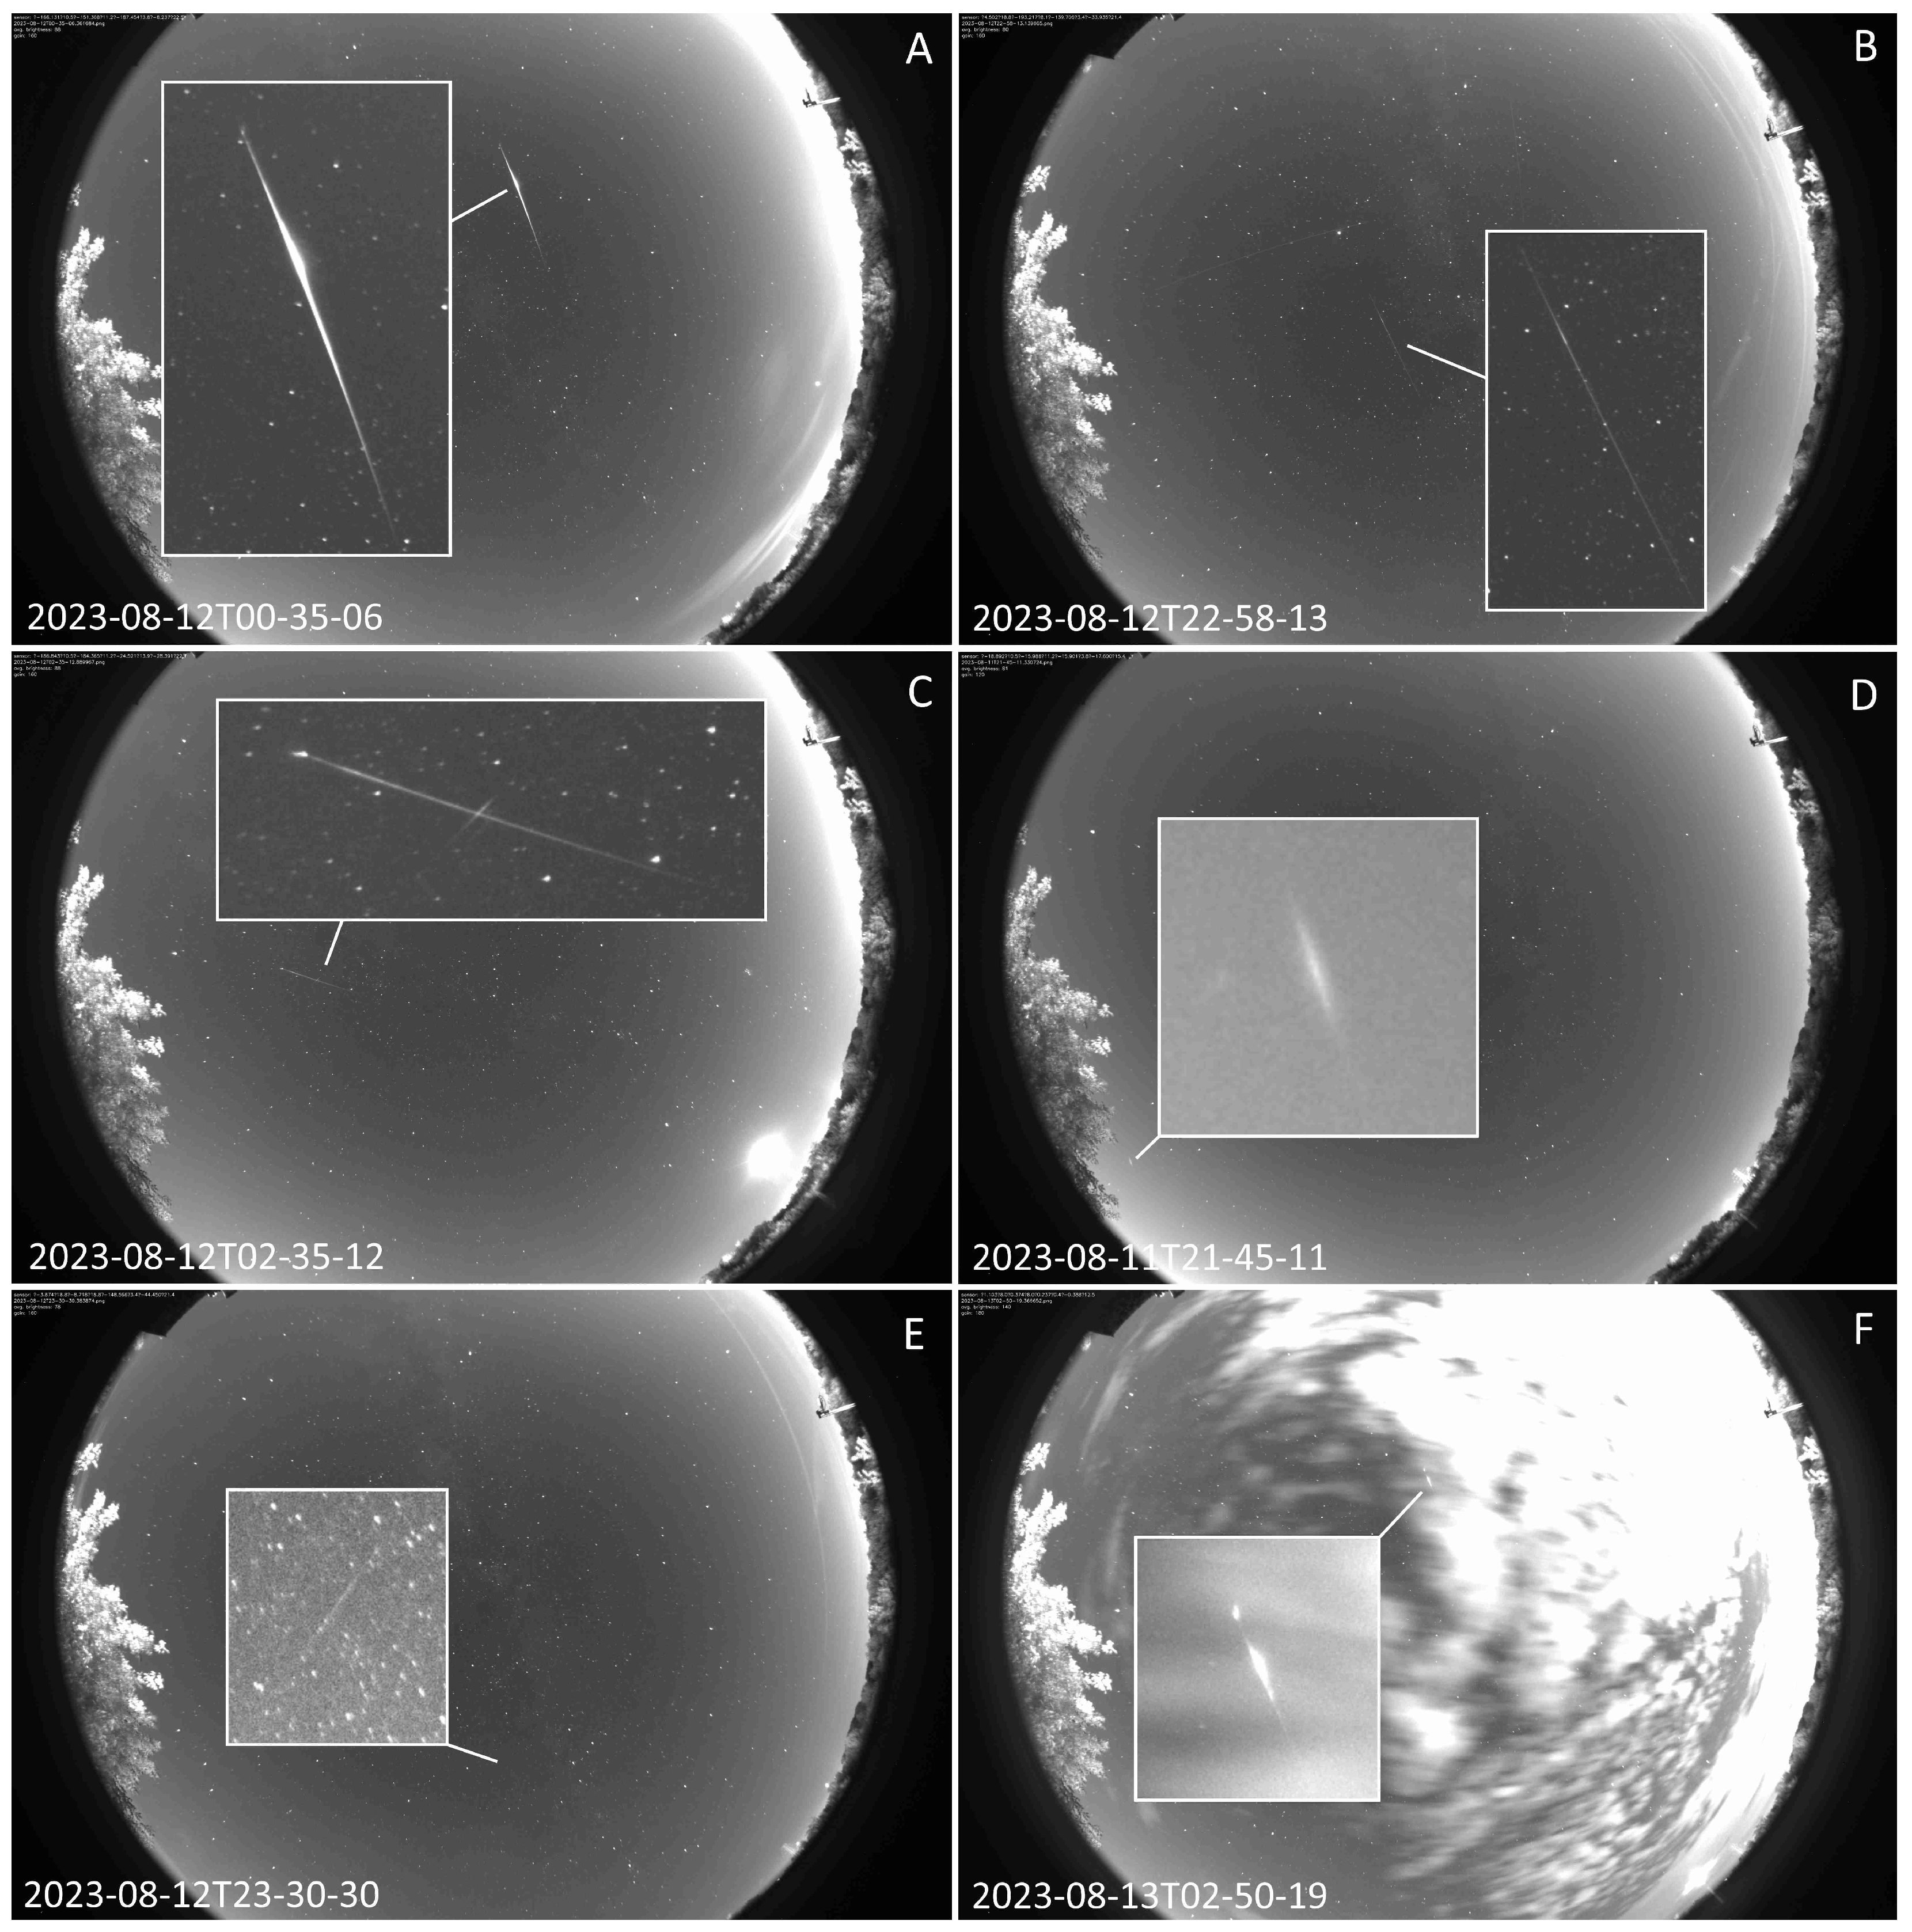
Figure 9, respectively. Of the 12 waveforms presented in these charts, we have selected 6 to which we attach images captured by the camera to highlight various aspects of meteor detection (see
Figure 10).
5. Discussion
In
Figure 8 and
Figure 9, a substantial brightness difference is apparent between the brightest and faintest detections, reaching a factor of 50 or more. The brightest meteors show a peak amplitude that is several hundreds times greater than the noise level, indicating significant dynamics of the phenomena observed the proposed way. The shapes of the waveforms vary; some increase slowly, reaching a maximum, then decrease rapidly, while others are symmetrical around the peak or present even the opposite character.
Although analyzing the origins of these waveform shapes is beyond the scope of this discussion, it will be a focus of future research. In the upcoming years of operation with our instrument in a remote observatory and a sufficient number of recordings, more accurate analyzes will be possible.
Figure 10A exposes the brightest meteor that was recorded during the two days of observation. Pixel saturation is evident in this image, making it impossible to accurately analyze the brightness of the object from the photograph. The phenomenon, despite its brief presence in the sky of less than half a second, is bright enough that even with a faster camera and shorter exposure time, the result would be similar. Pixel saturation is a significant problem because it prevents precise photometric analysis. On the other hand, the results obtained with our photodiode detector are free of saturation proving the dynamic range inaccessible for recordings with image sensors.
Figure 10B presents a meteor with a much lower brightness compared to example A. Interestingly, at least two other streaks of light are present in the same image, resulting from the passage of satellites. The similar brightness levels of these objects can pose a challenge in the automatic identification of meteors, highlighting the importance of image sequence analysis. In our case, visual analysis of the before-and-after images allowed us to distinguish between meteors and satellites, which is an added value in the context of meteor identification.
Figure 10C shows a phenomenon that is likely the result of fragmentation of the meteor during its passage through the atmosphere. The image reveals a terminal flare, consistent with the anomalous brightness pattern recorded by our detector, featuring a long rise time followed by a short, sharp pulse. Such analysis may allow us to identify and understand the complex phenomena associated with meteor fragmentation.
Figure 10D shows a meteor low above the horizon whose image is significantly blurred by the atmosphere. Despite this, our detector, aimed at the zenith, was able to detect this phenomenon. This observation demonstrates the ability of our detector to record meteors even under difficult observing conditions and suggests that it can also be effective for observations low above the horizon.
Figure 10E highlights the sensitivity of our detector, which turns out to be comparable or even better than that of a camera with a wide-angle lens. The meteor shown is difficult to visually identify in the image, while the signal from the photodiode is clearly visible above the background noise. This comparison shows the advantages of our approach, which allows us to detect even faint and hard-to-see objects.
Figure 10F shows a situation in which more than half of the frame is obscured by clouds. Despite this, a very bright meteor is clearly visible on our detector. This observation indicates the potential of our method in difficult weather conditions and highlights its usefulness in automatic meteor detection. In addition, the two distinct brightness peaks recorded can provide information on the meteor’s velocity, a valuable addition to the observational data.
As we analyzed and discussed the results of our observations, we also noted some potential limitations and challenges of using our detector for meteor research.
First, the detector proved to be extremely sensitive to moisture. The currents generated by the diodes are small enough that any additional currents resulting from moisture around the detection modules could lead to significant drift in the recorded waveforms. We recognized the need to combat this problem by using adequate ventilation and considering the possibility of heating the modules, which could prevent dew condensation and thus stabilize measurement conditions.
The second problem identified is the sensitivity of the detectors to the quality of the power supply. In our initial experiments, we used a power supply without additional filtering, which resulted in the appearance of voltage spikes. These spikes were present in all four detectors and could be misinterpreted as signals from meteors, although their duration was significantly shorter. To remedy this problem, in the experiments proper, we used a network LC noise filter, which significantly reduced the number of unwanted spikes.
On the other hand, analysis of the effect of temperature changes in the system on the recording of meteor phenomena showed that they are not particularly important for the quality of measurements. The change in the value of the dark current from the photodiodes turned out to be practically invisible compared to natural changes in sky brightness. This natural drift was effectively counteracted by the drift reduction circuit, mainly during the dusk and dawn.
It is worth noting that the identified challenges and limitations represent an important area for further work on improving and optimizing our detector. As we collect more data and further develop the technology, we will be able to identify and minimize potential errors, which will contribute to even more precise and reliable meteor observations.
6. Conclusions
Meteor studies play a key role in astronomy and planetary science, offering valuable insights into the chemical composition and physical properties of interplanetary matter. Meteors, as ephemeral phenomena in the night sky, present observational challenges that require precise and sensitive detection methods. Developments in observational and detection technologies have contributed to a significant expansion of our knowledge of these fascinating phenomena.
In this article, we presented a novel photodiode detector for automatic monitoring and recording of meteors in the night sky. Our electronic circuit, consisting of photodiodes, low-noise operational amplifiers and a microcontroller, is characterized by high sensitivity and the ability to detect even faintly visible objects. The experimental data present a variety of observational cases, showing the detector’s effectiveness in situations such as pixel saturation, the presence of other similar objects in the sky, meteor fragmentation, its presence near the horizon, or observations with partial cloud cover.
A comparison of the results obtained with our detector with those obtained with a traditional camera with a wide-angle lens underscores the advantages of our approach, which allows for novel approach to identification and analysis of meteors. Particularly valuable is the fact that our detector can successfully identify meteors even in the presence of interference, such as clouds or other objects in the sky.
In the future, we intend to further refine and optimize our detector. Our goals include (a) increasing the observational range by trying various positioning of modules, (b) preparing signal-processing algorithms for meteor detection, and (c) eventually installing the system in our remote observing station in Otivar (Spain). We believe that further development of our detector will create new opportunities in astronomy and enable more efficient meteor monitoring and research.
