Article

Impacts of Cascade Reservoirs on Adjacent Climate and Land Use Change in the Upper Yellow River, China

1
College of Geological Engineering and Geomatics, Chang’an University, Xi’an 710054, China
2
Observation and Research Station of Ground Fissure and Land Subsidence, Ministry of Natural Resources, Xi’an 710054, China
3
China Electronic Research Institute of Engineering Investigations and Design, Xi’an 710054, China
4
“Four Subject and One Union” Shaanxi Engineering Research Center of Soil Body, Xi’an 710054, China
*
Author to whom correspondence should be addressed.
Appl. Sci. 2025, 15(5), 2816; https://doi.org/10.3390/app15052816
Submission received: 23 January 2025 / Revised: 24 February 2025 / Accepted: 28 February 2025 / Published: 5 March 2025
(This article belongs to the Section Ecology Science and Engineering)

Abstract

:
The Yellow River (YR), China’s second-largest river, is rich in water resources, particularly in its upper reaches, which are characterized by mountainous canyons and considerable hydropower potential. Since the 1950s, 24 reservoirs have been constructed along a 918 km stretch of the upper Yellow River (UYR), creating the highest concentration of cascade reservoirs. This development has had significant ecological impacts on the surrounding environment. This study examines the relationship between reservoir attributes and climate factors to evaluate the environmental effects of reservoirs in the UYR. (1) Following reservoir construction, the average annual temperature and precipitation increased by 3–10%, though seasonal and spatial distributions varied. Temperature increases were most pronounced in winter, while precipitation decreased in some regions during spring and summer, although the overall trend remained positive. (2) The ecosystem experienced significant post-construction changes, including reductions in arable land, grassland, and unused land, while water bodies, construction land, and forests expanded. Consequently, the ecosystem within the reservoir area now accounts for 5.2–12.5% of the total area of the region. (3) Temperature and precipitation were closely linked to reservoir attributes, with storage volume (CAP) and long-term average flow (DIS) significantly affecting precipitation, while surface area (AREA) and normal storage level (FSL) had a greater influence on temperature. In conclusion, the dual impacts of reservoir construction on local climate and land use highlight the complex environmental mechanisms involved, providing valuable insights for future reservoir development and ecological protection in the Yellow River Basin and similar regions.

1. Introduction

The Yellow River, the second-longest river in China, plays a critical role in water resource allocation and ecological protection throughout the basin, particularly in its upstream area. Twenty-four reservoirs have been constructed in the region [1,2]. While these reservoirs have been instrumental in water resource management, flood control, green energy provision, and agricultural irrigation and have contributed to the rapid development of the local economy, their construction has also posed new challenges for the region’s ecosystems, particularly concerning climate change and land use alterations [3,4,5,6,7].
Studies have shown that the construction of reservoirs influences local climate elements such as temperature and precipitation by altering water–air exchange and evapotranspiration, which, in turn, affects these climate parameters [8,9,10,11]. These climatic changes alter local climate patterns and may have far-reaching consequences for regional ecosystems, species distribution, and water resource management [12]. Furthermore, the construction of reservoirs is often accompanied by land use changes, such as the conversion of croplands, forests, and grasslands into watersheds, leading to alterations in biodiversity and potentially impacting groundwater levels, agricultural productivity, and ecological restoration [13,14,15]. Therefore, a quantitative analysis of land use changes, climate change trends, and their interrelationships before and after reservoir construction is essential. To gain a more comprehensive understanding of the environmental impacts of reservoir construction, this study focuses on 10 reservoirs in the UYR, employing remote sensing image analysis and GIS technology to investigate how these reservoirs affect local land use changes, climate shifts, and their interactions [16].
The impact of reservoir construction on the climate system has become a significant area of research in recent years [17,18]. Studies have shown that reservoirs can significantly influence local climate conditions by altering water–air exchange processes. The evaporative effect of reservoirs may lead to lower temperatures, resulting in a localized cooling effect, particularly in arid and semi-arid regions [19]. At the same time, reservoir construction can alter precipitation patterns, which in turn affects water cycle processes. For example, Pierre et al. [20] examined the evaporation characteristics of sub-arid reservoirs and revealed the effects of reservoir evaporation on temperature and precipitation. Jiao et al. [21] further investigated the cooling effect of reservoirs and their surrounding greenland systems on arid regions through evaporation, which enhances precipitation and regulates the local climate. However, reservoir construction may also induce localized climate changes, such as increased temperature and decreased precipitation [22]. Furthermore, reservoirs have substantial impacts on the hydrological cycle and the spatial distribution of precipitation, particularly when dams and reservoirs are constructed in diverse geographic regions, affecting evapotranspiration patterns and ecological sustainability [23]. Combined with land use change, reservoir construction has altered runoff patterns in watersheds, increasing the complexity of hydrological changes in the context of climate change. In this context, climate change may exacerbate water scarcity, prompting researchers to propose climate change-adapted reservoir operation rules to ensure sustainable water resource management [24]. These studies highlight the far-reaching impacts of reservoir construction on local climate regulation, precipitation distribution, and water resource management.
The impact of reservoir construction on land use/cover change and the ecological environment has become a prominent research topic worldwide. Several studies have shown that reservoir construction leads to large-scale land use conversions, particularly the transformation of natural ecosystems such as cropland, forests, and grasslands into watersheds or other artificial covers. This change not only alters land–water–air exchanges and disrupts the water cycle but also profoundly affects regional ecosystems and biodiversity. For instance, Huang et al. [25] examined land use changes in the Three Gorges Reservoir and noted that reservoir construction exacerbated land use conflicts, especially near ecological reserves. Similarly, Bosmans et al. [26] highlighted the far-reaching impacts of reservoir construction on hydrological processes globally, particularly regarding changes in water allocation and groundwater storage. Additionally, studies by Samarakoon et al. [27] and Havlíček et al. [28] have shown that while reservoir construction improves water resource management, it negatively impacts agricultural production and the livelihoods of local populations. Simulations by Verma et al. [29] further confirm that reservoir construction triggers land use/cover changes, which have complex effects on hydrological processes, agricultural production, and ecological resilience. Therefore, land use transformations induced by reservoir construction not only alter regional water management but also have far-reaching consequences for local ecological environments and socio-economic systems.
Reservoir construction plays a crucial role in linking climate change and land use/cover change [30]. Climate change influences land use patterns, and the dual impacts of reservoir construction on both climate and land use drive this interaction. Reservoirs affect the regional climate by altering watershed areas, evapotranspiration, and other factors, while land use changes may, in turn, influence the efficiency of water use and ecological processes. Although studies have explored the independent effects of reservoir construction on climate and land use, relatively few systematic studies have examined their interactive effects [31]. Therefore, this study focuses on the impacts of terrace reservoirs in the UYR, assessing the interactions between reservoir construction, climate, and land use changes and further analyzing their integrated effects on the regional ecological environment. The objectives of this study are as follows: (1) to investigate the impact of reservoir construction on the local climate and explore the trends and factors contributing to changes in climate elements following reservoir construction; (2) to examine land use/cover changes before and after reservoir construction, including the primary types of land use affected, the degree of change, and the differences observed among various reservoirs; and (3) to explore the relationship between reservoir attributes, climate change, and land use/land cover changes.

2. Materials and Methods
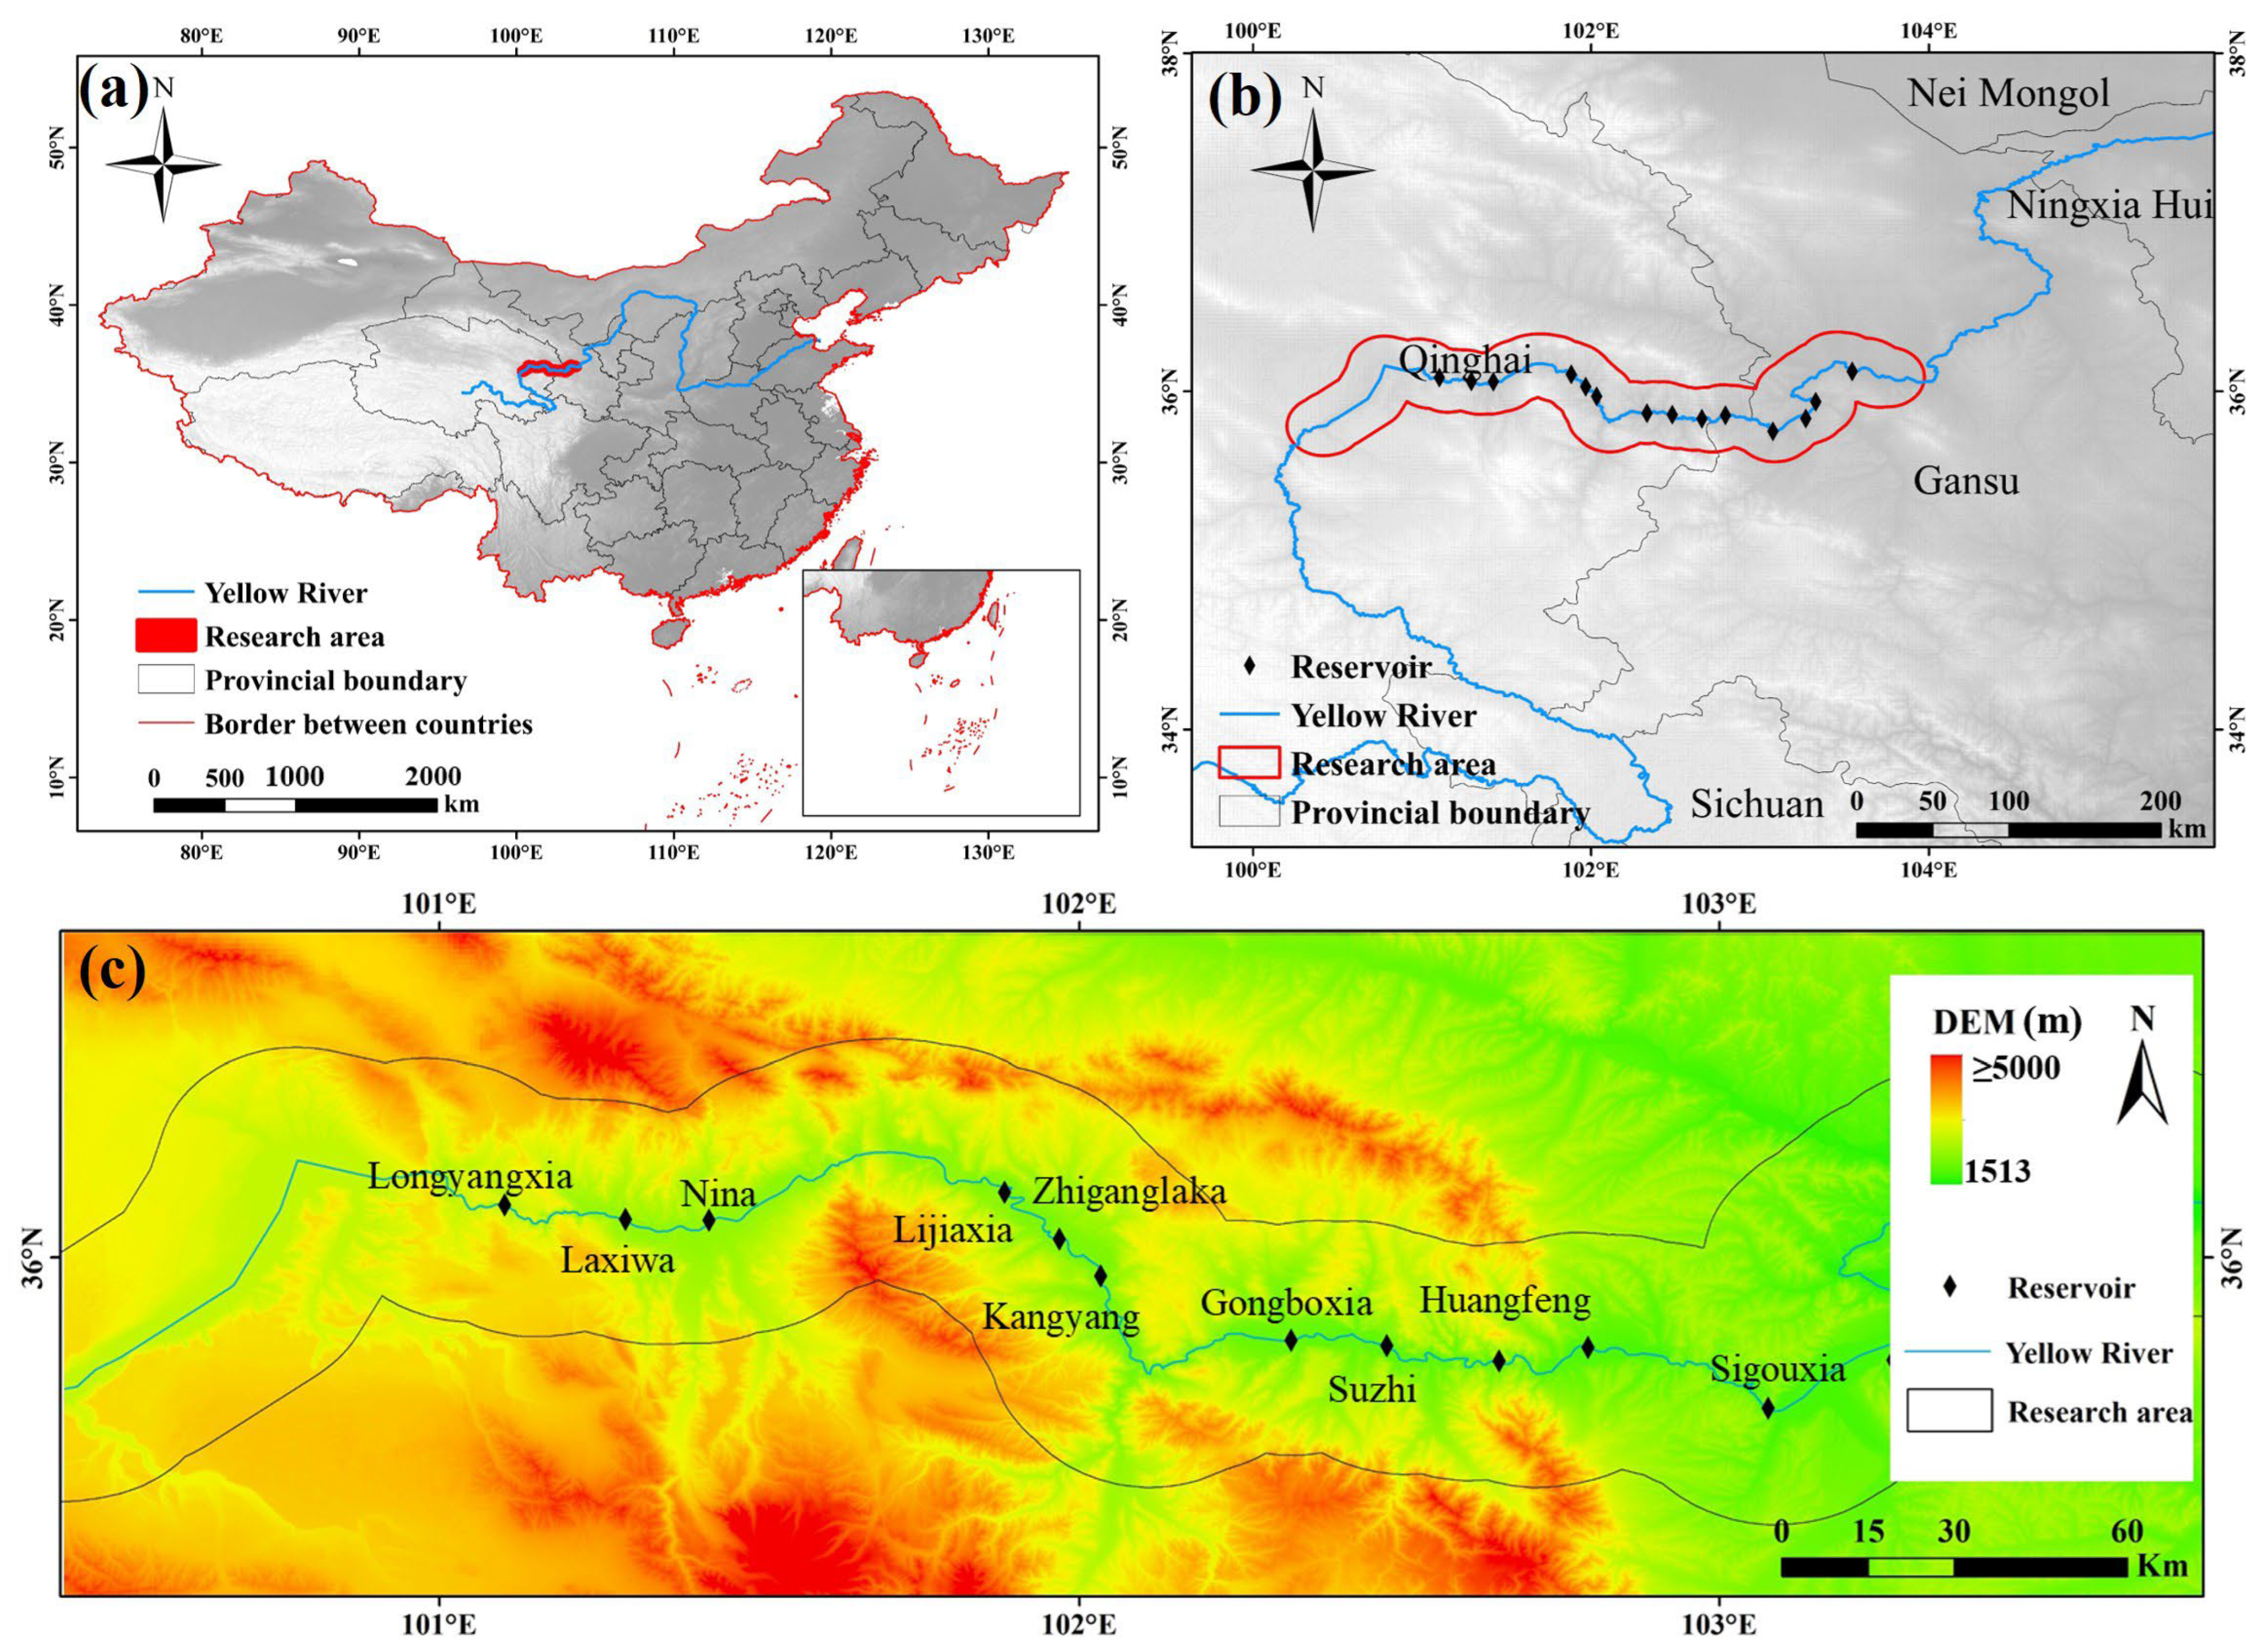
2.1. Study Area

The study area is located in the UYR, in the southeastern part of the Qinghai–Tibet Plateau, with geographic coordinates ranging from 35°25′ N to 36°25′ N and from 100°32′ E to 103°46′ E, covering an area of approximately 15,000 km2. The region is characterized by plateaus and mountains with significant variations in altitude (Figure 1a,b). The climate is predominantly plateau monsoon and sub-cold monsoon, with cold and dry winters, cool and humid summers, and precipitation concentrated in the summer, though it is unevenly distributed throughout the year. The UYR is rich in water resources, flowing through a section of approximately 381.9 km and forming several reservoirs, such as Longyangxia and Lijiaxia, which together constitute a group of “dragon-type” reservoirs (Figure 1c) (Table 1). These reservoirs provide crucial water sources for the provinces of Qinghai, Gansu, and Ningxia and regulate the distribution of water resources, playing a key role in regional socio-economic development and ecological protection. While the construction of these reservoirs has led to the full utilization of hydraulic resources, it has also impacted the local climate and ecological environment, particularly in terms of climate change and land use. Studying the climatic and ecological impacts of reservoir construction in this region will contribute to a deeper understanding of its integrated effects on both the environment and water resources.

2.2. Data Sources

Meteorological data used in this study were obtained from the ERA5-Land monthly mean dataset provided by the European Centre for Medium-Range Weather Forecasts (https://cds.climate.copernicus.eu/ (accessed on 20 May 2024)), with a horizontal resolution of 0.1° × 0.1° and a temporal resolution of 1 month, covering the period from 1982 to 2022. Digital elevation model (DEM) data were downloaded from the Geospatial Data Cloud (Table 2) platform (https://www.gscloud.cn (accessed on 8 May 2024)) with a spatial resolution of 30 m. The boundary of the Yellow River Basin was obtained from the Center for Resource and Environmental Science and Data. Land use data were derived from the China Land Cover Annual Dataset (CLCD) for the years 1985–2022 [32], provided by Landsat. Hydrological data for the Upper Yellow River (UYR) were primarily sourced from the Yellow River Hydrological Yearbook, compiled by the Yellow River Conservancy Commission (Table 1). This yearbook records detailed information on all reservoirs in the Yellow River, including basic data such as name, year of construction, longitude, latitude, altitude, area, storage capacity, average depth, installed capacity, catchment area, main purpose, long-term average flow rate, water residence time, and other key parameters, thus providing reliable foundational data for this study.

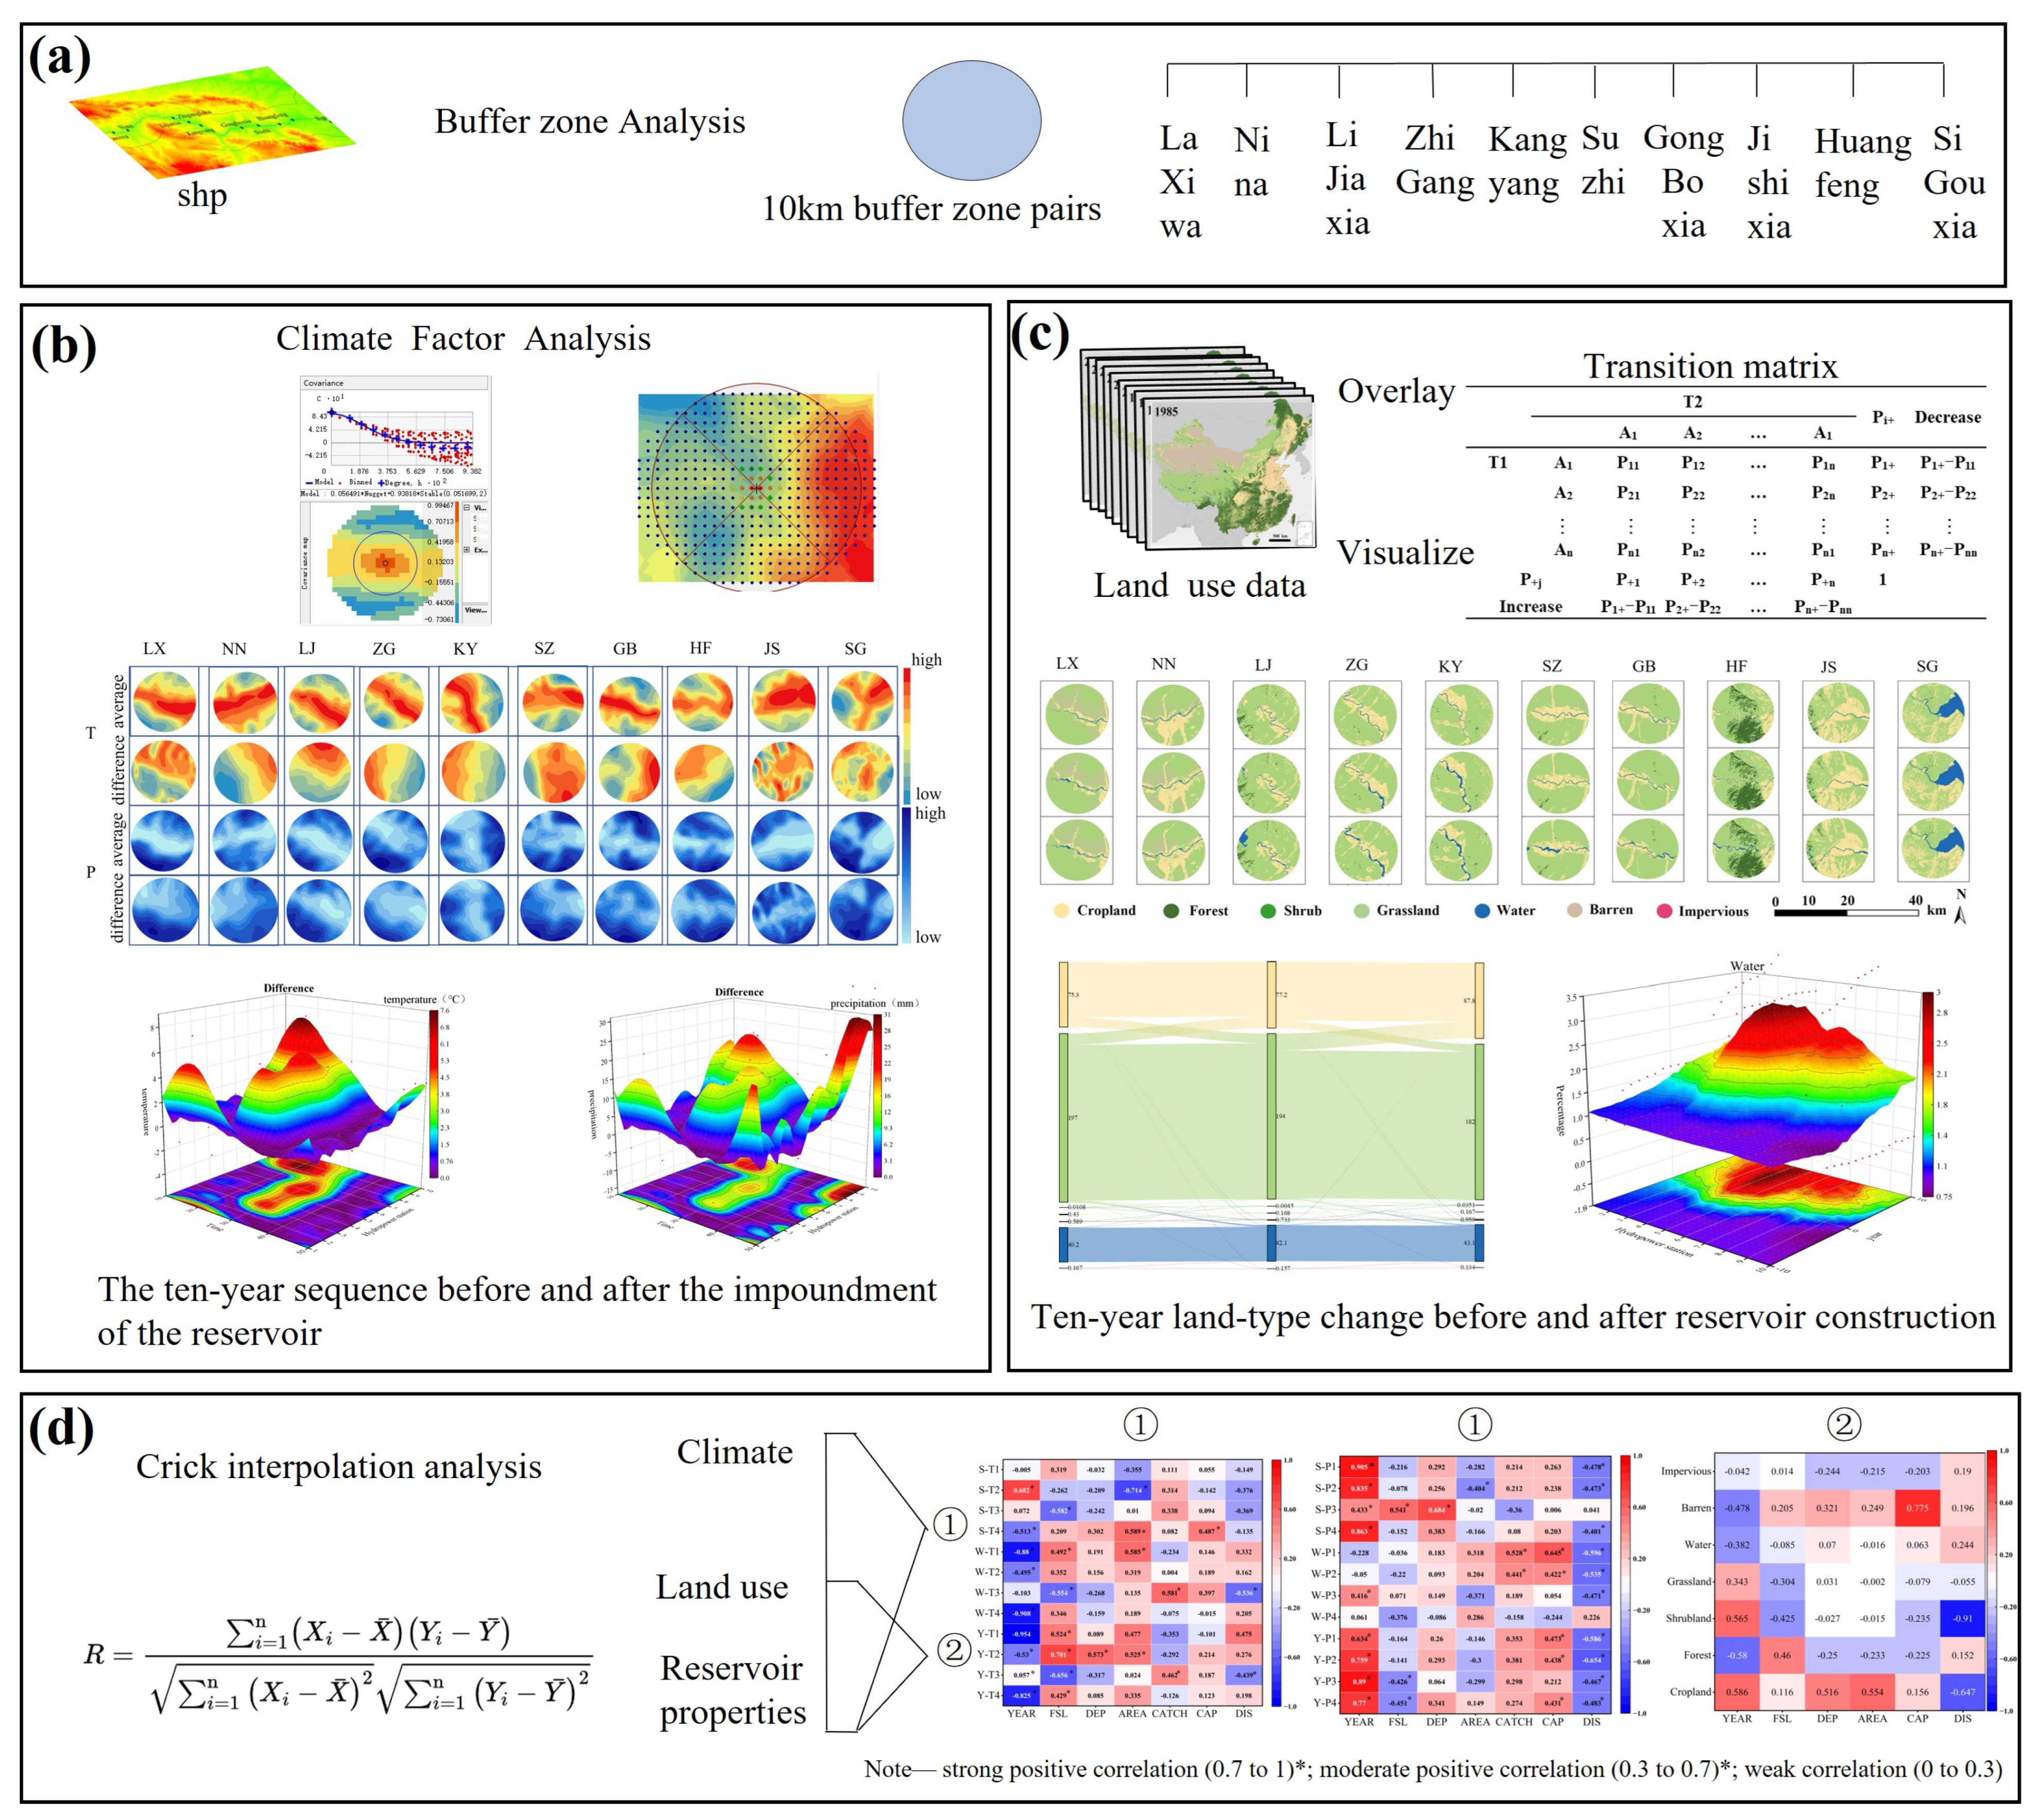
2.3. Methods of Analysis

This study analyzed local climate and environmental changes before and after the construction of reservoirs, focusing on meteorological variables such as precipitation and temperature, as well as land use changes. To ensure consistency, 10-year time series data before and after the construction of each reservoir were compared. Given that the study spanned from 1982 to 2022, only reservoirs constructed between 2000 and 2010 were included, while those built in other periods were excluded. First, differences and ratios of climate variables before and after the construction of each reservoir were calculated, and land use changes were assessed. Then, correlation analyses were performed to examine the relationships between reservoir attributes, climate variables, and land use changes (Figure 2).

2.3.1. Buffer Analysis

Buffer zone analysis is a critical spatial analysis function in geographic information systems (GIS), widely used in land use and topographic studies. It has been shown that the area surrounding a reservoir, typically within 5–10 km, is considered the direct impact zone, where environmental, climatic, and ecological changes can be significant [33]. Therefore, in this study, a 10 km buffer zone centered on each of the UYR reservoirs was established for land use and climate data extraction and analysis. This approach enabled a more precise assessment of the specific impacts of reservoir construction on environmental changes in the surrounding area (Figure 2a).

2.3.2. Land Use

The land use transfer matrix is a two-dimensional matrix that illustrates the changes in land cover status at different time points within the same area. By analyzing the transfer matrix, it is possible to determine the conversion of land categories between two time stages and describe the land categories changing over time, along with the corresponding area of change (Figure 2c).
Land use dynamics refers to the quantitative changes in land use types over a specified period, primarily reflecting the intensity of land use changes and regional differences in the rate of change. This can be divided into two categories: single land use dynamics and comprehensive land use dynamics.
Single land use dynamics are calculated as follows:
K = U b U a U b × 1 T × 100 %
where K is the attitude of a land use type during the study period, U a is the area of a land use type at the beginning of the study, U b is the area of the land use type at the end of the study, and T is the length of the study.
Integrated land use dynamics are expressed as follows:
L C = i = 1 n Δ L U i j 2 i = 1 n L U i × 1 T × 100 %
where LC is the integrated dynamic attitude of land use in the study area, L U i is the area of class i land use type at the starting time of the study, Δ L U i j is the absolute value of the area of class i land converted to the class j land use type during the study time, and T is the study time.

2.3.3. Methods of Meteorological Analysis

  • Linear regression: Taking the reservoir operation as the boundary, the climatic tendency rate method was used to calculate the variability in temperature and precipitation elements in the two periods of 10 a before and 10 an after the start of water storage in each reservoir. The change in climate propensity before and after impoundment can remove the influence of the general background of long-term changes in the elements, and together with whether or not the elements change suddenly during impoundment, it can reflect the influence of impoundment on the elements. The slope of the linear regression model was used to describe the trend of each meteorological variable (Figure 2b).
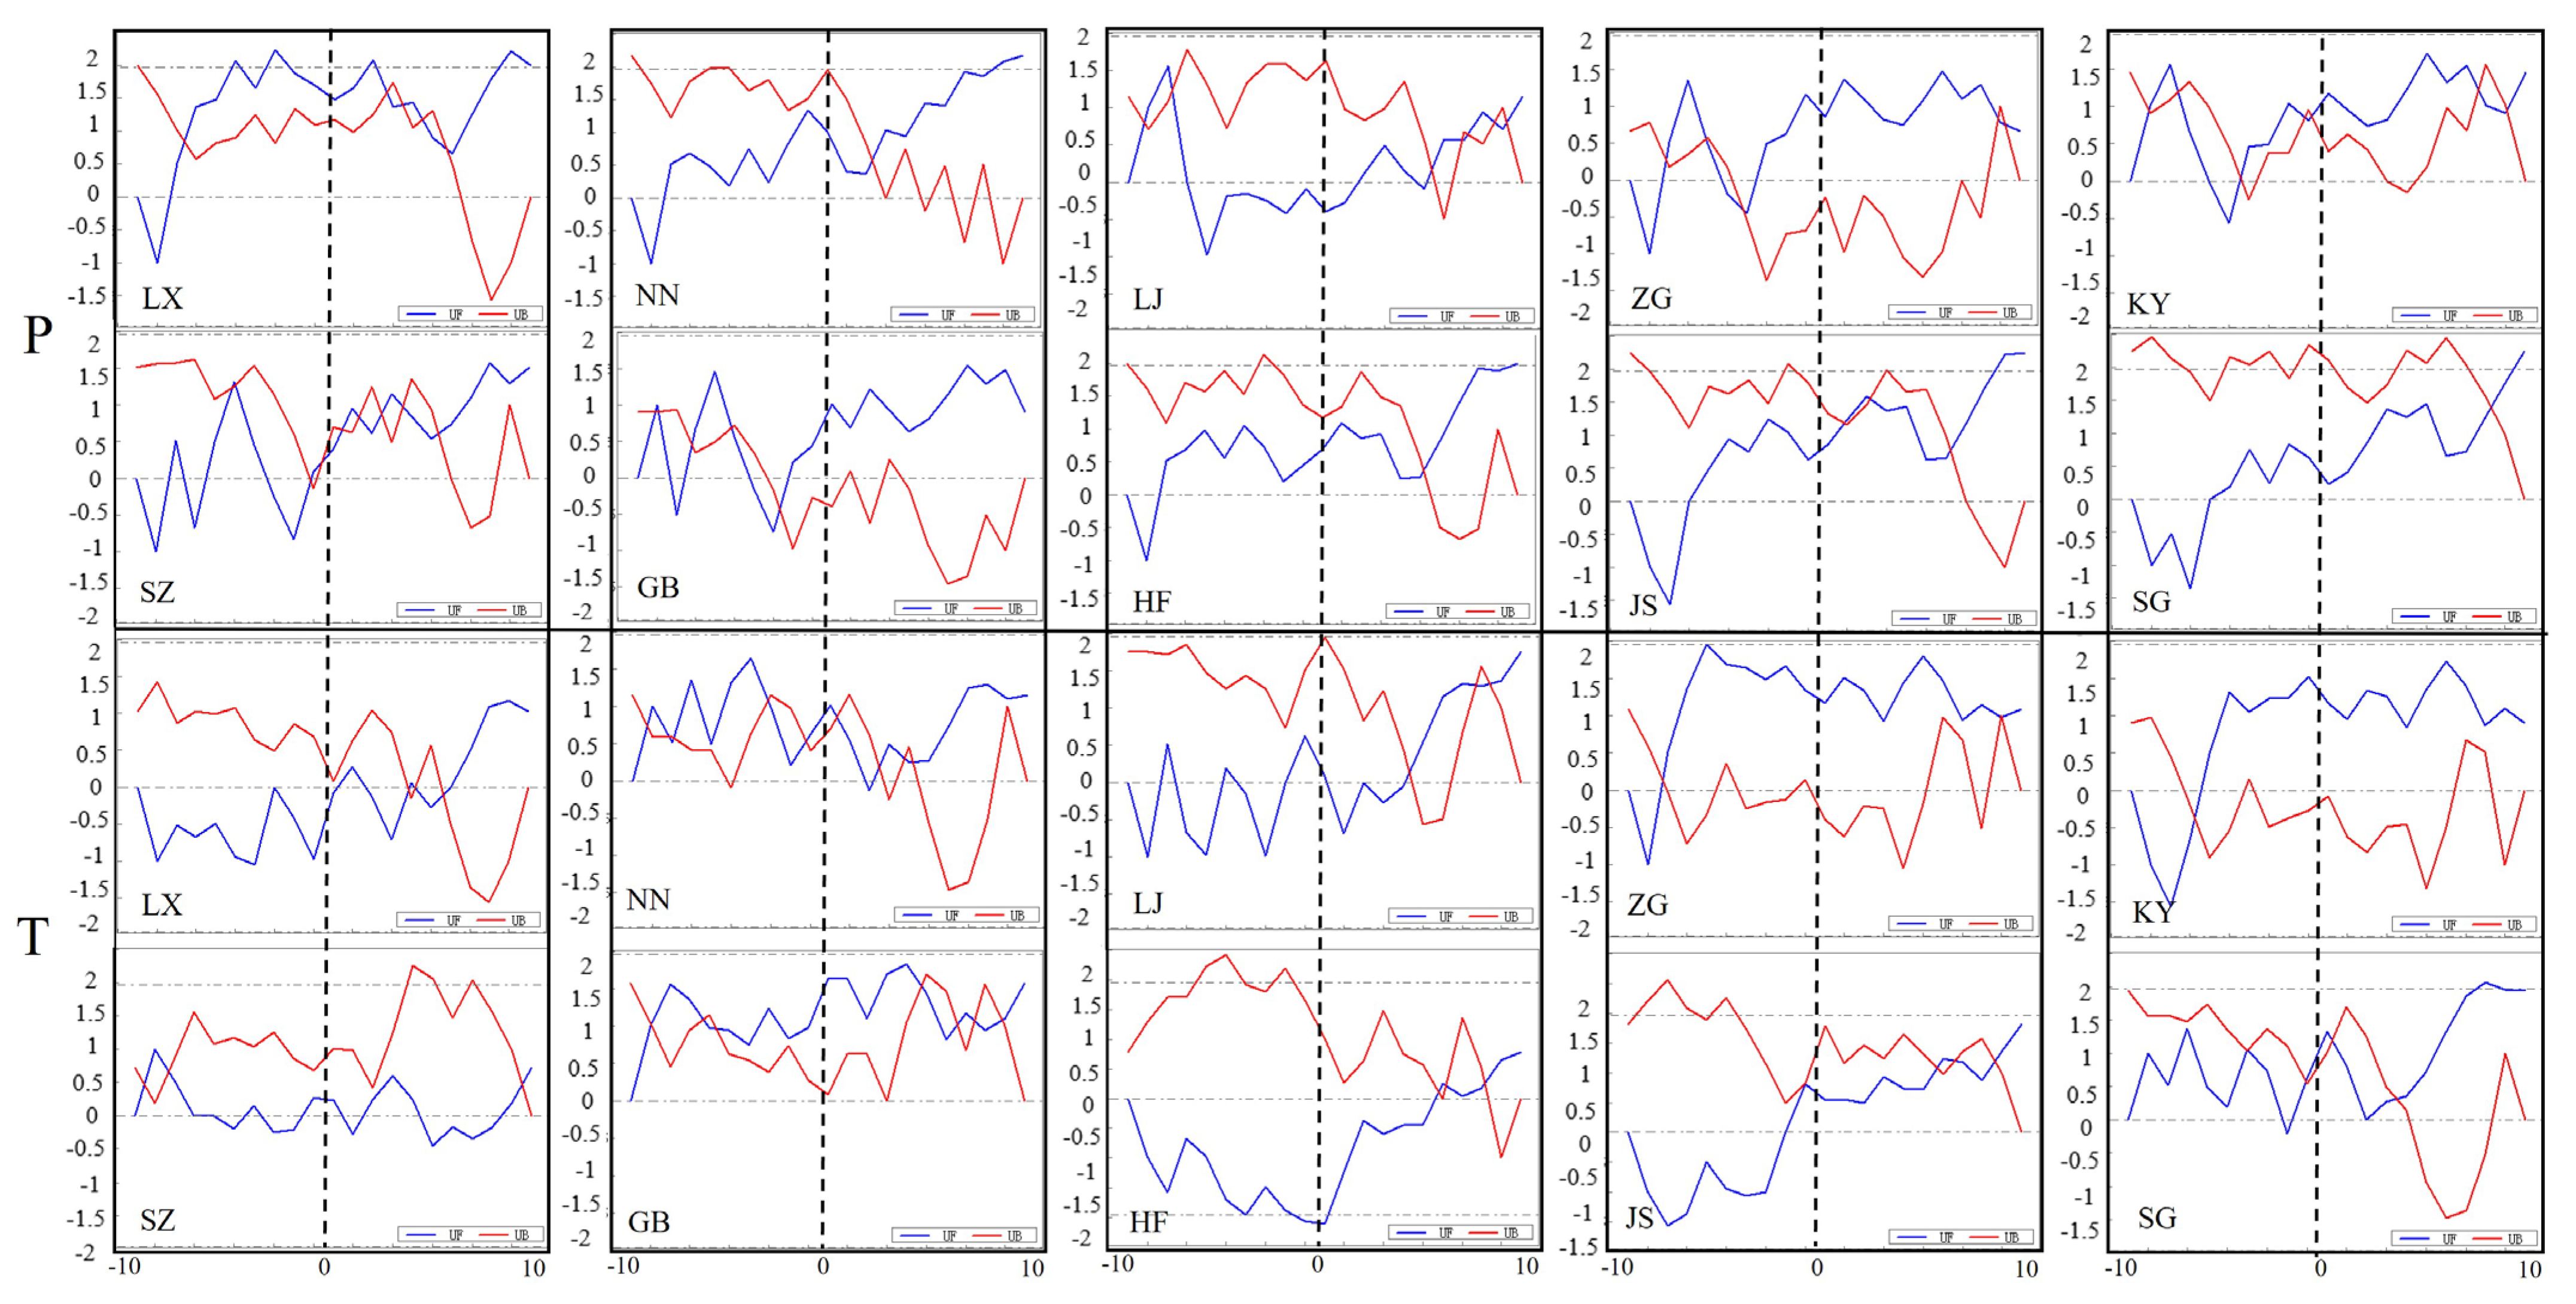
  • Climate-type M-K mutation test to obtain the climate jumping points, tested at the significance level of 0.05: The Mann–Kendall mutation test is a nonparametric statistical test with the advantage that it is not only easy to compute but also identifies the moment of mutation onset and indicates the region of the mutation period.

2.3.4. Correlation Analysis Between Basic Reservoir Attributes and Climate Factors

In this study, we analyzed the correlation between basic reservoir attributes and climate factors using the Pearson correlation coefficient (Figure 2d). The Pearson correlation coefficient measures the strength and direction of the linear relationship between two variables and is calculated as follows:
R = i = 1 n ( X i X ¯ ) ( Y i Y ¯ ) i = 1 n ( X i X ¯ ) 2 i = 1 n ( Y i Y ¯ ) 2
where X i and Y i are the ith observation of variables X and Y, respectively; X ¯ and Y ¯ are the means of variables X and Y; and n is the total number of observations. R is the correlation coefficient (−1 ≤ R ≤ 1), and the absolute value of R indicates the strength of the linear correlation.
After analyzing the basic characteristics of the reservoir and its associated reservoirs, we identified seven quantitative reservoir control factors (RCFs): catchment area (CATCH), surface area (AREA), storage volume (CAP), mean depth (DEP), normal storage level (FSL), long-term average flow (DIS), and year of construction (YEAR). Additionally, two commonly used meteorological variables, precipitation (P) and temperature (T), were selected to represent local climate change.
To quantify the relationship between these seven reservoir control factors and the 12 meteorological variables, we designed four metrics for each meteorological variable: T1, T2, T3, and T4. The specific definitions are as follows:
T1: Variance in temperature series after reservoir construction.
T2: Variance difference in temperature series before and after reservoir construction.
T3: Long-term annual average value (LAAV) of temperature series after reservoir construction.
T4: Difference in the LAAV of temperature series before and after reservoir construction.
These indicators were used to analyze changes in annual (A), winter (W), and summer (S) temperatures. For precipitation (P), four similar indicators (P1–P4) were developed. The primary considerations in designing these metrics are as follows: (1) this study focuses on the long-term annual average (LAAV) and variance of each meteorological variable, which are key attributes in time series analysis, and (2) the study aims to determine whether reservoir construction has a static effect (i.e., changes in meteorological variables after reservoir construction) or a dynamic effect (i.e., differences in meteorological variables before and after reservoir construction) on these variables. Additionally, to explore the relationship between reservoir management and land use changes, the relative value of land type changes before and after construction was used as an indicator of the extent of temporal land use change.

3. Results

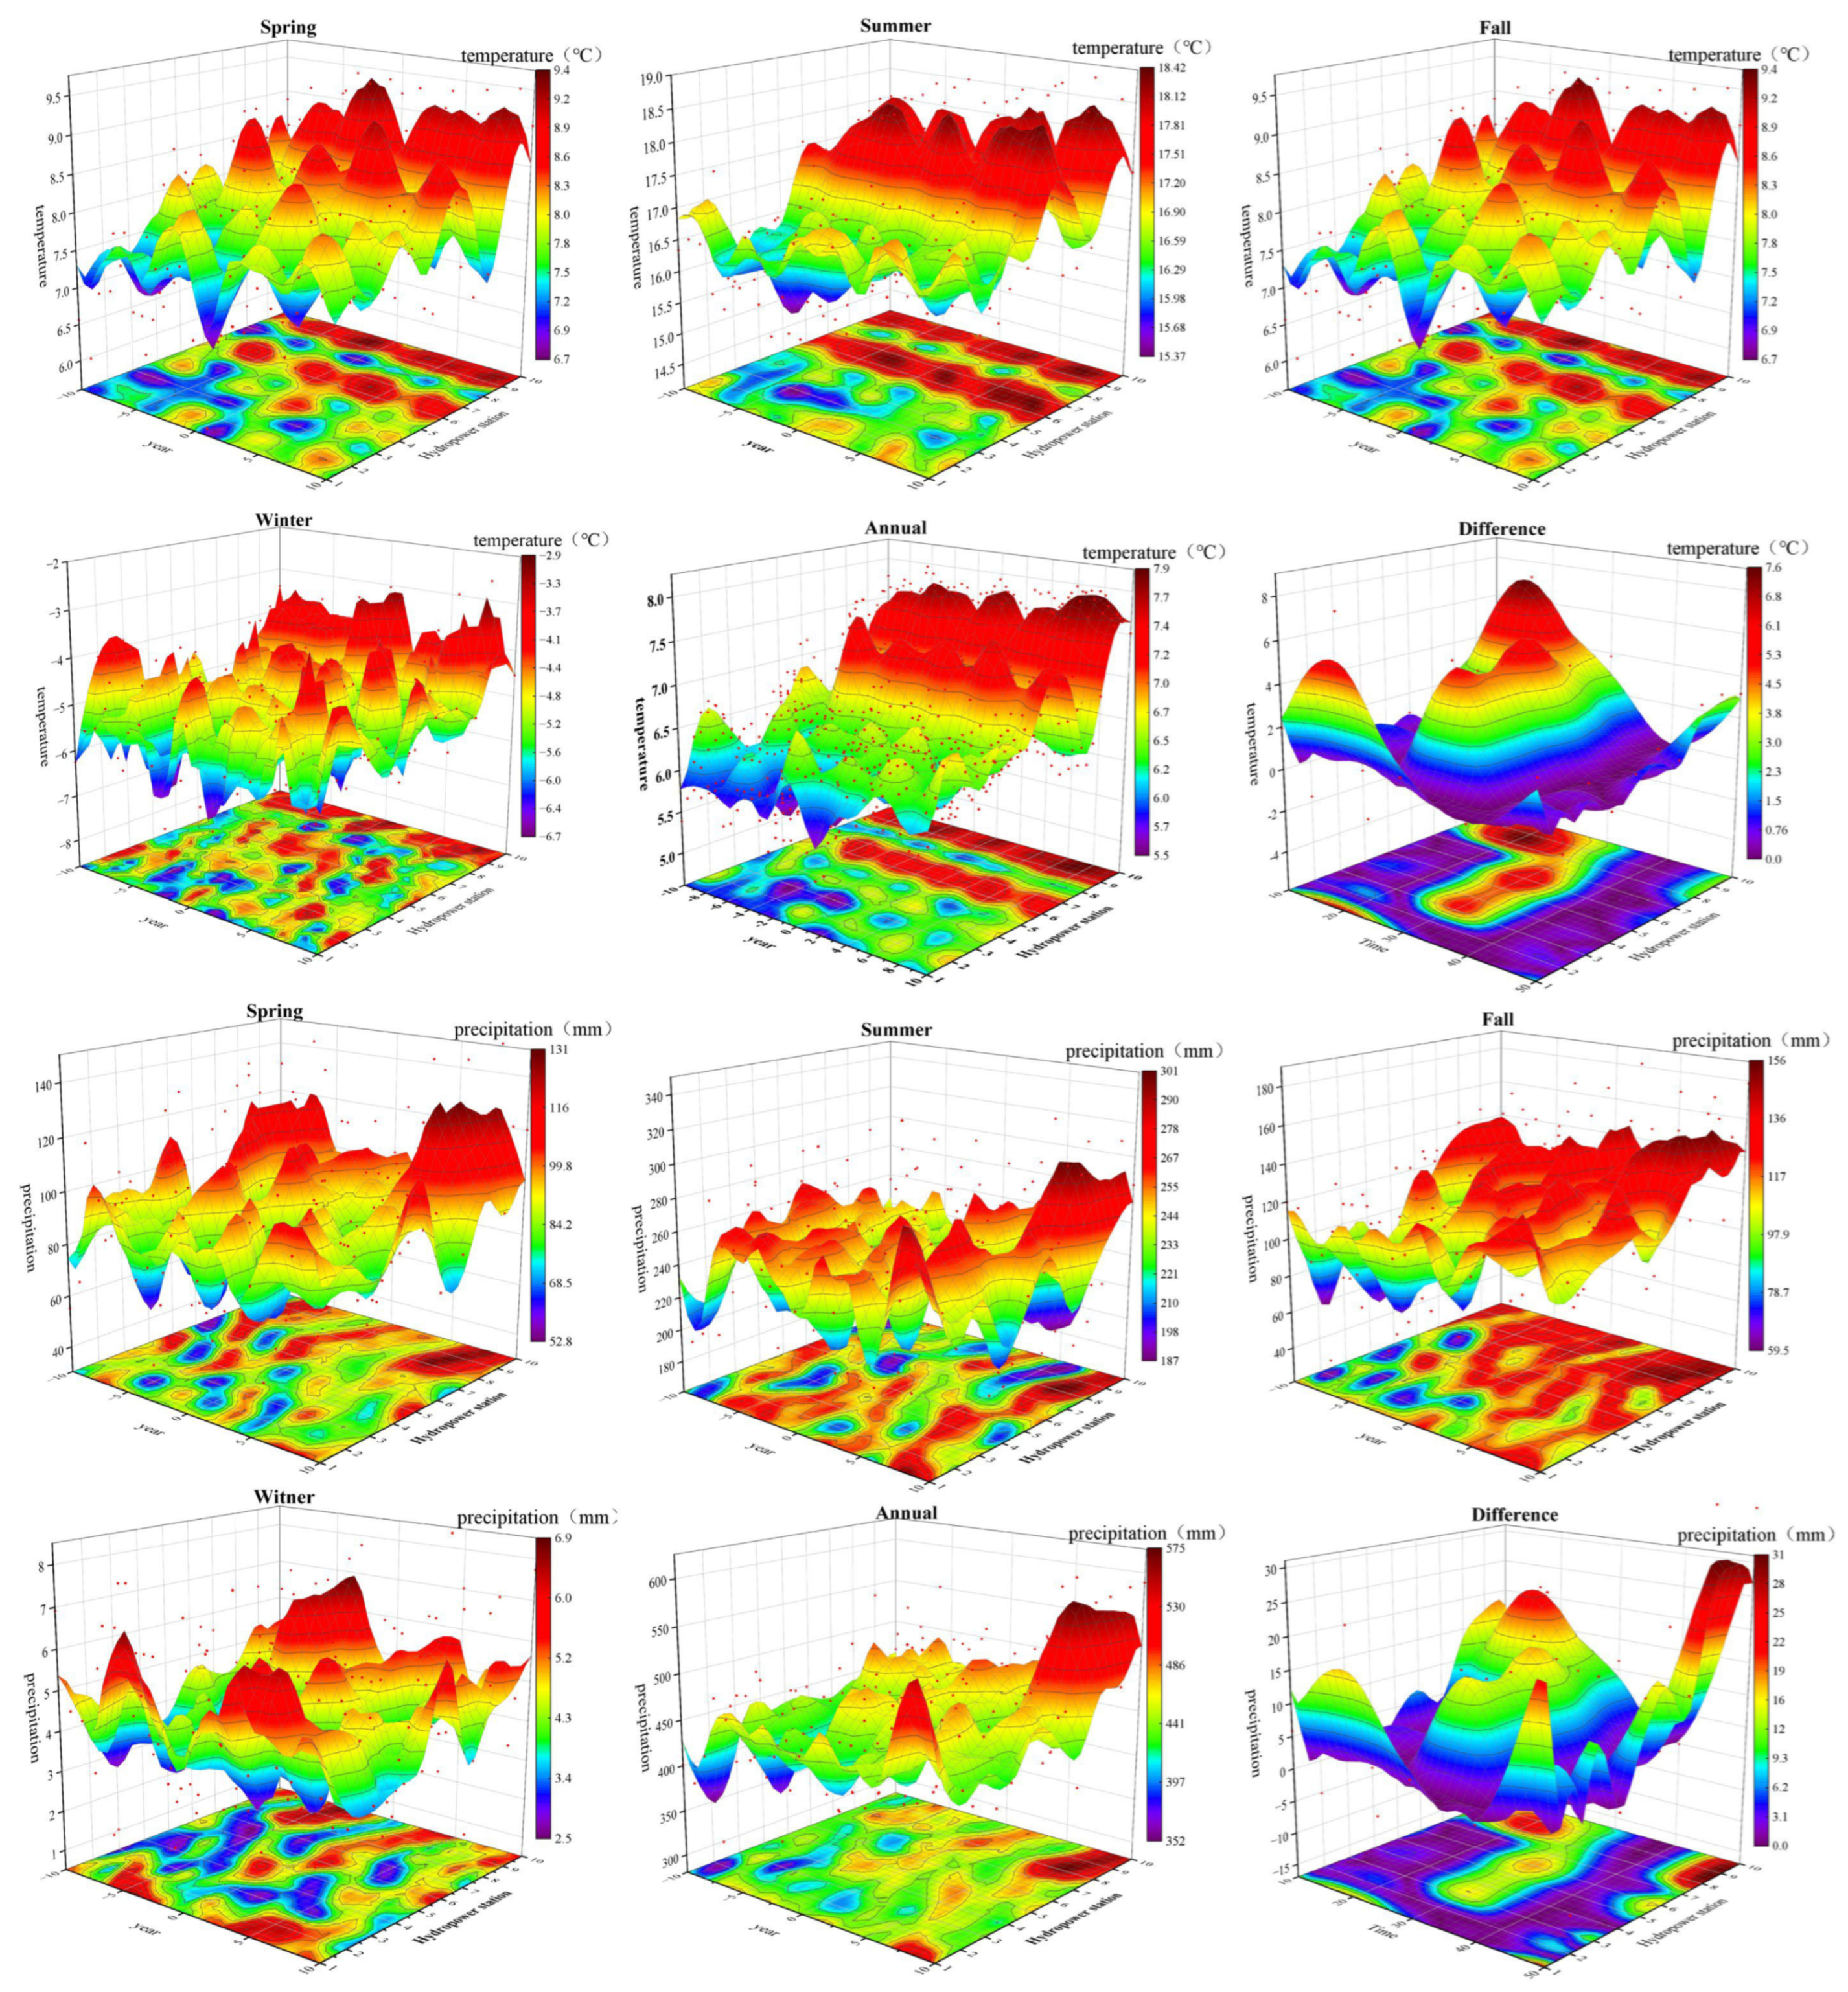
3.1. Localized Climate Change

To better analyze the meteorological changes in the ten regions, we calculated the difference in meteorological elements between two distinct periods (Table 3). Compared to the period before the construction of the reservoir, climate change is primarily characterized by increases in both precipitation and temperature after the reservoir’s construction. Annual precipitation in the region is unevenly distributed, with concentration during the summer months (Figure 3). After construction, both average temperature and precipitation showed increases on an annual scale (P range 3–10%, e.g., 0.3 °C/10a in LJ and 41.26 mm/10a in JS).
In terms of seasonal variations, both temperature (T) and precipitation (P) increased across all seasons, except for a decrease in mean temperature during winter, with the most noticeable changes occurring in spring and fall (Figure 3). The largest temperature increase occurred in spring at LJ (0.51 °C/10a) and in fall at JS (0.38 °C/10a). Despite an overall trend of increasing precipitation, some areas experienced a decrease in spring and summer (three regions showing declining precipitation), while winter precipitation generally remained negative, though with less variability. Regarding the rate of temperature change, summer trends remained consistent with pre-construction patterns (observed in 7 out of 10 reservoirs), with relatively small temperature changes following construction, the maximum rate being 0.7 °C/10a. Notably, winter temperature changes showed the largest differences between reservoirs after construction, with some reservoirs reversing their temperature trends. For instance, the temperature at LJ dropped by −2.4 °C/10a before construction but increased by 1.0 °C/10a after construction, resulting in a 3.4 °C/10a change (Table 3). Temperature changes were steeper in the annual and fall periods and smaller in winter.
Precipitation changes were more complex and exhibited clear regional differences. A gradual decline compared to the previous period suggests that the reservoir had a more pronounced impact on local precipitation patterns. The negative slope of precipitation change in the LJ and KY reservoirs indicates alterations in local precipitation distribution, affecting its spatial patterns (Figure 3). Following construction, autumn precipitation increased, while spring and summer saw decreases in certain areas. Winter precipitation exhibited minimal variation, with most areas showing lower rates of change. The most significant rate of change occurred in summer, with the GB reservoir experiencing a 6.89 mm/decade increase, and the smallest occurred in winter, with the ZG reservoir showing a 0.22 mm/decade decrease (Table 3). Overall, summer precipitation in the reservoir area generally increased by 5–15%, whereas winter precipitation changes were minimal, typically within ±3%. Following reservoir construction, the temporal precipitation trend exhibited an enhanced increase in summer, while winter precipitation trends remained relatively stable. At certain hydropower stations, precipitation slopes showed an increasing trend across all seasons, indicating the gradual emergence of local climate effects after reservoir impoundment.
In terms of spatial distribution, both temperature and precipitation show clear regional differences, with temperature being highest in the reservoir areas and lower in the surrounding regions, while precipitation follows the opposite pattern (Figure 4). As shown in Figure 3, temperature fluctuations exhibit two peaks, and the temperature in the LX to SJ areas generally increases over time.

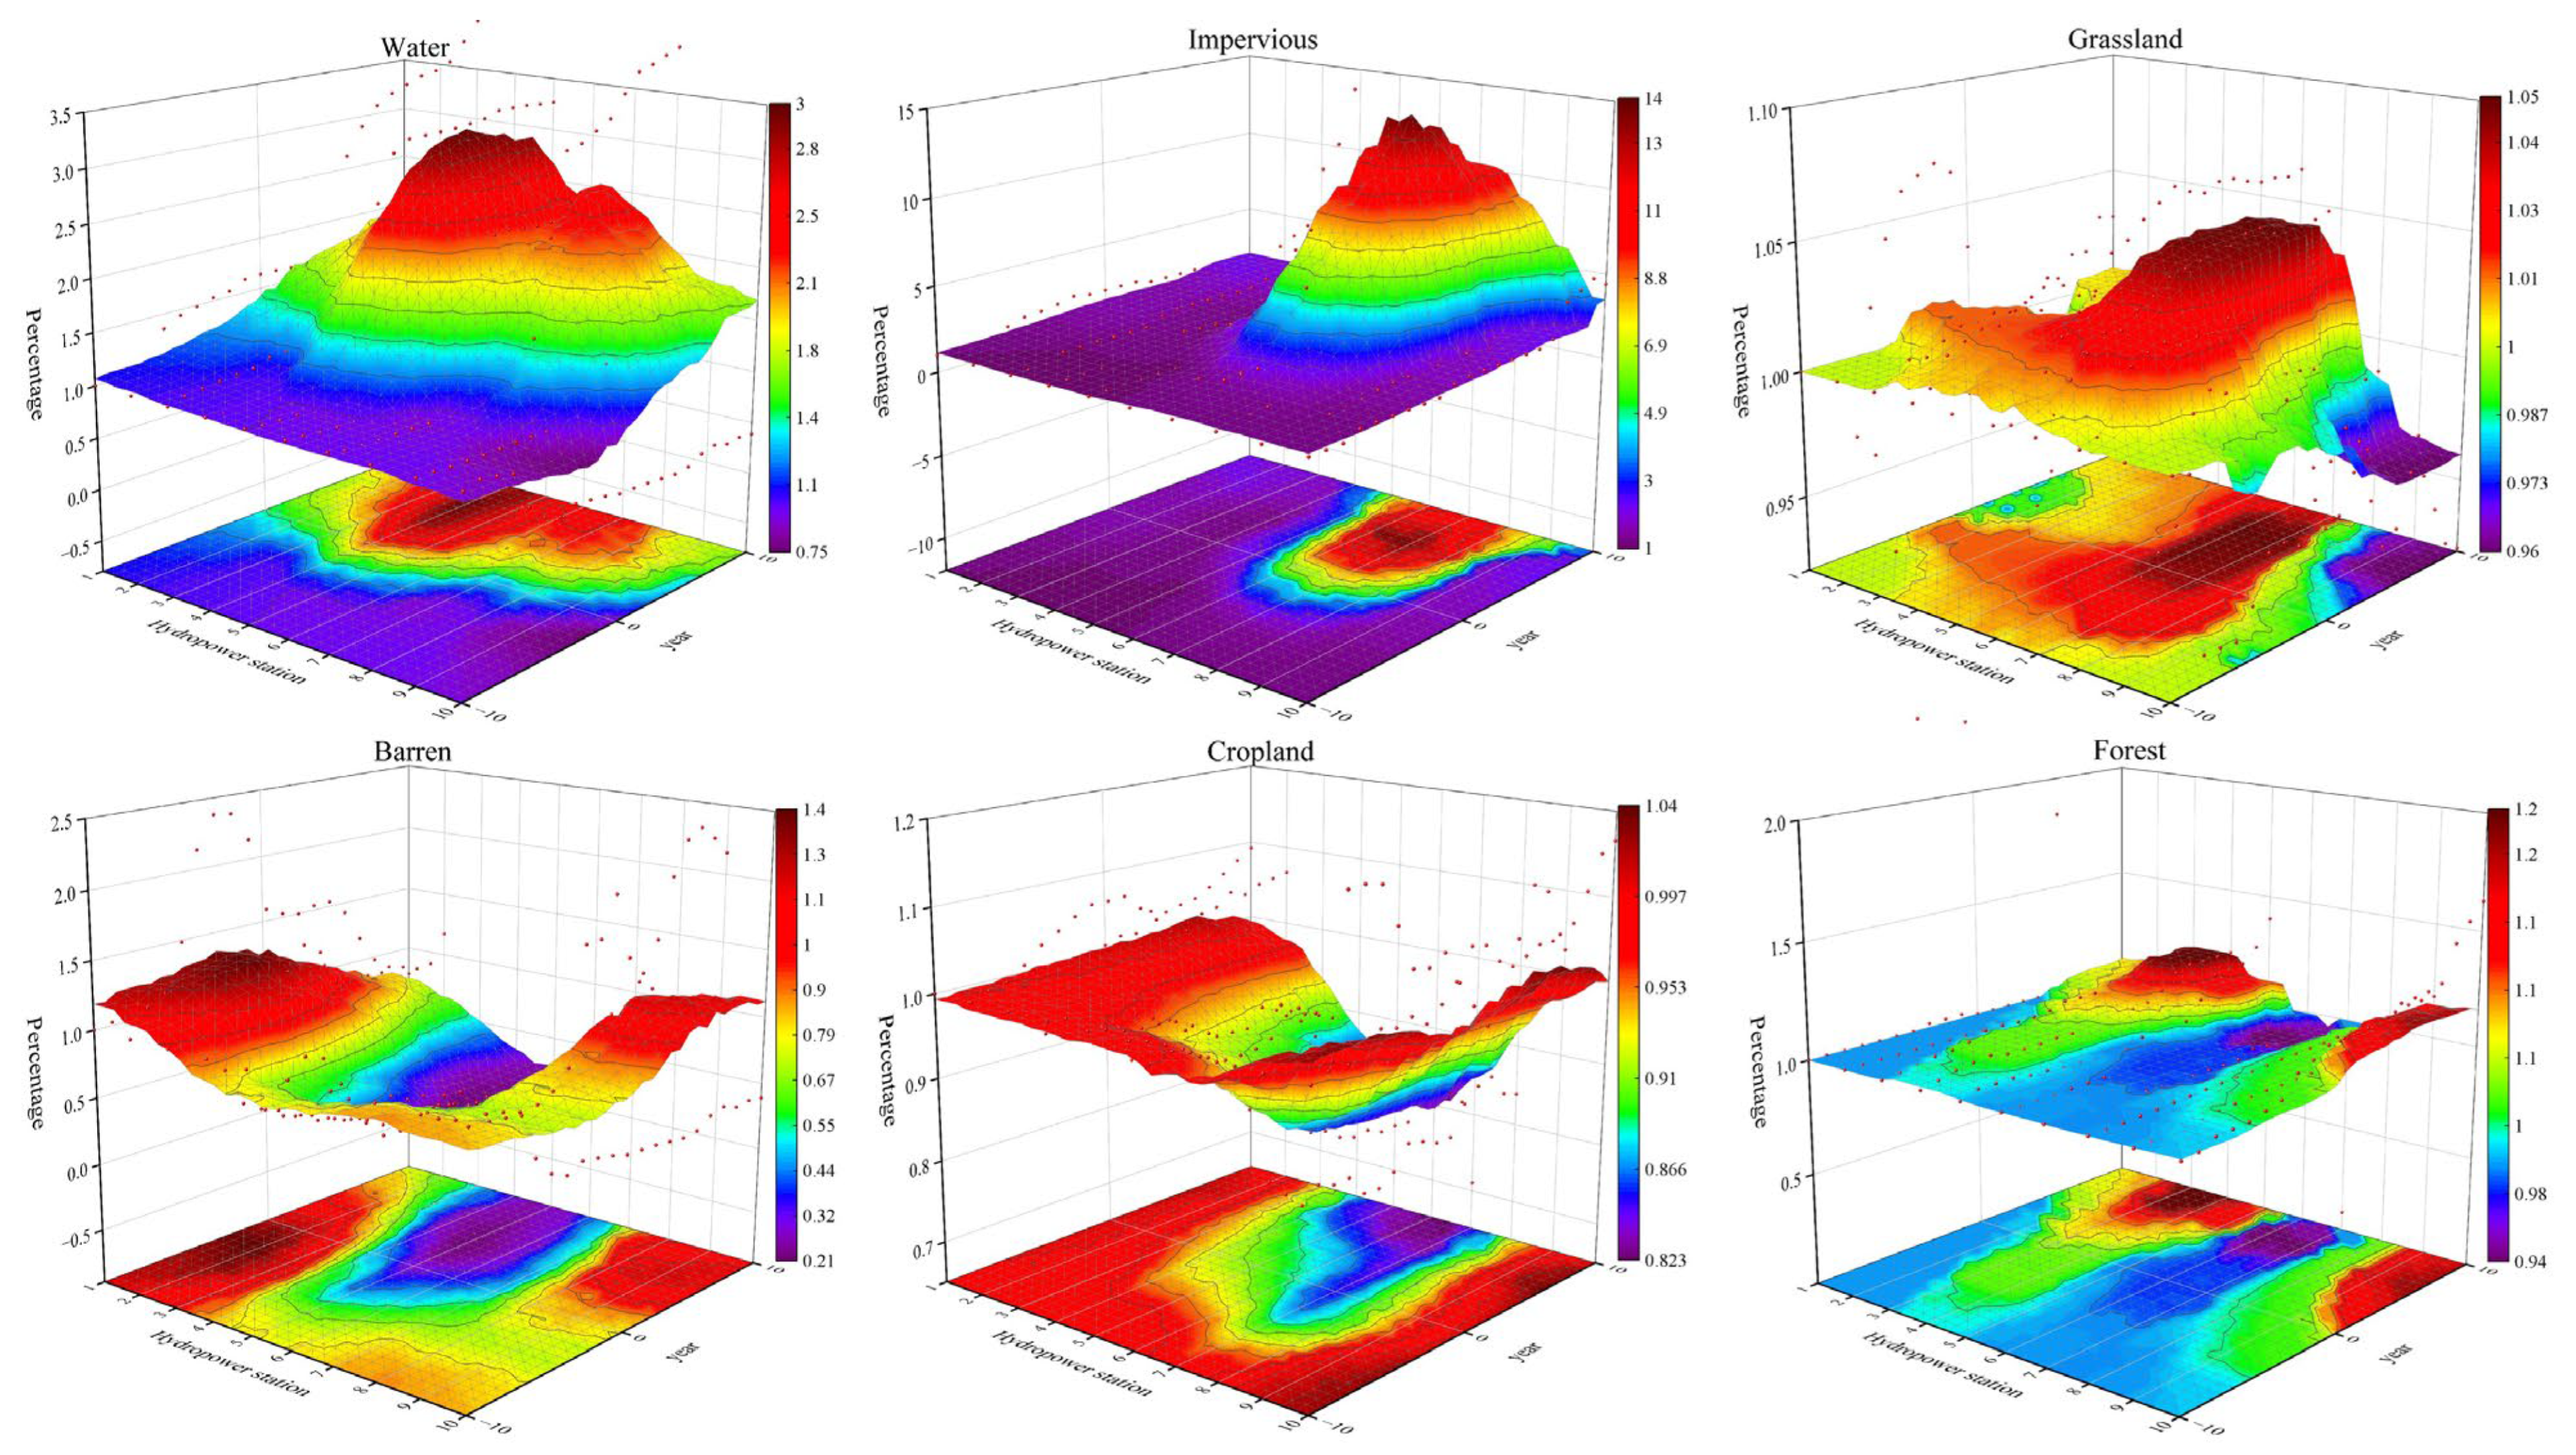
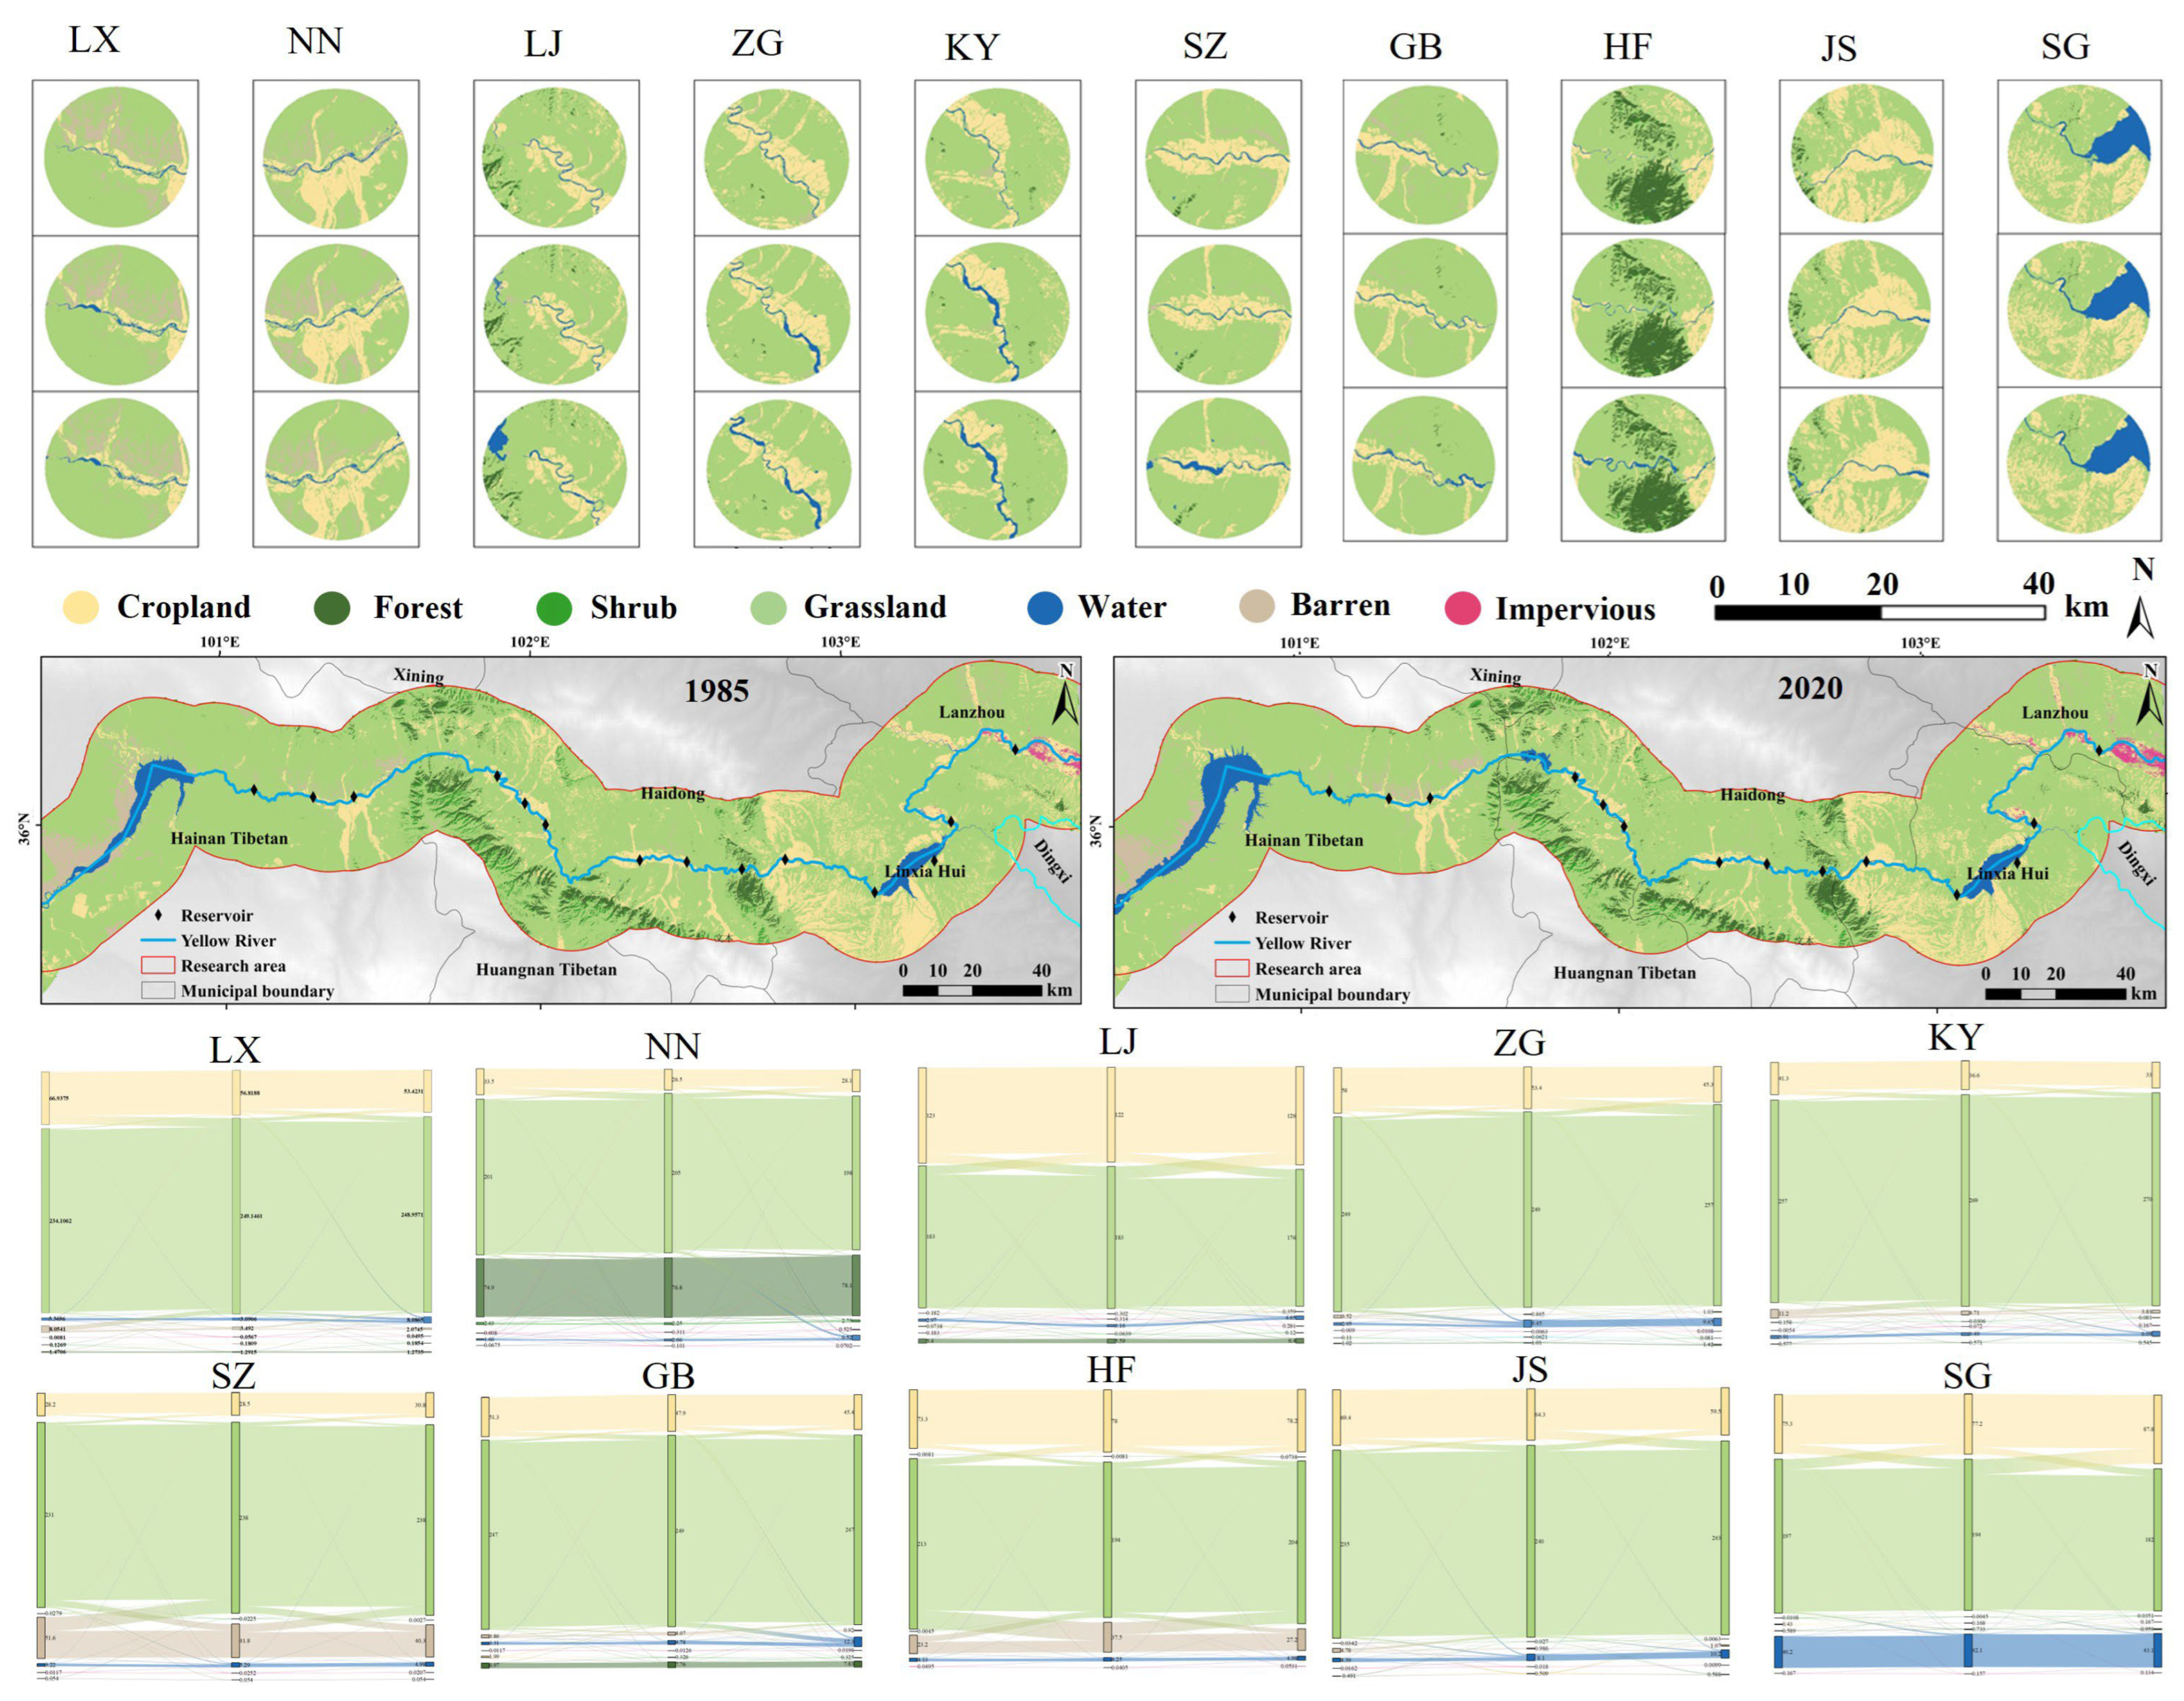
3.2. Land Use Change

The analysis of the dynamic evolution of the spatial pattern of ecosystems around each reservoir revealed that the buffer zones were predominantly composed of grassland and cropland ecosystems, which together accounted for more than 80% of the total area on average, cropland ecosystems were primarily concentrated in areas near the rivers (Figure 5). Following the construction of the reservoirs, there was a gradual expansion of cropland, forest, barren, and water ecosystems over time, while grassland and barren ecosystems contracted (Figure 6).
The dynamic rates of change in different ecosystems exhibited distinct patterns during two phases: the 10 years before and the 10 years after reservoir construction. Over the decade following construction, significant increases were observed in the areas of water bodies, impervious surfaces, and forest ecosystems, particularly in the LJ, KY, and HF reservoir regions. Notably, the area covered by water bodies expanded by 200%. This change is primarily attributed to watershed expansion and wetland restoration associated with reservoir impoundment. In the SZ reservoir area, the impervious surface increased dramatically by approximately 30 times, reflecting land use changes and accelerated urbanization resulting from reservoir construction. Additionally, forest cover increased substantially in most areas, especially in the LJ and KY regions, with the exception of the NN area, where the change was less pronounced. The rise in forested areas is closely linked to afforestation and ecological restoration projects around the reservoirs, particularly in regions implementing the “returning farmland to forest” policy. In contrast, barren and cropland areas showed more noticeable reductions. In most regions, both decreased after reservoir construction, with the LJ reservoir area experiencing the most significant reduction in barren land, decreasing by 34.7% (Figure 5). This change may be related to land reclamation, ecological restoration measures around the reservoir, and agricultural abandonment policies. The reduction in cropland was relatively minor, mainly due to the conversion of farmland to other land uses or inundation caused by the reservoir. Grassland changes were more complex and varied across regions. Although the overall change was relatively small, the expansion or degradation of grasslands in different areas was influenced by a combination of factors, including reservoir construction, climate change, and land use policies.
The dynamic evolution of buffer zone ecosystems, both before and after the construction of each reservoir, was analyzed using the ecosystem transition matrix and chord diagrams. The results revealed significant spatial heterogeneity in ecosystem changes across the regions, with a substantial transformation of overall ecosystems, accounting for 5.2% to 12.5% of the total area in each region (Table 4). Reservoir construction had a profound impact on the surrounding ecological environment, particularly on land types such as water bodies, cropland, grassland, and forest, triggering complex ecological transformations. The most significant change during the ecosystem transition was the conversion of grassland to cropland, which represented the largest portion of the ecological shift (Figure 6). Other notable transition pathways included grassland to cropland, barren to grassland, and barren to impervious surfaces, together accounting for 93.2% of the total transition area. Additionally, the shift from cropland to forest, grassland, and shrubland was an important trend, with a total shift area of 15.5%. Analyzing these transformation paths revealed that grassland, cropland, and water ecosystems occupied the largest transition areas at all stages. In particular, ecological transitions between grassland, cropland, and water were prominent, with substantial transitions occurring at each stage. Furthermore, the transition paths involving grassland, cropland, water, and barren land constituted the largest portion of the area. The inundation caused by reservoir impoundment directly drove dramatic changes in land cover types in the reservoir area, making it one of the key drivers of ecological change in the region.

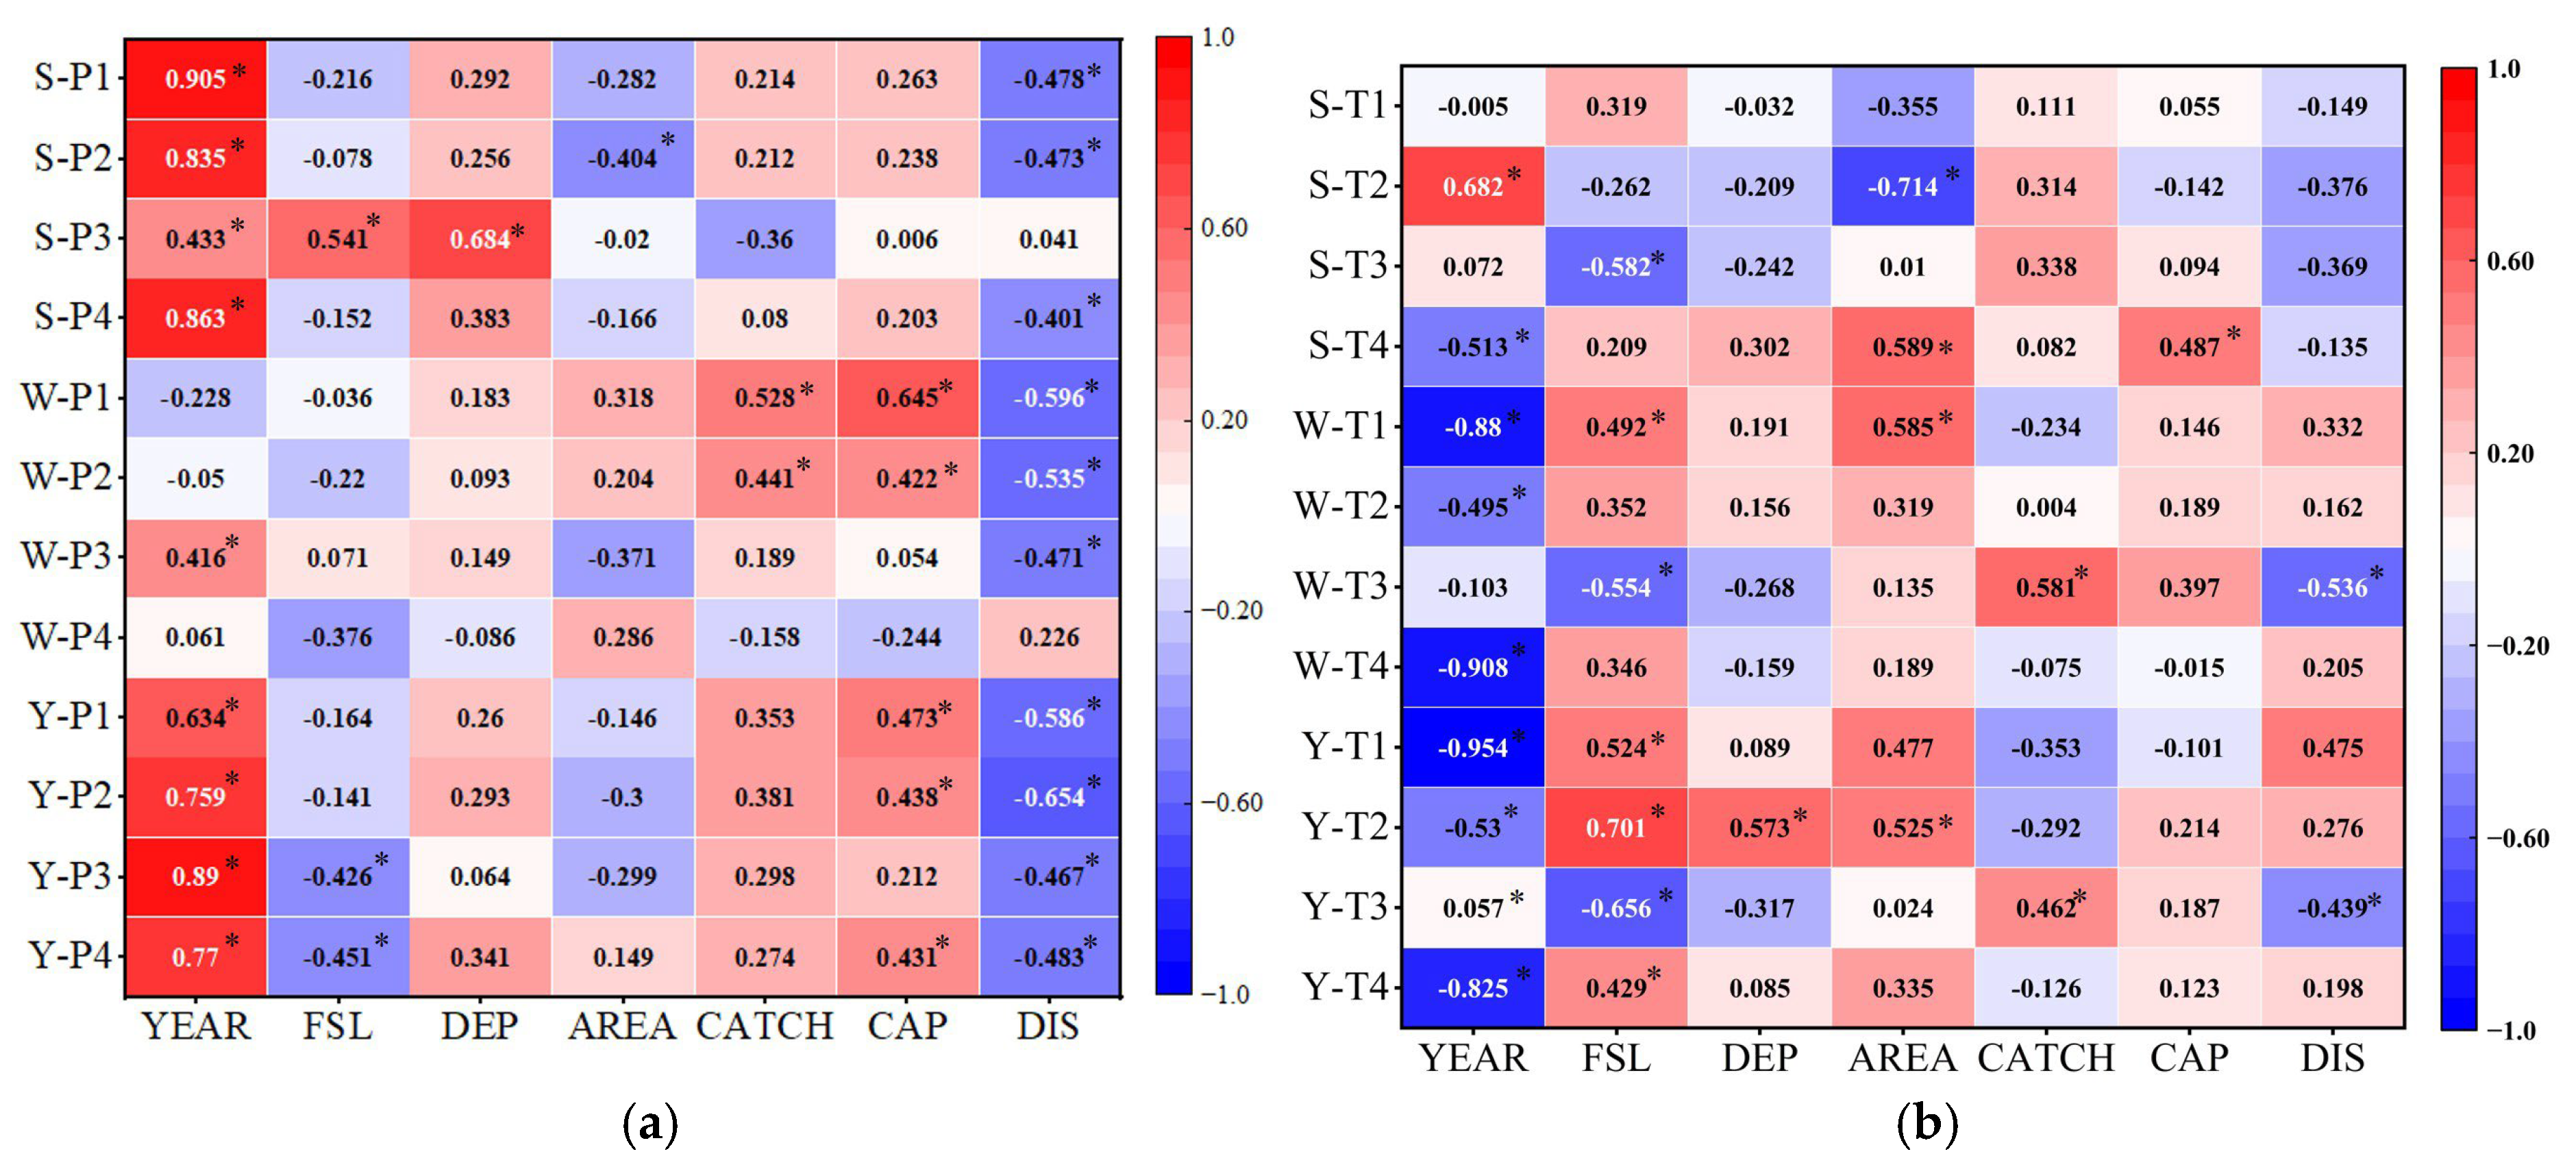
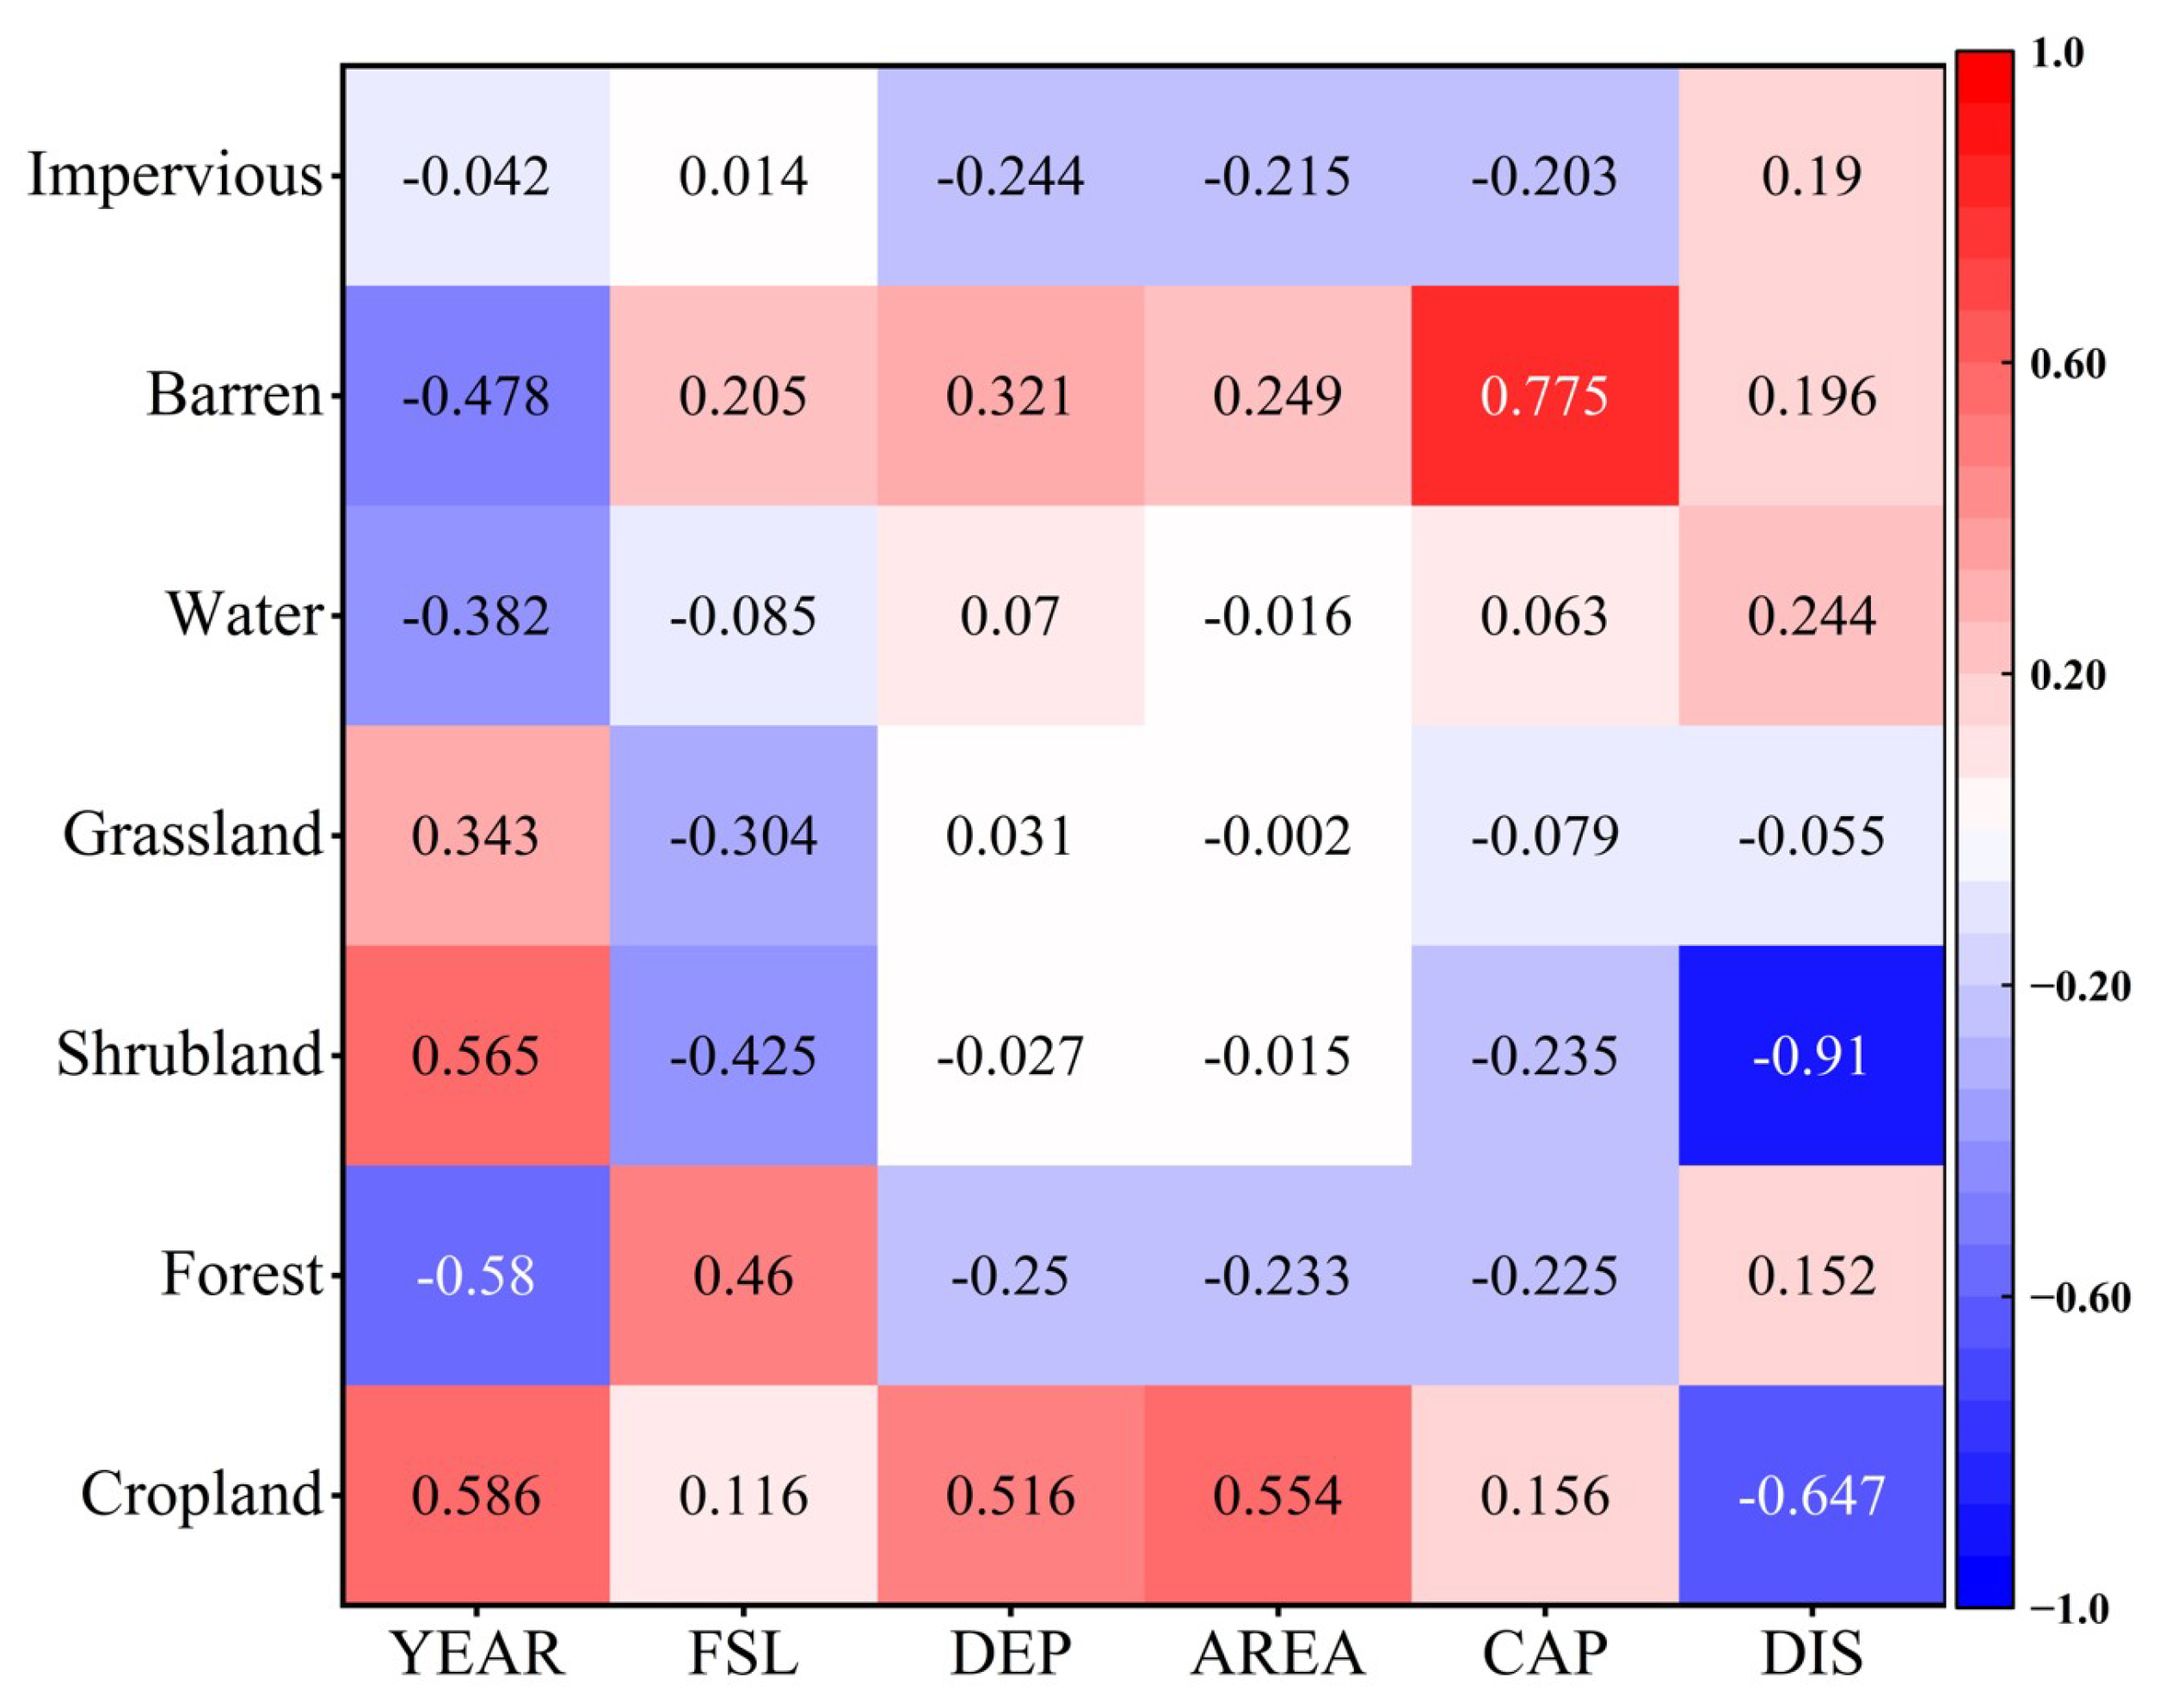
3.3. Correlation Between Reservoir Properties, Climate, and Land Use Change

As shown in Figure 7a, precipitation-related variables (Y-P2 and Y-P4) are significantly correlated with five of the seven regional cooperation frameworks (RCFs)—AREA, CAP, DIS, and DOR—out of the 12 indices. In particular, the correlation between Y-P2 and Y-P4 with YEAR passes the significance test at the p < 0.05 level, while Y-P3 also shows a significant correlation with YEAR at the p < 0.01 level. Additionally, Y-P2 and Y-P4 were significantly correlated with four RCFs (AREA, CAP, DIS, and DOR). A comparison of the correlation strengths between the S-P and W-P (1–4) indicators for different regions and RCFs reveals that reservoir attributes have a more pronounced impact on precipitation during the summer months than in winter. Specifically, YEAR, CAP, and DIS exert a stronger influence on precipitation, while DEP shows a weaker correlation with precipitation.
In the case of the temperature variable, its correlation pattern with precipitation differs, showing significant correlations with six RCFs (excluding DEP), with a greater number of significant tests compared to that for precipitation (Figure 7b). Notably, S-T1 shows no significant correlation with any of the RCFs. From the perspective of RCFs, it is important to note that CAP and DEP exhibit weaker correlations with the overall temperature index, while YEAR, FSL, AREA, CAP, and DIS have a stronger influence on temperature, particularly YEAR and AREA. Among the reservoir attributes, YEAR has a more significant effect on both temperature and precipitation. However, when considering the effect of FSL on the post-reservoir precipitation series (LAAV), its impact on precipitation is more pronounced than that on temperature, especially on -T4. Compared to other RCFs, CAP and DIS have a stronger influence on precipitation, with a lesser effect on temperature. In contrast, some RCFs (e.g., AREA, CATCH) have a greater impact on temperature than on precipitation.
Figure 8 illustrates the correlation between basic reservoir attributes and land use changes. The correlation coefficients reveal notable relationships between different land use types and reservoir attributes. Specifically, impervious surfaces show a strong negative correlation with FSL (−0.638), while barren areas are more positively correlated with the reservoir attribute AREA (0.332). Water demonstrates a strong negative correlation with several reservoir attributes (YEAR, FSL, and CAP), indicating that changes in water may significantly impact water body utilization. Grassland shows weaker correlations with reservoir attributes such as CAP and DIS, though a relationship remains. The correlations between shrubland, forest, and cropland with other reservoir attributes are more complex, showing both positive and negative correlations. This reflects the diverse and multifaceted nature of how basic reservoir attributes influence changes in these land use types. Through these correlation analyses, a deeper understanding of how reservoir attributes affect land use changes can be achieved.

4. Discussion

4.1. Impact of Reservoir Construction on Climate Change

The impact of reservoir construction on localized climate change is a complex and multifaceted issue. In this study, a comparative analysis of temperature and precipitation before and after the construction of several reservoirs reveals notable changes in local climate characteristics (Figure 6). Following construction, the mean annual temperature stabilized, suggesting that reservoirs effectively mitigated the broader trend of warming [34]. The impact of reservoir construction on temperature varies by season. Temperature changes were most pronounced in spring and summer. In spring, the rate of temperature decrease slowed compared to pre-construction levels (Table 3). This may be due to the increased water surface area of the reservoirs, which enhances heat capacity and evapotranspiration, thereby slowing the rate of temperature decline [35]. In summer, increased evapotranspiration from the reservoir had a dual effect: it lowered daytime temperatures through evaporation and raised nighttime temperatures due to the water body’s thermoregulatory effect, resulting in a reduced daily temperature range. These findings suggest that reservoirs significantly modulate local temperature fluctuations by increasing the water body’s surface area. In winter, the regulating effect of reservoirs on air temperature is smaller, and the trends before and after construction are similar, indicating that reservoirs have a more limited impact on air temperature during the winter months. Additionally, some reservoirs exhibited less temperature change after construction, possibly due to their fundamental attributes, topographic features, and the climatic conditions of their regions [36]. These factors may have inhibited the significant moderating effect of the reservoirs on temperature in certain areas, leading to slower temperature changes.
Reservoir construction directly increases the size of the watershed, leading to an increase in regional evapotranspiration, which subsequently affects precipitation variability. As a result, reservoir storage significantly influences local precipitation [37]. Seasonal analysis revealed that summer precipitation increased after reservoir construction, particularly around large reservoirs (Figure 3). This is primarily due to evaporation from reservoirs, which raises local humidity and stimulates convective activity, resulting in increased precipitation. In contrast, changes in winter precipitation were more modest, and reservoirs had a smaller impact on winter precipitation. Different reservoirs exhibit varying degrees of precipitation regulation, with larger reservoirs (e.g., ZG and KY) showing reduced precipitation variability, suggesting that reservoir construction has a more pronounced effect on local climate change. Furthermore, reservoirs alter the spatial distribution of precipitation by modifying local topography and airflow patterns, resulting in more complex precipitation variability [38]. The annual mean and slope changes before and after reservoir construction indicate that the reservoir exerts a sustained local climate regulation effect, with the specific impact pattern varying across different regions.
Using the Mann–Kendall (MK) test for mutation detection in climate data, this study identified a significant turning point in the inter-annual variation in temperature (T) and precipitation (P) following reservoir construction (Figure 9). The temperature trend shift mirrored that observed in high-latitude regions, confirming that reservoir construction had a moderating effect on the local climate [39]. The turning point in precipitation patterns occurred a few years after reservoir construction, consistent with findings from other studies suggesting that reservoirs initially have a substantial impact on precipitation regulation, which gradually stabilizes over time [40,41].
The correlation analysis of the basic attributes of the reservoirs reveals that different reservoir characteristics have varying impacts on the local climate (Figure 8), likely due to the distinct mechanisms by which these attributes influence the environment. Precipitation is more significantly affected by reservoir regulation, particularly during the summer, while temperature is primarily influenced by factors such as regional climate, soil moisture, and water evaporation. Reservoir capacity (CAP) notably impacts precipitation, especially in summer. A larger reservoir capacity enhances the reservoir’s regulatory ability, influencing precipitation distribution by modulating hydrological variability and the water cycle. The correlation between CAP and precipitation varies across regions and seasons, being most pronounced in summer. Long-term hydrological indicators, such as discharge (DIS), are significantly correlated with precipitation, reflecting trends in long-term precipitation changes and directly influencing fluctuations in reservoir water levels. YEAR also strongly correlates with precipitation; the storage and regulation capacity of the reservoir after its impoundment significantly influence local precipitation patterns. Reservoir area (AREA) significantly affects temperature, particularly in regulating the regional climate. The storage effect of reservoirs modifies the surrounding microclimate, reducing temperature fluctuations and maintaining stable temperatures. In contrast, the effect of normal storage level (FSL) on temperature is weak, possibly due to the differing roles of reservoirs in temperature regulation, particularly in areas with high precipitation [42,43].

4.2. Impact of Reservoir Construction on Land Use

Reservoir construction significantly altered land use patterns, particularly impacting the distribution of water bodies, forests, cultivated land, and barrens. These changes are closely linked to the fundamental attributes of reservoirs. For instance, following the construction of the LJ reservoir, the water area increased by 200%, primarily due to the expansion of the watershed after reservoir impoundment. In most reservoir areas, cropland and barren areas decreased, while forest and water areas expanded, reflecting the direct impact of reservoir construction on land use. Seasonal water level fluctuations following impoundment led to the conversion of some agricultural land into watersheds. Specifically, cultivated land in the LJ reservoir area decreased by 34.7%, which was closely tied to land reclamation and ecological restoration measures around the reservoir.
Government policies, particularly the “returning farmland to forest” policy implemented in 1999, have also played a significant role in land use changes, notably increasing forest areas, especially around reservoirs. For example, forest cover around the LJ and KY reservoirs increased by about 120% over 20 years. These changes, in conjunction with reservoir construction, contributed to the rapid expansion of forests in the region, reflecting the synergistic effects of policy and reservoir development [44]. Additionally, reservoir construction often involves large-scale resettlement and land rezoning, which reduces agricultural land and accelerates urbanization, further promoting the conversion of cropland and grassland.
Socio-economic factors further accelerate land use transformation. The resettlement of migrants, agricultural abandonment, and resource development in reservoir construction areas, especially the rise of fisheries and tourism, have contributed to land use changes [45]. For example, the development of fisheries and tourism around the HF reservoir led to a decrease in surrounding grasslands and croplands, with an increase in watersheds and urbanized lands. After resettlement, some farmland was abandoned or repurposed, resulting in further reductions in cultivated land.
A complex feedback mechanism exists between hydrological processes, land use, and climate. Water storage in reservoirs alters hydrological conditions, which in turn influences climate patterns and land use. For instance, water level fluctuations and the evapotranspiration effects of reservoirs regulate the regional climate and affect vegetation growth and land use. In the case of the ZG reservoir, seasonal water level fluctuations significantly altered hydrological characteristics during spring and fall, promoting the conversion of former agricultural land into wetlands or watersheds. These hydrological changes indirectly promoted land use transformation by influencing soil moisture and water distribution [46,47]. Climate change and land use changes create a positive feedback loop that plays a key role in ecosystem succession after reservoir construction.
In this study, we utilized the ERA5-Land dataset and the China Land Cover Dataset (CLCD), which provide valuable support for remote sensing techniques. However, we acknowledge certain uncertainties in these datasets. The ERA5-Land dataset, due to its relatively low spatial resolution and reliance on numerical weather prediction models, may introduce biases in estimating local climate changes. Additionally, the CLCD dataset may suffer from classification errors and insufficient spatial resolution in land use change analysis, which could impact the accurate prediction of land cover change trends. To enhance the credibility of our findings, future studies should integrate ground observation data with remote sensing data for cross-validation and conduct comparative analyses between ground meteorological data and ERA5-Land data to verify the effectiveness of remote sensing in capturing climate trends. Furthermore, methods such as sensitivity analysis could be employed to quantify data uncertainty and assess how differences between datasets may influence conclusions related to temperature, precipitation, and land use changes.

5. Conclusions

This study provides a comprehensive analysis of the impact of terrace reservoir construction in the upper Yellow River (UYR) on local climate change and land use transformation. The long-term effects of 10 constructed reservoirs on regional climate and the ecological environment were assessed using remote sensing imagery, GIS technology, and climate and land cover data spanning from 1985 to 2022. The results indicate that reservoir construction has significant effects on temperature, precipitation, and land use, particularly in the conversion of watersheds, cropland, and grassland.
(1)
Climate change around the reservoirs was significant. Following reservoir construction, both temperature and precipitation exhibited an upward trend, especially in spring and fall. For example, the spring temperature at the LJ reservoir increased by 0.51 °C per decade, while annual precipitation at the JS reservoir rose by 41.26 mm per decade. Precipitation changes showed regional variation, with areas such as ZG, KY, GB, and SZ experiencing a gradual decline in precipitation. However, summer precipitation generally increased, and winter precipitation remained relatively stable.
(2)
Reservoir construction induced substantial changes in land use types, particularly the conversion of grassland to water and cropland. Notably, the transformation of grassland into cropland constituted the largest portion of ecological change, accounting for approximately 93.2% of the total land use conversion, which included transitions between grassland, cropland, water, and impervious areas. Dynamic analysis revealed that water areas increased the most following reservoir construction, rising by over 200%, while cropland and grassland areas decreased correspondingly.
(3)
A significant correlation was found between reservoir attributes (e.g., water storage capacity and surface area) and both climate and land use changes. Specifically, a positive correlation was observed between water storage capacity and increased precipitation.
(4)
This study emphasizes the significant impacts of reservoir construction on local climate and ecological environments, providing valuable insights for future reservoir development and management. The findings can assist policymakers in understanding the long-term effects of reservoirs on local climates and ecosystems, offering a scientific foundation for the rational planning of water resource development, ecological protection, and land use. Furthermore, these results can serve as a reference for ecological and environmental assessments in similar regions, promoting sustainable regional development.

Author Contributions

Conceptualization, P.M.; methodology, P.M. and L.C.; software, K.L; formal analysis, P.M.; investigation, LC.; resources, L.C.; data curation, L.C.; writing—original draft preparation, L.C.; writing—review and editing, P.M.; visualization, Y.N. and L.C.; supervision, P.M. and K.L.; funding acquisition P.M. All authors have read and agreed to the published version of the manuscript.

Funding

This research was funded by the National Key Research and Development Program of China (2023YFC3008401), the National Natural Science Foundation of China (42477175), the Key Research and Development Program of Shaanxi (2024SF-YBXM-539), and Fundamental Research Funds for the Central Universities, CHD (300102263401, 300102264908, 300102264903, 300102264911 and 2024-07).

Institutional Review Board Statement

Not applicable.

Informed Consent Statement

Not applicable.

Data Availability Statement

The data presented in this study are available on request from the corresponding author.

Conflicts of Interest

The authors declare no conflicts of interest.

References

  1. Shaofeng, J.; Yuan, L. Suggestions for strategic allocation of the Yellow River water resources under the new situation. Resour. Sci. 2020, 42, 29–36. [Google Scholar]
  2. Wang, Y.; Peng, S.; Wu, J.; Wan, F.; Zheng, X.; Zhou, X.; Shang, W.; Zhang, F. Study on the method and model of water balance allocation of the Yellow River with overall fairness and efficiency. Water Supply 2023, 23, 2711–2726. [Google Scholar] [CrossRef]
  3. Nguyen, B.Q.; Van Binh, D.; Tran, T.N.D.; Kantoush, S.A.; Sumi, T. Response of streamflow and sediment variability to cascade dam development and climate change in the Sai Gon Dong Nai River basin. Clim. Dyn. 2024, 62, 7997–8017. [Google Scholar] [CrossRef]
  4. Yang, S.L.; Shi, B.; Fan, J.; Luo, X.; Tian, Q.; Yang, H.; Chen, S.; Zhang, Y.; Zhang, S.; Shi, X. Streamflow decline in the Yellow River along with socioeconomic development: Past and future. Water 2020, 12, 823. [Google Scholar] [CrossRef]
  5. Eekhout, J.P.; Boix-Fayos, C.; Pérez-Cutillas, P.; de Vente, J. The impact of reservoir construction and changes in land use and climate on ecosystem services in a large Mediterranean catchment. J. Hydrology 2020, 590, 125208. [Google Scholar] [CrossRef]
  6. Ma, P.; Peng, J.; Wang, Q.; Zhuang, J.; Zhang, F. The mechanisms of a loess landslide triggered by diversion-based irrigation: A case study of the South Jingyang Platform, China. Bull. Eng. Geol. Environ. 2019, 78, 4945–4963. [Google Scholar] [CrossRef]
  7. Ma, P.; Peng, J.; Nan, Y.; Wang, N.; Liu, K.; Wei, B.; Wang, S. The shear behavior of the slip zone loess and landslide mechanism. J. Asian Earth Sci. 2023, 257, 105833. [Google Scholar] [CrossRef]
  8. Hu, Q.; Li, C.; Wang, Z.; Liu, Y.; Liu, W. Continuous monitoring of the surface water area in the Yellow River basin during 1986–2019 using available Landsat imagery and the Google Earth Engine. ISPRS Int. J. Geo-Inf. 2022, 11, 305. [Google Scholar] [CrossRef]
  9. Qin, Y.; Yang, D.; Gao, B.; Wang, T.; Chen, J.; Chen, Y.; Wang, Y.; Zheng, G. Impacts of climate warming on the frozen ground and eco-hydrology in the Yellow River source region, China. Sci. Total Environ. 2017, 605, 830–841. [Google Scholar] [CrossRef]
  10. Su, X.; Li, X.; Niu, Z.; Liang, X. A new complexity-based three-stage method to comprehensively quantify positive/negative contribution rates of climate change and human activities to changes in runoff in the upper Yellow River. J. Clean. Prod. 2021, 287, 125017. [Google Scholar] [CrossRef]
  11. Yan, D.; Lai, Z.; Ji, G. Using Budyko-type equations for separating the impacts of climate and vegetation change on runoff in the source area of the Yellow River. Water 2020, 12, 3418. [Google Scholar] [CrossRef]
  12. Tran, T.N.; Lakshmi, V. Enhancing human resilience against climate change: Assessment of hydroclimatic extremes and sea level rise impacts on the Eastern Shore of Virginia, United States. Sci. Total Environ. 2024, 947, 174289. [Google Scholar] [CrossRef]
  13. Bryant, B.P.; Kelsey, T.R.; Vogl, A.L.; Wolny, S.A.; MacEwan, D.; Selmants, P.C.; Biswas, T.; Butterfield, H.S. Shaping land use change and ecosystem restoration in a water-stressed agricultural landscape to achieve multiple benefits. Front. Sustain. Food Syst. 2020, 4, 138. [Google Scholar] [CrossRef]
  14. Kozma, Z.; Decsi, B.; Ács, T.; Kardos, M.K.; Hidy, D.; Árvai, M.; Kalicz, P.; Kern, Z.; Pinke, Z. Supposed effects of wetland restoration on hydrological conditions and the provisioning ecosystem services—A model-based case study at a hungarian lowland catchment. Sustainability 2023, 15, 11700. [Google Scholar] [CrossRef]
  15. Lehosmaa, K. Anthropogenic Impacts and Restoration of Boreal Spring Ecosystems; University of Oulu: Oulu, Finland, 2018. [Google Scholar]
  16. Xu, D.; Lyon, S.W.; Mao, J.; Dai, H.; Jarsjö, J. Impacts of multi-purpose reservoir construction, land-use change and climate change on runoff characteristics in the Poyang Lake basin, China. J. Hydrol. Reg. Stud. 2020, 29, 100694. [Google Scholar] [CrossRef]
  17. Tranmer, A.W.; Weigel, D.; Marti, C.L.; Vidergar, D.; Benjankar, R.; Tonina, D.; Goodwin, P.; Imberger, J. Coupled reser-voir-river systems: Lessons from an integrated aquatic ecosystem assessment. J. Environ. Manag. 2020, 260, 110107. [Google Scholar] [CrossRef]
  18. Zeng, Y.; Liu, D.; Guo, S.; Xiong, L.; Liu, P.; Yin, J.; Tian, J.; Deng, L.; Zhang, J. Impacts of water resources allocation on water environmental capacity under climate change. Water 2021, 13, 1187. [Google Scholar] [CrossRef]
  19. Hodnebrog, Ø.; Myhre, G.; Samset, B.H.; Alterskjær, K.; Andrews, T.; Boucher, O.; Faluvegi, G.; Fläschner, D.; Forster, P.M.; Watson-Parris, D.; et al. Water vapour adjustments and responses differ between climate drivers. Atmos. Chem. Phys. 2019, 19, 12887–12899. [Google Scholar] [CrossRef]
  20. Pierre, A.; Nadeau, D.F.; Thiboult, A.; Rousseau, A.N.; Tremblay, A.; Isabelle, P.E.; Anctil, F. Characteristic time scales of evaporation from a subarctic reservoir. Hydrol. Process. 2023, 37, e14842. [Google Scholar] [CrossRef]
  21. Jiao, Y.; Zhu, G.; Lu, S.; Ye, L.; Qiu, D.; Meng, G.; Wang, Q.; Li, R.; Chen, L.; Li, W.; et al. The cooling effect of oasis reservoir-riparian forest systems in arid regions. Water Resour. Res. 2024, 60, e2024WR038301. [Google Scholar] [CrossRef]
  22. Vanderkelen, I.; van Lipzig, N.P.M.; Sacks, W.J.; Lawrence, D.M.; Clark, M.P.; Mizukami, N.; Pokhrel, Y.; Thiery, W. Simulating the impact of global reservoir expansion on the present-day climate. J. Geophys. Res. Atmos. 2021, 126, e2020JD034485. [Google Scholar] [CrossRef]
  23. Zhao, Y.; Liu, S.; Shi, H. Impacts of dams and reservoirs on local climate change: A global perspective. Environ. Res. Lett. 2021, 16, 104043. [Google Scholar] [CrossRef]
  24. Ahmadi, M.; Haddad, O.B.; Loáiciga, H.A. Adaptive reservoir operation rules under climatic change. Water Resour. Manag. 2015, 29, 1247–1266. [Google Scholar] [CrossRef]
  25. Huang, C.; Huang, X.; Peng, C.; Zhou, Z.; Teng, M.; Wang, P. Land use/cover change in the Three Gorges Reservoir area, China: Reconciling the land use conflicts between development and protection. Catena 2019, 175, 388–399. [Google Scholar] [CrossRef]
  26. Bosmans, J.H.; van Beek, L.P.; Sutanudjaja, E.H.; Bierkens, M.F. Hydrological impacts of global land cover change and human water use. Hydrol. Earth Syst. Sci. 2017, 21, 5603–5626. [Google Scholar] [CrossRef]
  27. Samarakoon, S.M.L.D.; Dayawansa, N.D.K.; Gunawardena, E.R.N. Land use changes resulting from construction of Deduru Oya reservoir and its impacts on livelihood. Trop. Agric. Res. 2017, 28, 162. [Google Scholar] [CrossRef]
  28. Havlíček, M.; Uhrová, J. Changes in land use due to the construction of water reservoirs. Vodohospod. Tech.-Ekon. Inf. 2017, 59, 22–30. [Google Scholar] [CrossRef]
  29. Verma, S.; Verma, M.K.; Prasad, A.D.; Mehta, D.; Azamathulla, H.M.; Muttil, N.; Rathnayake, U. Simulating the hydrological processes under multiple land use/land cover and climate change scenarios in the Mahanadi reservoir complex, Chhattisgarh, India. Water 2023, 15, 3068. [Google Scholar] [CrossRef]
  30. de Souza Dias, V.; Pereira da Luz, M.; Medero, G.M.; Tarley Ferreira Nascimento, D. An overview of hydropower reservoirs in Brazil: Current situation, future per-spectives and impacts of climate change. Water 2018, 10, 592. [Google Scholar] [CrossRef]
  31. Berga, L. The role of hydropower in climate change mitigation and adapta-tion: A review. Engineering 2016, 2, 313–318. [Google Scholar] [CrossRef]
  32. Yang, J.; Huang, X. The 30 m annual land cover dataset and its dynamics in China from 1990 to 2019. Earth Syst. Sci. Data 2021, 13, 3907–3925. [Google Scholar] [CrossRef]
  33. Mingarro, M.; Cancela, J.P.; BurÓn-Ugarte, A.; García-Barros, E.; Munguira, M.L.; Romo, H.; Wilson, R.J. Butterfly communities track climatic variation over space but not time in the Iberian Peninsula. Insect Conserv. 2021, 14, 647–660. [Google Scholar] [CrossRef]
  34. Jeppesen, E.; Brucet, S.; Naselli-Flores, L.; Papastergiadou, E.; Stefanidis, K.; Noges, T.; Beklioğlu, M. Ecological impacts of global warming and water abstraction on lakes and reservoirs due to changes in water level and related changes in salinity. Hydrobiologia 2015, 750, 201–227. [Google Scholar] [CrossRef]
  35. Tanny, J.; Cohen, S.; Assouline, S.; Lange, F.; Grava, A.; Berger, D.; Teltch, B.; Parlange, M.B. Evaporation from a small water reservoir: Direct measurements and estimates. J. Hydrol. 2008, 351, 218–229. [Google Scholar] [CrossRef]
  36. Degu, A.M.; Hossain, F.; Niyogi, D.; Pielke, R., Sr.; Shepherd, J.M.; Voisin, N.; Chronis, T. The influence of large dams on surrounding climate and precipitation patterns. Geophys. Res. Lett. 2011, 38, L04405. [Google Scholar] [CrossRef]
  37. Liu, C.; Yang, H.; Wang, B.; Yang, J. Impacts of reservoir water level fluctuation on measuring seasonal seismic travel time changes in the Binchuan basin, Yunnan, China. Remote Sens. 2021, 13, 2421. [Google Scholar] [CrossRef]
  38. Masson, D.; Frei, C. Spatial analysis of precipitation in a high-mountain region: Exploring methods with multi-scale topographic predictors and circulation types. Hydrol. Earth Syst. Sci. 2014, 18, 4543–4563. [Google Scholar] [CrossRef]
  39. Williamson, C.E.; Saros, J.E.; Vincent, W.F.; Smol, J.P. Lakes and reservoirs as sentinels, integrators, and regulators of climate change. Limnol. Oceanogr. 2009, 54, 2273–2282. [Google Scholar] [CrossRef]
  40. Qin, P.; Xu, H.; Liu, M.; Du, L.; Xiao, C.; Liu, L.; Tarroja, B. Climate change impacts on Three Gorges Reservoir impoundment and hydropower generation. J. Hydrol. 2020, 580, 123922. [Google Scholar] [CrossRef]
  41. Sun, L.; Sun, Z.; Li, Z.; Zheng, H.; Li, C.; Xiong, W. Response of runoff and suspended load to climate change and reservoir construction in the Lancang River. J. Water Clim. Change 2022, 13, 1966–1984. [Google Scholar] [CrossRef]
  42. Pinhati, F.S.C.; Rodrigues, L.N.; de Souza, S.A. Modelling the impact of on-farm reservoirs on dry season water availability in an agricultural catchment area of the Brazilian savannah. Agric. Water Manag. 2020, 241, 106296. [Google Scholar] [CrossRef]
  43. Khasanov, K. A comprehensive analysis of reservoir capacity loss: A case study of the Akhangaran Reservoir, Uzbekistan. Water Cycle 2024, in press. [Google Scholar] [CrossRef]
  44. Ho, L.T.; Goethals, P.L. Opportunities and challenges for the sustainability of lakes and reservoirs in relation to the Sustainable Development Goals (SDGs). Water 2019, 11, 1462. [Google Scholar] [CrossRef]
  45. Yohannes, H.; Argaw, M.; Seifu, W. Impact of land use/land cover change on surface water hydrology in Akaki River catchment, Awash basin, Ethiopia. Phys. Chem. Earth Parts A/B/C 2024, 135, 103690. [Google Scholar] [CrossRef]
  46. Wang, F.; Ge, Q.; Yu, Q.; Wang, H.; Xu, X. Impacts of land-use and land-cover changes on river runoff in Yellow River basin for period of 1956–2012. Chin. Geogr. Sci. 2017, 27, 13–24. [Google Scholar] [CrossRef]
  47. Yin, D.; Li, X.; Li, G.; Zhang, J.; Yu, H. Spatio-temporal evolution of land use transition and its eco-environmental effects: A case study of the Yellow River basin, China. Land 2020, 9, 514. [Google Scholar] [CrossRef]
Figure 1. Location map of the study area (a) national topographic map; (b) topographic map of the study area; (c) elevation map.
Applsci 15 02816 g001
Figure 2. Framework (a) buffer extractions; (b) climate factor analysis; (c) land use analysis; (d) correlation analysis between basic reservoir attributes and climate factors.
Applsci 15 02816 g002
Figure 3. Climate change trend chart (x-axis reservoirs 1~10 represent LX~SJ, y-axis time series −10~10 represent before and after construction).
Applsci 15 02816 g003
Figure 4. Changes in the reservoir before and after the decade.
Applsci 15 02816 g004
Figure 5. Land use growth trend map (x-axis reservoir 1~10 represents LX~SJ, Y-axis time series −10~10 represents before and after construction, Z-axis represents growth trend percentage).
Applsci 15 02816 g005
Figure 6. Land use and land use transfer matrix before and after reservoir construction.
Applsci 15 02816 g006
Figure 7. Reservoir attributes and climate correlation analysis map: (a) correlation between basic reservoir properties and precipitation; (b) correlation between basic reservoir properties and temperature (Note—strong positive correlation (0.7 to 1) *; moderate positive correlation (0.3 to 0.7) *; weak correlation (0 to 0.3)).
Applsci 15 02816 g007
Figure 8. Correlation analysis between reservoir attributes and land types.
Applsci 15 02816 g008
Figure 9. MK mutation trend test.
Applsci 15 02816 g009
Table 1. Basic properties of each reservoir.
Name of ReservoirYear of Construction (YEAR)Normal Storage Level
(FSL)
Mean Depth (DEP)Catchment Area
CATCH
Storage Volume (CAP)Long-Term Average Flow
(DIS)
mmkm2Billions of m3Billions of m3
LX (Laxiwa)201024522154.510.79150
NN (Nina)20002335.515.34.450.262210
LJ (Lijiaxia)20012180128.36.7816.5210
ZG (Zhigang)20062050147.570.154216
KY (Kangyang)2007203320.27.350.288216
GB (Gongbo)200420051034.856.2200
SZ (Suzhi)2005190018.64.50.455221
HF (Huang)20111880.517.23.610.59221
JS (Jishixia)2010185669.73.62.635180
SG (Sigouxia)2009174825.741.810.4750
Table 2. Data description.
Data TypeData DescriptionData Sources
DEM30 m × 30 mGeospatial Data Cloud
Land UseChina Land Cover Annual Data Set (CLCD) 1985–2022Landsat
Data1982–2022 1 km raster monthly mean temperature and precipitation datasetNational Tibetan Plateau Data
Temperature
PrecipitationYellow River Hydrological Yearbook
Reservoir AttributesAttributes of each reservoirResource and Environmental Science and Data Center
Table 3. Changes in the values of climate elements before and after the impoundment of each reservoir.
Differences in Climatic Elements Across Reservoirs (10a After Impoundment—10a Before Impoundment)
ClimateTimeLXNNLJZGKYGBSZHFJSSG
Temperature
(°C)
Spring0.120.190.510.310.200.280.290.120.120.11
Summer0.190.300.440.170.090.190.170.130.300.25
Fall0.380.110.030.250.20−0.030.190.180.260.18
Winter−0.170.490.24−0.01−0.140.010.21−0.28−0.13−0.04
Annual0.130.270.300.180.090.110.220.040.140.12
Temperature slope
(°C/a)
Spring0.010.03−0.040.02−0.04−0.08−0.050.01−0.03−0.04
Summer−0.01−0.030.06−0.070.03−0.01−0.070.01−0.010.03
Fall0.030.020.18−0.030.110.040.020.010.010.02
Winter0.010.130.34−0.160.01−0.15−0.190.150.010.01
Annual0.010.040.14−0.060.03−0.05−0.080.050.000.00
Precipitation
(mm)
Spring5.81−5.153.08−3.710.652.99−0.675.568.6814.12
Summer23.39−6.010.18−0.35−0.510.47−1.2921.7222.6912.40
Fall5.395.393.693.754.083.633.694.454.785.06
Winter−0.20−0.38−0.280.320.101.330.340.34−0.01−0.06
Annual32.46−11.5119.910.0014.8723.8513.0539.4541.2637.95
Precipitation slope
(mm/a)
Spring0.223.181.760.806.61−3.79−4.023.760.001.69
Summer0.400.05−1.43−0.73−5.386.891.790.843.685.23
Fall1.20−2.576.12−3.58−3.92−4.43−4.36−0.092.374.38
Winter0.09−0.100.11−0.27−0.220.12−0.220.020.160.17
Annual1.920.566.65−3.79−2.92−1.21−6.824.546.2111.47
Table 4. Ratio of 10-year change before and after reservoir construction.
Land Use Change Dynamics
CroplandForest ShrublandGrasslandWaterBarrenImperviousAttitude
Laxiwa8.600.004.55−0.08−0.090.19−0.337.15
Nina−0.28/0.00−0.536.44−0.45−1.226.33
Lijiaxia0.770.080.00−0.723.50−15.827.436.71
Zhigang1.004.203.640.470.31−0.160.008.68
Kangyang0.701.02−1.160.900.01−0.271.029.67
Gongboxia0.390.110.06−0.01−19.650.72−0.1812.54
Suzhi0.8891.57−2.040.15−7.000.320.1310.01
Huangfeng−0.290.65−1.53−1.532.42−1.41−0.625.20
Jishixia−6.834.27−6.51−294.327.680.30−0.154.20
Sigouxia5.531.28−11.663.280.490.001.6710.08
Disclaimer/Publisher’s Note: The statements, opinions and data contained in all publications are solely those of the individual author(s) and contributor(s) and not of MDPI and/or the editor(s). MDPI and/or the editor(s) disclaim responsibility for any injury to people or property resulting from any ideas, methods, instructions or products referred to in the content.

