1. Introduction
MEP (Mechanical, Electrical, and Plumbing) systems play a crucial role in construction engineering, with their construction progress and quality directly affecting the successful implementation of the entire project. MEP engineering involves installing various subsystems, such as piping, electrical, and air conditioning systems, including complex construction techniques and procedures. However, traditional manual inspection and measurement methods are inefficient and cannot ensure the consistency of pipe installation with design drawings (i.e., Building Information Models, BIMs). This is because, during construction, environmental changes, human error, or design changes lead to deviations from the original BIM in the pipe installation. Notably, if these deviations are not promptly detected and corrected, they can lead to later operation and maintenance difficulties and may cause safety incidents.
BIM model review methods based on computer vision technology have recently attracted widespread attention [
1,
2]. These methods collect real-time image and video data from the construction site through cameras and other devices and compare them with the BIM to monitor construction progress and quality in real time. The existing construction progress inspection methods based on object detection algorithms, such as YOLO [
3] and Faster R-CNN [
4], have significantly improved detection accuracy and efficiency. However, current methods suffer from dealing with the complexity of MEP components and fail to meet the requirements of practical engineering applications. Primary concerns include insufficient real-time monitoring capabilities, difficulty in comprehensively capturing dynamic changes during the pipe installation process, inadequate accuracy of monitoring data, inability to reflect the actual installation state of the pipes accurately, and the complex and cumbersome nature of the comparison and analysis work between the monitoring results and the BIM, due to the lack of an automated comparison and verification mechanism.
This paper develops a BIM-based pipeline construction comparison system that monitors the pipe installation process in real time and automatically compares and analyzes it with the BIM to ensure its accuracy and compliance. The proposed solution integrates real-time data collection and deep learning algorithms for high-precision monitoring and automatic verification of the pipe installation status. The core objective of this study is to enhance the level of automation of pipeline installation monitoring, reduce human interference, and improve monitoring efficiency and accuracy.
2. Related Work
2.1. Summary
The advancement of intelligent pipeline inspection and edge detection has been significantly influenced by the integration of BIM, deep learning, and generative models. Traditional pipeline acceptance methods rely on manual inspections, which, despite their reliability, are time-consuming and error-prone. The adoption of BIM and deep learning has transformed this process, enabling automated defect detection and real-time monitoring. Simultaneously, edge detection techniques have evolved from conventional gradient-based methods to sophisticated deep learning models, improving accuracy and robustness. Recently, diffusion probabilistic models have gained attention for their powerful generative capabilities, extending their application beyond synthesis tasks to perception-based challenges. This section reviews key developments in these areas, highlighting their contributions, existing challenges, and future research directions.
2.2. Pipeline Construction Acceptance
BIM technology is gradually transforming traditional inspection methods in pipeline construction acceptance testing. Conventional approaches primarily rely on manual visual inspections and non-destructive testing (NDT) [
5]. Although these approaches ensure pipeline quality, they are time-consuming and vulnerable to human error. On the contrary, the BIM creates a three-dimensional digital pipeline system model that precisely records and monitors every stage of the construction process [
6]. Researchers have highlighted that BIM models allow inspectors to compare actual construction with design drawings in real time, promptly identifying and rectifying potential issues, such as deviations in pipeline positioning and improper connections [
7].
Recently, with the rapid advancement of deep learning technology, more studies have begun to explore its application in automated pipeline acceptance testing, mainly focusing on the effectiveness of convolutional neural networks (CNNs) in identifying defects in images. For instance, ref. [
8] effectively detected and located corrosion in pipelines through a custom CNN, significantly improving the accuracy and efficiency of corrosion detection. Additionally, in [
9], the authors proposed PipeNet, a novel deep learning network capable of detecting pipes regardless of the input data size and the target scene scale while predicting pipe centerline points along with other parameters. Furthermore, integrating sensor data from building information modeling (BIM) with deep learning algorithms facilitates real-time monitoring and analysis of pipeline conditions. This integration enables predictive maintenance strategies, reducing downtime and maintenance costs [
10]. Such an approach enhances the accuracy and efficiency of inspections and provides valuable insights for future maintenance. Hence, combining BIM and deep learning is paving the way for more intelligent construction management practices, enabling a shift towards a more proactive approach in pipeline maintenance [
11].
Despite these advancements, current research still faces challenges related to data quality, model interpretability, and integration with existing inspection systems. Therefore, future studies should continue to investigate the potential of BIM in pipeline construction, focusing on developing datasets, algorithm optimization, and practical system integration to promote the intelligent advancement of pipeline construction acceptance testing.
2.3. Edge Detection
Edge detection identifies objects’ contours and significant edge lines in natural images. Early edge detection techniques, such as Sobel [
12] and Canny [
13], primarily relied on local gradient changes to detect edges. However, these techniques were susceptible to image noise and failed to utilize global image information. With the rise of CNNs, researchers began developing methods that integrate multi-scale features, significantly improving edge detection accuracy. For instance, HED [
14] first proposed a complete end-to-end edge detection framework, while RCF [
15] further optimized this framework by incorporating richer hierarchical features. Moreover, BDCN [
16] employed a bi-directional cascade structure and trained the edge detector with specific supervision signals for different network layers. PiDiNet [
17] introduced pixel difference convolution and offered an efficient and lightweight solution for edge detection. UAED [
18] addressed more challenging samples by evaluating the uncertainty levels among multiple annotations. Moreover, EDTER [
19] adopted a two-stage vision transformer strategy to capture global context and local detail information.
Despite the significant advancements in improving edge detection accuracy by integrating cross-hierarchical features and uncertainty information, edges generated by learning-based methods are often too coarse and require complex post-processing steps. Although existing research has improved edge clarity through refined loss functions [
20,
21] and label refinement strategies [
22], an edge detection technology still needs to be developed to meet the accuracy and clarity requirements without relying on post-processing.
2.4. Diffusion Probabilistic Model
As a class of generative models based on Markov chains, diffusion probabilistic models reconstruct data samples by progressively learning to remove noise. These models have demonstrated remarkable performance in several fields. For instance, in computer vision [
23,
24,
25], they have demonstrated robust image analysis and processing capabilities. In natural language processing [
26], they have optimized the generative abilities of language models, while in audio generation [
27], they have also achieved significant results.
Although diffusion models have significantly progressed in data generation, their potential in perception tasks is equally noteworthy. Specifically, diffusion models have shown their potential in accurately capturing visual information in tasks such as image segmentation [
28,
29] and object detection [
30]. These advancements broaden the application scope of diffusion models and lay the foundation for future research and technological innovations.
3. Methods
This chapter proposes an automated pipeline construction monitoring system that integrates computer vision techniques, deep learning-based segmentation, and advanced comparative analysis to enhance construction accuracy and efficiency. The proposed method begins by aligning on-site photos with BIM projections through a camera imaging model, ensuring a consistent perspective. Pipeline segmentation is then performed using the Segment Anything Model (SAM), enabling precise identification of pipeline structures. A simulation-based detection mechanism extracts and compares the expected pipeline model from BIM with the as-built pipeline, providing a systematic assessment of construction accuracy. Additionally, diffusion-based contour extraction enhances edge clarity, improving segmentation reliability. The final stage involves automated result generation, where segmented masks are aligned, geometric features are analyzed, and discrepancies are visualized in comparison diagrams. By streamlining the entire pipeline from image acquisition to automated analysis, this method significantly reduces manual effort, enhances real-time monitoring capabilities, and establishes a reliable framework for BIM-integrated construction quality control.
After successfully obtaining the pipeline segmentation results, the developed method applies simulation detection technology to extract the expected pipeline model specified by the construction requirements and the pipeline model produced by the actual construction on site. Finally, the correctness of the piping is assessed by comparing the dimensions of the two simulated structures, affording a visual recognition solution for construction quality control.
3.1. Camera Imaging Model
An image comprises numerous pixels, each recording the color and brightness information at its corresponding location. A core issue in camera model research is representing the three-dimensional world in a two-dimensional image. The most commonly used camera imaging model is the Pinhole Camera Model, which describes light passing through a small aperture to form an image on the imaging plane [
31].
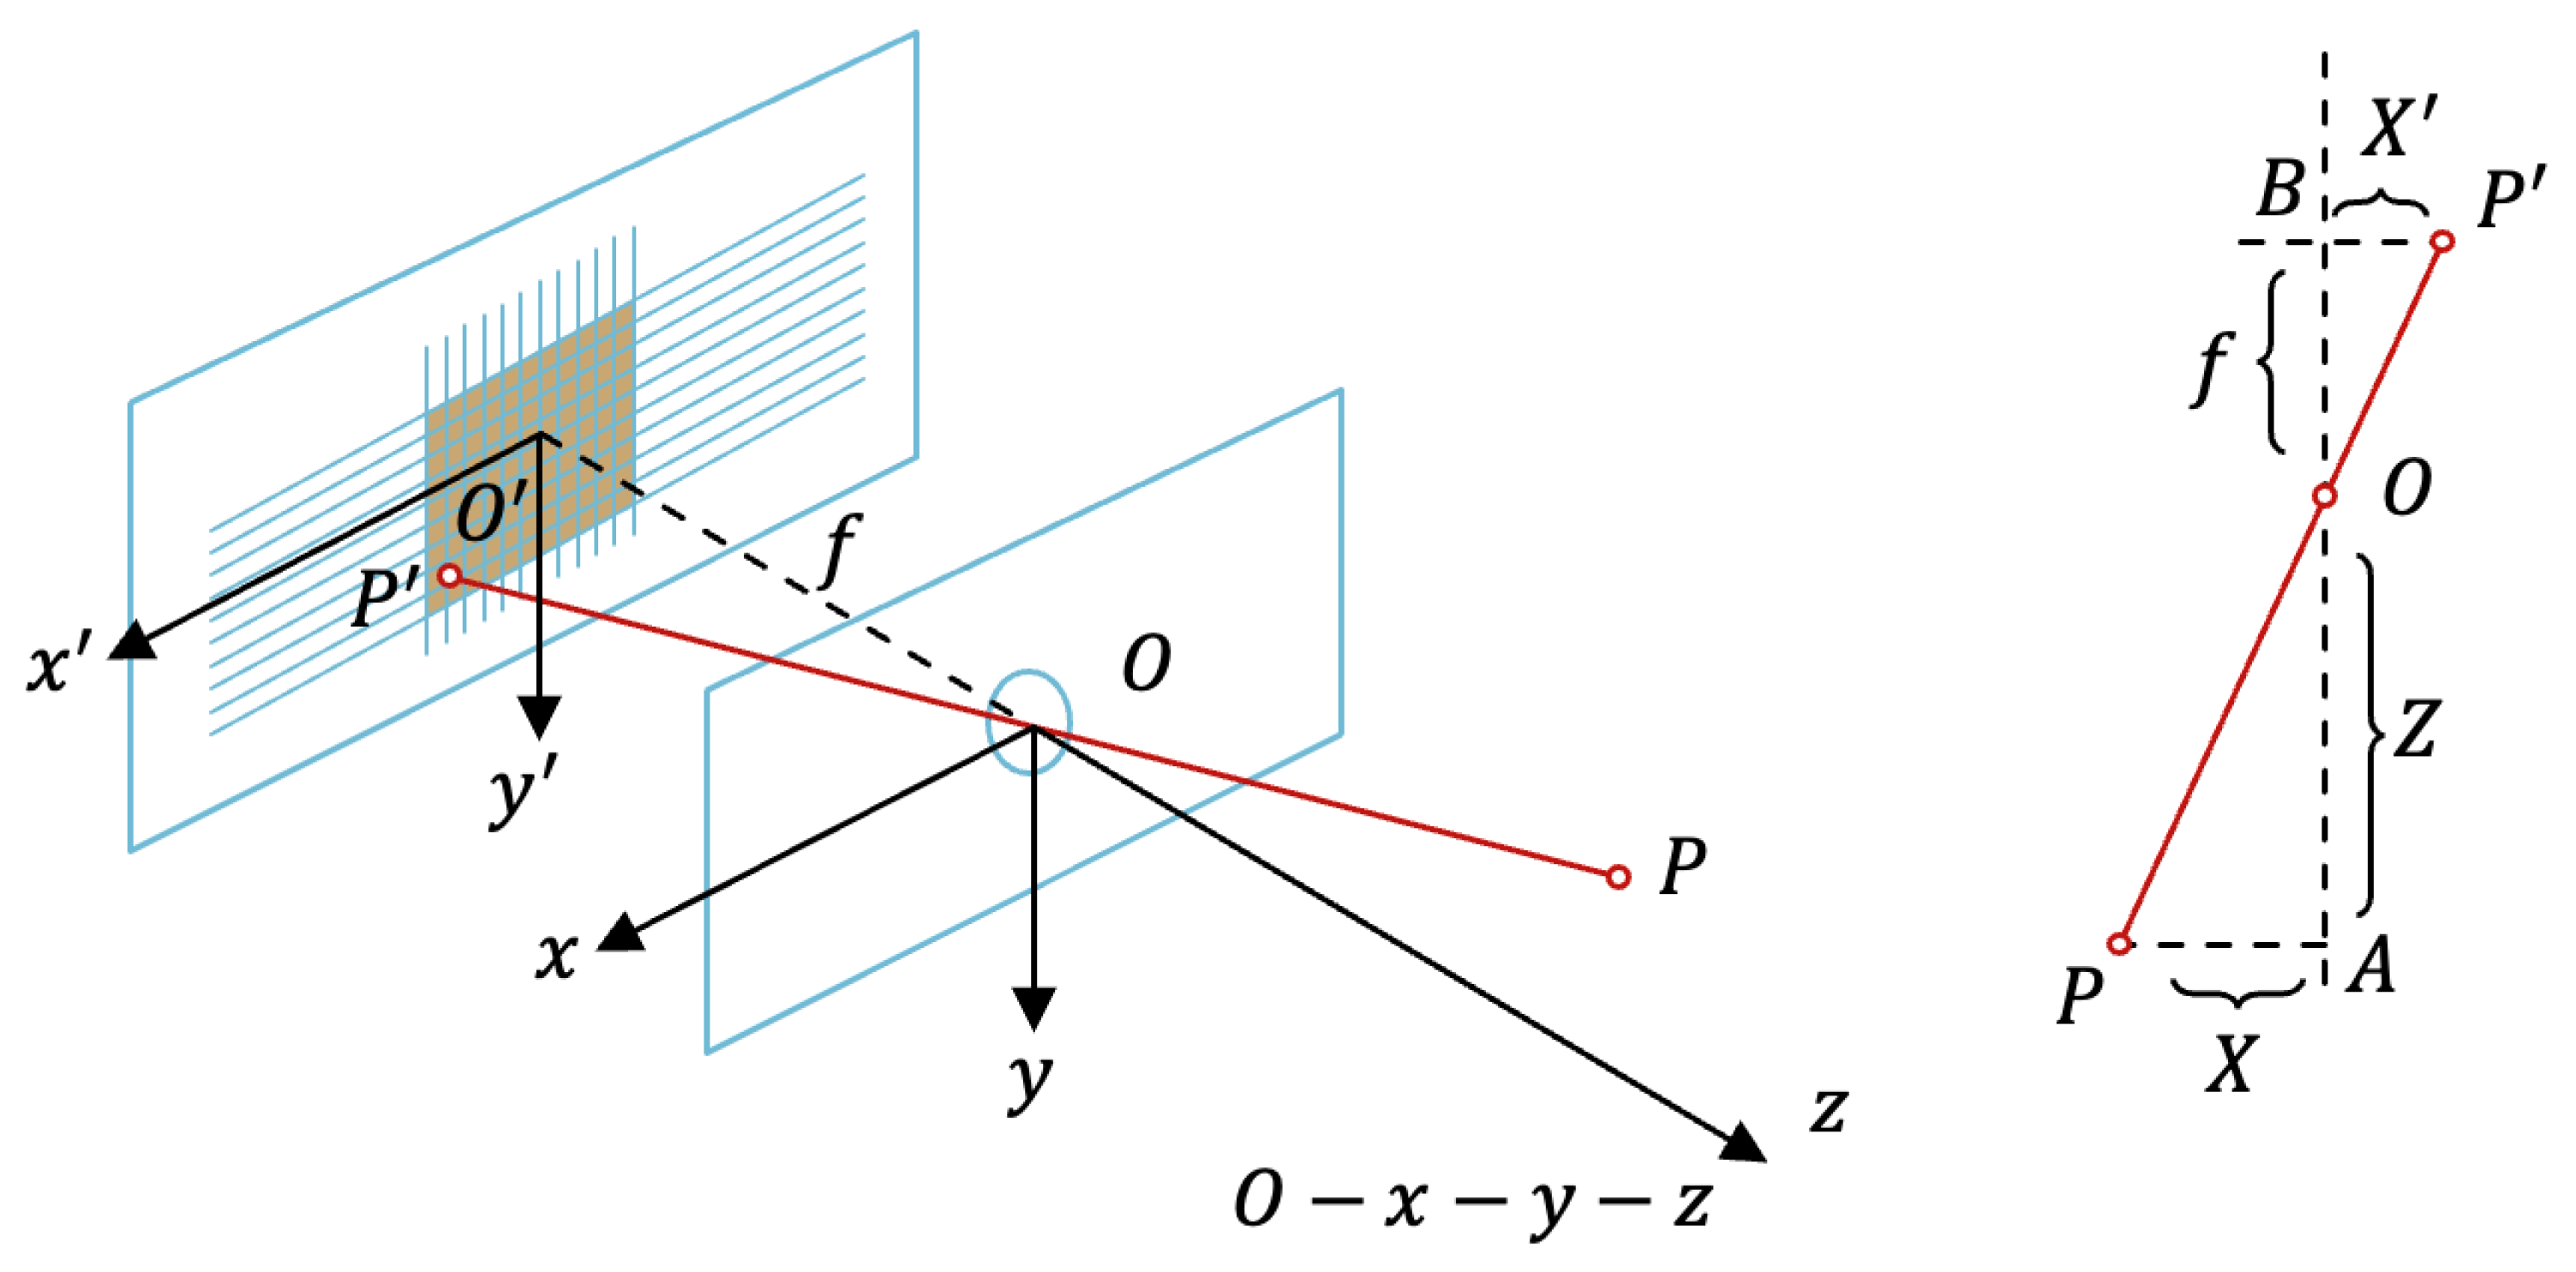
As illustrated in
Figure 1, the pinhole imaging model typically establishes a right-handed Cartesian coordinate system with the camera’s optical center as the origin. The object to be captured is positioned along the positive
z-axis, while the imaging plane, comprising photosensitive material, is placed on the negative
z-axis. The imaging plane remains parallel to the xy-plane at z = −f, where f is the camera’s focal length. The
z-axis intersects the imaging plane at point O’. Any light ray emitted or reflected from an arbitrary point P on the object passes through the camera’s optical center O and intersects the imaging plane at point P’. Let the coordinates of point P be
and the coordinates of point P’ be
. Since P, O, and P’ are collinear, Equation (
1) holds, which maps any point in three-dimensional space to its corresponding point on the imaging plane.
The brightness and color information of each pixel in the image can be obtained by sampling and quantizing the imaging plane. An image coordinate system
is established on the imaging plane, typically with the origin at the image’s top-left corner. The positive
u-direction is horizontal to the right, parallel to the camera’s
x-axis, while the positive
v-direction is vertically downward, parallel to the camera’s
y-axis. Typically, there is a simple scaling and translation transformation between the image coordinate system and the imaging plane coordinate system
. Let the coordinates of
in the image coordinate system be
, with
the scaling factor for the
u-axis and
the scaling factor for the
v-axis. The relationship between the imaging plane coordinate system and the image coordinate system is formulated as follows:
From Equations (1)–(3), it is derived that the pixel coordinates
corresponding to any point
in the three-dimensional space are related as follows:
where matrix
K is the camera intrinsic matrix, which describes the relationship between the coordinates of a point in the three-dimensional space and the corresponding pixel in the image, typically fixed as the camera’s inherent parameters set at the factory. It can be observed that, during the imaging process, an object’s depth information, i.e., the
z-coordinate, is lost. Thus, all points along the line
in the three-dimensional world project to the same point
on the camera plane.
In real-world applications, using the camera coordinate system established in
Figure 1 may be inconvenient for model description and subsequent processing. Therefore, for practical reasons, a world coordinate system is often established based on specific requirements, leading to a misalignment between the camera coordinate system and the world coordinate system. Camera extrinsic parameters primarily handle the transformation of any point
in the world coordinate system to
P in the camera coordinate system. This transformation involves a rotation matrix
R and a translation vector
t, as described below:
Combined with Equation (
4), it projects point
p in the image coordinate system for any point
in the world coordinate system, satisfying Equation (
6).
In homogeneous coordinates, this is represented by Equation (
7), where
is the camera extrinsic matrix.
Camera extrinsics describe the relative relationship between the camera coordinate system and the world coordinate system, which changes with the camera’s movement.
3.2. BIM Projection
This paper utilizes angle information from photographs to map the 3D structure of the BIM onto the 2D plane of the photographs, using perspective transformation or projection transformation. This step generates virtual BIM images that match the actual scene, laying the foundation for subsequent pipeline segmentation and comparative analysis. In this process, the extrinsic matrix determines the position and orientation of the camera, while the intrinsic matrix determines the projection properties. The Structure-from-Motion (SfM) technique can obtain the camera’s intrinsic and extrinsic matrices. SfM is a 3D reconstruction technique that estimates the camera’s pose (extrinsic parameters) and computes the positions of points in the 3D space by extracting and matching feature points from multi-view images. SfM feature detection algorithms (e.g., SIFT or SURF) extract feature points from each image, which are matched to identify the correspondences between feature points in different images of the same object. Next, algorithms such as PnP are used for the initial pose estimation of image pairs, followed by triangulation to obtain a sparse 3D point cloud. Subsequently, bundle adjustment (BA), a nonlinear least-squares optimization technique, refines the camera poses and 3D point positions across all images, minimizing the reprojection error. This process yields accurate extrinsic and intrinsic parameters of the cameras and the 3D structure of the scene. A commonly used open source software package for this process is COLMAP 3.12.0.dev0, which uses multiple images as inputs to estimate the camera’s intrinsic and extrinsic parameters.
3.3. Segmentation Mask Comparison
This study employs the Segment Anything Model (SAM), an advanced, large-scale segmentation model, to extract segmentation masks of pipes from two distinct sources, i.e., photos projected from BIM and photos captured on-site. SAM has demonstrated its robust object recognition and segmentation capabilities by excelling in identifying and isolating various construction elements within an image. Typical examples of these elements are pipes, brackets, and other associated structures. Remarkably, SAM achieves this without requiring additional training, making it a convenient and efficient solution for construction and engineering applications.
This study employs SAM to obtain two segmentation masks for each image: one from the BIM model projection and one from the on-site photo. The masks represent a critical step in the proposed architecture, directly comparing the planned and as-built conditions. The BIM-based mask serves as a reference for the intended design, while the on-site mask reflects the actual state of the construction. SAM can handle complex segmentation tasks with minimal intervention. This is because, instead of requiring extensive manual labeling or retraining for specific contexts, it autonomously distinguishes the multiple objects in a scene, saving time and ensuring consistency and accuracy in the segmentation results. After generating masks using SAM, these will be further processed and analyzed to assess the alignment, discrepancies, and overall compatibility between the BIM design and the real-world implementation. This comparison is critical in evaluating construction accuracy, identifying potential issues, and ensuring that the as-built environment conforms to the original design specifications.
3.4. Contour Extraction
Diffusion models are increasingly used for contour extraction. Thus, this paper employs the DiffusionEdge model for contour extraction tasks, utilizing a decoupled structure and leveraging input images as auxiliary conditions. DiffusionEdge uses an adaptive Fast Fourier Transform (FFT) filter to separate edge maps and noise components in the frequency domain, effectively discarding unwanted components. Specifically, given the encoder features F, the DiffusionEdge model first performs a 2D FFT and then represents the transformed features as Fc. Subsequently, the DiffusionEdge model constructs a learnable weight map W and multiplies it with Fc to achieve adaptive spectral filtering. This process enhances training owing to its ability to adjust specific frequency components globally, and the learned weights adapting to different frequencies of the target distribution. Adaptively discarding useless components allows DiffusionEdge to project features back to the spatial domain from the frequency domain via the Inverse Fast Fourier Transform (IFFT) and retains useful information with residual connections from F.
DiffusionEdge addresses the imbalance between edge and non-edge pixels by adopting a weighted binary cross-entropy (WCE) loss for optimization. WCE loss calculates the difference between the true edge probability Ei of the i-th pixel and the value pji of the j-th edge map for the i-th pixel, ignoring uncertain edge pixels determined by a threshold. This approach prevents network confusion, stabilizes training, and enhances performance. RCF [
15] further improved this method to handle uncertainty among multiple annotators.
However, applying WCE loss to latent spaces is challenging because latent codes follow a normal distribution with different ranges. Thus, DiffusionEdge involves an uncertainty distillation loss that directly optimizes gradients in the latent space, avoiding the negative impact of gradient feedback through autoencoders and reducing GPU memory costs. This strategy enhances the effectiveness of DiffusionEdge in contour extraction while maintaining computational efficiency.
3.5. Comparison Results Output and Automated Process
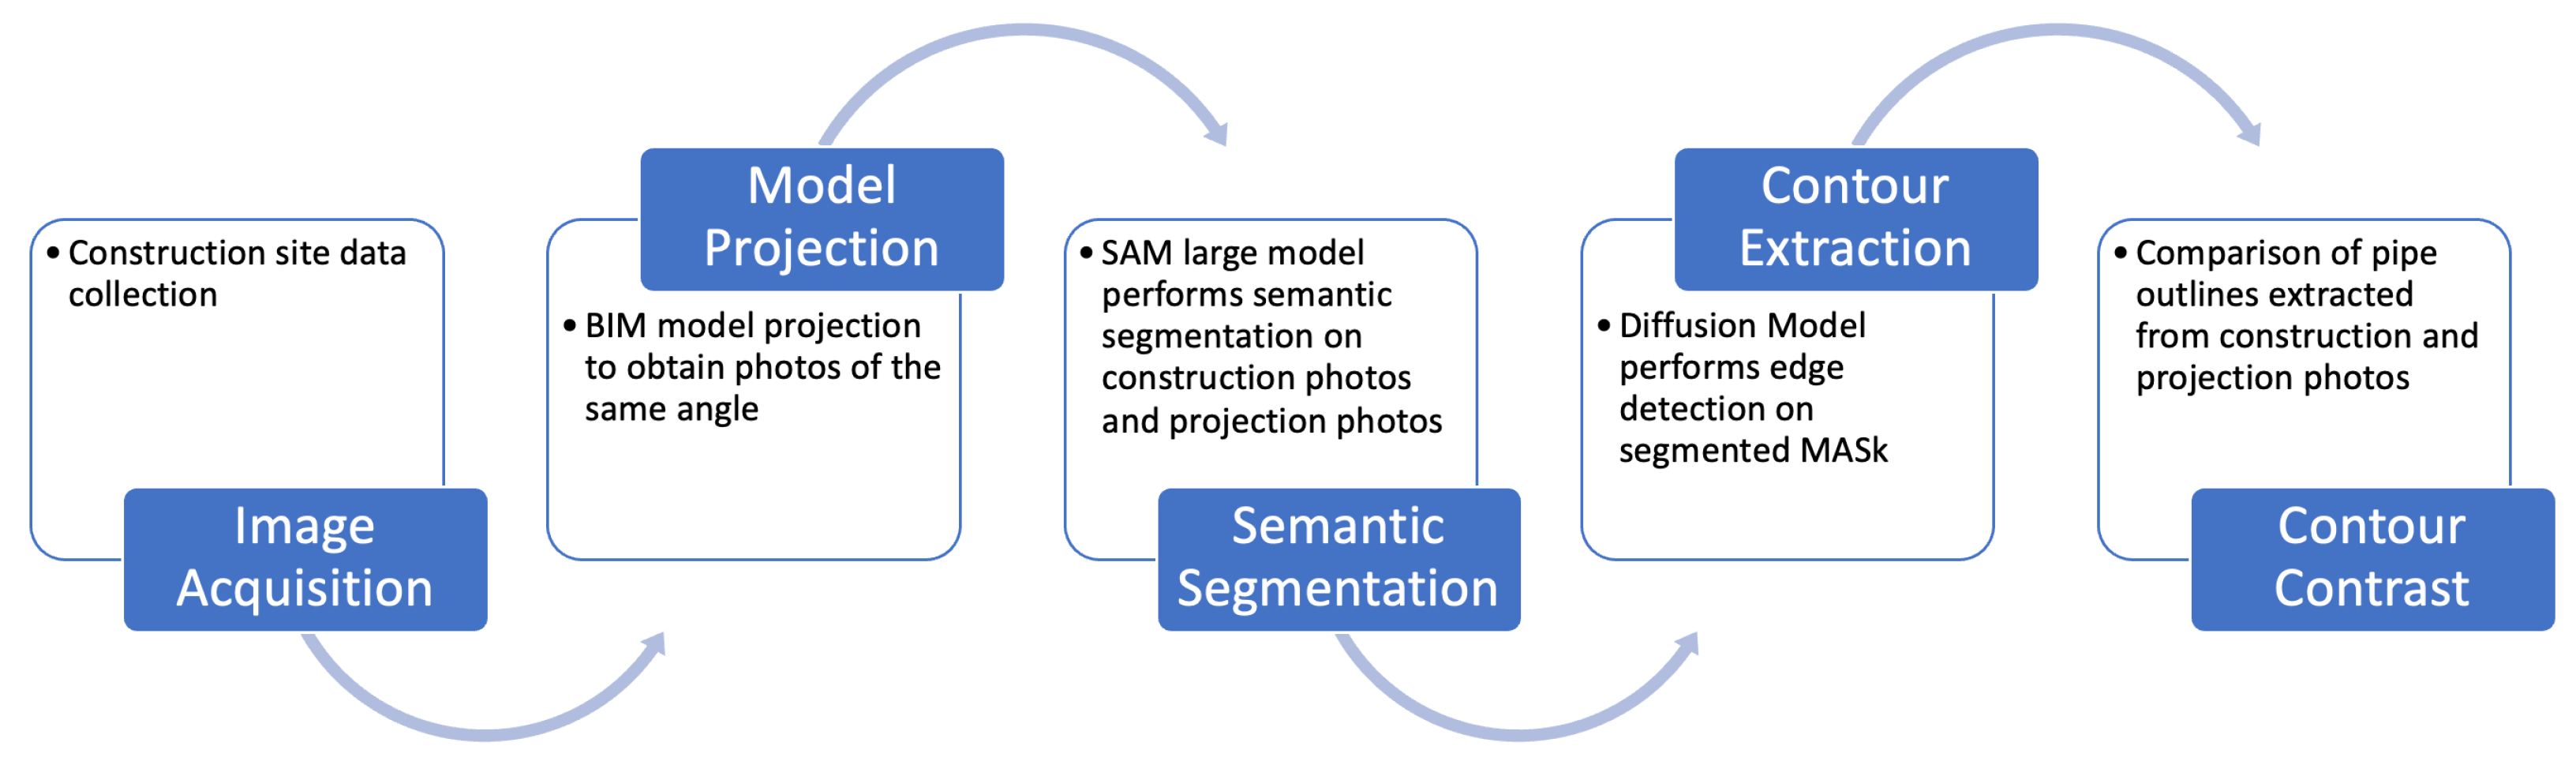
Based on the segmentation masks generated by the automated segmentation network, this study introduces a comprehensive analysis architecture to produce pipeline construction monitoring comparison diagrams.
Figure 2 illustrates this architecture, which integrates several critical steps, such as mask alignment and comparison, geometric feature extraction, feature difference calculation, visual representation, comparison diagram generation, and reporting and feedback. Each step is meticulously designed to provide actionable insights into the construction process. The comparison diagrams visually represent the discrepancies between the BIM model and construction progress. The analysis highlights areas of misalignment or deviation from the design by overlaying and aligning the segmentation masks. This is achieved through geometric features, such as pipe orientation, dimensions, and positioning, which are extracted and compared to identify specific inconsistencies. The calculated differences are visually represented in the comparison diagrams, enabling stakeholders to grasp the nature and extent of any issues quickly.
This paper also introduces an automated segmentation and comparison process encompassing several interconnected stages, i.e., image acquisition, BIM projection, pre-processing, mask generation, and error analysis. This workflow operates without manual intervention but automatically achieves a seamless pipeline for BIM projection and semantic segmentation comparison and outputs the results. Initially, images are acquired from the BIM or on-site sources, ensuring consistent input data. The BIM projection is then aligned with the real-world images to facilitate meaningful comparisons. Notably, a pre-processing strategy enhances the input data quality, optimizing it for segmentation. Then, SAM generates high-precision masks, capturing the geometric and semantic details necessary for downstream analysis. The error analysis phase further refines the process, identifying and quantifying deviations between the BIM projection and on-site results. This iterative approach continuously improves the accuracy and reliability of the comparison process. By automating these stages, the proposed methodology significantly enhances the efficiency of construction monitoring, reducing time and labor costs while improving the precision of the results. Ultimately, this comprehensive process provides a robust framework for integrating BIM technology with on-site construction practices, bridging the gap between digital models and real-world implementation.
4. Results
The proposed BIM-based pipeline construction monitoring system was rigorously evaluated through a series of experiments involving six BIMs and real-world construction scenarios. A dataset of on-site images was collected and used to validate the accuracy of the BIM projection method, confirming its consistency in viewing angles and scale alignment. Using the SAM, pipeline structures were accurately segmented from both the BIM projections and construction site images, enabling precise comparative analysis. Edge detection and contour extraction techniques were applied to assess alignment between the as-built and design models, with performance evaluated using the F-score metric. A comparative study with existing edge detection methods demonstrated the proposed approach’s superior accuracy and noise reduction capabilities. Additionally, Hu moment-based shape matching was employed to quantify discrepancies, effectively identifying construction deviations. Experimental results revealed that the proposed method achieved a 95.4% accuracy in detecting inconsistencies, highlighting its effectiveness in construction quality assessment and compliance verification. These findings confirm the system’s potential as a reliable and automated solution for pipeline construction monitoring offering robust technical support for quality control and engineering management.
4.1. Dataset
The effectiveness of the proposed BIM-based pipeline construction comparative system was evaluated using the following experimental design. First, we created six BIMs (
Figure 3) to represent different construction scenarios. We used components of different specifications and sizes, such as PVC pipes, elbows, drainage tees, concentric reducers, flange connections, and P-traps. These components represent common parts of plumbing and drainage systems in our experiments, helping us validate the effectiveness of our method. These models were subsequently utilized in real construction scenarios to simulate the real-world pipeline installation process. During construction, we captured images of the installed pipeline models, creating a dataset of photographs. This dataset was then used to assess the accuracy and reliability of the proposed method, ensuring its capability to accurately monitor and compare the consistency between actual construction and BIMs.
4.2. Projection Results
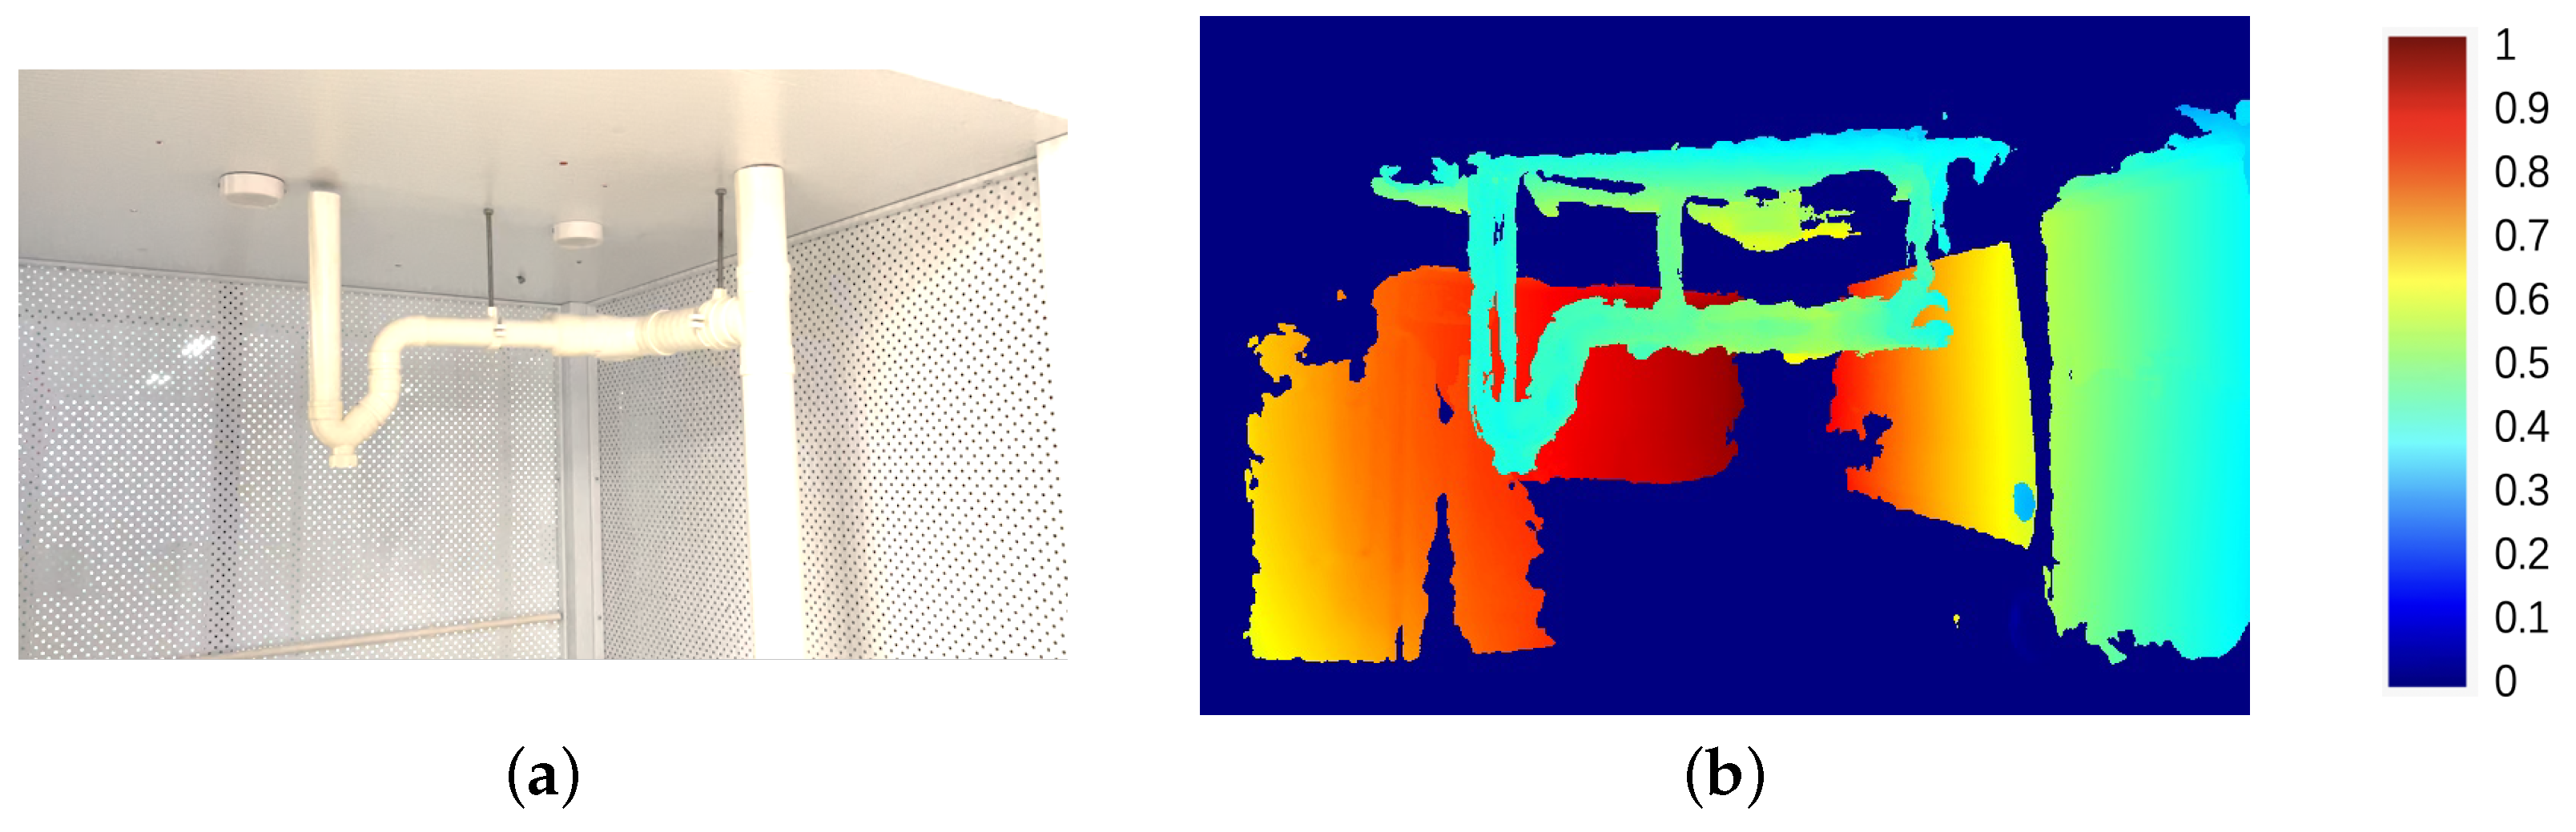
After capturing pictures of the construction models, we projected six BIMs using the BIM projection method mentioned above. The projection results are shown in
Figure 4, where
Figure 4a depicts the pipeline at the construction site and
Figure 4b presents the images obtained by projecting the BIM using the camera’s intrinsic and extrinsic parameters at the time of capturing the image. By comparing these two images, it is evident that the projection from the BIM maintains consistency with the actual construction site photograph regarding angle and scale. This consistency validates the accuracy of the developed BIM projection method, providing a reliable foundation for subsequent construction monitoring and comparative analysis. We ensure that any deviations during construction can be accurately identified and quantified through precise BIM projection, thus offering robust visual support for quality control and assessment in construction processes.
4.3. Segmentation Results
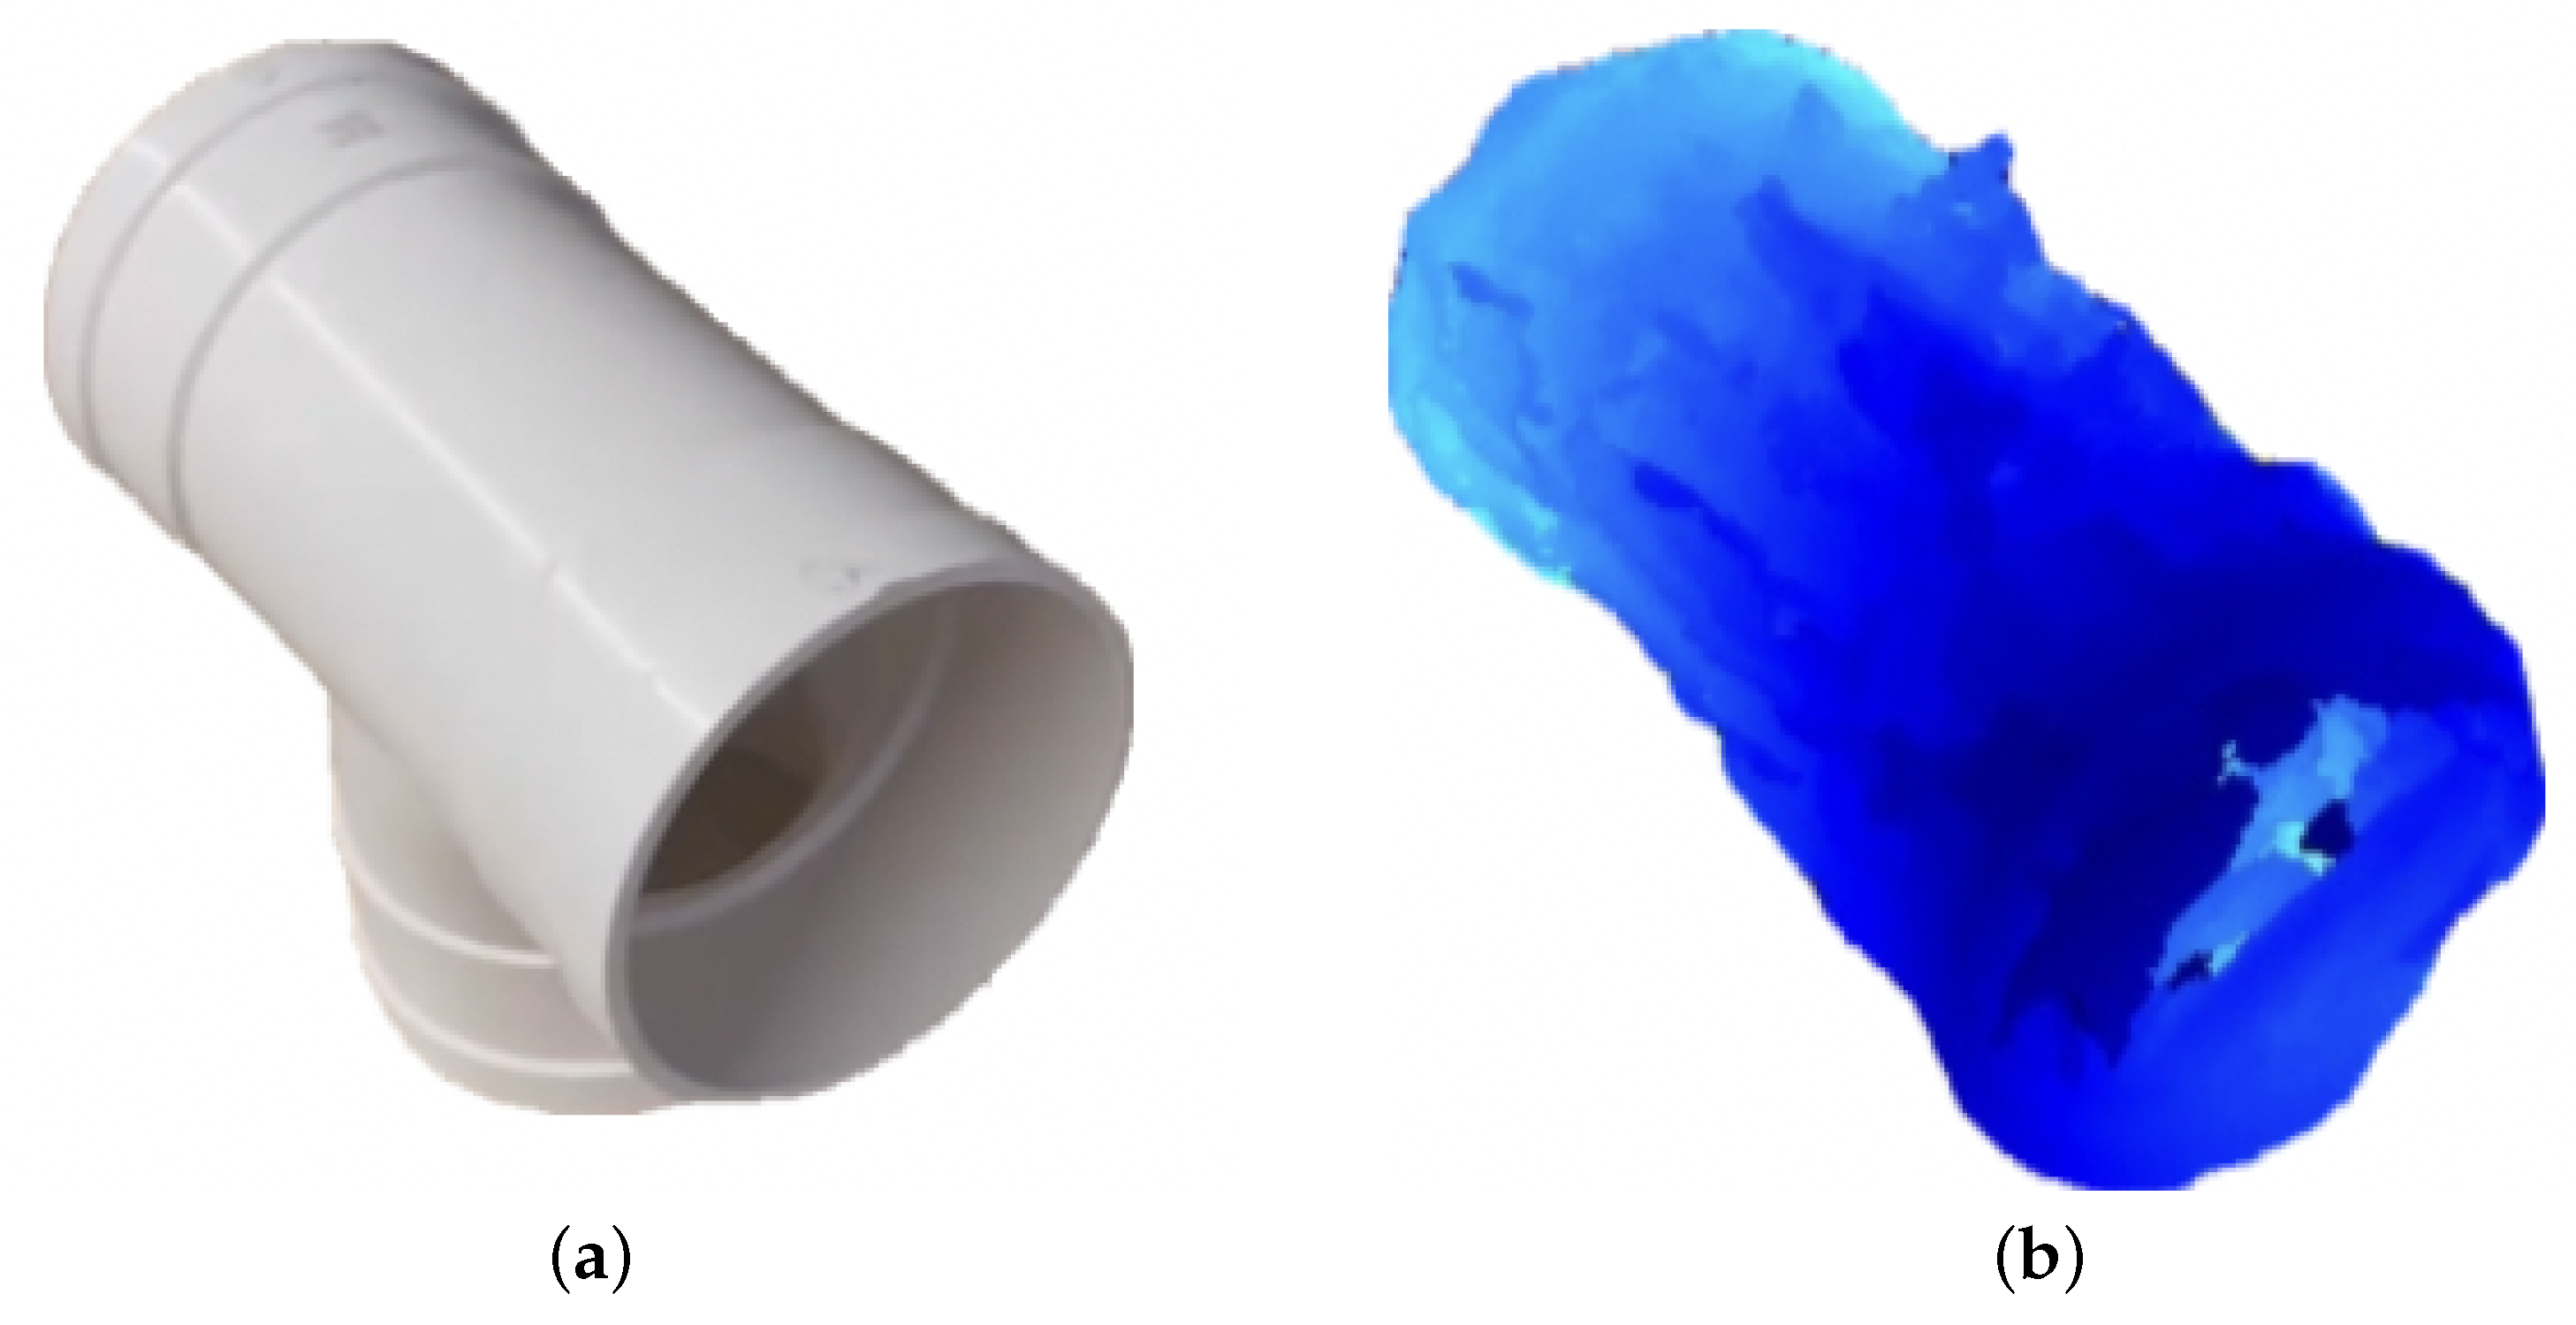
Once the projection results of the BIMs are obtained, a crucial segmentation step extracts the pipelines from the construction photographs and the projected results. The outcomes of the segmentation process are as follows:
Figure 5a displays the segmented pipelines extracted from the photographs taken at the construction site, while
Figure 5b presents the segmented pipelines extracted from the BIM projection results. Applying advanced image segmentation techniques allows for accurately identifying and extracting the pipeline structures, laying the foundation for subsequent comparative analysis.
4.4. Contour Extraction
After successfully obtaining the pipeline segmentation results from the construction site photographs and the BIM projections, the contours are extracted from both sets of results. This process is critical for comparing the differences between the two segmentation outcomes. It aims to validate whether the on-site pipelines align with the BIMs designed during planning. The performance of the edge detection algorithms is evaluated using the F-score metric, which is formulated as
. Precision (
P) is the proportion of correctly detected edges among all predicted edges, and recall (
R) is the proportion of correctly detected edges among all actual edges. The F-score effectively balances precision and recall, comprehensively measuring the edge detection performance (
Table 1). Notably, this study further validates the effectiveness of the proposed method by challenging it against [
13,
17,
32,
33].
Figure 6 visualizes examples of contour extraction, where each subfigure presents the extraction results of different methods. This visual comparison demonstrates that the edge maps obtained using the proposed method exhibit superior accuracy and clarity while significantly reducing noise interference.
4.5. Contour Comparison
Section 4.5 demonstrated that the pipeline contours extracted from the construction photographs and BIM projections clearly illustrated the shape and structure of the pipelines. This section identifies and compares the differences between these two sets of extracted contours and reveals the discrepancies between the actual construction and the design model. We used Hu moments to describe the shapes of the extracted contours and quantify their differences. The smaller the difference, the higher their consistency. Based on this analysis, we effectively assessed the construction quality, verified whether the construction results complied with the design specifications of the BIM, and provided accurate technical support for construction monitoring and quality assurance.
In image processing and computer vision, Hu moments [
34] are a set of feature descriptors used to describe the shape and contour of images. Hu moments are invariant to geometric transformations, such as rotation, scaling, and translation, making them suitable for shape and pattern recognition. They are derived from an image’s second-order and central moments through mathematical transformations. Seven independent Hu moments exist, known as Hu invariant moments, which can capture the geometric features of image contours by calculating the image’s normalized central moments. Their mathematical formulation is based on the normalized central moments of an image. Specifically, given a binary image
, the normalized central moments are as follows:
where
and
are the coordinates of the image’s centroid:
Based on the normalized central moments, the normalized moments can be calculated as follows:
where
is the zero-order moment (the total mass or area of the image).
This study used the Hu moments matching method to identify discrepancies between design drawings and actual construction. We conducted a Hu moments matching analysis of the previously extracted contour features. To ensure the broad applicability and representativeness of the experiment, we constructed and analyzed five different models, each corresponding to 50 on-site construction photos, successfully extracting approximately 1000 pipe contours from a total of 250 images.
The experimental results indicate that, when the threshold for the Hu moments difference is 0.01, the matching algorithm attains an accuracy of up to 95.4%, confirming the efficiency and accuracy of the Hu moments matching method in identifying construction deviations. Hence, the proposed strategy provides a reliable technical means for construction quality control and monitoring, which accurately assesses the consistency between construction results and the original design, offering robust data support for subsequent engineering management and decision-making.
5. Discussion
This study presents an innovative BIM-integrated automated pipeline detection framework that leverages SAM for segmentation, DiffusionEdge for contour extraction, and Hu moment matching for structural comparison. Compared to conventional inspection methods that rely on manual assessments and rule-based feature extraction (e.g., Canny [
12], HED [
14]), the proposed approach significantly enhances detection robustness, automation, and adaptability to complex construction environments. While prior deep learning-based methods such as PipeNet [
9] have improved defect identification, they remain computationally expensive and data-dependent. This study advances the field by integrating BIM projection refinement to ensure precise spatial alignment between as-built and as-designed conditions. The application of SAM in MEP component detection enhances segmentation accuracy, while DiffusionEdge outperforms traditional edge detection techniques, achieving a 3–5%. F-score improvement. Furthermore, Hu moment-based shape matching refines the comparison process, effectively mitigating perspective distortions and geometric inconsistencies encountered in previous methods such as OEF [
32] and SE [
13].
Despite these advancements, the proposed framework presents several limitations that warrant further research. The accuracy of BIM projection and SAM-based segmentation is highly contingent on input image quality, making the system susceptible to occlusions, lighting variations, and camera misalignment. Future studies should explore multi-view fusion techniques, such as integrating structured light scanning or SLAM-based spatial reconstruction, to mitigate data quality constraints. Additionally, the computational overhead associated with deep learning-based segmentation and contour extraction remains a concern, particularly for large-scale projects requiring real-time processing. Lightweight models such as PiDiNet [
17] provide a potential solution, but optimizing the trade-off between efficiency and accuracy remains a challenge. Another limitation is the narrow scope of application, as this study focuses primarily on pipeline monitoring. Expanding the framework to encompass other MEP components, such as HVAC systems, electrical conduits, and structural reinforcements, would enhance its practical applicability. Furthermore, while the current system effectively identifies static deviations, dynamic construction monitoring requires time-series analysis and predictive modeling to track temporal changes and enable real-time anomaly detection and proactive intervention.
Future research should focus on three key areas to further enhance the system’s capabilities: multi-modal sensor fusion, adaptive calibration mechanisms, and real-time monitoring frameworks. Integrating heterogeneous sensor data (e.g., LiDAR, infrared thermography, and ultrasonic scanning) with deep learning could improve detection robustness and adaptability to diverse environments. Additionally, automated camera calibration using Structure-from-Motion (SfM) techniques would allow for dynamic parameter estimation, enhancing flexibility in varying construction conditions. Finally, transitioning from post-hoc analysis to real-time monitoring via reinforcement learning or adaptive filtering techniques could enable intelligent decision-making and proactive intervention. By advancing BIM-integrated computer vision methodologies, the construction industry can achieve higher levels of precision, automation, and intelligence in project management, ultimately setting new benchmarks for efficiency, quality assurance, and sustainability.
Our study focuses on detecting MEP components and verifying their consistency with BIMs, without identifying or tracking individuals. Privacy protection techniques (e.g., blurring, masking, or encrypting sensitive image regions) ensure compliance with data privacy regulations. To mitigate privacy risks, we primarily use synthetic data from BIMs or controlled environments (e.g., unoccupied construction sites) for training and testing. This approach prevents privacy breaches and enhances the model’s generalization across construction environments.
6. Conclusions
The proposed BIM-based pipeline construction monitoring system represents a significant step forward in modern construction management practices. The system bridges the gap between digital BIMs and real-world construction processes by integrating cutting-edge technologies such as the SAM and advanced comparative analysis methods. This innovation enables precise, efficient, and automated construction progress monitoring, addressing traditional challenges such as inefficiency, human error, and the lack of real-time capabilities.
The experimental results validate our system’s effectiveness in detecting and addressing deviations from design specifications, significantly enhancing construction quality control. Furthermore, the system’s automation reduces the reliance on manual inspections, allowing construction teams to allocate resources more effectively while ensuring adherence to project timelines and quality standards. Despite its success, the system faces challenges in handling complex construction environments and maintaining robustness under varying input conditions. Future research should improve the system’s adaptability and scalability, incorporate advanced preprocessing techniques, and expand its application to more complex MEP components and larger-scale projects.
In conclusion, the proposed BIM-based pipeline construction monitoring system offers a transformative approach to enhancing construction quality control and management efficiency. By leveraging real-time data collection, deep learning algorithms, and automated comparative analysis, the system effectively minimizes errors, optimizes resource allocation, and ensures compliance with design specifications. The experimental validation confirms its capability to detect deviations with high accuracy, reinforcing its potential as a practical tool for modern construction practices. While challenges remain in adapting to complex environments and large-scale projects, ongoing advancements in data processing, model robustness, and system integration will further enhance its applicability. Future research should focus on refining its adaptability, extending its functionalities to a broader range of MEP components, and integrating with emerging technologies to establish a more intelligent and resilient construction monitoring framework.


