
Simulation Analysis of Driving Safety Based on Three-Dimensional Morphology of Water-Filled Ruts on Asphalt Road

Abstract
1. Introduction
2. Analysis of Water Accumulation in Rutted Roads
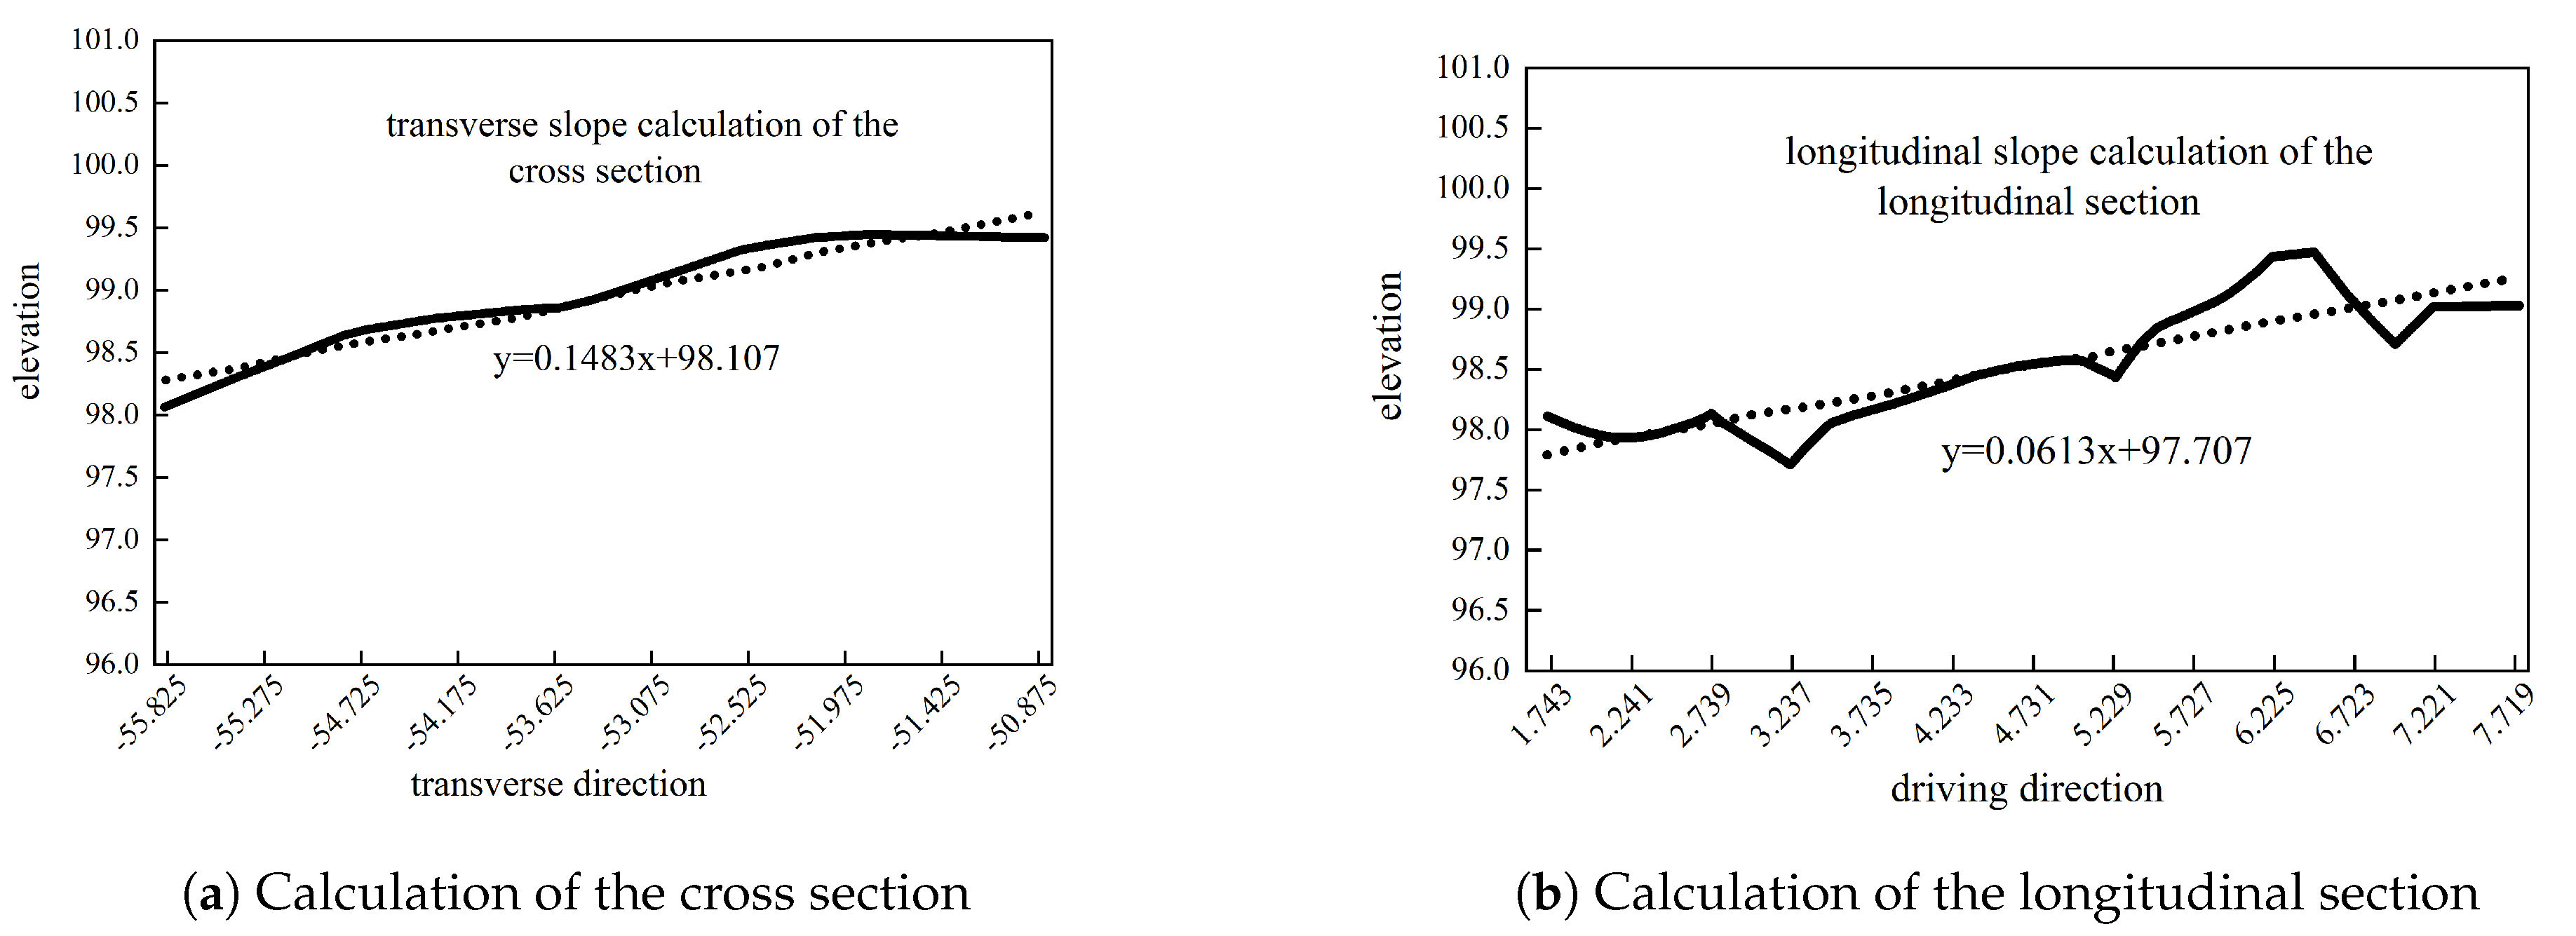
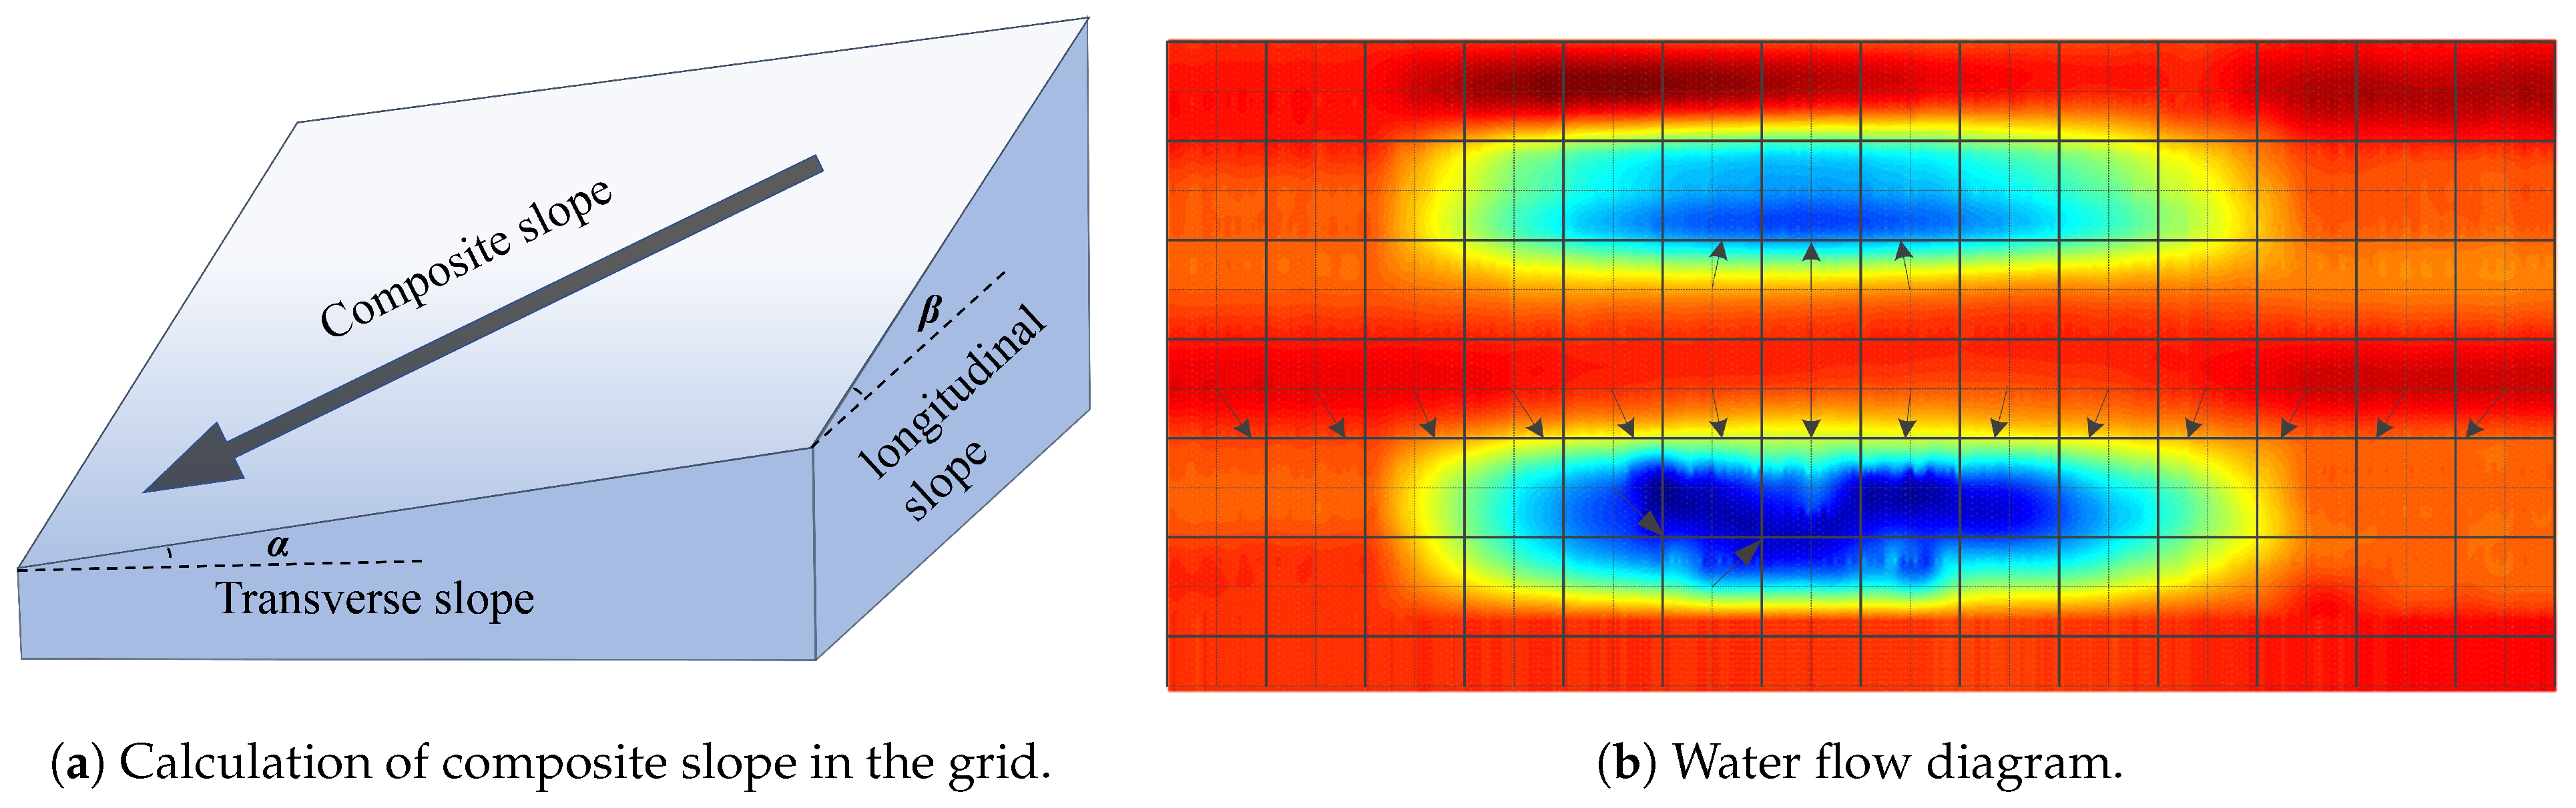
2.1. Water Flow Calculation
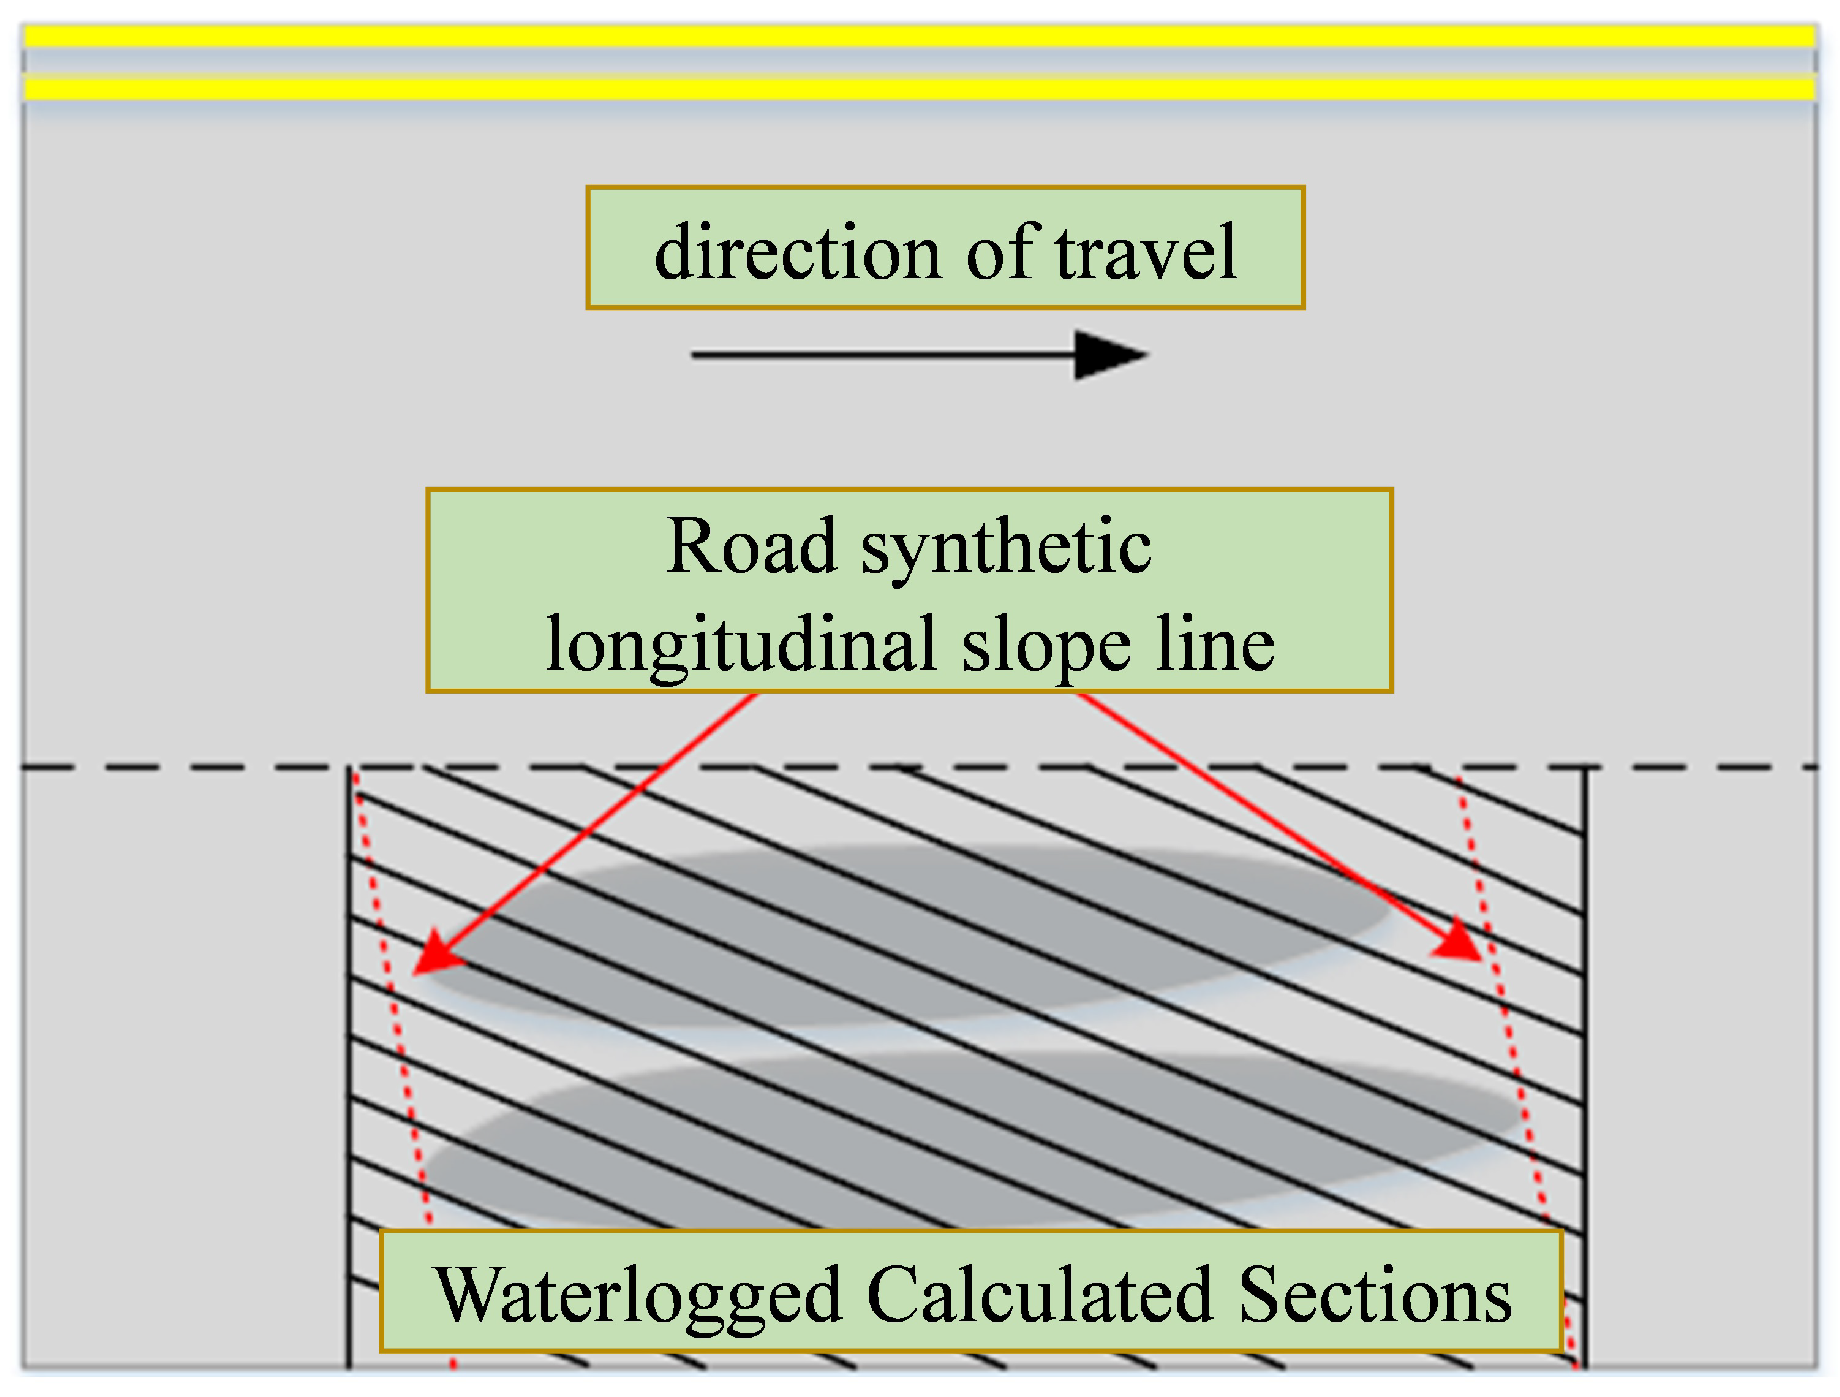
2.2. Road Surface Water Morphology Under the Influence of Ruts
2.3. Method for Calculating Adhesion Coefficient of Accumulated Water Pavement
3. Establishment of Water Rut Safety Model and Analysis of Braking and Side Deflection
3.1. Simulation Model Establishment
3.1.1. Simulation Steps
3.1.2. Selection of Safety Evaluation Indicators
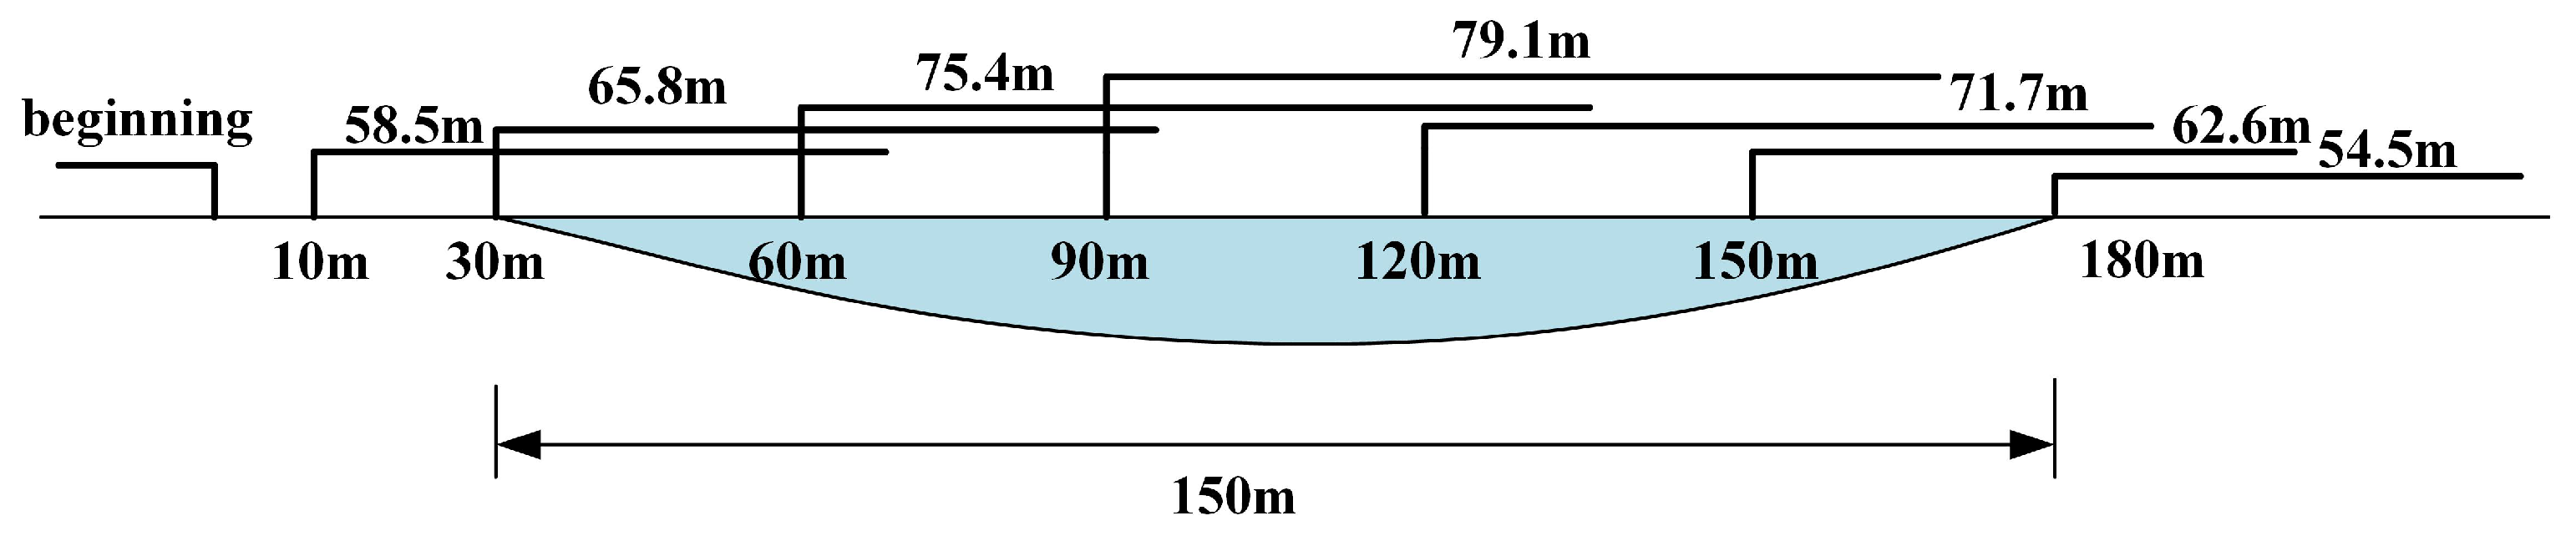
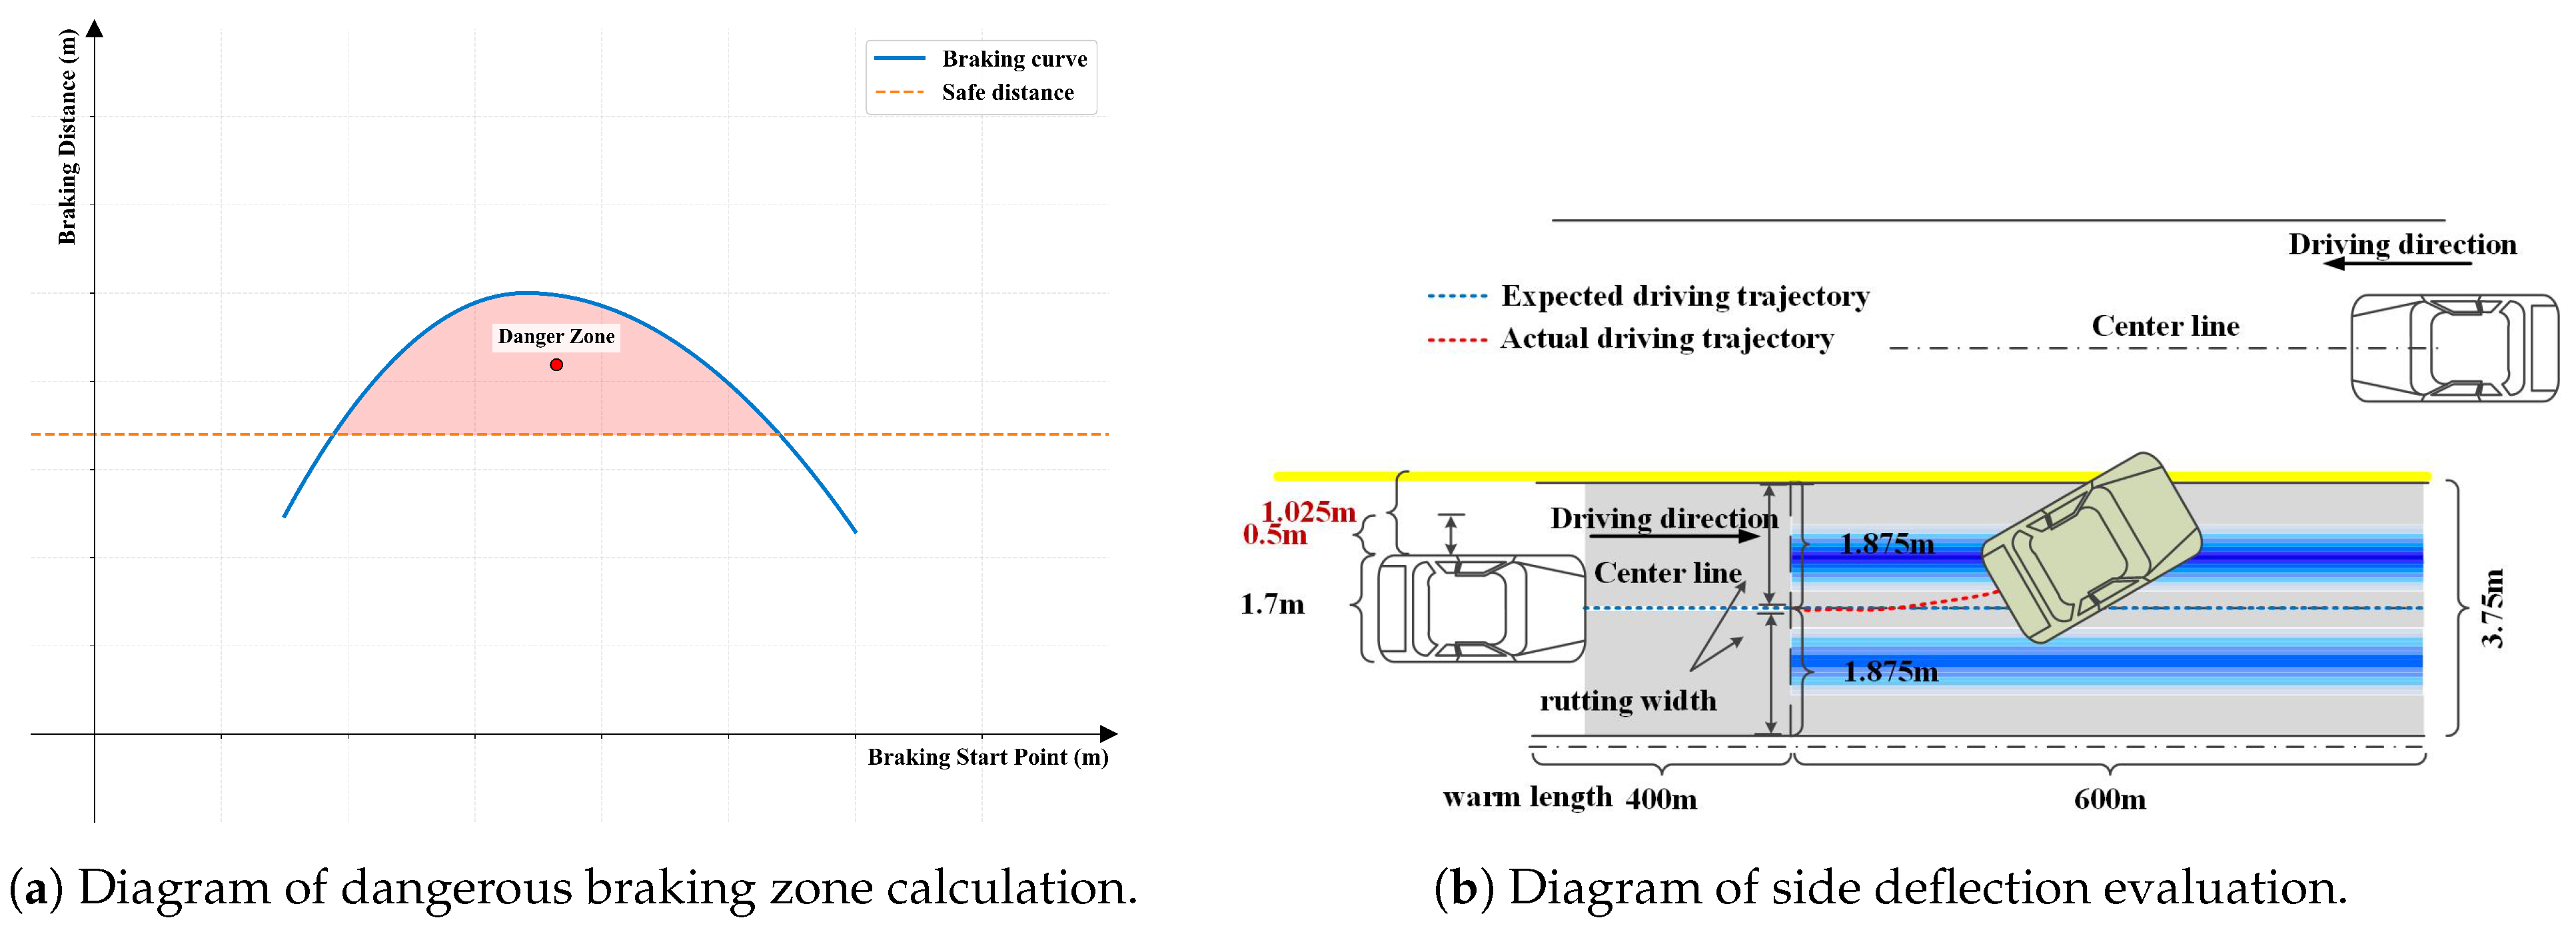
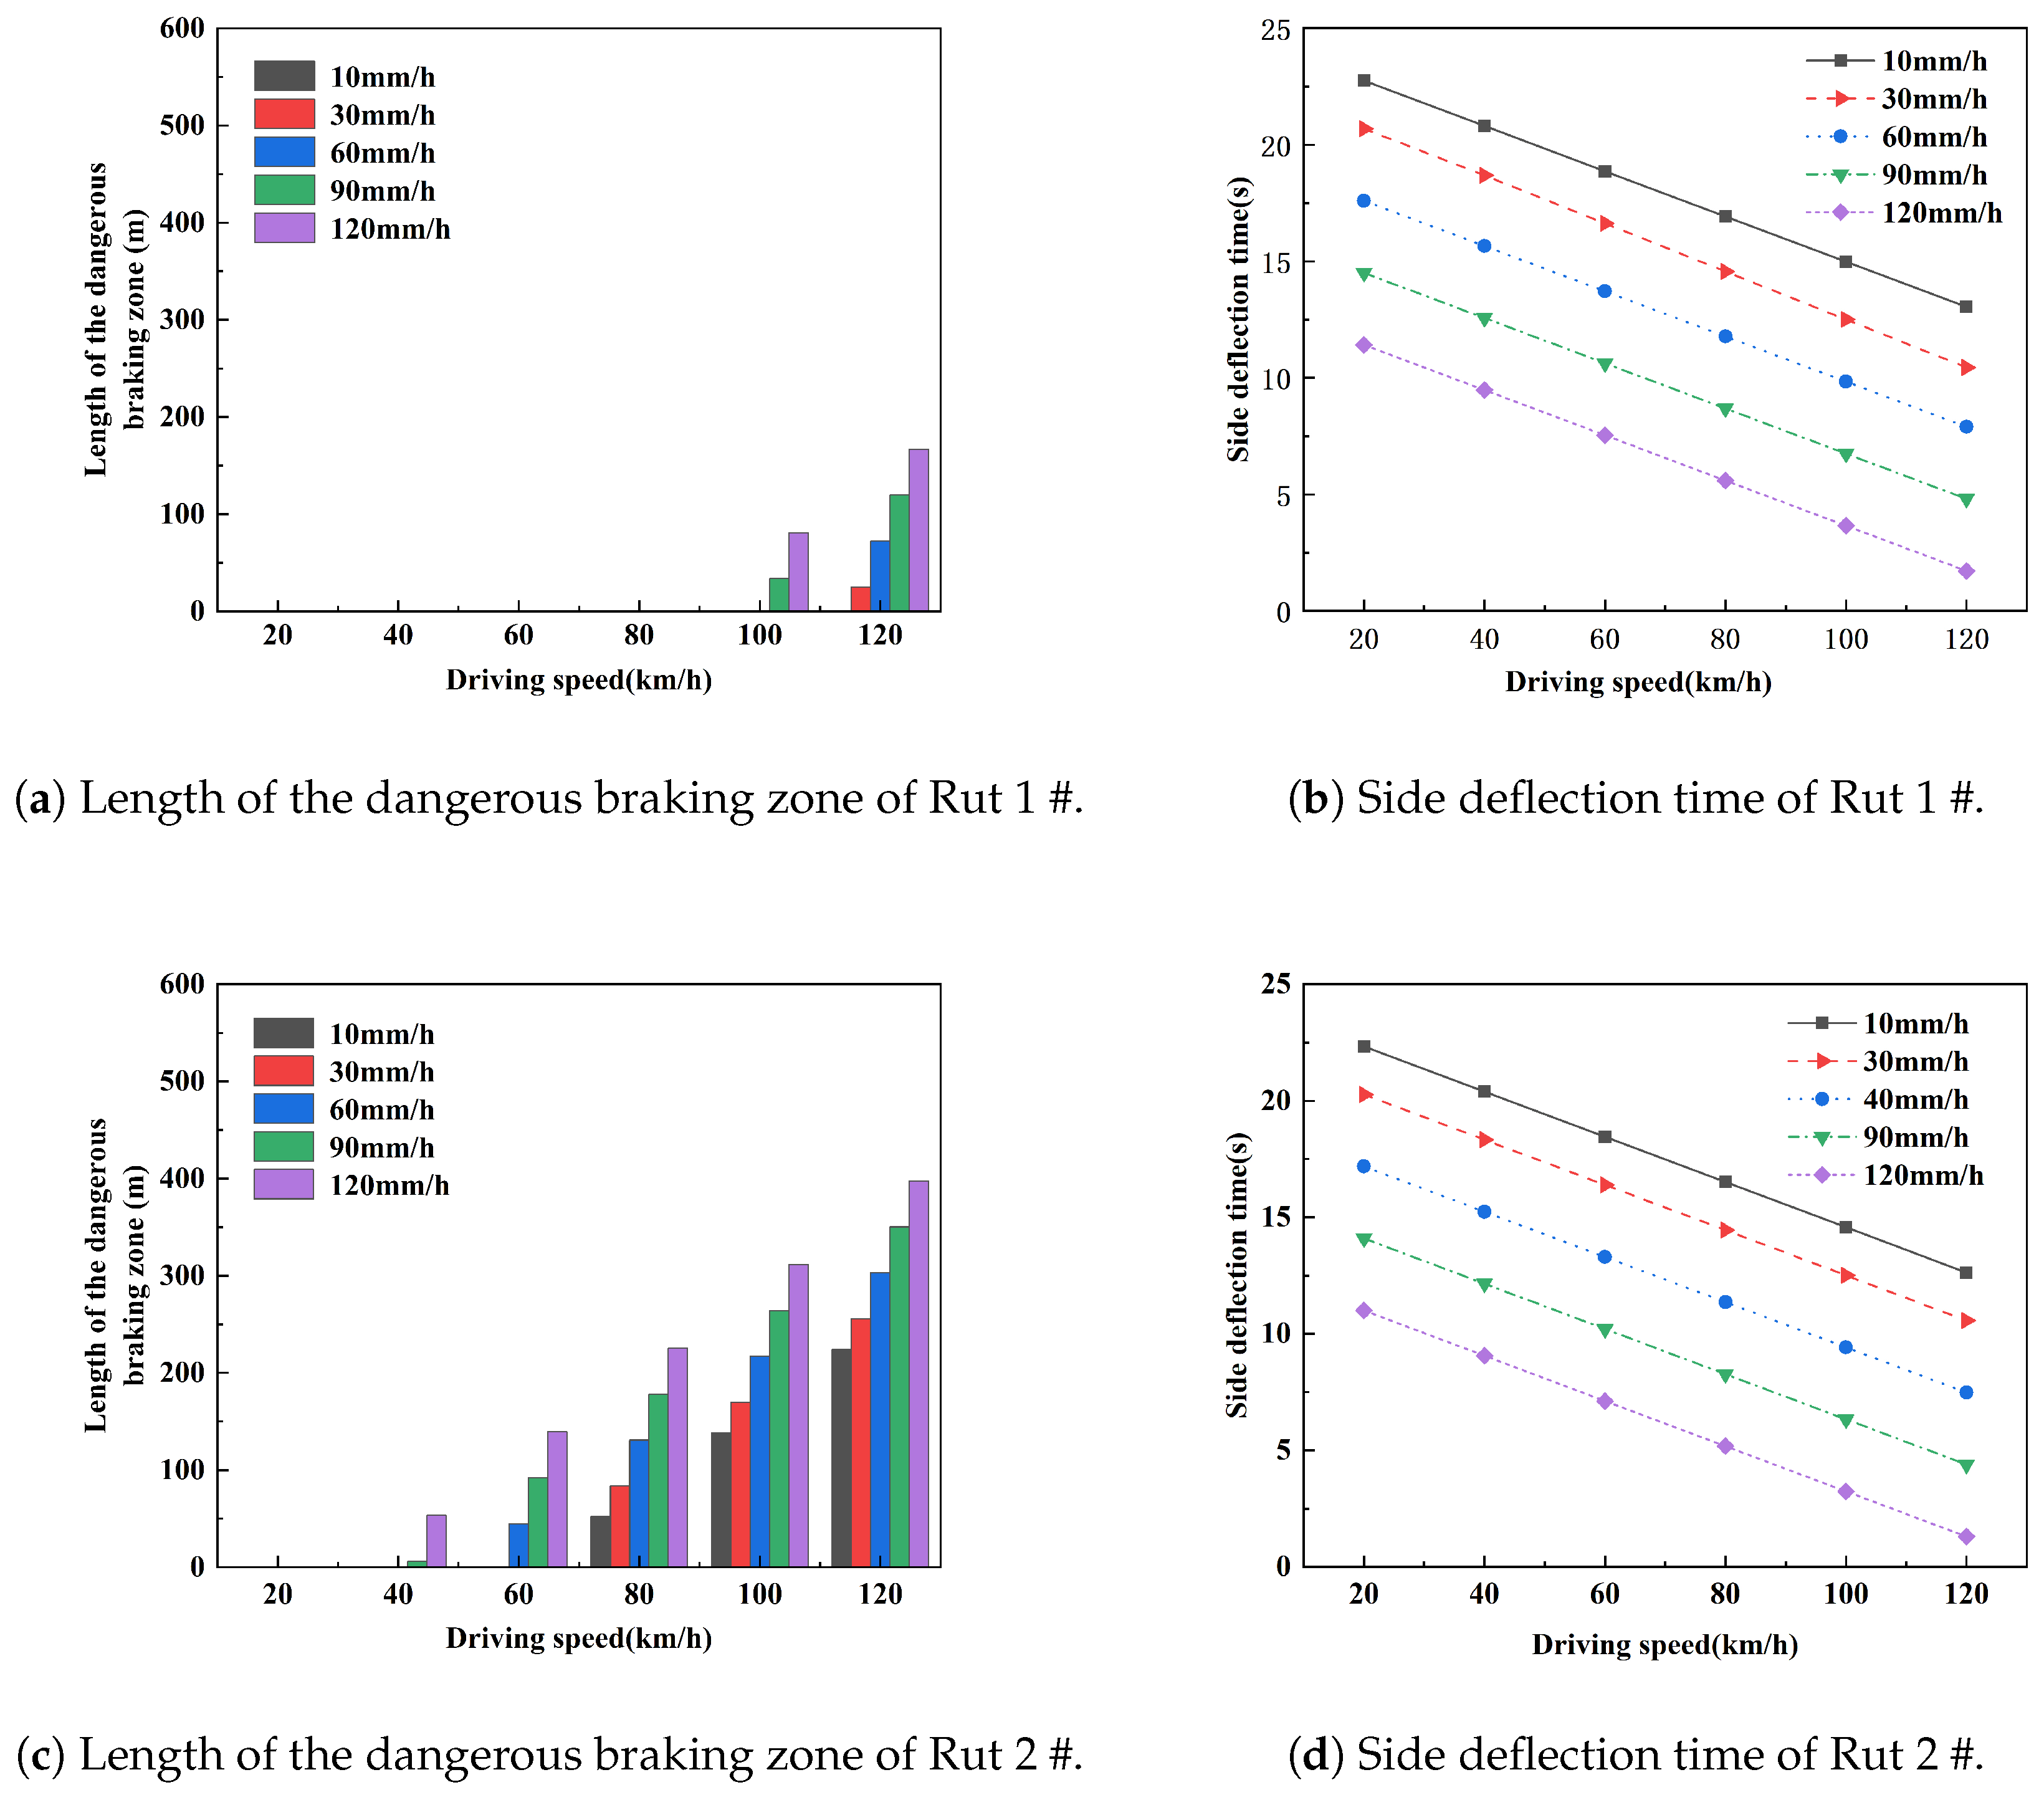
- Safety evaluation indicators of brakingFurther, when combined with the rut waterlogged state of the braking results for in-depth analysis, with different braking starting points for simulation analysis, the braking distance of the the vehicle in relation to the waterlogged rut positional relationship is as shown in Figure 9. From the figure, it can be seen that the braking distance with 180 m as the braking starting point is the smallest; this is due to its braking path and the fact that the rut has no contact, with the rest of the braking starting points of the braking path completely in contact with the rut or partially in contact with the braking path. In the initial braking action, where the braking path is in contact with the thickness of the water film, the larger the vehicle, the longer the braking distance. Therefore, the length and depth of the rutted water is an important factor affecting the safety of vehicle braking on waterlogged rutted pavement.Combining the previous studies and the braking distances at different braking starting points in Figure 9, according to the contact state between the vehicle and the rut, there exists a region between 30 m and 120 m in which the braking distance is greater than the prescribed safety distance. To summarize, on a road with accumulated water, when braking starts at a point and the braking distance is greater than the specified safe distance at the current driving speed, the length along the driving direction is defined as a dangerous braking zone. We select a point on the road as the starting point for car simulation, and define it as the 0 point of coordinate. Then, a point away from the starting point is chosen as the braking point for simulation, and the result curves are shown in Figure 10a. The x-axis is the braking starting point coordinate and the y-axis is the braking distance. We find that the coordinates of the starting point of braking at the braking distance are equal to the safe vehicle distance at the corresponding driving speed, and the length between the two is the length of the dangerous braking zone.For the same rut, under different rainfall intensity and traveling speed, the water accumulation pattern is different, and the length of hazardous braking zone is different; under the same rainfall intensity and traveling speed, the water accumulation pattern is also different for ruts of different lengths, widths, and depths, thus affecting the length of hazardous braking zone. Therefore, this paper selects the length of dangerous braking zone as the safety evaluation index of waterlogged rut braking.
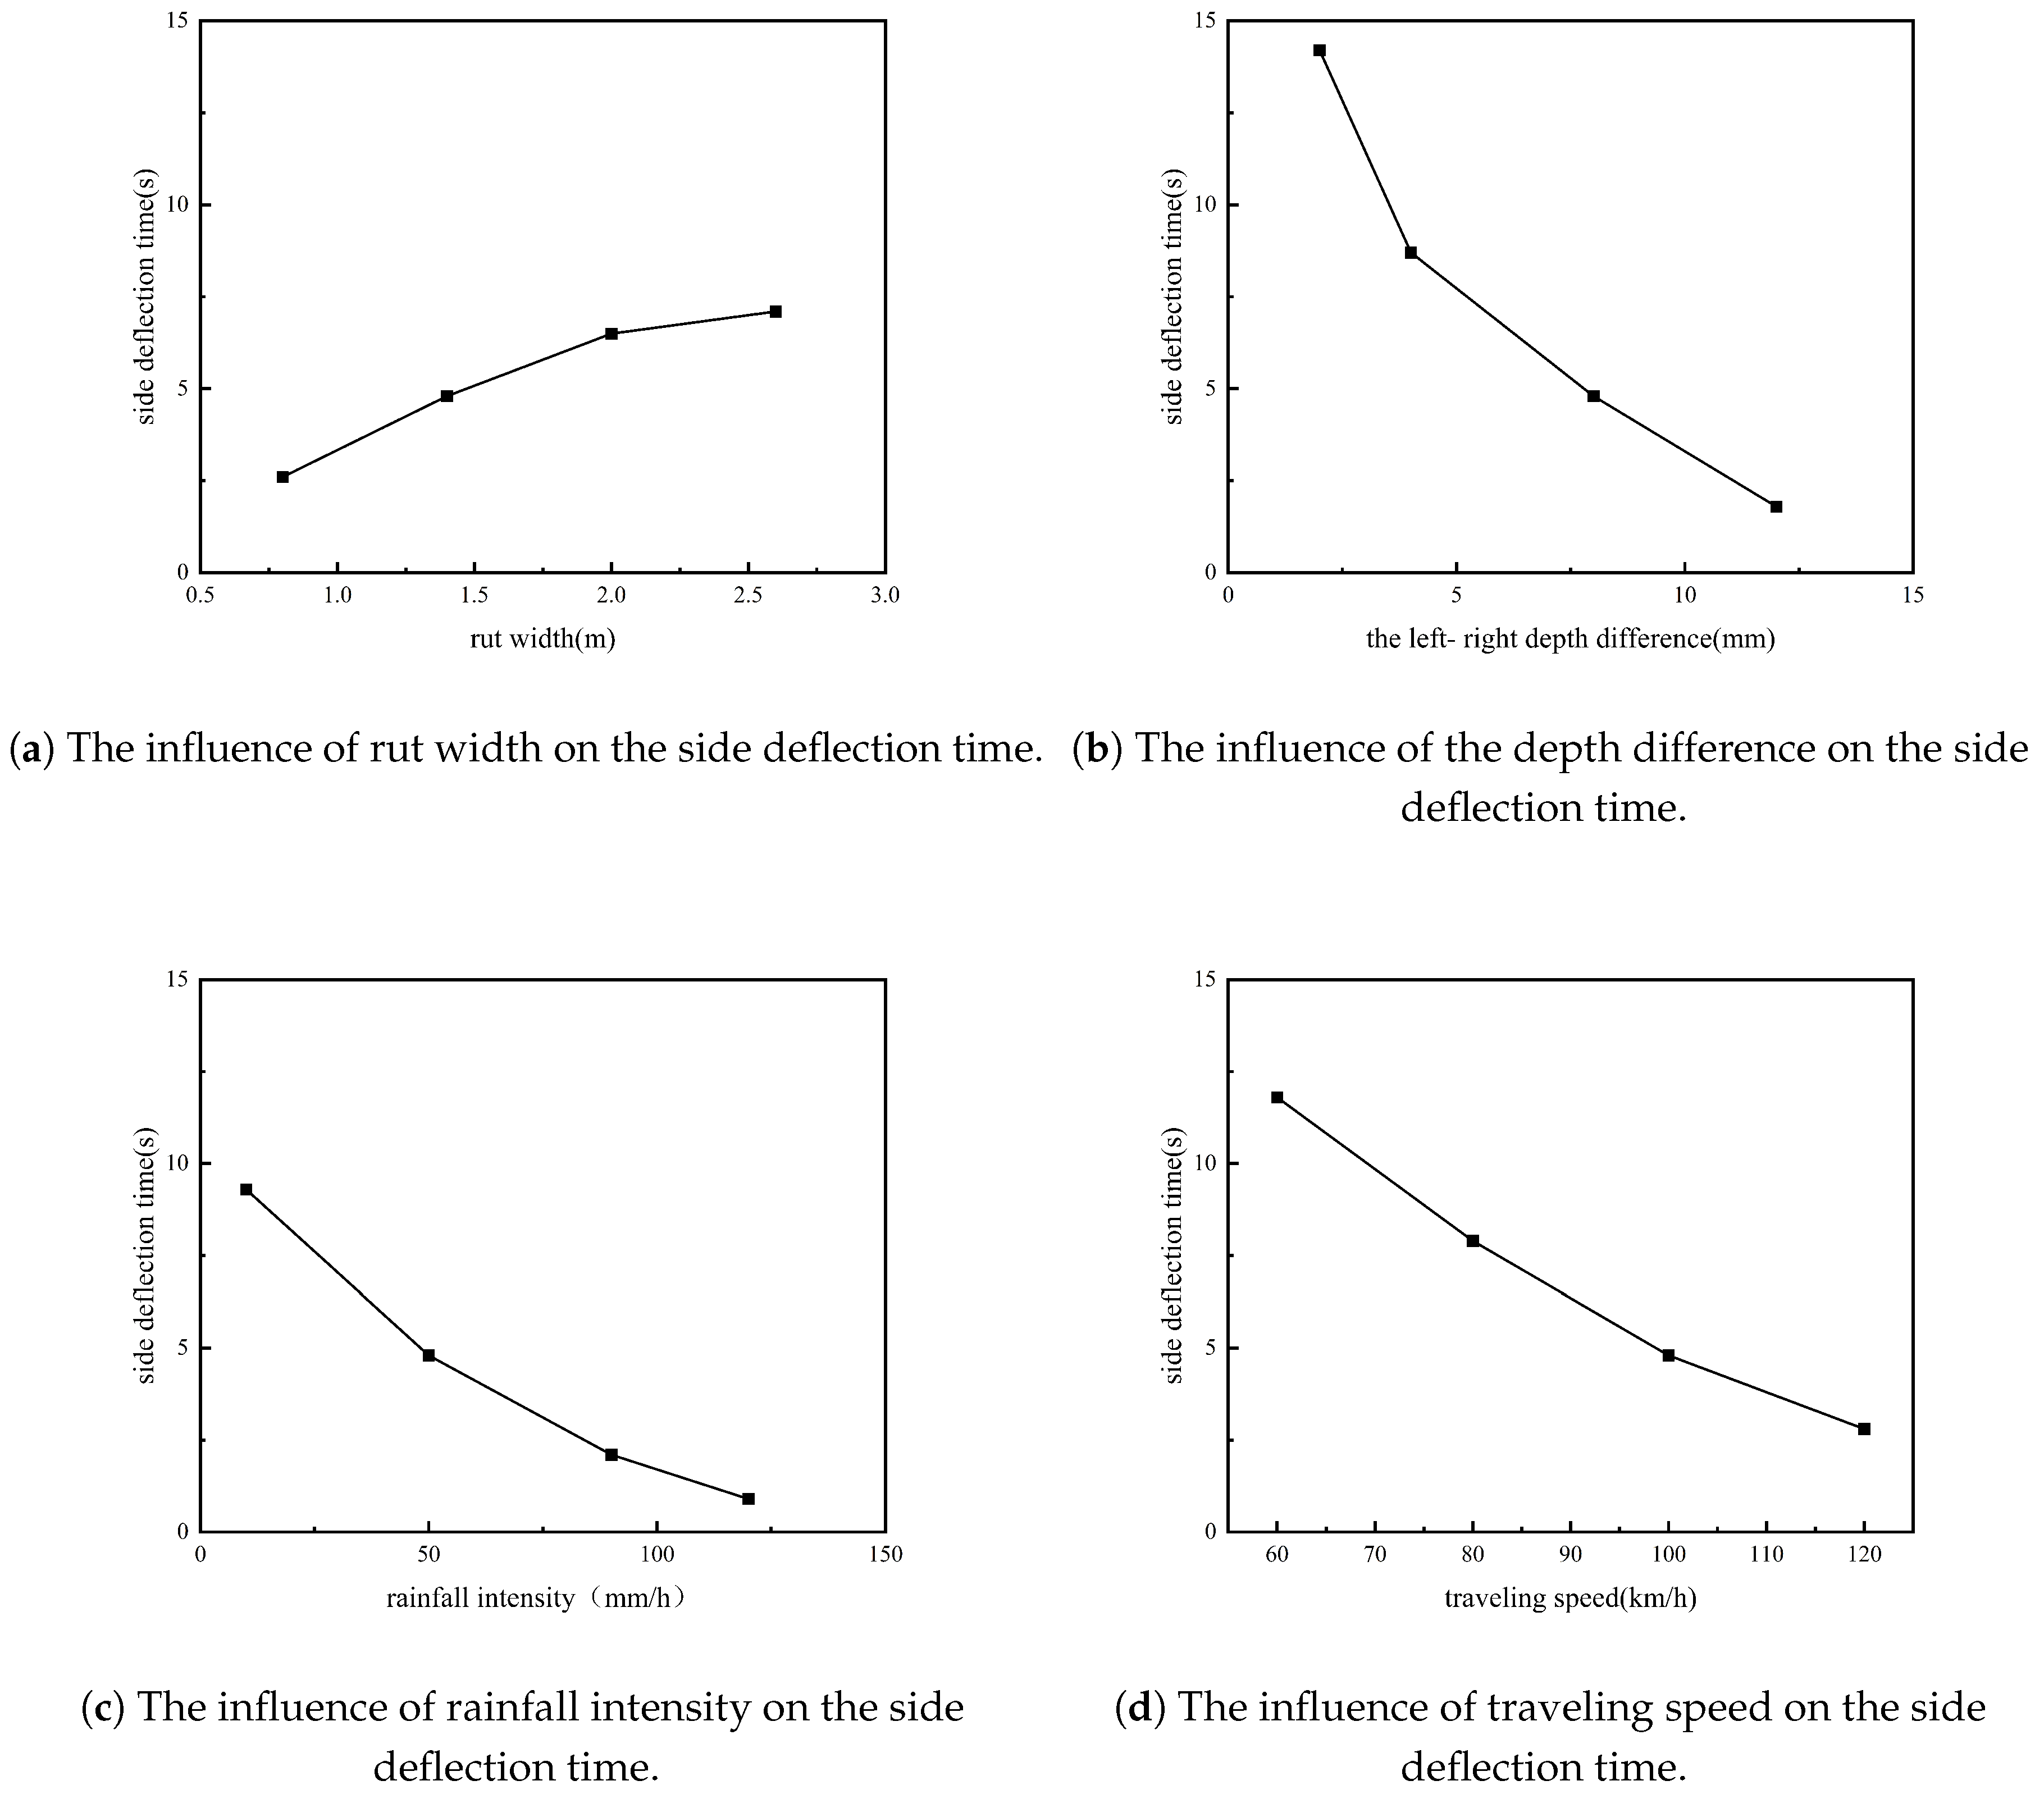
- Safety evaluation index of side deflectionThe side deflection distance is used as an index for the results of the lateral safety simulation analysis in this paper. The occurrence of the side deviation of a vehicle in a waterlogged rut is mainly due to the different friction states of the left and right wheels in contact with the road surface, resulting in an imbalance of the lateral forces on the wheels, and thus the risk threshold for the amount of side deviation of a rut can be defined as half of the width of the rut waterlogged rut. But for car ruts, if uneven water accumulation occurs, the width of the water area of different ruts is not the same. For the same rut, the width of the accumulated water is not the same for different rainfall intensities and time periods. Therefore, it is impossible to directly characterize the lateral safety of a section with accumulated water. For a rut with accumulated water, the side risk threshold is half the width of the water accumulation, but the time (T) to reach the risk threshold is not the same under different conditions. If the driver is still unable to respond when the time reaches T, then the vehicle will be in danger (Figure 10b).Since the lateral deviation amount and lateral deviation time are the most simple and intuitive, this paper selects the lateral deviation time at which the lateral deviation amount reaches half of the rut width, i.e., the critical lateral deviation time, as the safety evaluation index of lateral deviation. This index can be applied to different models, different water depths, and different speeds, so that it is comparable between different working conditions, thus improving the applicability and universality of the evaluation system.
3.2. Simulation Condition Analysis
3.2.1. Selection of Simulation Conditions
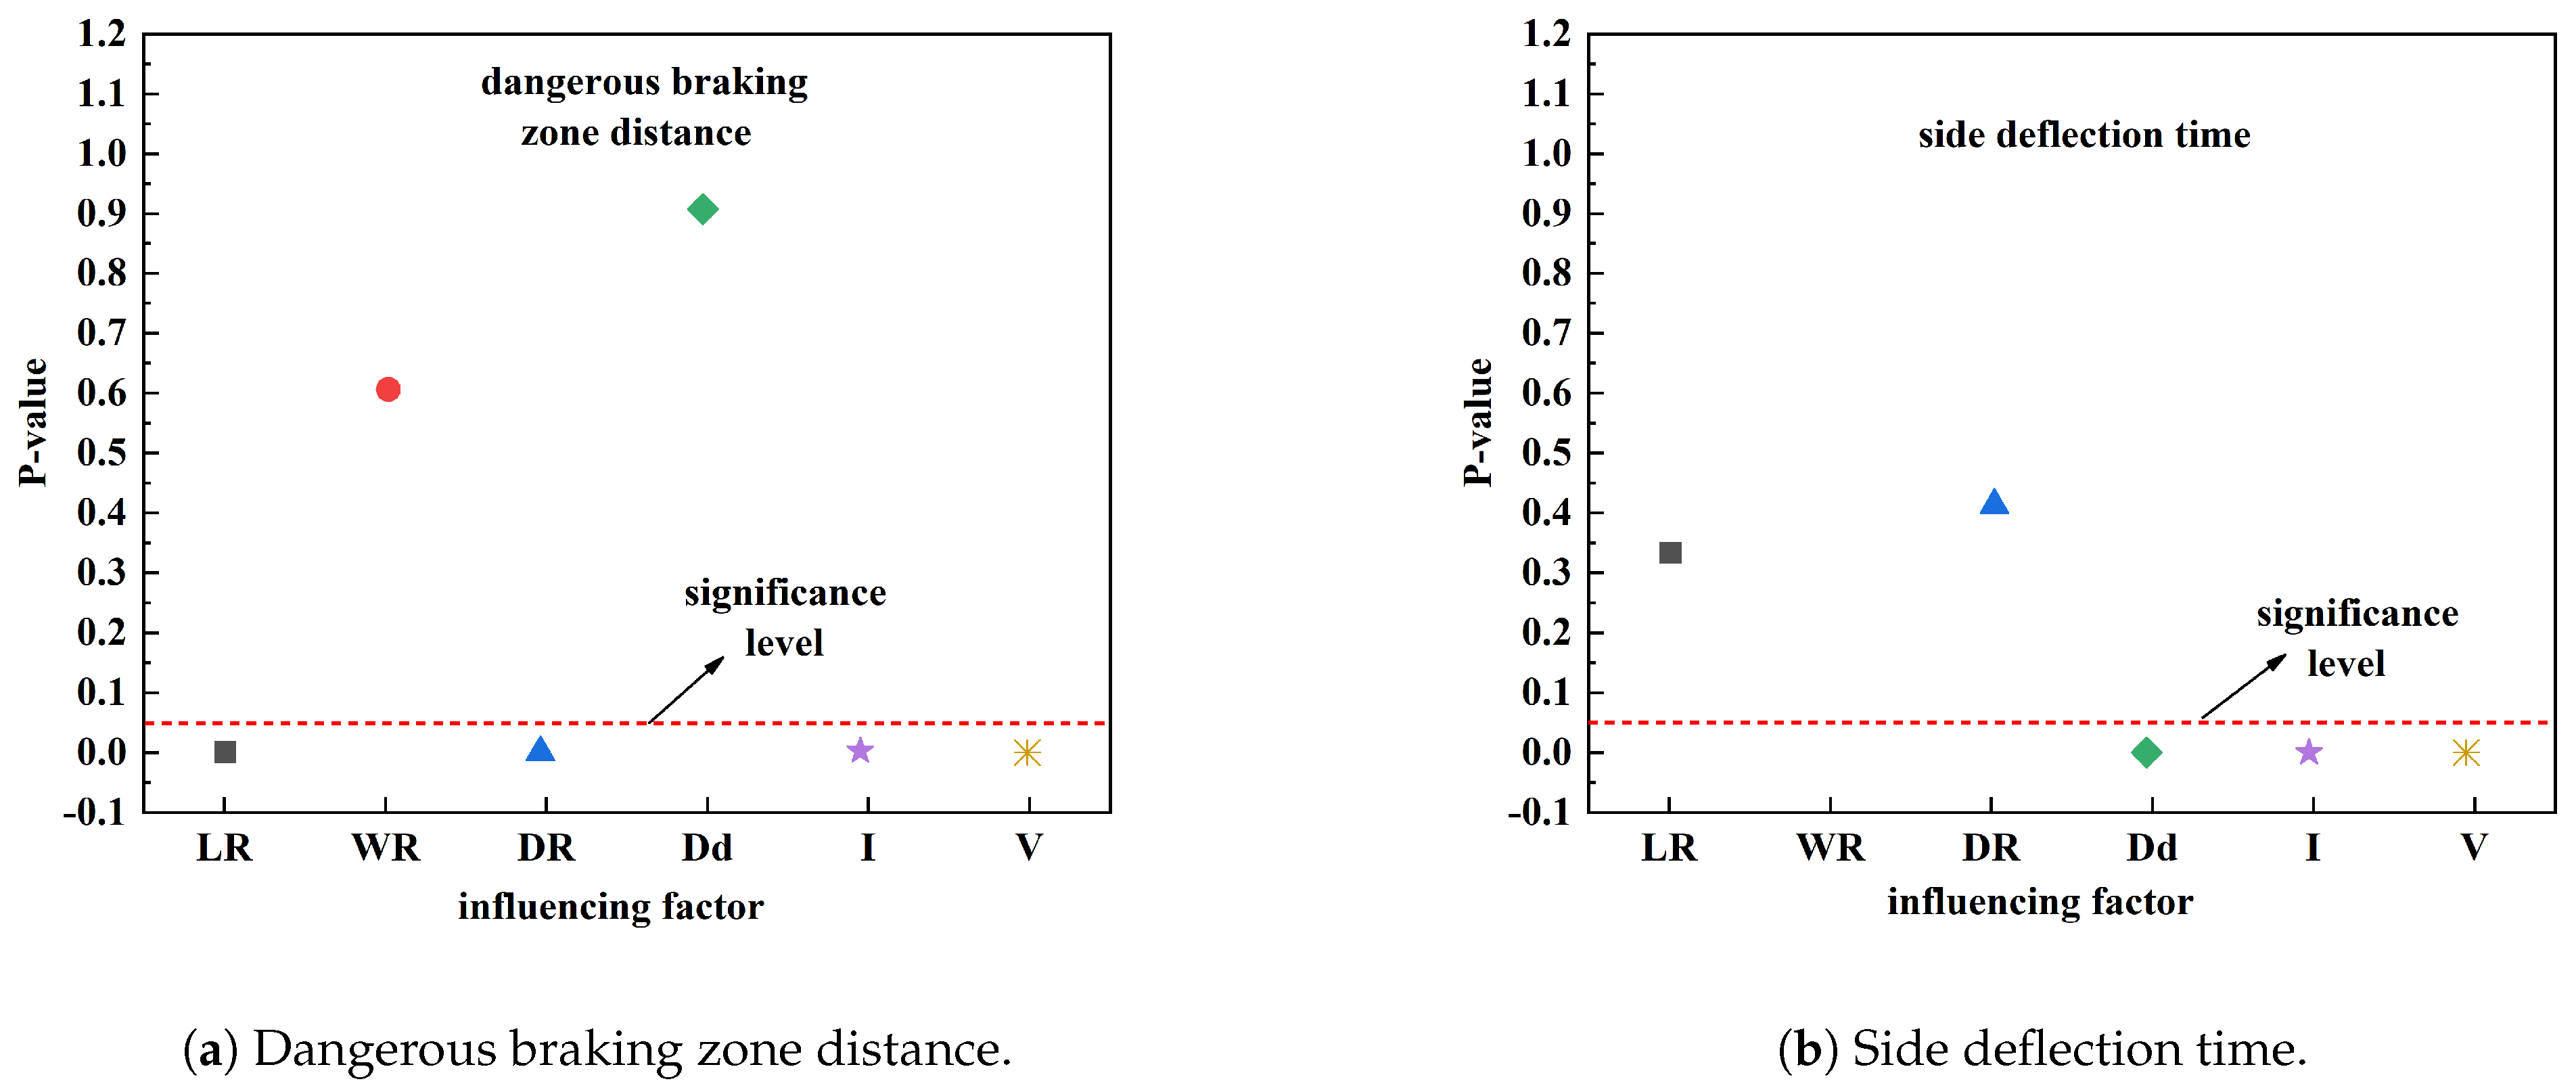
3.2.2. Correlation Analysis of Indicators
3.3. Driving Safety Evaluation Model for Water Rut
3.3.1. Braking Safety Evaluation Model
3.3.2. Side Deflection Safety Evaluation Model
4. Case Analysis of Driving Safety Evaluation of Water-Filled Ruts
4.1. Data Collection
4.2. Driving Safety Evaluation on Roads with Water-Filled Ruts
5. Conclusions
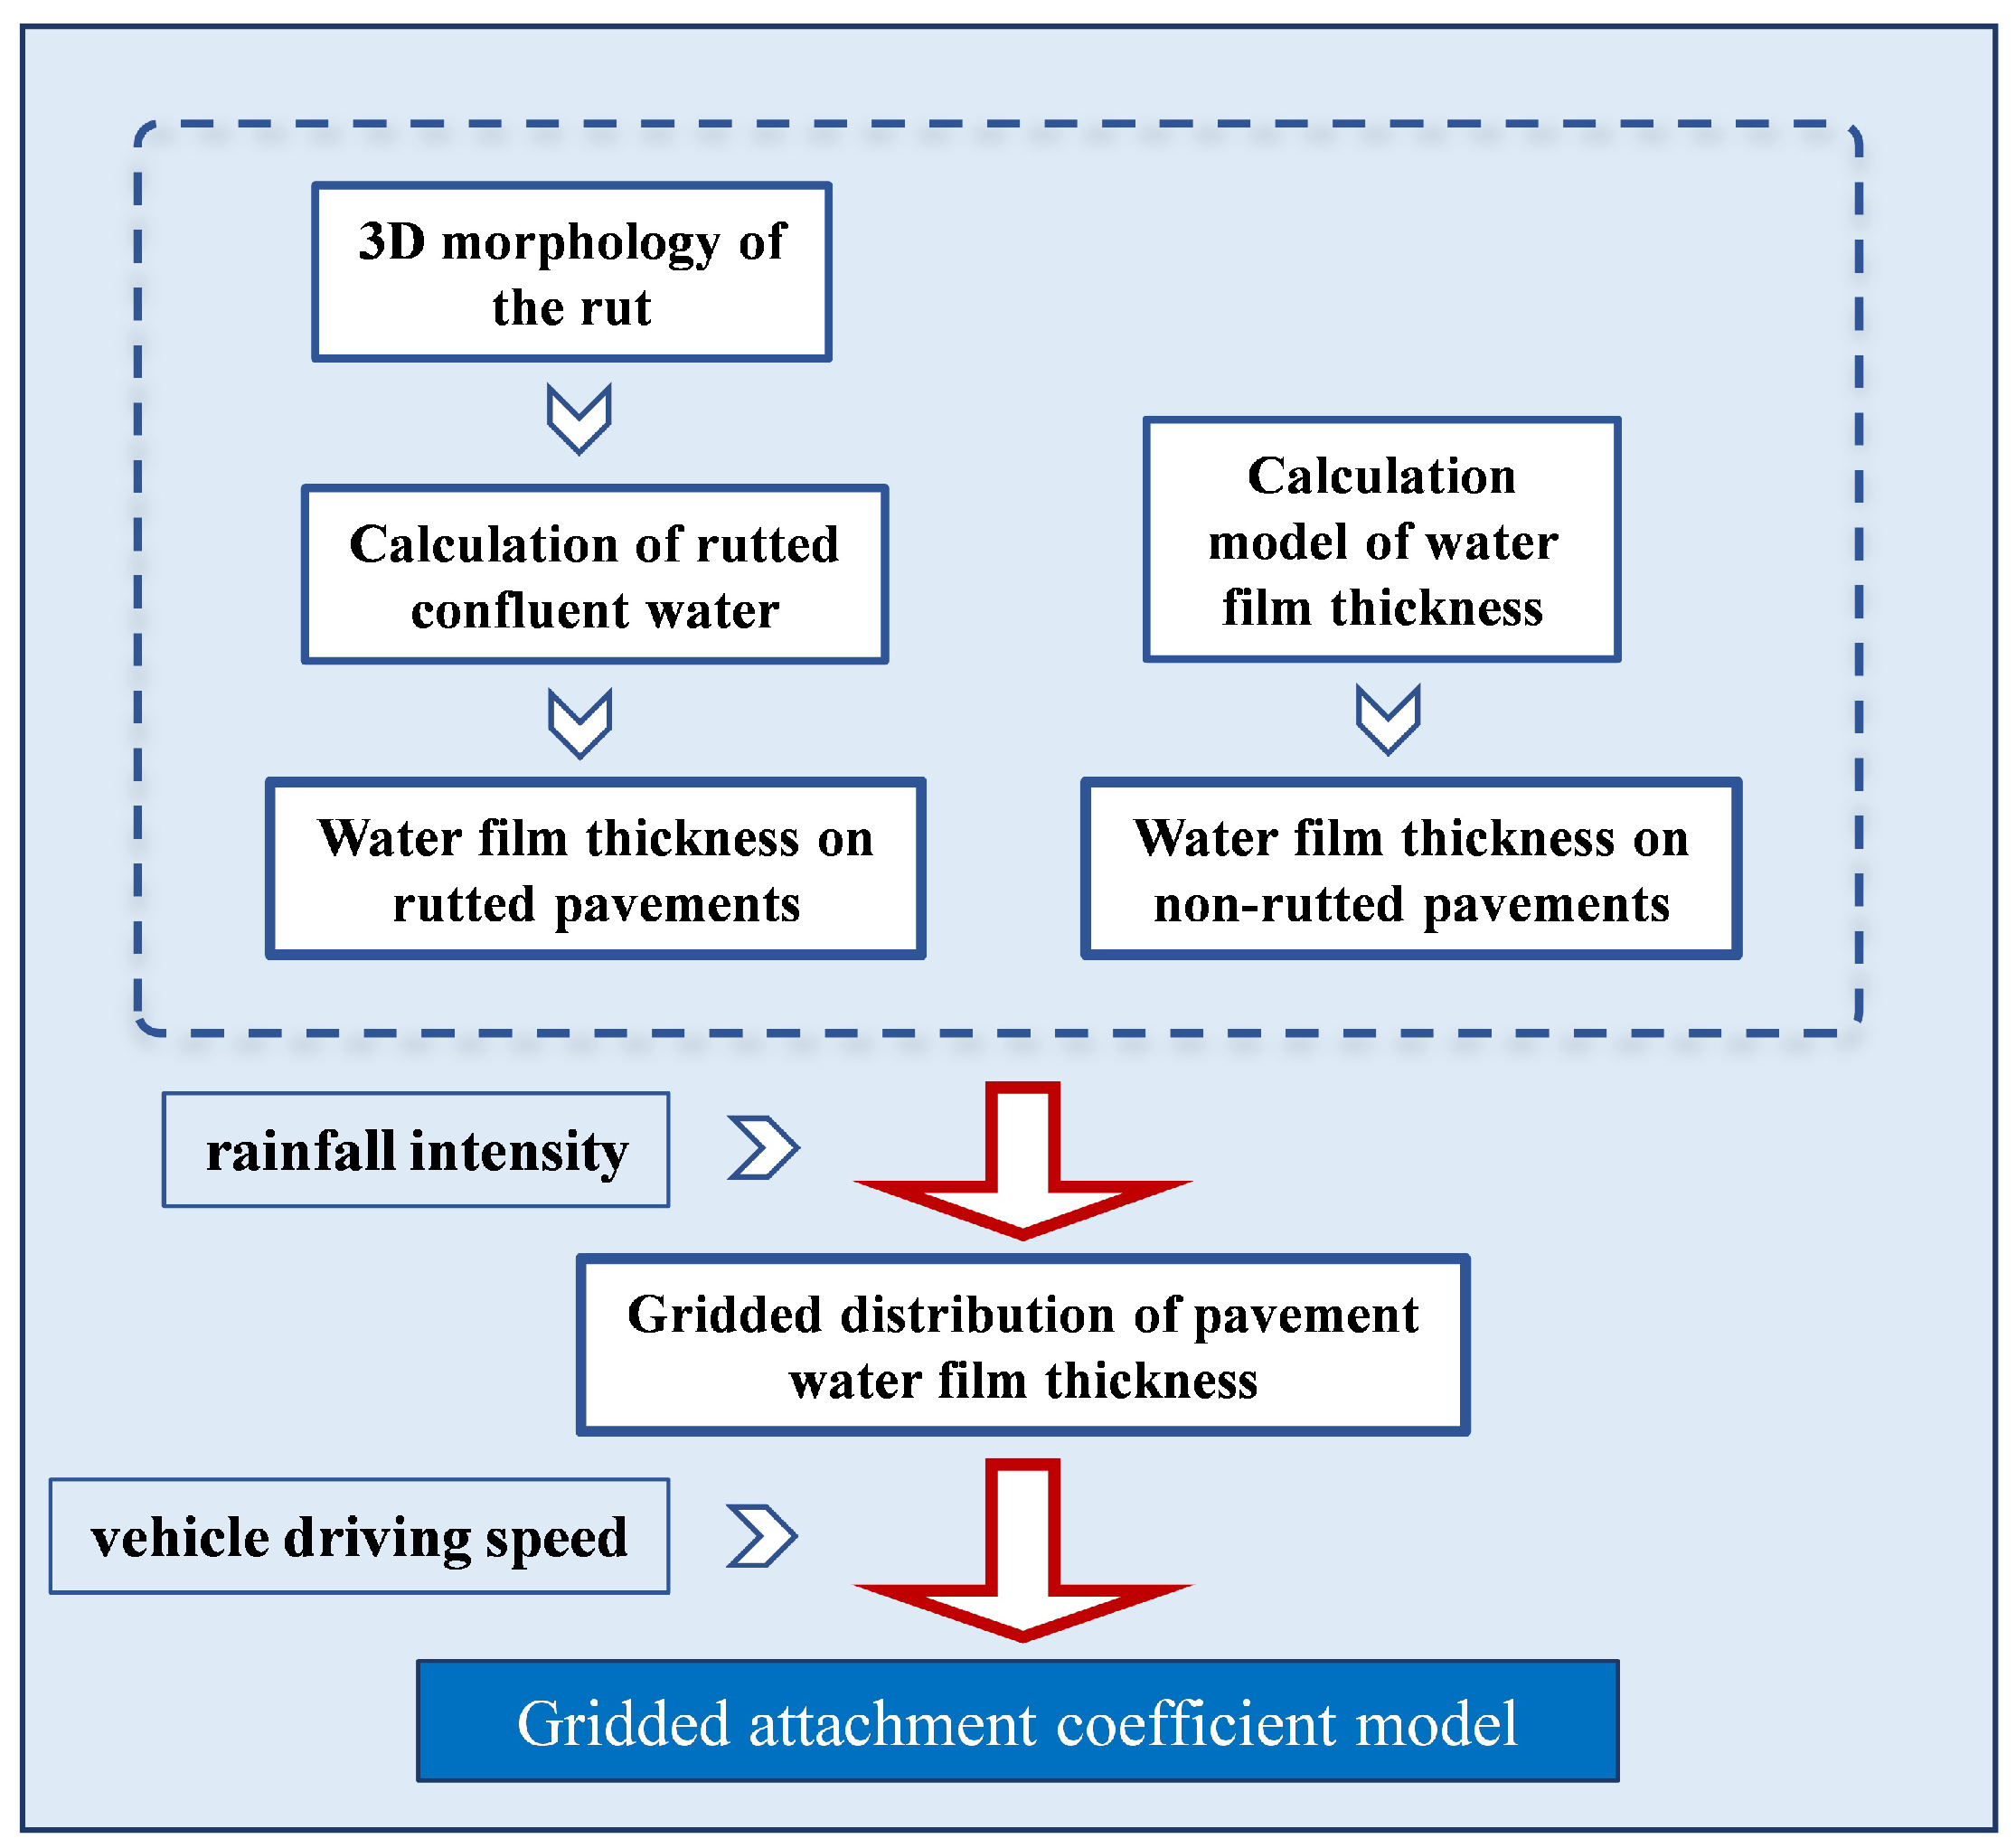
- We realized the distribution calculation of the water film thickness of the whole road area of the rutted road section. According to the characteristics of pavement runoff and the three-dimensional shape of ruts, a calculation method for the water catchment process of rutted pavement based on grid division is proposed, and the pavement is divided into rutted pavement and non-rutted pavement. According to the three-dimensional shape and distribution characteristics of rutting water, the water film thickness of rutting water pavement is calculated. The water film thickness of the non-rutting water pavement is calculated, and the gridded water film thickness of the whole lane road surface under the influence of rutting is obtained.
- The length of the dangerous braking zone and the side deflection time are proposed as the driving safety evaluation indexes of water-filled ruts. The three-dimensional morphological indicators of ruts, such as rut length, width, depth, and depth difference between left and right ruts, were selected together with rainfall intensity and driving speed to establish a combination of control variable simulation conditions. According to the correlation analysis of influencing factors, the results show that the rut length, rut depth, rainfall intensity, and driving speed are strongly correlated with the braking distance, and the rut width, left and right rut depths, rainfall intensity, and driving speed are strongly correlated with the side deflection distance.
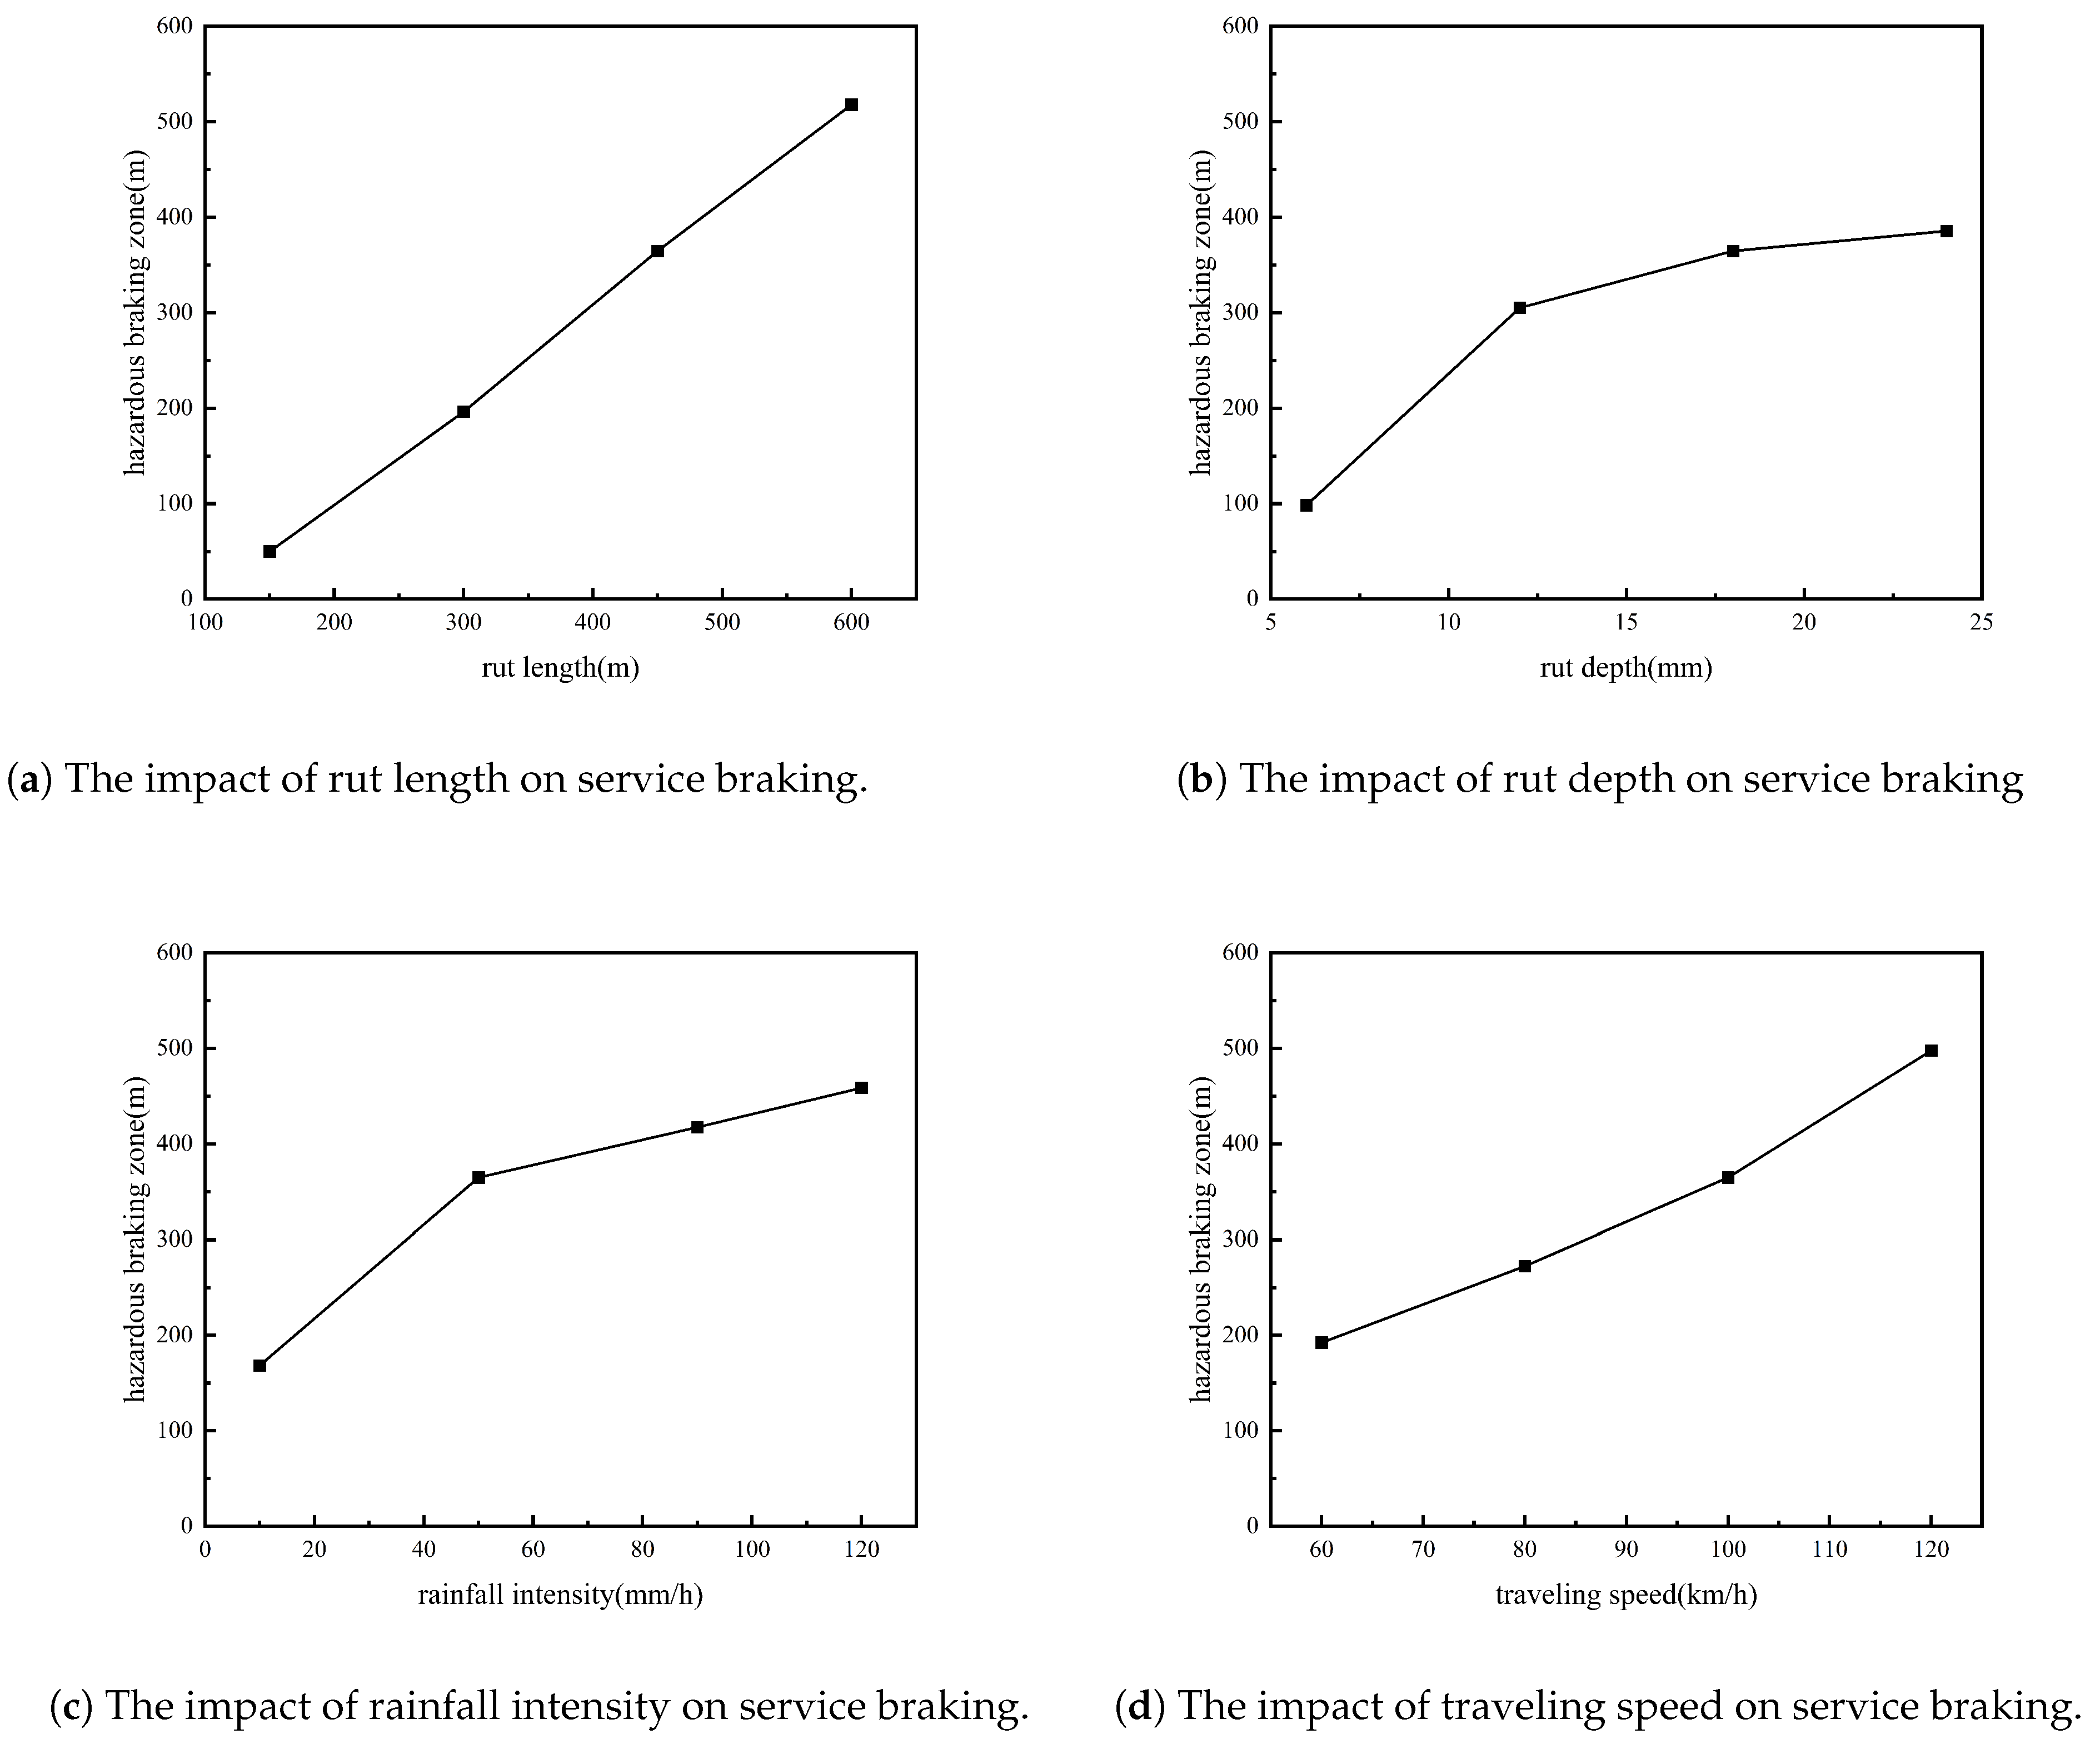
- The effects of rut length, rut depth, rainfall intensity, and driving speed on the braking distance are analyzed, and a safety evaluation model for driving in water-filled ruts is established. The influence of rut width, left and right rut depth difference, rainfall intensity, and driving speed on the side deflection distance is analyzed, and a vehicle lateral safety evaluation model for water-filled ruts is established.
- On this basis of the establishment of a waterlogged rut driving brake safety evaluation model and waterlogged rut driving side deviation safety evaluation model, the actual waterlogged rut in different sections of the road is calculated, as is the critical safe speed under different rainfall intensities, and the real-time early warning of waterlogged rut driving safety is realized. In the future, the results of the study can be used in intelligent driving systems to optimize driving strategies in rainy days, providing automatic deceleration warnings in rutted areas of pavement that are experiencing ponding.
Author Contributions
Funding
Institutional Review Board Statement
Informed Consent Statement
Data Availability Statement
Conflicts of Interest
References
- Anderson, J. Depth of Rain Water on Road Surface. Highw. Transp. 1995, 5, 45–49. [Google Scholar]
- Luo, J.; Liu, J.; Wang, Y. Validation test on pavement water film depth prediction model. China J. Highw. Transp. 2015, 28, 57–63. [Google Scholar]
- Wang, Y.; Li, G.; Zhang, Z. Verification of water film depth model and highway traffic safety in rainy day. Sci. Technol. Eng. 2017, 17, 128–132. [Google Scholar]
- Li, Y.; Jiao, S.; Bao, Y. Dry and Wet State Discrimination and the Application of Water/Snow Accumulation Model on the Road Surface of Expressway. Sci. Technol. Eng. 2017, 33, 558–567. [Google Scholar]
- Ma, Y.; Geng, Y.; Chen, X.; Lu, Y. Prediction for asphalt pavement water film thickness based on artificial neural network. J. Southeast Univ. Engl. Ed. 2017, 33, 490–495. [Google Scholar]
- Brufau, P.; García-Navarro, P.; Vázquez-Cendón, M. Zero mass error using unsteady wetting–drying conditions in shallow flows over dry irregular topography. Int. J. Numer. Methods Fluids 2004, 45, 1047–1082. [Google Scholar] [CrossRef]
- Geng, Y.; Chen, X.; Chen, Y.; Ma, Y.; Huang, X. Runoff characteristics for straightline segment asphalt pavement based on two-dimensional shallow water equations. J. Traffic Transp. Eng. 2019, 19, 9–16. [Google Scholar]
- Ong, G.P.; Fwa, T. Prediction of wet-pavement skid resistance and hydroplaning potential. Transp. Res. Rec. 2007, 2005, 160–171. [Google Scholar] [CrossRef]
- Fwa, T.; Kumar, S.S.; Ong, G.P.; Huang, C. Analytical modeling of effects of rib tires on hydroplaning. Transp. Res. Rec. 2008, 2068, 109–118. [Google Scholar] [CrossRef]
- Ong, G.P.; Fwa, T. Wet-pavement hydroplaning risk and skid resistance: Modeling. J. Transp. Eng. 2007, 133, 590–598. [Google Scholar] [CrossRef]
- Fwa, T.; Ong, G.P. Wet-pavement hydroplaning risk and skid resistance: Analysis. J. Transp. Eng. 2008, 134, 182–190. [Google Scholar] [CrossRef]
- Ji, T.; Gao, Y.; Chen, R. Dynamic hydroplaning analysis of car tire. J. Traffic Transp. Eng. 2010, 10, 57–60. [Google Scholar]
- Zhang, C.; Guo, X.; Cue, B. Influence of uneven wet pavement surface condition on driving safety. J. Highw. Transp. Res. Dev. 2014, 31, 104–111. [Google Scholar]
- Min, Z.; Guo, X.; Chi, Z. Simulation analysis of rutting length based on driving safety under condition of road waterlogging. J. Syst. Simul. 2020, 27, 747–754. [Google Scholar]
- Zhu, S.; Huang, X. Numerical simulation of tire hydroplaning speed on transverse grooved concrete pavements. J. Southeast Univ. (Nat. Sci. Ed.) 2016, 46, 1296–1300. [Google Scholar]
- Wang, W. A Simulation Analysis of Pavement Skid Resistance Against Driving Safety on Curve Roads. J. Transp. Inf. Saf. 2017, 35, 32–37. [Google Scholar]
- Cao, Q. Analysis of Vehicle Stability Influenced by Skid Resistance of Asphalt Pavement. Ph.D. Thesis, Southeast University, Nanjing, China, 2018. [Google Scholar]
- Yan, J.; Li, Y.; Hui, B. Simulation analysis of rutting section unevenness with respect to vehicle driving safety. Automob. Technol. 2019, 47, 47–51. [Google Scholar]
- Ma, T.; Tang, J.; Zheng, B.; Huang, X. Adhesion Characteristics Between Vehicle Tires and Asphalt Pavement Under Rainy Conditions. J. Beijing Univ. Technol. 2022, 48, 635–643. [Google Scholar]
- Yan, J. Driving Safety Analysis Using Grid-Based Water-Filled Rut Depth Distribution. J. Saf. Environ. 2022, 22, 1759–1767. [Google Scholar] [CrossRef]
- Cai, J.; Zhao, H.; Qian, X.; Wu, M.; Qian, J. A Real-Time Correction Method for Airport Runway Water Film Thickness Distribution Prediction Using Measured Data. J. Traffic Transp. Eng. 2023, 23, 105–114. [Google Scholar]
- JTJ073.2-2001; Technical Specifications for Maintenance of Highway Asphalt Pavement. Ministry of Communications of the People Republic of China: Beijing, China, 2001.


| No. | Rut Length/ (m) | Rut Width (m) | Rut Depth/ (mm) | Depth Difference Between Left and Right/ (mm) | Rainfall Intensity/I (mm/h) | Driving Speed (km/h) |
|---|---|---|---|---|---|---|
| 1 | 150 | 2 | 18 | 8 | 50 | 100 |
| 2 | 300 | 2 | 18 | 8 | 50 | 100 |
| 3 | 450 | 2 | 18 | 8 | 50 | 100 |
| 4 | 600 | 2 | 18 | 8 | 50 | 100 |
| 5 | 450 | 0.8 | 18 | 8 | 50 | 100 |
| 6 | 450 | 1.4 | 18 | 8 | 50 | 100 |
| 7 | 450 | 2.4 | 18 | 8 | 50 | 100 |
| 8 | 450 | 2 | 6 | 8 | 50 | 100 |
| 9 | 450 | 2 | 12 | 8 | 50 | 100 |
| 10 | 450 | 2 | 24 | 8 | 50 | 100 |
| 11 | 450 | 2 | 18 | 2 | 50 | 100 |
| 12 | 450 | 2 | 18 | 4 | 50 | 100 |
| 13 | 450 | 2 | 18 | 12 | 50 | 100 |
| 14 | 450 | 2 | 18 | 8 | 10 | 100 |
| 15 | 450 | 2 | 18 | 8 | 100 | 100 |
| 16 | 450 | 2 | 18 | 8 | 150 | 100 |
| 17 | 450 | 2 | 18 | 8 | 150 | 60 |
| 18 | 450 | 2 | 18 | 8 | 150 | 80 |
| 19 | 450 | 2 | 18 | 8 | 150 | 120 |
| df | SS | MS | F | Significance-F | |
|---|---|---|---|---|---|
| Regression analysis | 4 | 203.5507 | 50.88768 | 41.46921 | |
| Residual | 8 | 9.816958 | 1.22712 | ||
| Total | 12 | 213.3677 |
| No. | Braking Safety Evaluation Model | Side Deflection Safety Evaluation Model |
|---|---|---|
| Rut 1 # | ||
| Rut 2 # | T= | |
| Rut 3 # |
| 1 h Rainfall Intensity | Critical Safe Speed (km/h) | ||
|---|---|---|---|
| (mm/h) | Rut 1 # | Rut 2 # | Rut 3 # |
| 2.5 | 124.3 | 70.6 | 24.9 |
| 8 | 122.3 | 68.6 | 22.8 |
| 16 | 119.3 | 65.7 | 20.0 |
| 30 | 114.2 | 60.6 | 14.9 |
| 50 | 107.0 | 63.5 | 7.6 |
| 80 | 96.0 | 42.4 | - |
| 100 | 88.7 | 35.1 | - |
| 120 | 81.5 | 27.8 | - |
Disclaimer/Publisher’s Note: The statements, opinions and data contained in all publications are solely those of the individual author(s) and contributor(s) and not of MDPI and/or the editor(s). MDPI and/or the editor(s) disclaim responsibility for any injury to people or property resulting from any ideas, methods, instructions or products referred to in the content. |
© 2025 by the authors. Licensee MDPI, Basel, Switzerland. This article is an open access article distributed under the terms and conditions of the Creative Commons Attribution (CC BY) license (https://creativecommons.org/licenses/by/4.0/).
Share and Cite
Li, Y.; Yan, J. Simulation Analysis of Driving Safety Based on Three-Dimensional Morphology of Water-Filled Ruts on Asphalt Road. Appl. Sci. 2025, 15, 2770. https://doi.org/10.3390/app15052770
Li Y, Yan J. Simulation Analysis of Driving Safety Based on Three-Dimensional Morphology of Water-Filled Ruts on Asphalt Road. Applied Sciences. 2025; 15(5):2770. https://doi.org/10.3390/app15052770
Chicago/Turabian StyleLi, Yi, and Jiao Yan. 2025. "Simulation Analysis of Driving Safety Based on Three-Dimensional Morphology of Water-Filled Ruts on Asphalt Road" Applied Sciences 15, no. 5: 2770. https://doi.org/10.3390/app15052770
APA StyleLi, Y., & Yan, J. (2025). Simulation Analysis of Driving Safety Based on Three-Dimensional Morphology of Water-Filled Ruts on Asphalt Road. Applied Sciences, 15(5), 2770. https://doi.org/10.3390/app15052770