1. Introduction
Recently, the wide construction of hydropower stations in river basins, including sluices and dams, has disrupted river continuity [
1]. This has significantly impacted the habitats of aquatic species, and some species relying on upstream migration are facing the threat of extinction [
2]. Fishways are designed to assist migratory fish in overcoming the abovementioned challenges, thereby ensuring the ecological balance within the river basin. Detecting aquatic life in migration channels is crucial for protecting the natural behavior of fish [
3], and fish detection is a critical step [
4]. However, the complexity of deploying models onsite in fishways is high, and images with turbid sediment are difficult to detect. To overcome these limitations, more efficient and accurate detection methods are needed.
With the development of deep learning technology, significant progress has been made in object detection for vessels on the water. Tang et al. [
5] proposed a PEGNet detection model to address issues such as missed detections and false positives in dense watercraft scenarios, with experimental results showing its superior performance. Ieracitano et al. [
6] introduced HO-ShipNet, a custom convolutional neural network (CNN), and experimental results demonstrated its excellent detection performance. This provides a solid foundation for fish detection in underwater environments and can be used to address many challenges associated with underwater images, including variations in lighting, water turbidity, and the diversity of marine species’ appearances [
7]. Huang et al. [
8] enhanced the effectiveness of Faster R-CNN for detecting and recognizing marine organisms by utilizing data augmentation techniques. Zeng et al. [
9] integrated Faster R-CNN with an adversarial occlusion network to achieve underwater object detection and overcome the challenges posed by occlusions in underwater environments. Similarly, Song et al. [
10] improved underwater object detection accuracy by reweighting R-CNN samples based on errors from the Region Proposal Network in Boosting R-CNN. To enhance the performance of Faster R-CNN in fish detection, Dulhare et al. [
11] applied data augmentation techniques to improve underwater image quality. To focus on the morphological feature measurement of fish, Han et al. [
12] designed the Mask_LaC R-CNN model, which offers stronger object segmentation capabilities compared to Faster R-CNN. Zhao et al. [
13] developed Composited FishNet for detecting fish based on low-quality underwater videos. Conrady et al. [
14] used Mask R-CNN for automated detection and classification of southern African Roman seabreams. Feng et al. [
15] developed Faster R-CNN for shellfish recognition through an enhanced deep-learning framework, demonstrating the flexibility of Faster R-CNN in classifying various underwater organisms. Md et al. [
16] and Kislu et al. [
17] applied Faster R-CNN for seagrass detection, while Noman et al. incorporated NASNet further to refine detection accuracy. Song et al. [
18] integrated MSRCR with Mask R-CNN to recognize underwater creatures from small sample datasets.
In addition to Faster R-CNN and Mask R-CNN, YOLO is also widely used to accomplish fish detection tasks. Joseph et al. [
19] first proposed YOLO for real-time object detection, thereby activating the application for underwater object detection. Li et al. [
20] adapted YOLO for real-time detection of underwater fish by incorporating transfer learning. Liu et al. [
21] utilized YOLO v4 to study fish locomotion in aquaponic systems. In addition, Eldin et al. [
22] developed Msr-YOLO to improve fish detection and tracking in fish farms, addressing challenges specific to aquaculture environments. Abdullah et al. [
23] proposed YOLO-Fish for detecting fish in realistic underwater settings, which underscores the ongoing refinement of YOLO models. Zheng et al. [
24] applied an improved YOLO v4 model for fish object detection, contributing to the enhancement of YOLO’s performance in aquatic contexts. Li et al. [
25] combined YOLOv5s with TensorRT deployment for monitoring fish passage. Qin et al. [
26] introduced YOLO8-FASG for fish detection and equipped it with underwater robotic systems.
The above research has greatly developed the techniques of fish detection, but it still faces several challenges. First, traditional fishway fish detection heavily relies on manual labor, which requires an intelligent approach to reduce costs and improve management efficiency. Second, the complex underwater environment in fishways next to hydropower stations leads to low image contrast and insufficient color information, weakening the texture and contour details of fish, which results in the fish detection algorithm’s accuracy not meeting the demands of the fishway environment. Finally, due to the limited computational capacity of onsite equipment in fishways, standard feature fusion modules contain many bottleneck blocks, increasing computational consumption and limiting the convergence speed of model training. Moreover, the numerous sampling operations in standard object detection algorithms add to computational complexity. Since fishway detection devices have limited space, the detection algorithms must be embedded into underwater cameras. Therefore, the detection algorithms need to be more lightweight to meet the demands of fish detection tasks in fishways. To address these issues, we propose a fish detection algorithm for fish passage detection in fishways. The key contributions are summarized as follows.
- (1).
Proposing a C2f-Faster-EMA module by introducing the C2f module, FasterNet-Block, and efficient multi-scale EMA attention mechanism, delivering the improvement of feature extraction and operational efficiency for fish detection. By integrating the RepBlock and BiFusion modules, multi-scale features are captured, providing a more accurate and robust solution for detecting diverse target classes.
- (2).
Constructing a freshwater fish dataset and evaluating the performance of existing loss functions on fish detection, demonstrating the satisfactory capability of the proposed model compared to the state-of-the-art methods.
- (3).
In practical applications at a designated hydropower station’s fishway, detection devices were installed, and the proposed method was deployed in underwater cameras. The system was trained using data from four fish species passing through the fishway, followed by fish target detection over some time. The results show that the device can stably and accurately detect fish, performing well in frame-by-frame capture and detection.
This paper is organized as follows.
Section 2 introduces the proposed fish detection model.
Section 3 illustrates the experiments conducted and the results obtained.
Section 4 covers the practical application in the field and demonstrates the application results.
Section 5 summarizes the paper and concludes the future direction.
2. Materials and Methods
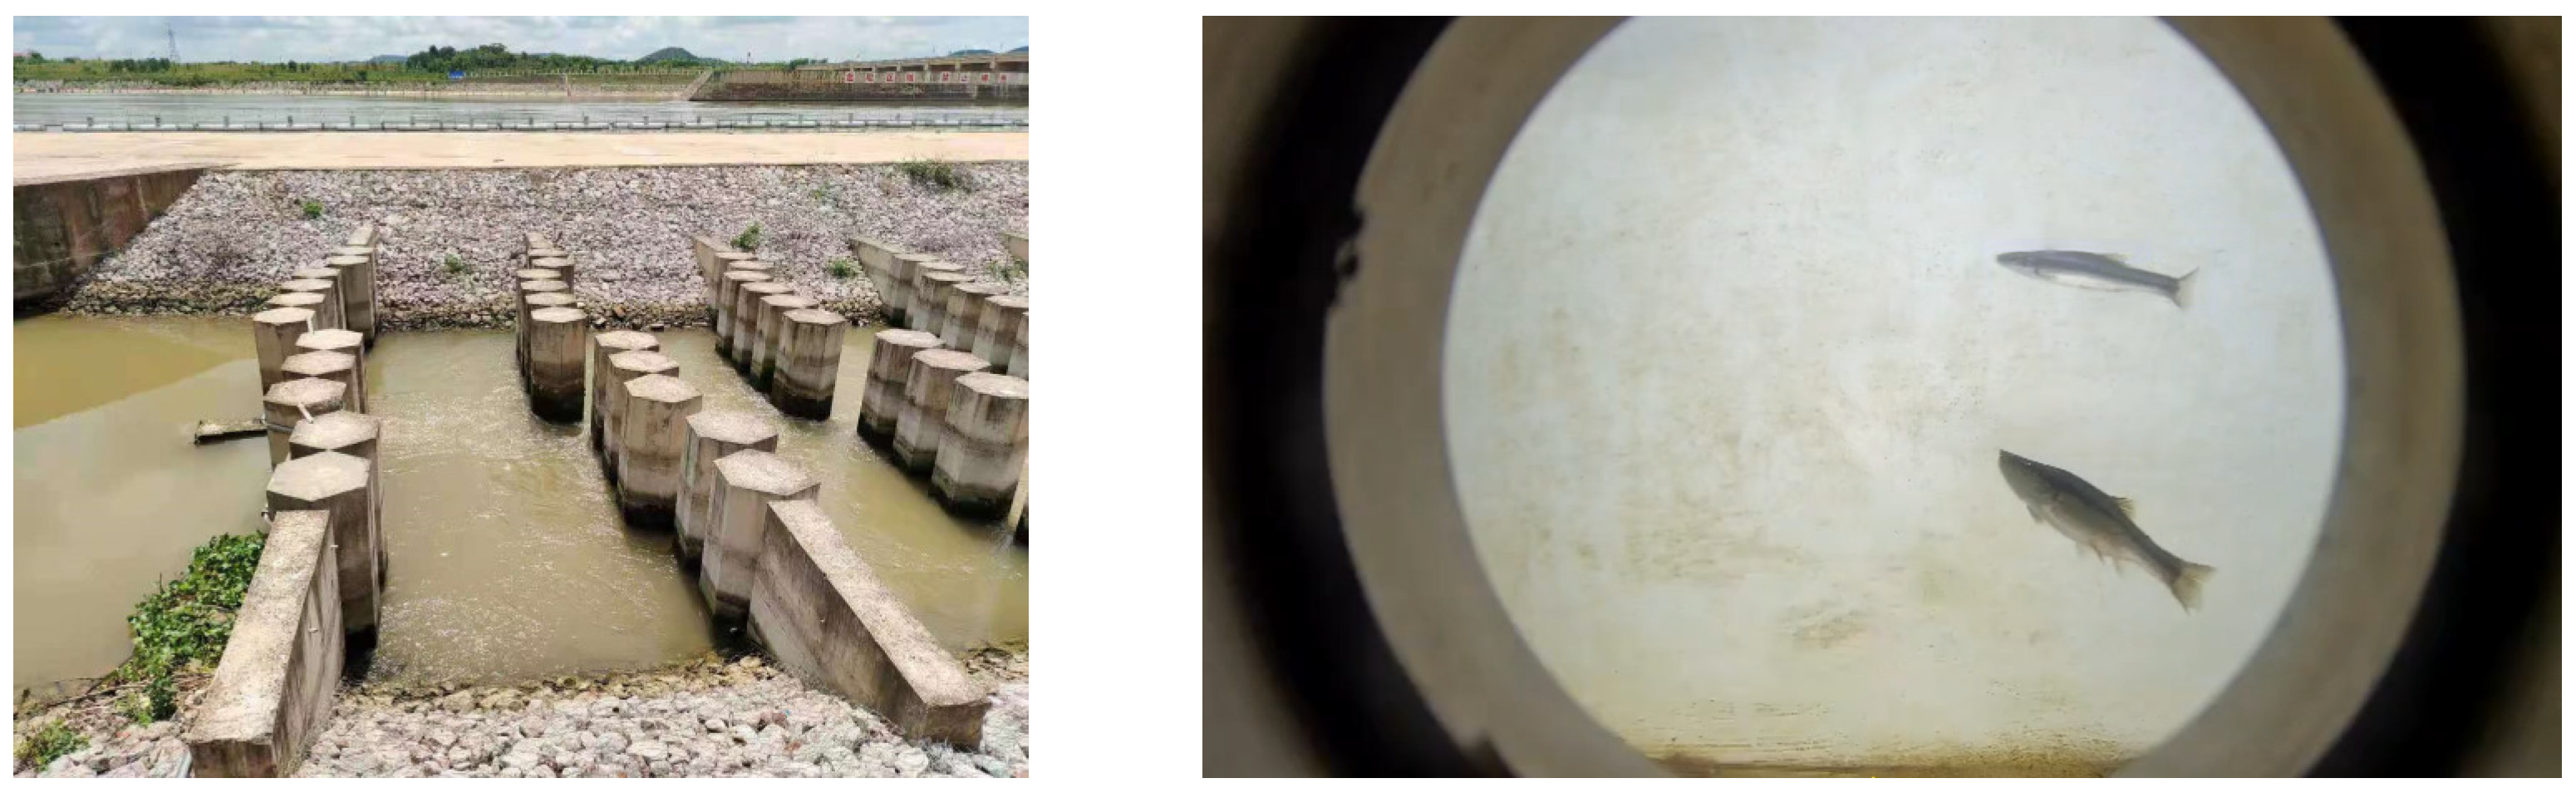
Traditional fishway fish detection methods are time-consuming, incur high labor costs, and are not suitable for fishway environments. The water quality in fishway environments is often turbid and unclear, as shown in
Figure 1. The use of deep learning methods can effectively meet the fishway fish detection task, enabling automated fishway fish detection and intelligent management of fishways.
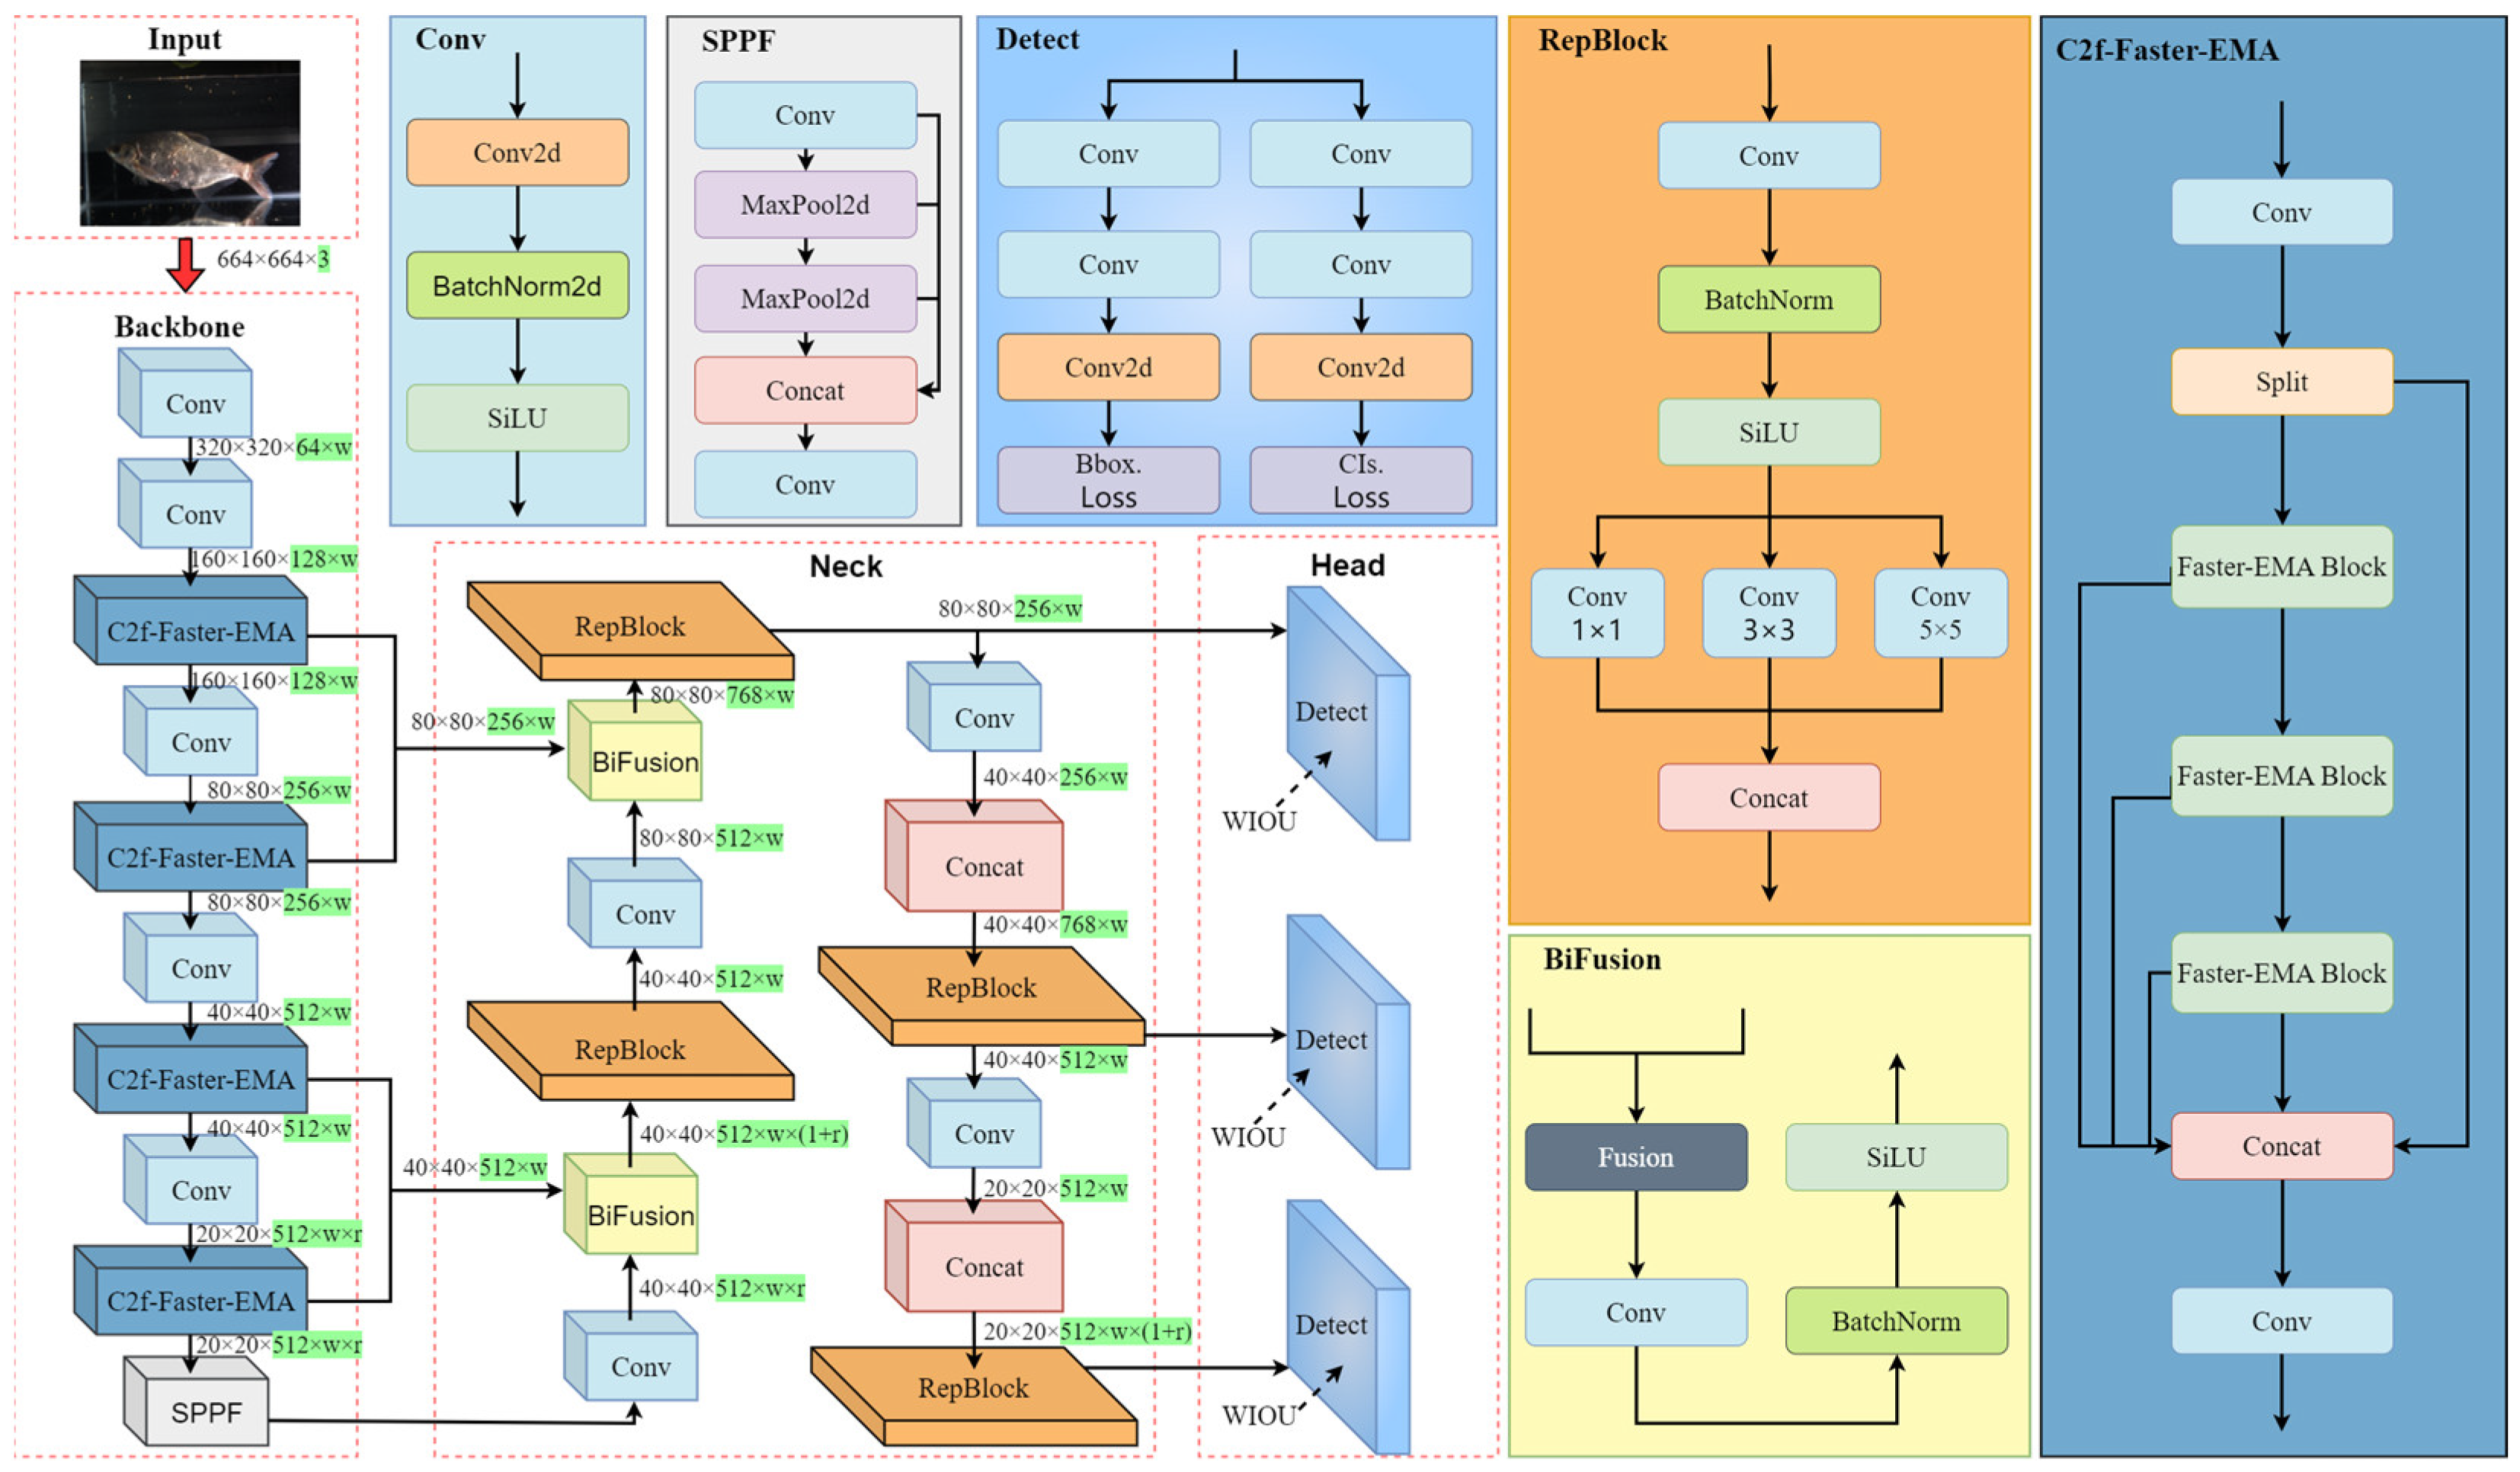
This paper proposes a novel, more intelligent fish detection model for fishway environments to address the various challenges in fish detection within fishways. First, the model’s detection performance is comprehensively tested through fish dataset collection and classification in a laboratory setting. Next, the proposed model is compared with other detection models. Finally, the model is applied to real-world fishway environments for field testing. The specific structure of the model is outlined below. As shown in
Figure 2, the backbone is responsible for extracting low-level and mid-level features of the fish, such as contours, colors, and textures, and the Neck is designed to merge multi-level features by optimizing the feature pyramid. Finally, the detection head takes the multi-scale features to detect fish from the low-quality images captured under poor lighting conditions. The processes are detailed in the following subsections.
2.1. Bidirectional Cross-Scale Feature Fusion in Backbone
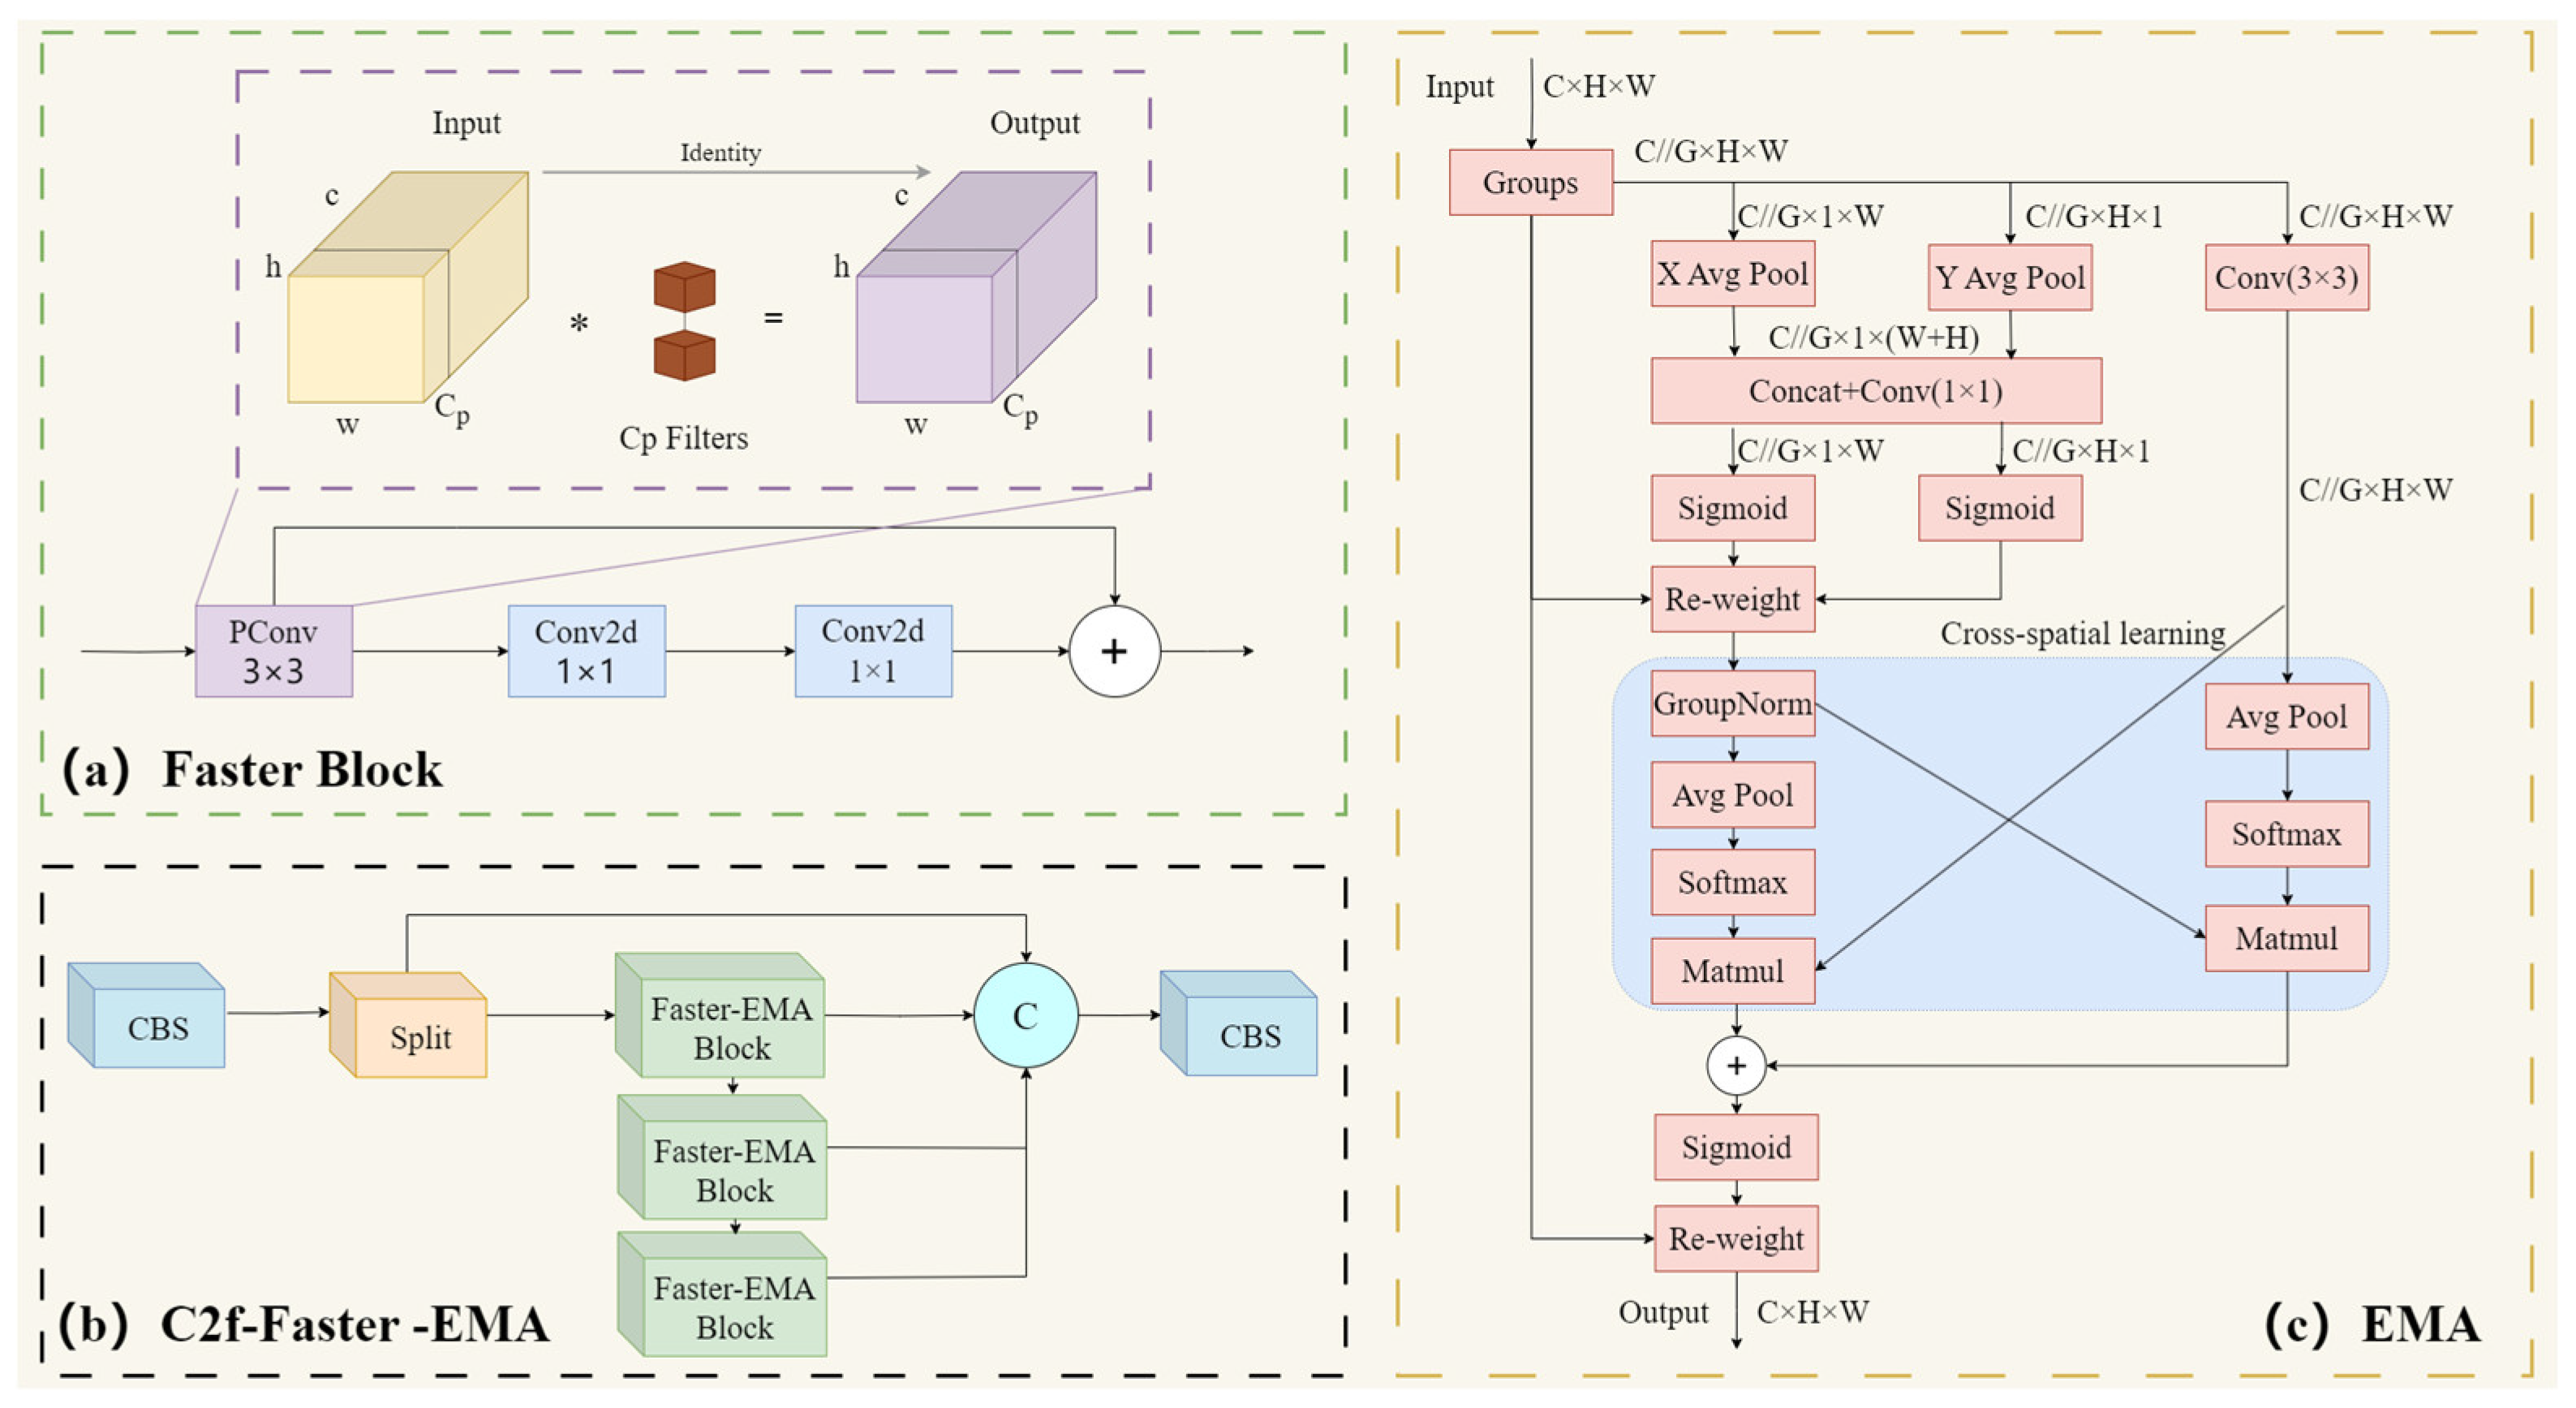
The backbone is engineered for efficient and high-performance feature extraction, in which the Cross Stage Partial Fusion (C2f) module offers strong feature extraction and fusion capabilities by utilizing partial connections and multiple bottleneck layers. However, its performance may be hindered by the challenges of low-contrast imagery, complex backgrounds, and small object detection. In this paper, we propose a C2f-Faster-EMA module by integrating C2f, EMA [
27], and Faster Block [
28] modules to enhance multi-scale feature fusion, global attention, and computational efficiency in the detection process, as shown in
Figure 3b.
The approach is as follows. Inspired by FasterNet, we integrate Partial Convolution (
PConv) with C2f, aiming to achieve a faster network and reduce floating-point computations.
Figure 3a illustrates the basic principle of
PConv, which applies a conventional convolution on a portion of the input channels for spatial feature extraction while keeping the remaining channels unchanged. The computational cost of conventional convolution is denoted as
, while the computational cost of
PConv is denoted as
. In the case of a classic offset ratio of
, the floating-point operations of
PConv are only
of those of full convolution. This significantly reduces computational overhead while improving computational efficiency. By treating the first or last continuous channel as a representative of the entire feature map for computation, memory access is further minimized.
Memory access count of
Conv, as illustrated in Equation (1)
Memory access count of
PConv, as illustrated in Equation (2)
With the offset ratio remaining unchanged, PConv accesses memory as many times as conventional convolution during convolution calculations. By using PConv in C2f-Faster, the advantages of parallel computation can be leveraged to accelerate the training and inference processes of the model, thereby improving its efficiency.
In addition, to more effectively focus on important feature information and improve object detection accuracy, we have added a multi-scale feature extraction module, EMA, based on the above. EMA utilizes three parallel paths to extract attention–weight descriptors from the grouped feature maps, as shown in
Figure 3c. The input tensor shape is defined as
where the first two parallel paths are 1 × 1 branches, and the third parallel path is a 3 × 3 branch. To capture the dependencies among all channels and reduce computational load, a one-dimensional global average pooling operation is applied in the horizontal or vertical dimension direction in the 1 × 1 branch, represented by Equations (3) and (4):
where
is the number of channels,
and
are the spatial dimensions of the input features.
Feature extraction is performed without dimensionality reduction, followed by fitting the 2D binomial distribution after linear convolution using two nonlinear Sigmoid functions. The channel attention maps within each group are aggregated through multiplication, achieving different cross-channel interaction features between the two parallel paths. On the other path, a 3 × 3 convolution captures local cross-channel interactions, expanding the feature space.
The added EMA attention mechanism is located at the deepest part of the model. By integrating the EMA attention mechanism into the Faster Block structure, we obtain the Faster-EMA Block, which is then added to C2f and named C2f-Faster-EMA.
2.2. Bidirectional Cross-Scale Feature Fusion
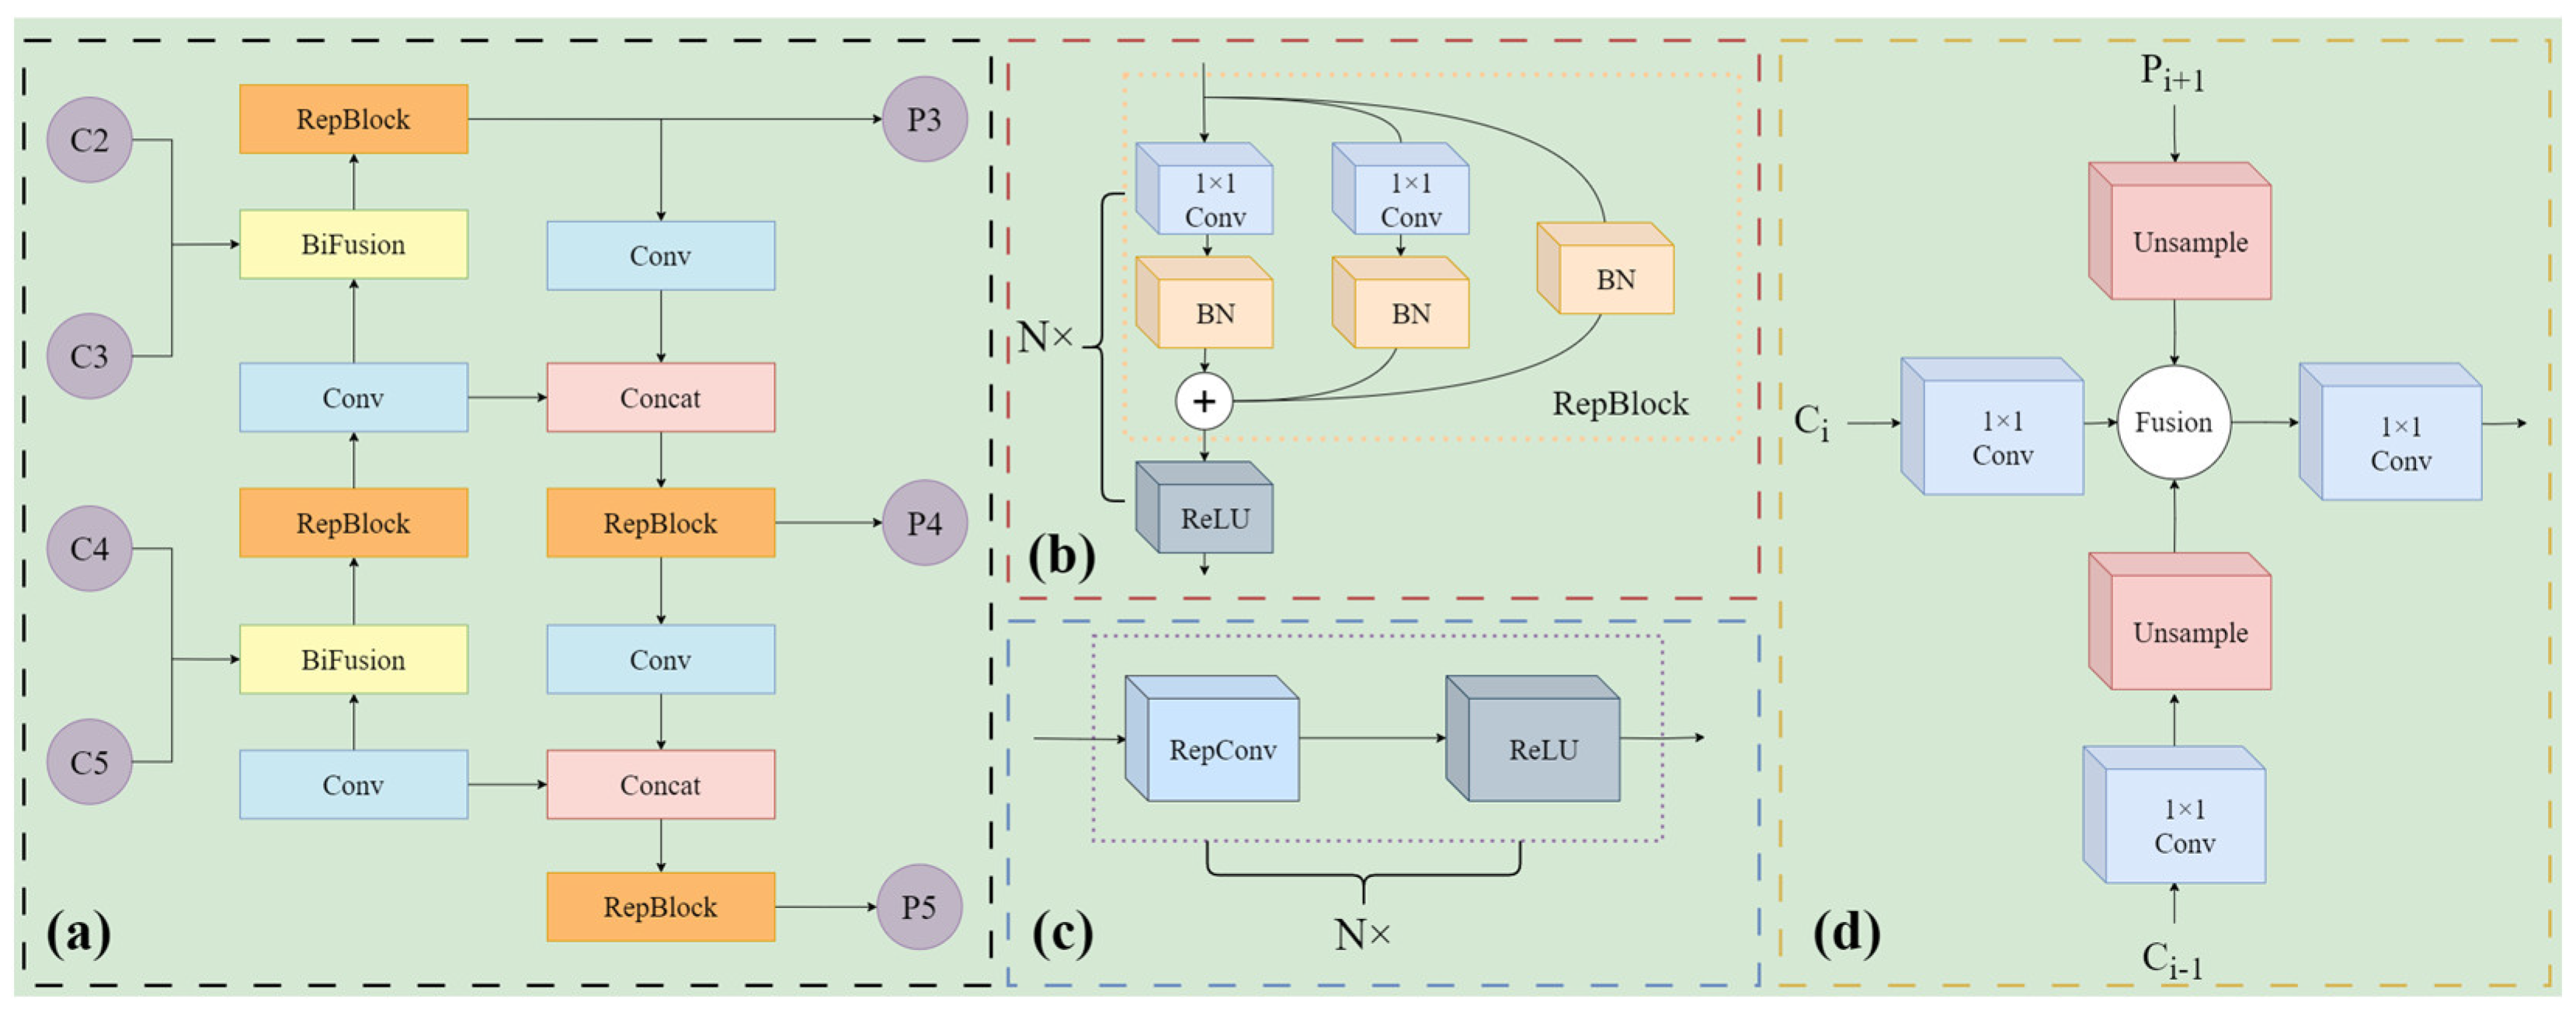
The Path Aggregation Network-Feature Pyramid Network has certain limitations in underwater fish detection tasks: the variations in lighting and noise in underwater environments can affect feature extraction, and high computational complexity could impact real-time detection capability. In this paper, as shown in
Figure 4a, integrating RepBi-PAN as the neck component in underwater fish detection provides significant advantages by enhancing multi-scale feature fusion through bidirectional connections and top-down flow:
Features from higher layers are passed down to lower layers and fused with the lower-layer features, where represents an upsample operation.
Features from lower layers are passed upward to higher layers, where represents a downsampling operation.
The connections improve detection accuracy for fish of varying sizes. Its ability to transmit features bidirectionally helps preserve fine details and rich semantic information. After bidirectional connections, feature fusion is applied. Let the weights for fusion be denoted by
, which controls the importance of each scale. The final fused feature map
at scale
is:
where
is a learnable parameter that dynamically adjusts the importance of the top-down and bottom-up features during training. The final output feature map
is the aggregation of the fused feature maps across all scales:
This output is passed to subsequent layers of the network for further processing, such as detection. Additionally, RepBi-PAN maintains computational efficiency, ensuring that enhanced detection performance is achieved without excessive computational overhead, thus supporting real-time applications in challenging underwater environments.
2.3. Loss Function
Loss functions are crucial for model detection accuracy. The CIoU [
29] loss function is used for bounding box regression, as described by the formula in Equation (9). The Intersection over Union (IoU) measures the intersection ratio to the union of the predicted and ground truth boxes. This formula,
represents the Euclidean distance between the centers of the predicted and ground truth boxes,
is the diagonal length of the smallest enclosing rectangle that contains both the predicted and ground truth boxes,
and
denotes the height of the predicted and ground truth boxes, respectively, while
and
represent their widths.
The CIoU loss function presents several limitations in the context of fishway fish detection. It introduces additional calculations for diagonal distance and correction factors, increasing computational complexity and potentially prolonging training and inference time. To address the limitations of CIoU in fishway detection tasks, this study uses the WIoU [
30] loss function as a replacement. The formula for the WIoU loss function is given in Equation (10), where
and
are hyperparameters that can be adjusted based on different models,
represents the monotonic focus coefficient,
is the non-monotonic focus factor, and
denotes outliers.
The WIoU loss function adds a focusing coefficient to the attention-based predicted box loss. The additional computational cost mainly comes from the calculation of the focusing coefficient and the mean statistics of the IoU loss. However, it is faster because it does not involve the calculation of aspect ratios. Furthermore, it performs well in small object detection, enabling more accurate evaluation of small object detection results and reducing missed and false detections. This is particularly important for multi-scale fishway fish detection tasks.
3. Results and Analysis
3.1. Experimental Environment
The experiments were conducted on a Windows 10-based computer equipped with an Intel® i5-12490F CPU and an NVIDIA GeForce RTX4060 with 16 GB of memory GPU. The PyCharm software platform was utilized to carry out the experiments, employing the Python 3.11 deep learning framework for training purposes. During training, 100 epochs were set, with a batch size of 16. To balance convergence speed and stability to some extent, the initial learning rate was set to 0.01. To reduce computational overhead, the optimizer used was SGD. The input image size was uniformly scaled to 640 × 640.
3.2. Experimental Dataset
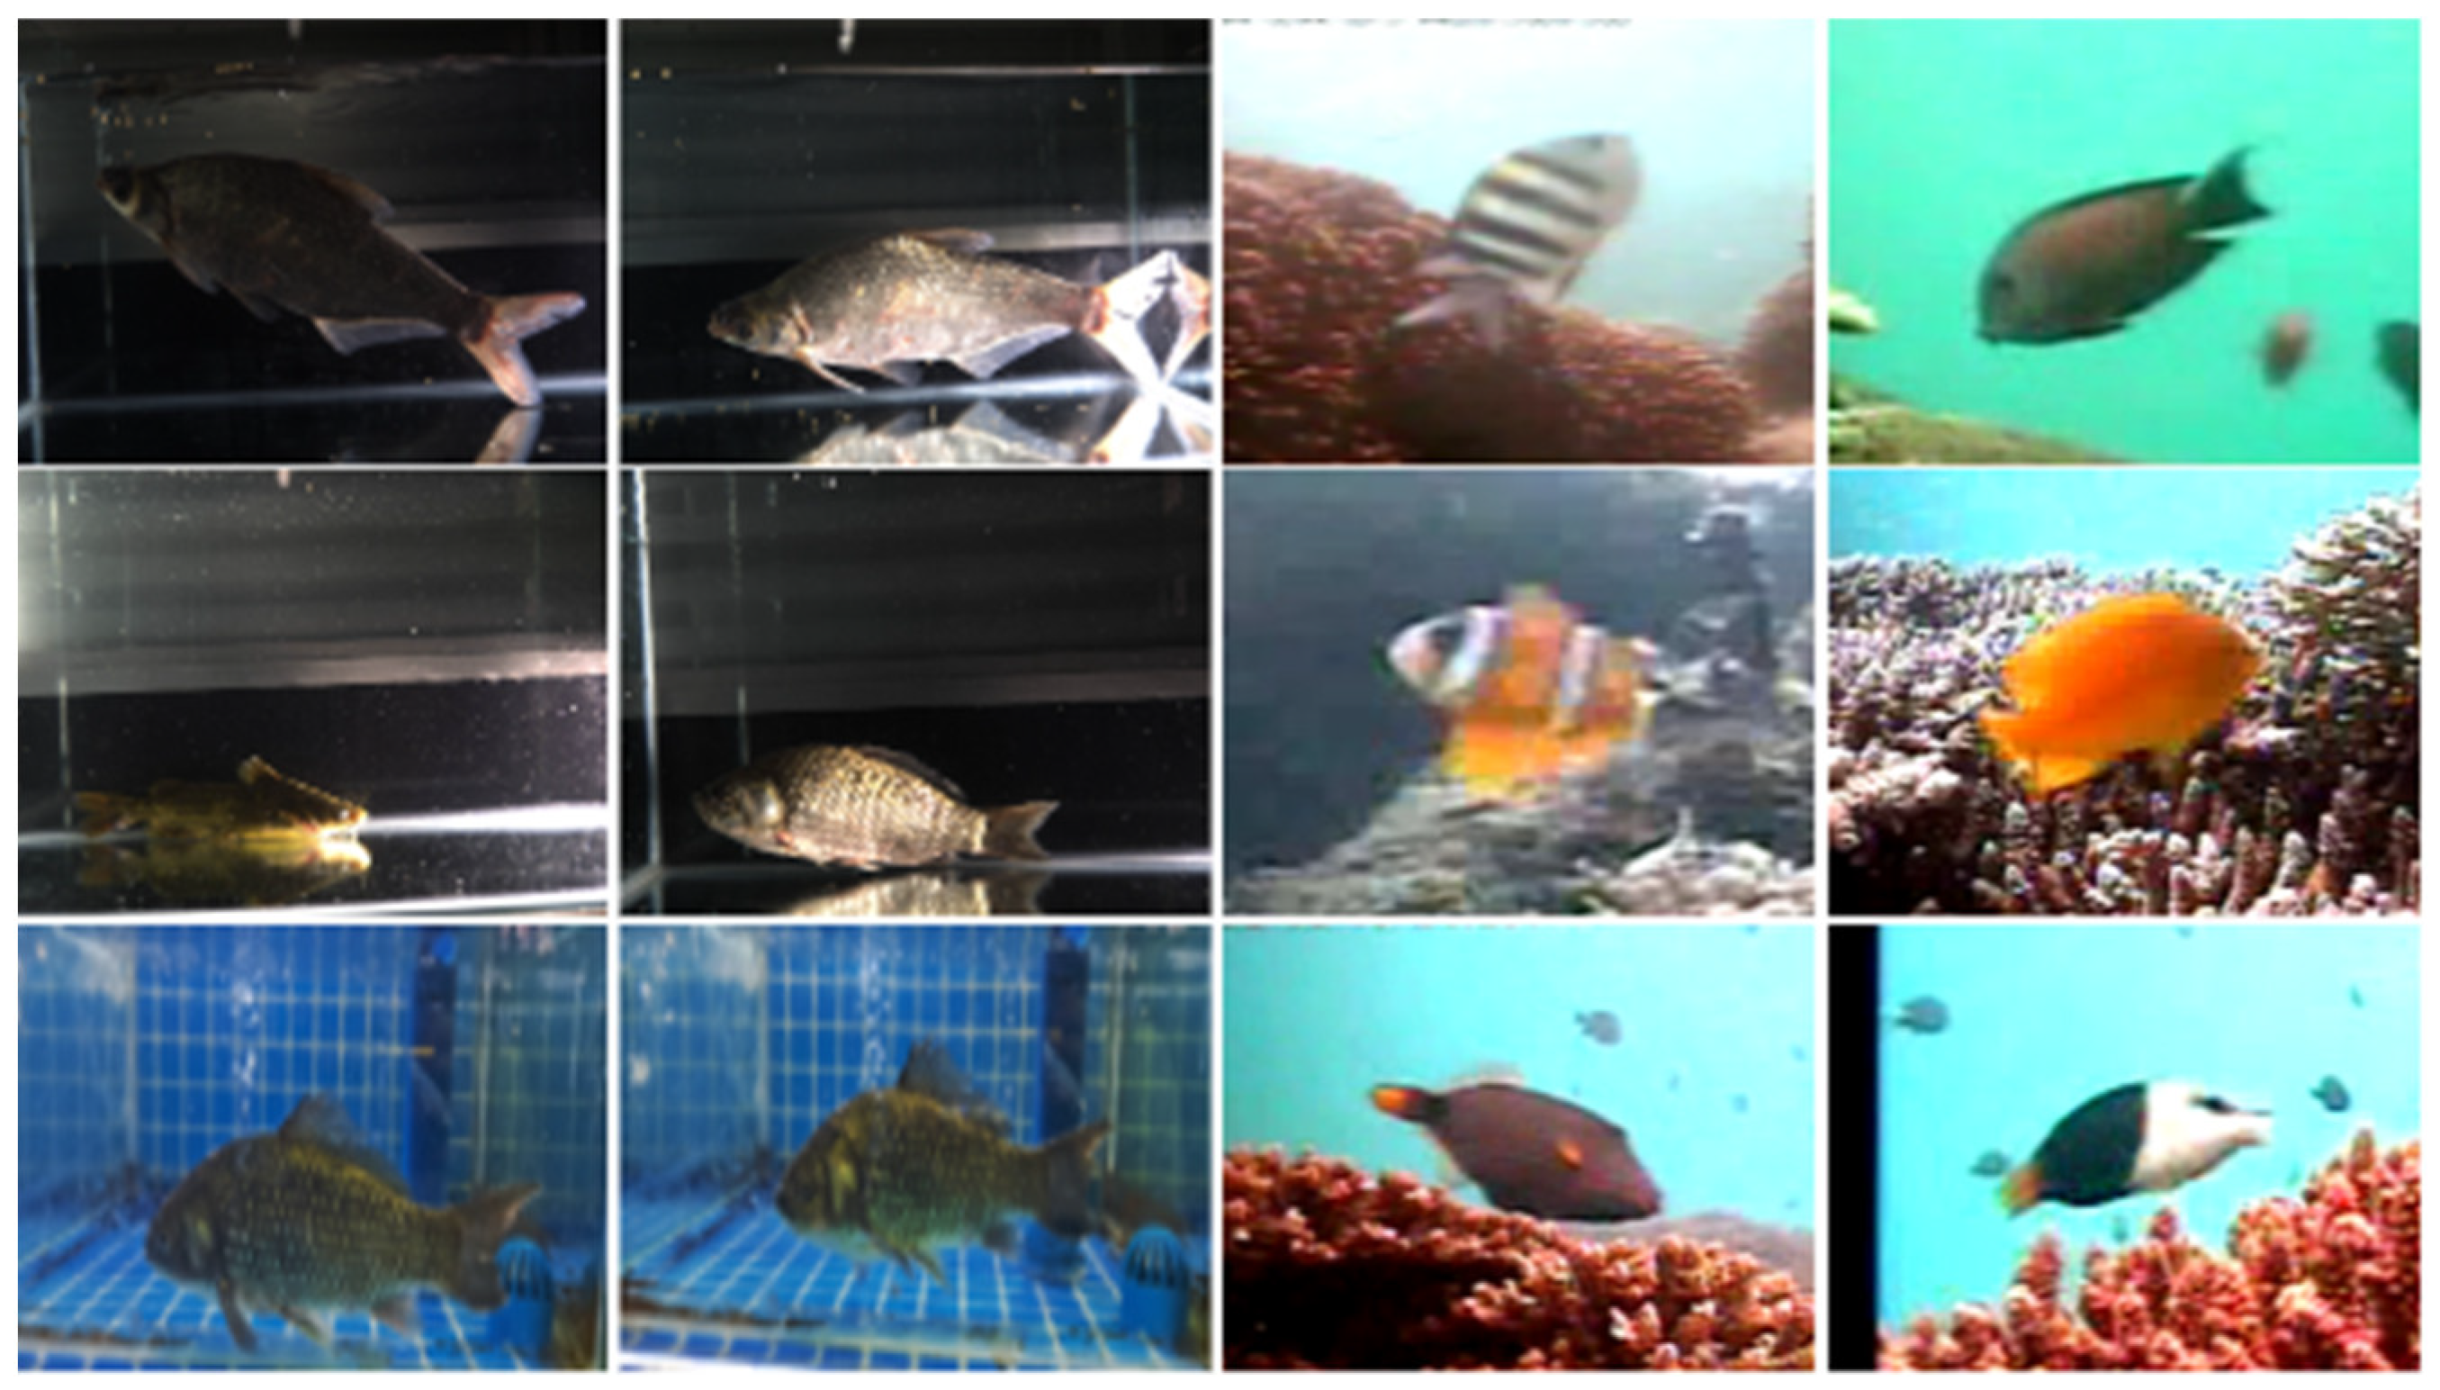
The Fish26 dataset is a compilation of the Fish4knowledge fish datasets [
31] and images of various fish species collected in a laboratory environment, carefully organized to encompass various underwater scenarios. The dataset includes 11,204 images in .jpg format, covering 26 fish species. These species span different categories, including freshwater fish, marine fish, benthic fish, and pelagic fish. A portion of the Fish26 dataset is shown in
Figure 5.
The Fish4knowledge dataset contains 23 fish species captured from underwater videos along the coast of Taiwan. It is an imbalanced dataset, with the number of images per species ranging from 25 to 12,112. From these 23 species, we selected 21 species and collected approximately 400 images per species. Additionally, we included 5 fish species, including bighead carp, tilapia, yellow-bone fish, crucian carp, and silver carp, which were collected in a laboratory environment. For each of these species, we collected 100 images and applied image augmentation techniques, such as rotation and scaling, to increase the number of images to 400 per species, forming the Fish26 dataset. This dataset supplements common freshwater fish datasets and covers a variety of species.
3.3. Experimental Metrics
This study uses mean Average Precision (IoU = 0.5) (mAP@0.5), Precision (P), and Reca® (R) to assess the model’s training accuracy. Additionally, model evaluation metrics include the number of parameters and giga floating-point operations per second (GFLOPs).
3.4. Comparison Experiments
To verify the effectiveness of the WIoU loss function, this study analyzes the performance differences between WIoU and the shape intersection over union (SIoU), efficient intersection over union (EIoU), and generalized intersection over union (GIoU) loss functions. Each of these loss functions was modified in the YOLOv8 n model without any other changes. As shown in the loss function experiment results in
Table 1, SIoU and EIoU both lead to a decrease in precision (P) and mean average precision (mAP@0.5) of the original YOLOv8 n model. GIoU decreases the precision (P) but improves the mAP@0.5. In contrast, YOLOv8 n + WIoU achieves the highest mAP@0.5.
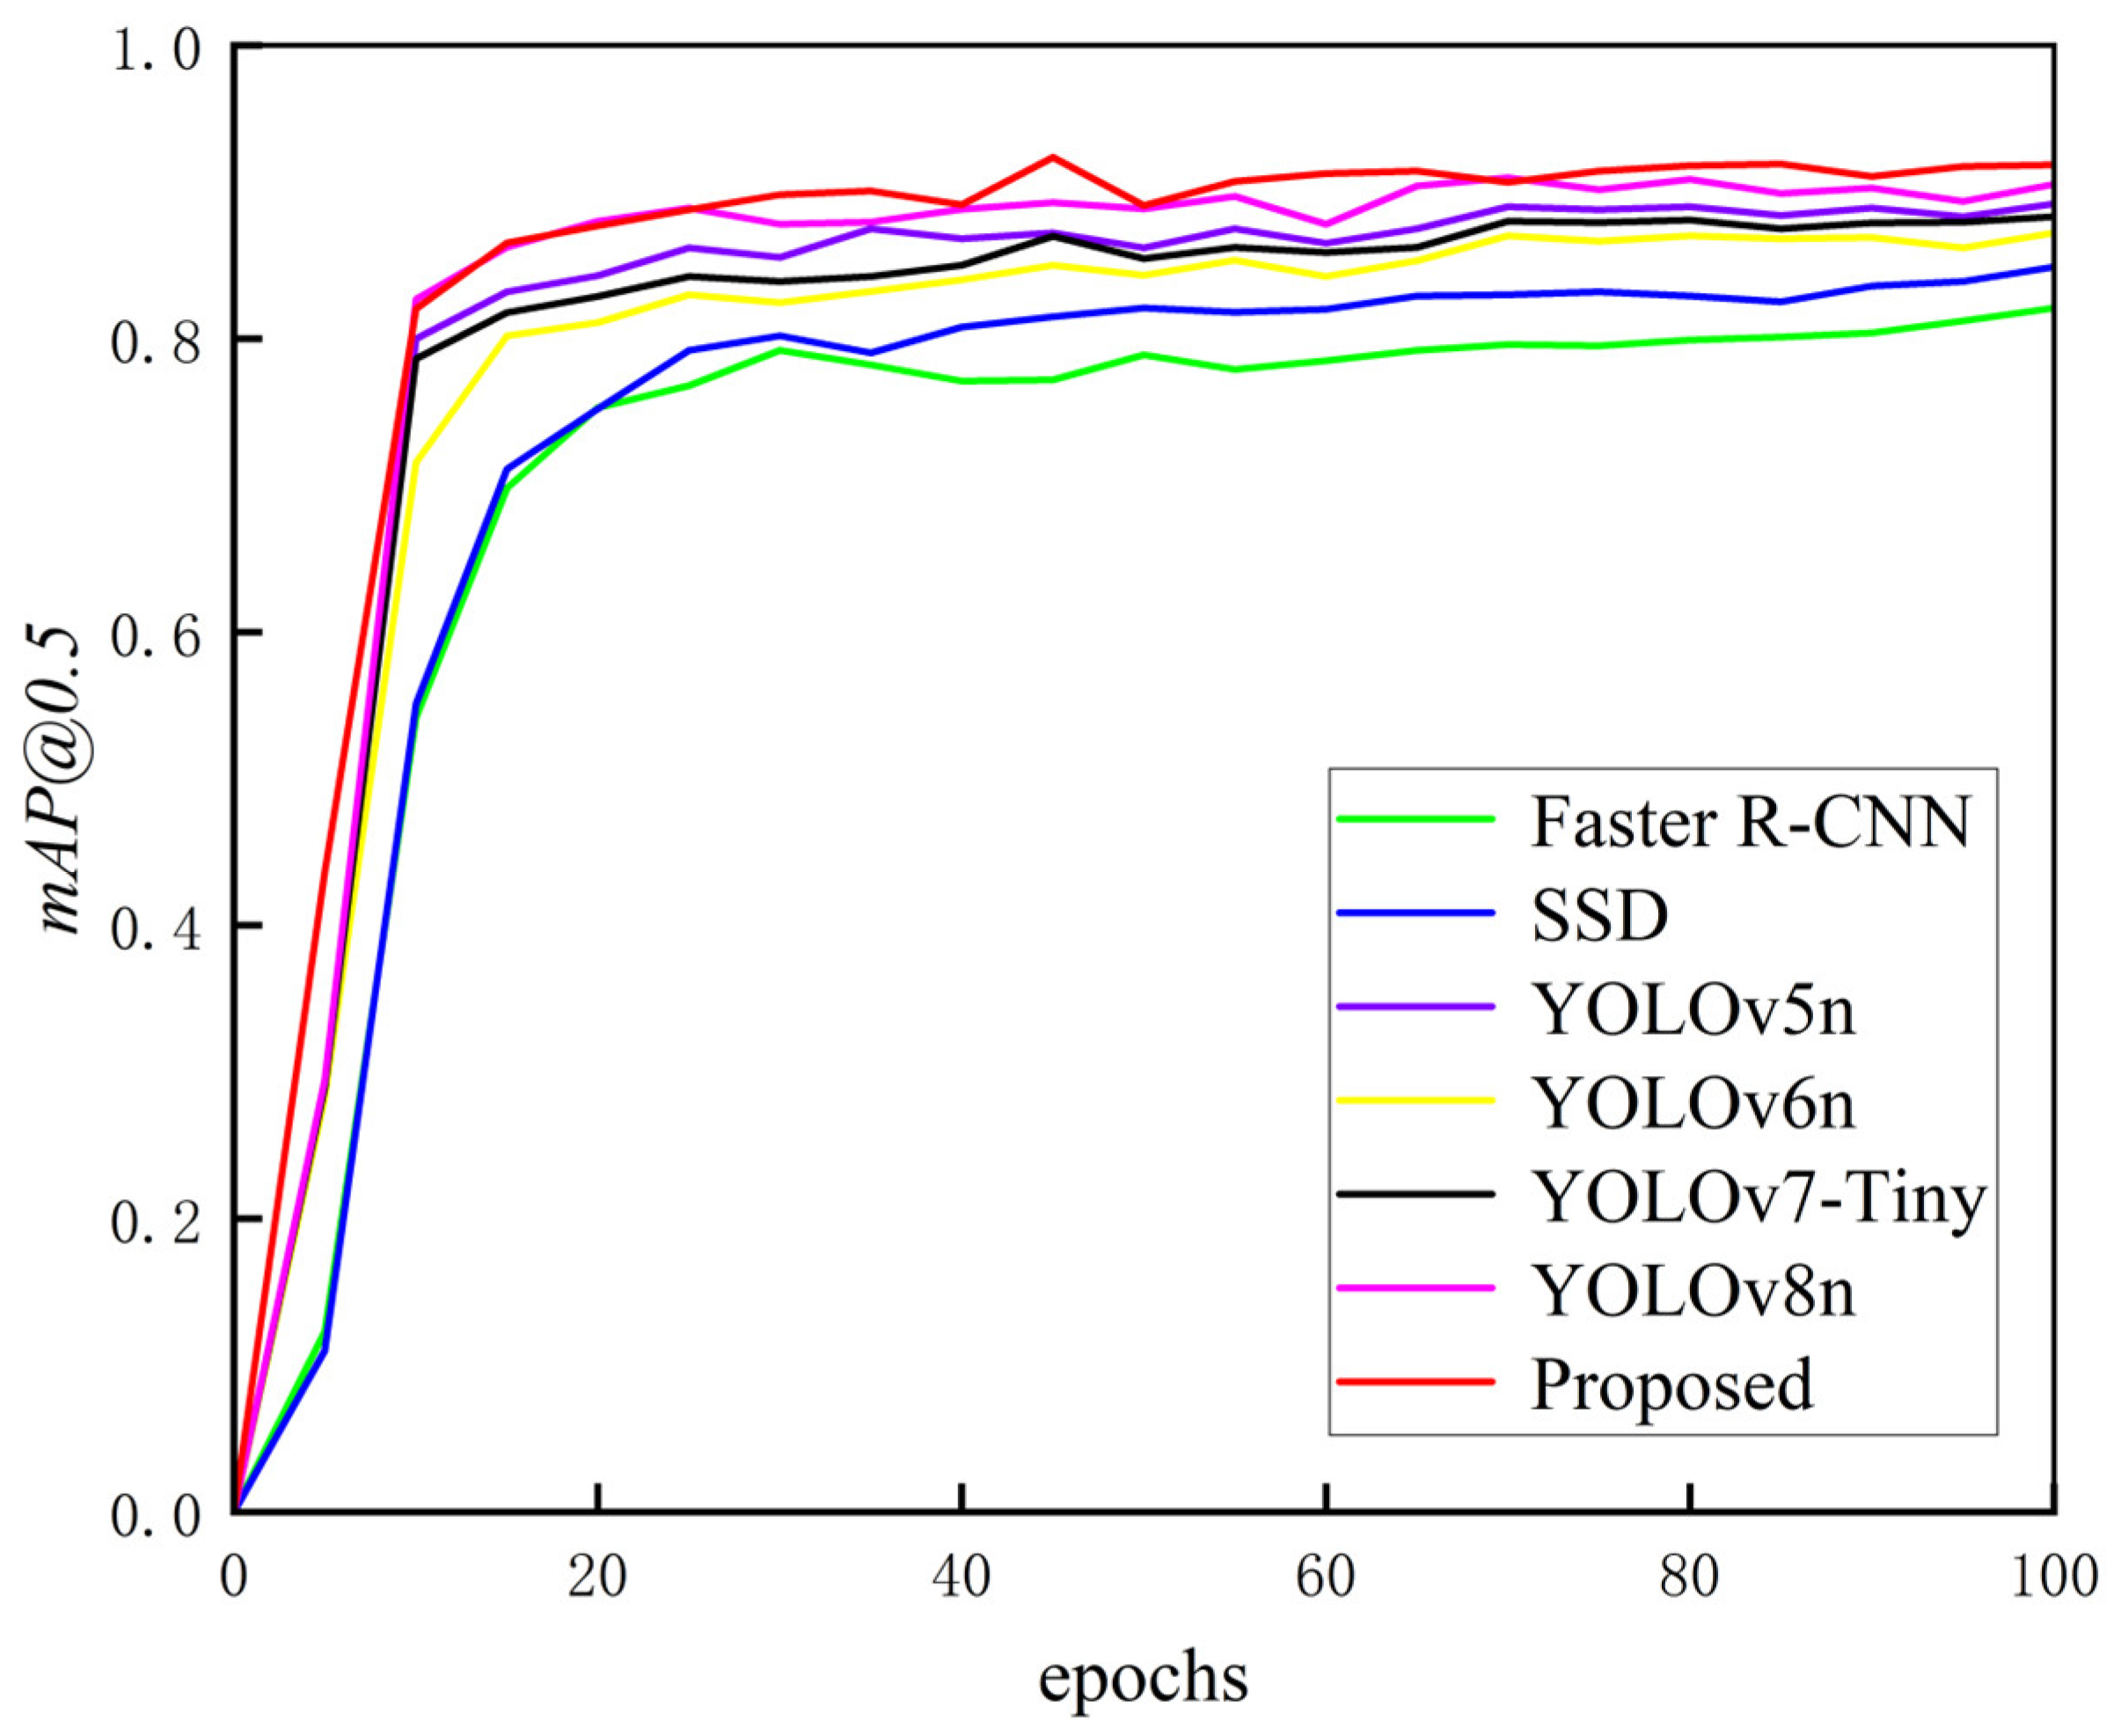
To verify the superior detection performance of the proposed method, a comparative analysis was conducted on the Fish26 dataset. The proposed method was compared with current mainstream object detection algorithms such as the YOLO series, SSD, and Faster R-CNN. The experimental results are presented in
Table 2. The results indicate that both the Faster R-CNN and SSD models exhibit lower detection accuracy and speed, making them unsuitable for fish detection tasks in underwater environments. While YOLOv5n, YOLOv6n, and YOLOv7-Tiny models benefit from having fewer model parameters and lower computational complexity, their detection accuracy is lower compared to the YOLOv8n model. In contrast, the proposed method outperforms the YOLOv8n in both recall and precision, with improved detection accuracy and speed. Specifically, the mAP@0.5 of the proposed method is 1.7% higher than that of the YOLOv8n model, while the model’s parameter count has been reduced by 24%, and its computational load is only 6.2G. This balance of detection accuracy, speed, and lightweight design makes the proposed method better suited for complex underwater fish detection tasks. Compared to mainstream object detection models, the proposed method model demonstrates superior detection performance, as illustrated in
Figure 6.
3.5. Ablation Experiment
To verify the effectiveness of the enhanced modules in the proposed method, ablation experiments were conducted on the Fish26 dataset. Using the YOLOv8n network as the baseline, each improvement module was sequentially added to the network. The impact of different modules on the final object detection performance was assessed through ablation experiments. The results of these experiments are presented in
Table 3. Group 1 represents the model YOLOv8n, while Groups 2 to 4 incorporate individual improvements to the baseline model. The results indicate that replacing the C2f module in the backbone network with the C2f-Faster-EMA module increases mAP@0.5 by 1.5%, reduces model parameters by 8.4%, and decreases computational cost. The modifications make the model more lightweight and improve feature extraction efficiency.
After using RepBiPAN to improve the neck component, although the mAP@0.5 showed only a slight increase, model parameters decreased by 15.9%, and the computation speed improved, demonstrating the effectiveness of the RepBiPAN-enhanced Neck. The WIoU loss function further boosts detection accuracy by intelligently adjusting the IoU threshold, effectively reducing the negative impact of low-quality samples on model performance.
Groups 5 to 7, which incorporate two different modules each, provide further evidence of the effectiveness of each module. Group 8 represents the model with all modules applied. In this configuration, the C2f module in the backbone network is replaced by the C2f-Faster-EMA module, the Neck is improved with RepBiPAN, and CIoU is replaced by Wise-IoU as the bounding box regression loss function. This combination not only maintains the model’s lightweight nature but also enhances detection accuracy and recall.
Based on the validation of the effectiveness and advancement of the proposed method improvement strategy, the model was trained on a prepared dataset, with the results shown in
Figure 7.
3.6. Discussion
The algorithm proposed in this paper not only focuses on accuracy but also on lightweight design. The aim of this study is to improve the accuracy and lightweight nature of object detection algorithms. To achieve this, we compared our improved algorithm with other commonly used loss functions and conducted both qualitative and quantitative comparisons with various object detection algorithms. In addition, we performed ablation experiments on the proposed algorithm to compare its performance and verify its high accuracy and robustness. The results clearly show that the algorithm exhibits high accuracy and robustness when detecting different fish species. However, since the algorithm needs to be applied to actual engineering projects, its performance in real fishway environments requires further observation. Therefore, field tests were conducted in a designated fishway in subsequent experiments.
4. Application
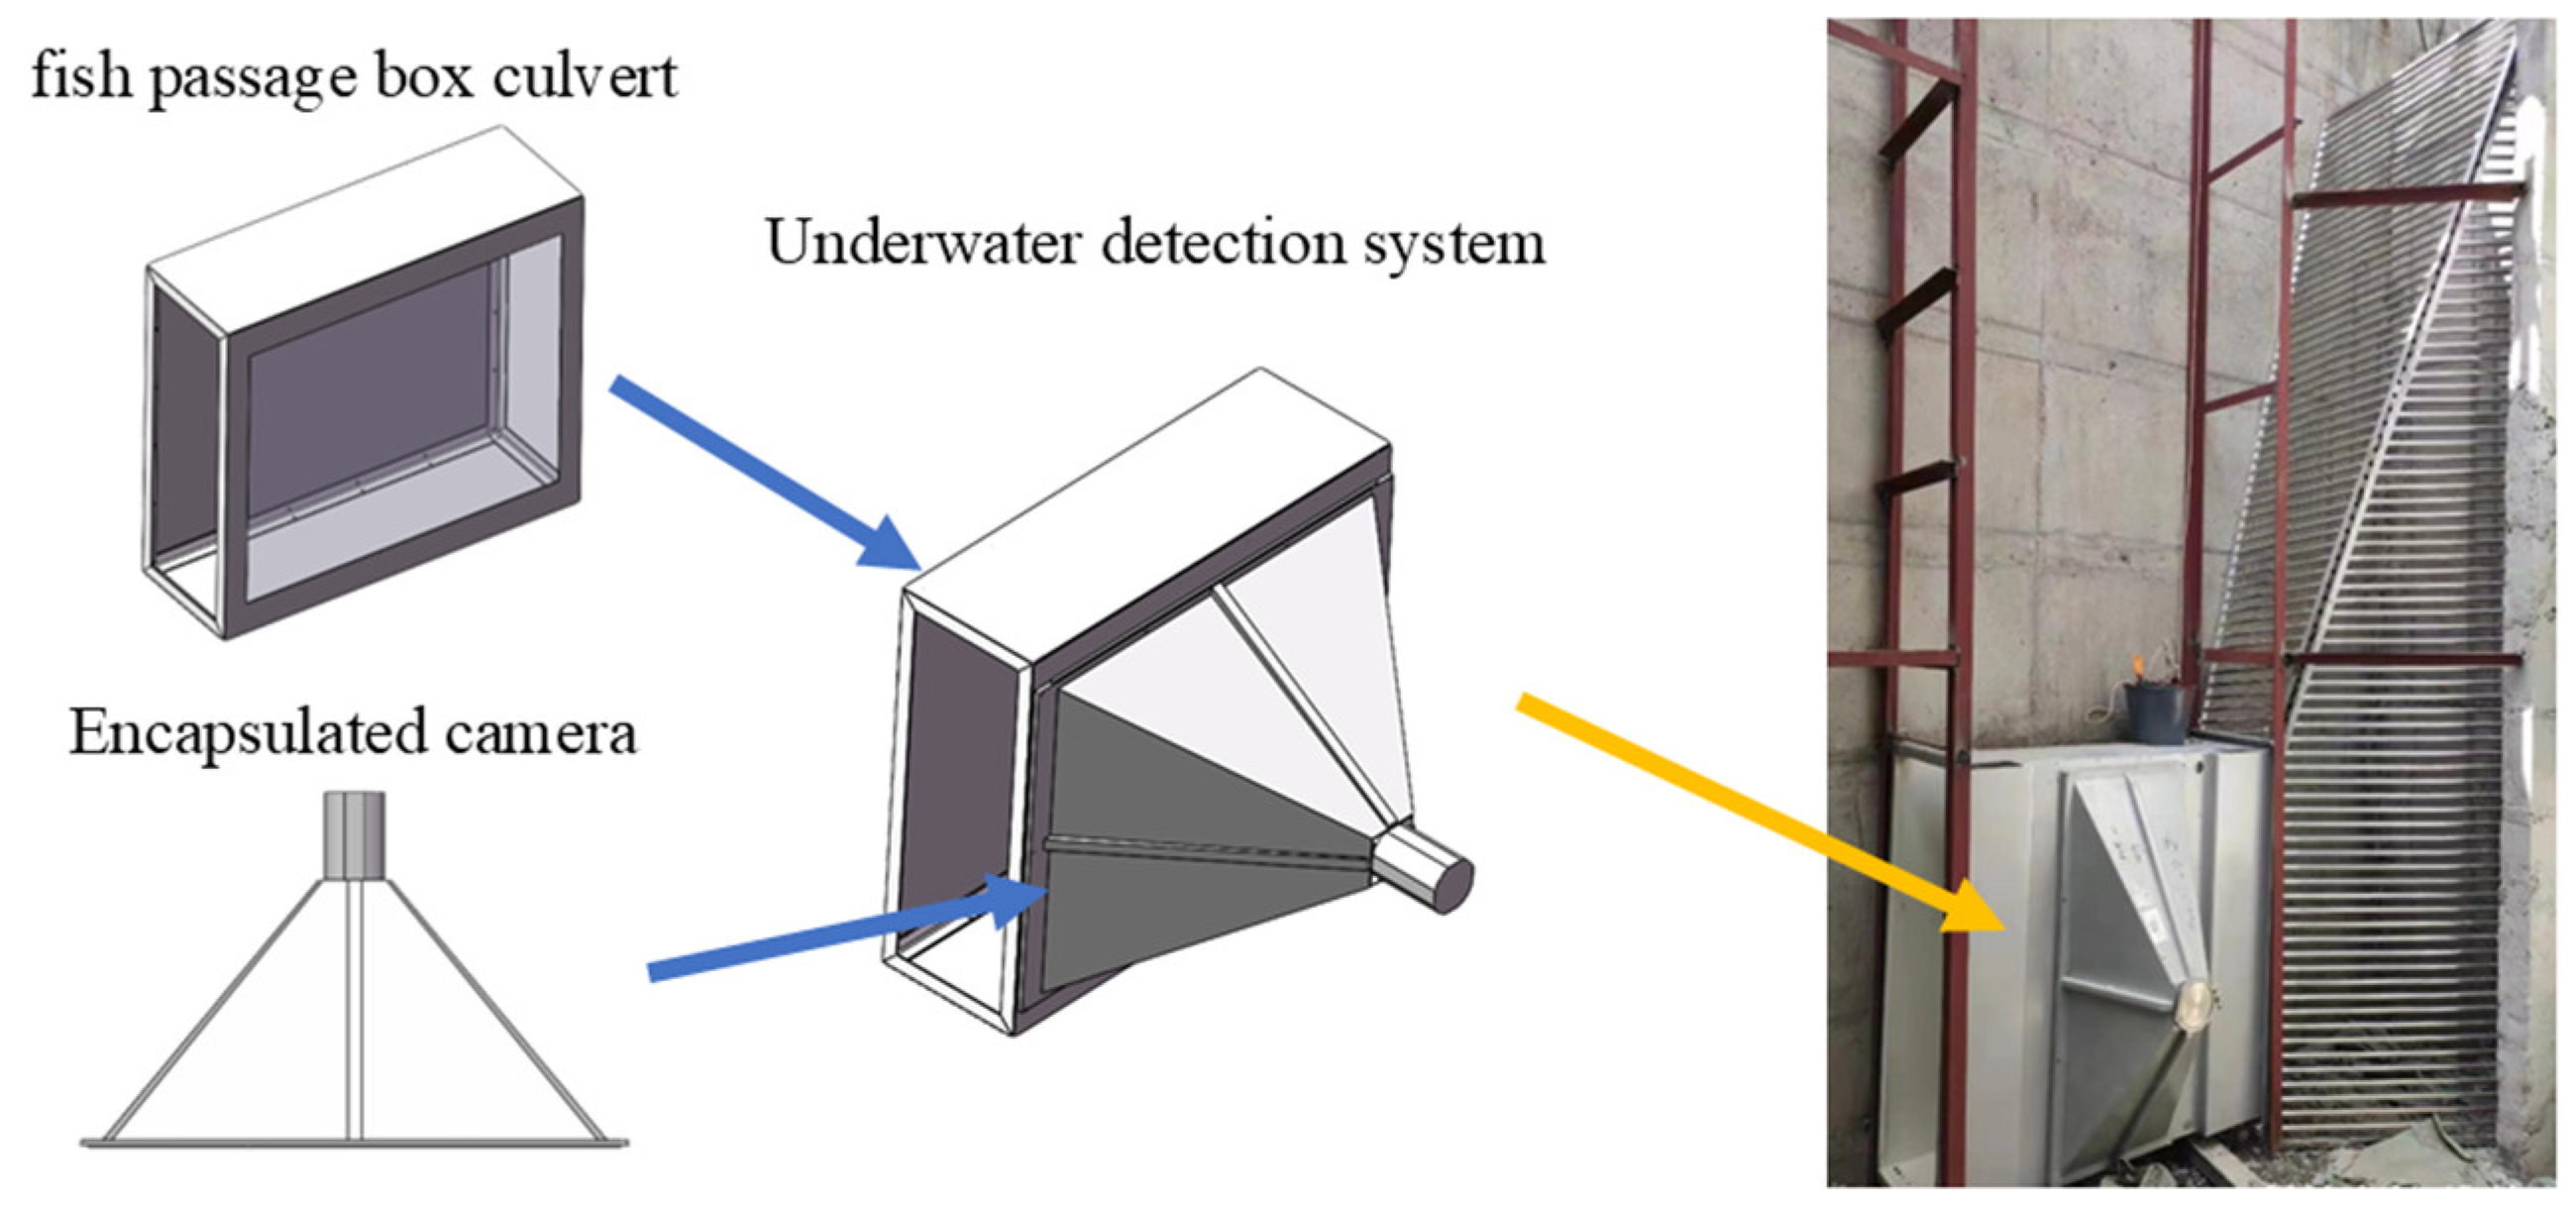
To verify the feasibility of the proposed method, fish species target detection in the complex fishway environment was conducted. The method ensures that fish ecological habitats are not disrupted while achieving accurate and rapid fish detection with minimal resource usage. We installed and deployed the detection equipment at the designated fishway next to the hydropower station on the Han River in Hubei, ensuring that the normal operation of the fishway was not affected. The detection equipment was installed at the inlet of the fishway, as shown in
Figure 8. The underwater detection system consists of a fish passage box culvert and an encapsulated camera. The fish passage box culvert restricts the fish from passing through the fishway via the box. The proposed method in this study was deployed in the encapsulated camera to detect the fish passing through the channel. The underwater detection system was slowly lowered along a track on the inner wall of the fishway to the bottom and fixed in the corresponding position.
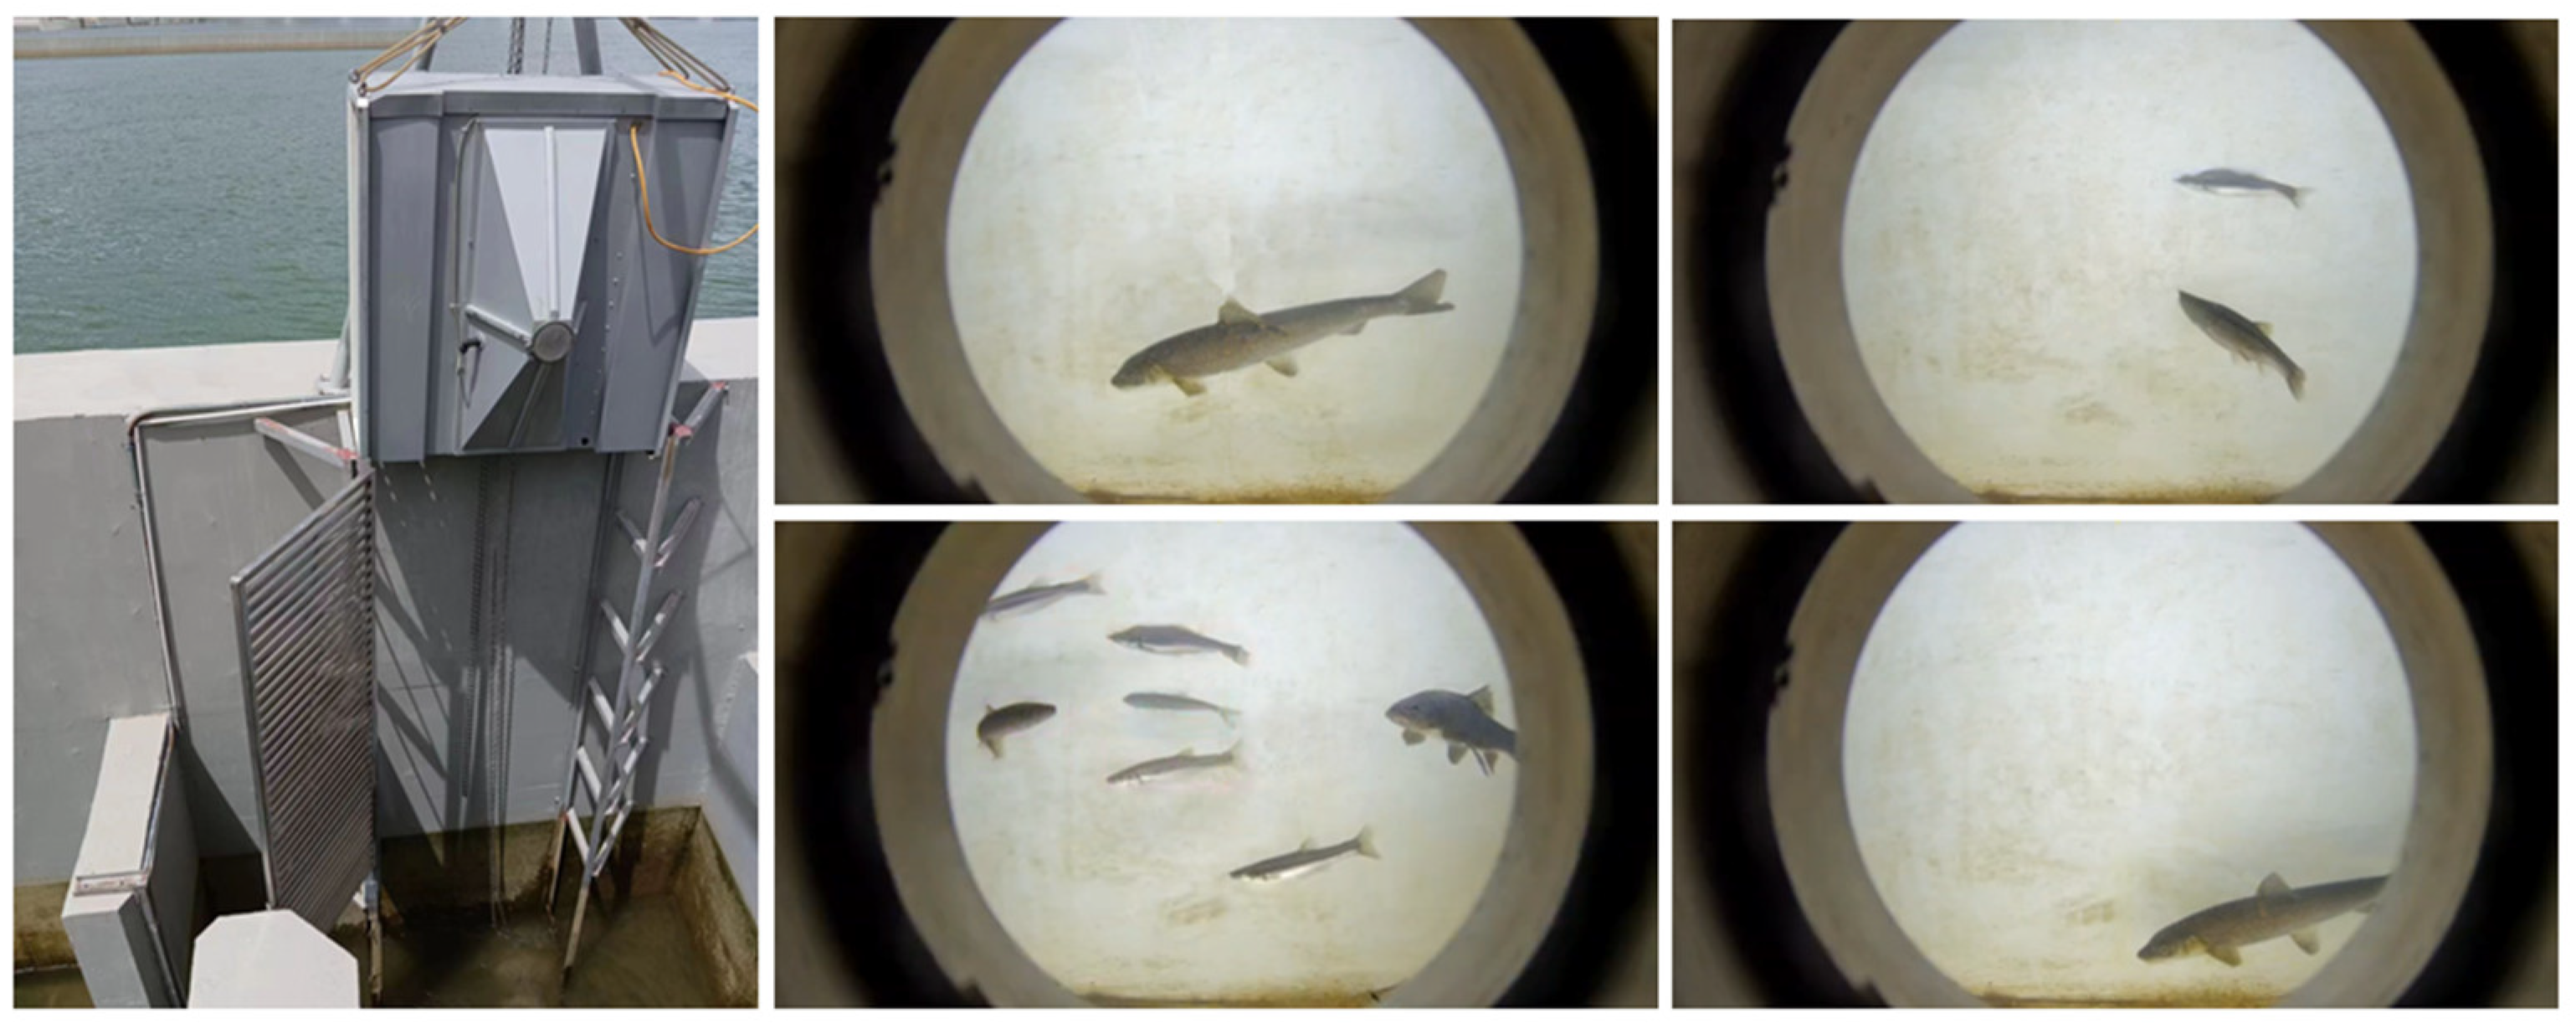
Similarly, we installed the underwater detection device at the fishway outlet and used a Hikvision camera in the detection device to collect a dataset of fish species in the fishway. The camera resolution was 1920 × 1080 pixels. To detect different fish migrations, the captured data were filtered based on different time segments and target fish species, creating a dataset for the fish migration in this season, as shown in
Figure 9. This dataset includes four fish species: Schizothorax macropogon, Racoma waltoni, Rhynchocypris lagowskii, and Schizothorax oconnori, with a total of 4233 images. Due to the presence of small fish with very short lengths, which could not be classified based on features and silhouettes, these small fish were uniformly labeled as “Small Fish”. LabelImg software (version 1.8.6) was used for annotation, and the dataset was divided into training and validation sets in an 8:2 ratio using a random selection process.
Through the computer system managed by the hydropower station authorities, our onsite detection equipment allows for real-time observation of fish passage and detection performance. Compared to traditional methods (manual detection), this approach significantly reduces manual intervention while improving both accuracy and efficiency. The detection results are shown in
Figure 10. This method eliminates the need for intervention by fishway maintenance and management personnel. Additionally, analyzing the daily fish passage data can effectively provide guiding parameters for the rational operation of the fishway. At the same time, multiple datasets of different fish species can be collected. Detecting fish passage through the fishway ensures the scientific construction, reasonable operation, and management of fishway facilities. Additionally, it allows for real-time observation of fish passage in the system, effectively meeting the requirements for real-time fish detection and improving the efficiency of fishway monitoring.
5. Conclusions and Future Work
This study addresses the high cost, low efficiency, and accuracy issues associated with fish detecting in the fishway. By selecting a portion of the Fish4knowledge and images of various fish species collected in a laboratory environment, a Fish26 dataset was created, which contains 26 species of fish. To address the challenges of image blurring due to turbid water and image degradation from insufficient lighting in underwater environments, the fish detection algorithm was proposed, effectively performing fish detection tasks in fishway environments.
Through comparison experiments with loss functions, it was found that the WIoU loss function used in the fishway fish detection algorithm proposed in this paper achieved a mAP@0.5 value of 91.8%, with a significant improvement in accuracy. Compared with state-of-the-art methods, the improved model showed a 1.7% increase in detection accuracy, a 23.4% reduction in computational complexity, and a 24% reduction in model parameters. This resulted in enhanced detection accuracy, a lighter model, and fewer missed and false detections. Additionally, we conducted ablation experiments on the proposed algorithm to verify its high accuracy and robustness. Field tests were also carried out in the fishway near a specific hydropower station. The results show that the fishway fish detection algorithm proposed in this paper not only performs well in a laboratory environment but also meets the requirements for fishway fish detection in real-world applications. However, due to the varying fish species in different fishways across seasons, the algorithm proposed in this paper is currently only applicable to the specific fishway during the given season. Fish detection in other fishways still faces challenges. Future work will focus on expanding fishway fish datasets for different fishways and conducting diversified experiments across multiple fishways in various seasons to enhance the algorithm’s robustness, as well as exploring algorithms with higher detection accuracy and real-time performance. Additionally, the generalizability of the algorithm for detecting other underwater targets remains an area for further research.


