Abstract
During the execution of road infrastructure projects, project managers face significant challenges, including financial, technical, regulatory, and operational risks. More than 90% of infrastructure projects have incurred costs exceeding initial estimates, impacting both completion timelines and the operational efficiency of road infrastructure. Effectively assessing and managing these risks is crucial for improving project outcomes and ensuring the sustainability of infrastructure investments. To address these challenges, this study developed a hybrid model for risk assessment and management in road infrastructure projects. The model quantifies risks across seven key categories: Design, External, Resource, Employer, Contractor, Engineer, and Project, based on three primary input factors: Environment coefficient, Contractual coefficient, and Design coefficient. Initially, various machine learning models, including linear regression, Random Forest, Gradient Boosting, Stacking Models, and neural networks, were applied to assess risk predictions. However, due to the specific nature of the dataset, these models did not achieve satisfactory predictive accuracy. As a result, fuzzy logic systems (Mamdani and Sugeno) were employed, demonstrating superior performance in modeling risk occurrence probabilities. Comparative analysis between these two fuzzy logic approaches revealed that the Sugeno model provided the most accurate predictions. The findings highlight the benefits of applying fuzzy logic for risk assessment in complex infrastructure projects, providing a structured framework for enhancing decision-making processes. This study provides a structured methodology for accurately predicting risks and enhancing project safety, efficiency, and long-term sustainability.
1. Introduction
Risk management is crucial for guaranteeing the success of road infrastructure projects [1,2], given their inherent complexity, substantial financial investments, and significant implications for public safety. These projects, which form the backbone of economic growth and societal mobility [3], often face numerous challenges that can threaten their outcomes. Challenges like budget overruns, schedule delays, and operational inefficiencies are widespread and can severely compromise the overall success of infrastructure initiatives. Research indicates that over 90% of such projects globally exceed their initial budgets, with unforeseen delays and additional risks further exacerbating the problem [4,5].
The lifecycle of a road infrastructure project encompasses multiple stages, including design, planning, construction, and operation, each introducing specific uncertainties [6]. These uncertainties range from financial risks, such as fluctuating material costs, to operational risks, such as delays caused by unfavorable weather conditions or unexpected site challenges [7,8]. Effective risk management provides a systematic framework for identifying, evaluating, and mitigating these potential risks, ensuring that projects are executed efficiently and safely [9,10,11]. The integration of risk assessment methods has proven to significantly lower the chances of accidents, enhance financial stability, and support more informed decision-making processes [12,13].
Despite the critical role of risk management, traditional frameworks often fall short in addressing the multifaceted and dynamic nature of risks associated with road infrastructure projects [14]. Conventional approaches focus on isolated risk factors without considering the complex interdependencies between project-specific characteristics, external environmental conditions, and societal impacts. This limitation can lead to an underestimation of overall project risk and encourage reactive rather than proactive decision-making. Addressing this gap underscores the necessity for more comprehensive and adaptive risk assessment methodologies [15,16].
Unlike traditional risk management approaches that often overlook complex interdependencies and uncertainties among risk factors, this study introduces a hybrid model that integrates fuzzy logic, empirical data, and expert evaluations. This approach not only enables a more accurate assessment of current risks, but also predicts their probabilities in future projects. The model provides flexibility to adapt to the specific characteristics of each project, facilitating proactive risk management and reducing costs and delays.
Unlike traditional risk management approaches that often overlook complex interdependencies and uncertainties among risk factors, this study introduces a hybrid model. The goal of the hybrid model is to predict the probability of occurrence for seven risk groups (Design, External, Resource, Employer, Contractor, Engineer, and Project [7,8,17]) based on three project complexity coefficients: Environment coefficient, Contractual coefficient, and Design coefficient. Empirical data, expert evaluations, and various computational intelligence techniques were utilized to develop the hybrid model. A comparative analysis was conducted between various machine learning models, including linear regression, Random Forest, Gradient Boosting, Stacking Models, and neural networks, as well as fuzzy logic systems (Mamdani and Sugeno), to determine the most suitable approach for predicting the seven risk groups given the specific input data. This selection of the most appropriate computational intelligence technique for the final hybrid model not only enables a more accurate assessment of existing risks, but also enhances the prediction of their probabilities in future projects. The model offers flexibility in adapting to the specific characteristics of each project, facilitating proactive risk management while reducing costs and delays. Hybrid models offer a strong framework for connecting the intricate relationships between various risk factors, thus providing actionable insights for proactive risk mitigation [4,15,18].
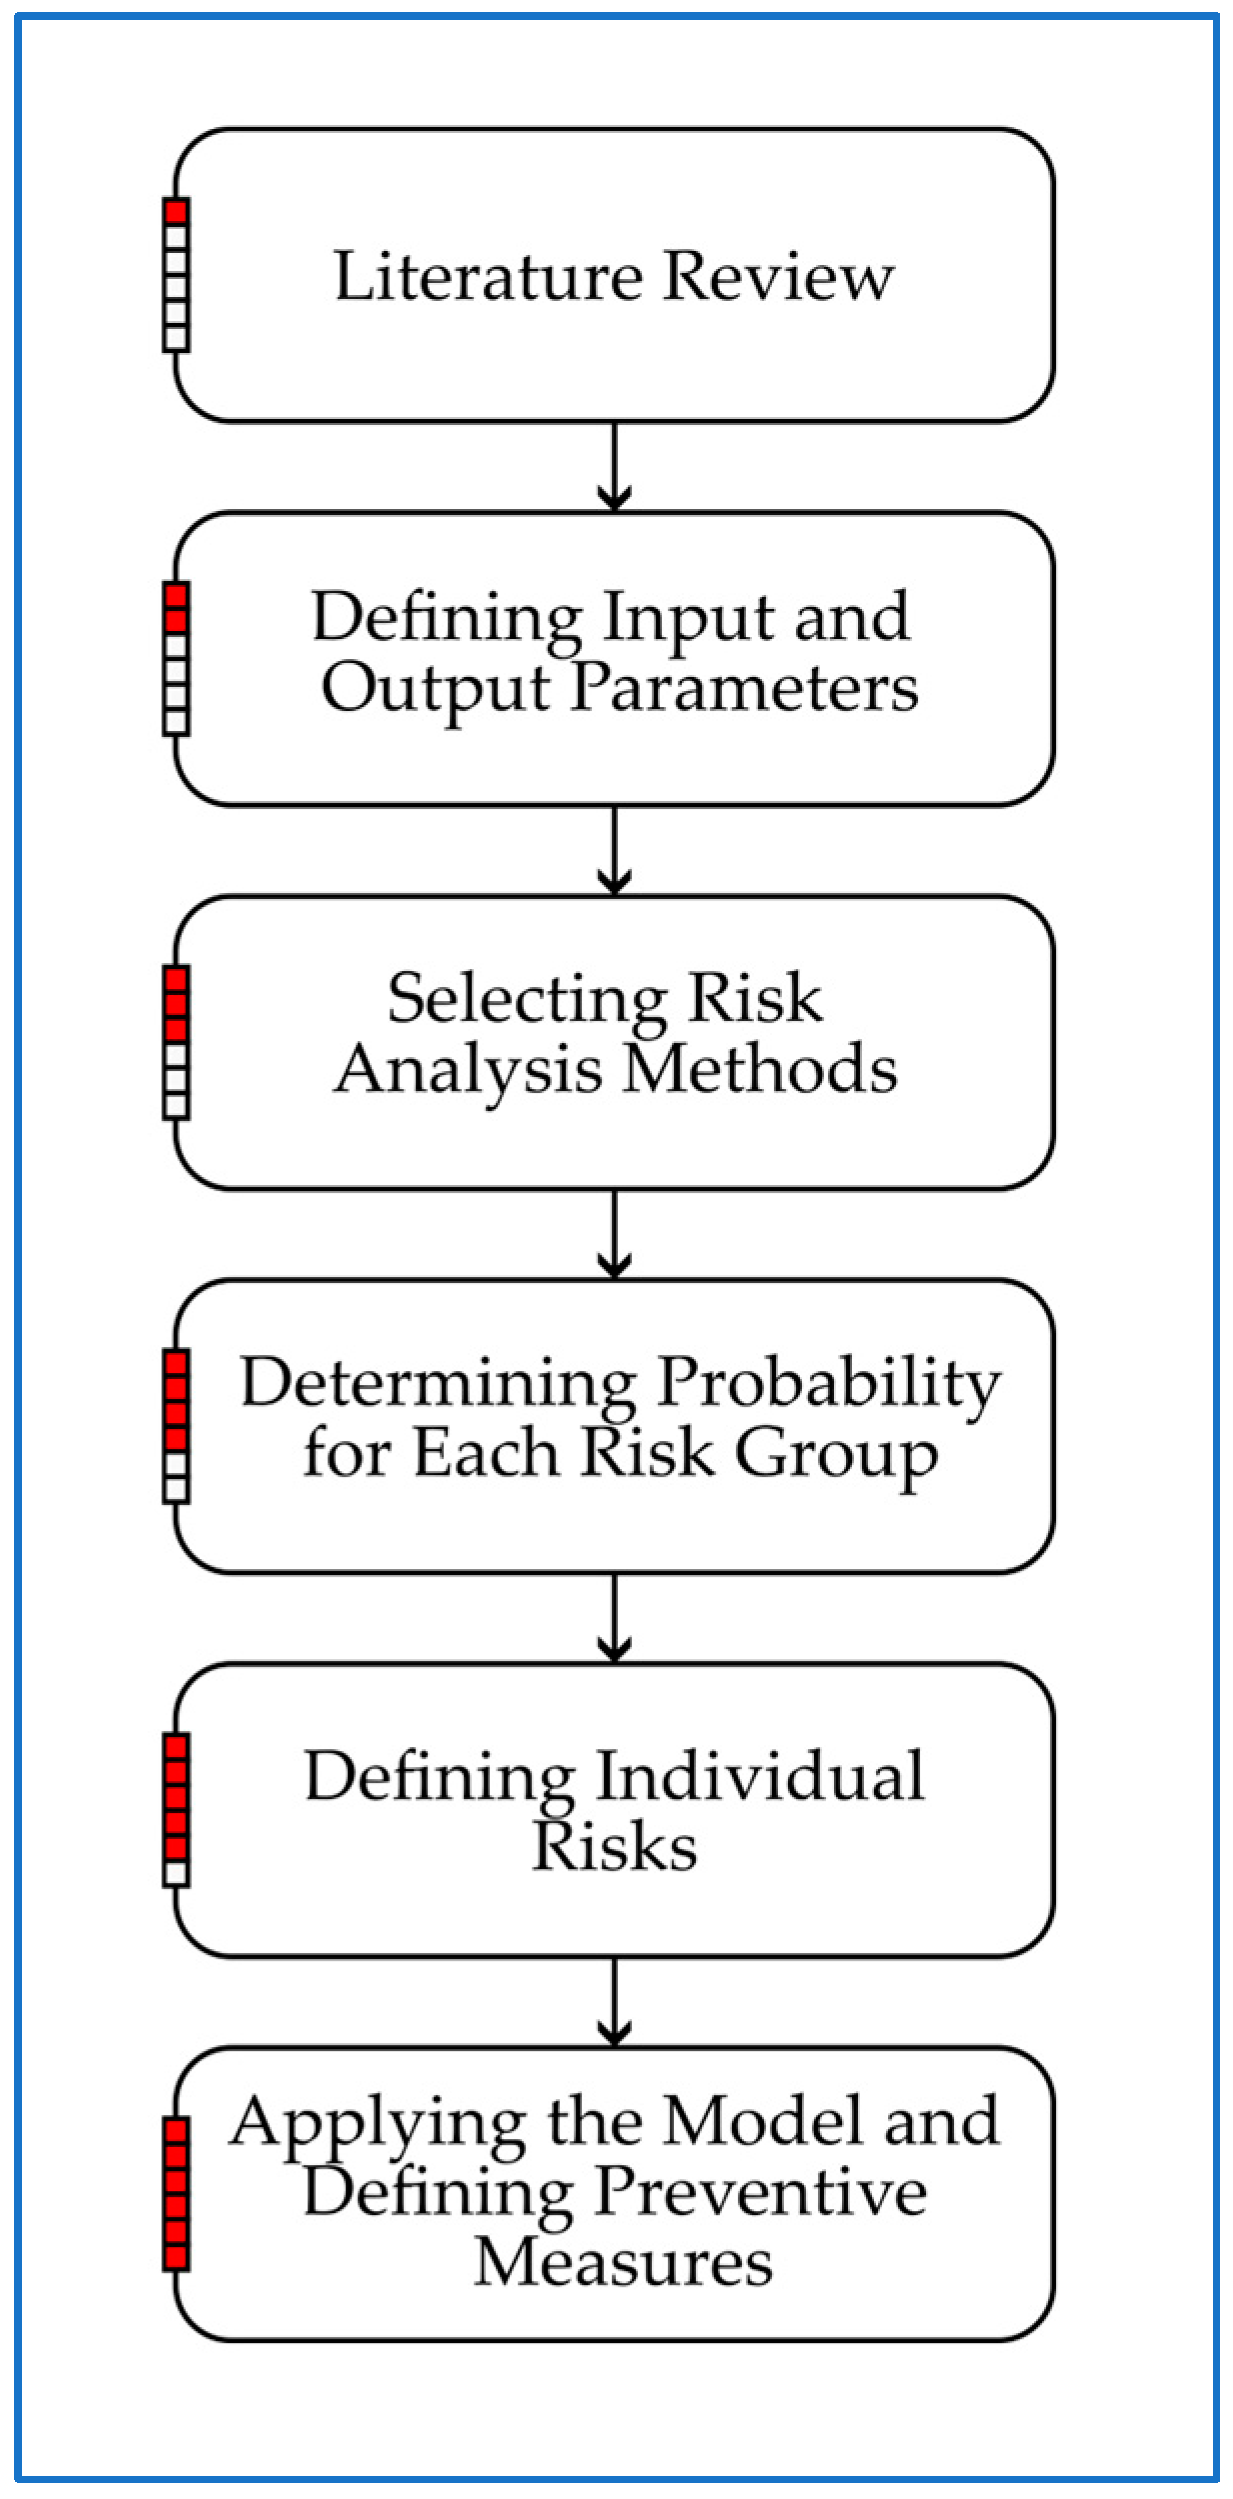
The structure of this study is designed to provide a clear, logical, and systematic presentation of the research. It begins with an introduction, which establishes the importance of risk management in road infrastructure projects and situates the study within the broader research context. This is followed by a structured review of the relevant literature, highlighting previous studies and methodologies related to risk assessment and advanced analytical approaches. Section 2 provides a detailed description of the research framework, outlining the data-driven techniques utilized in the study and their implementation. Section 3 presents the outcomes of all applied methods and evaluates their effectiveness in predicting the seven risk groups. The discussion offers a comprehensive comparative analysis of the different approaches used in this study and examines how the developed models align with findings from other research. Finally, the conclusion summarizes the key insights and their implications for infrastructure project management, emphasizing the contributions of the proposed hybrid model to risk prediction, proactive decision making, and overall project efficiency. For improved clarity and a better understanding of the research methodology, a flowchart diagram illustrating the key steps of the proposed hybrid risk assessment model is presented in Figure 1.
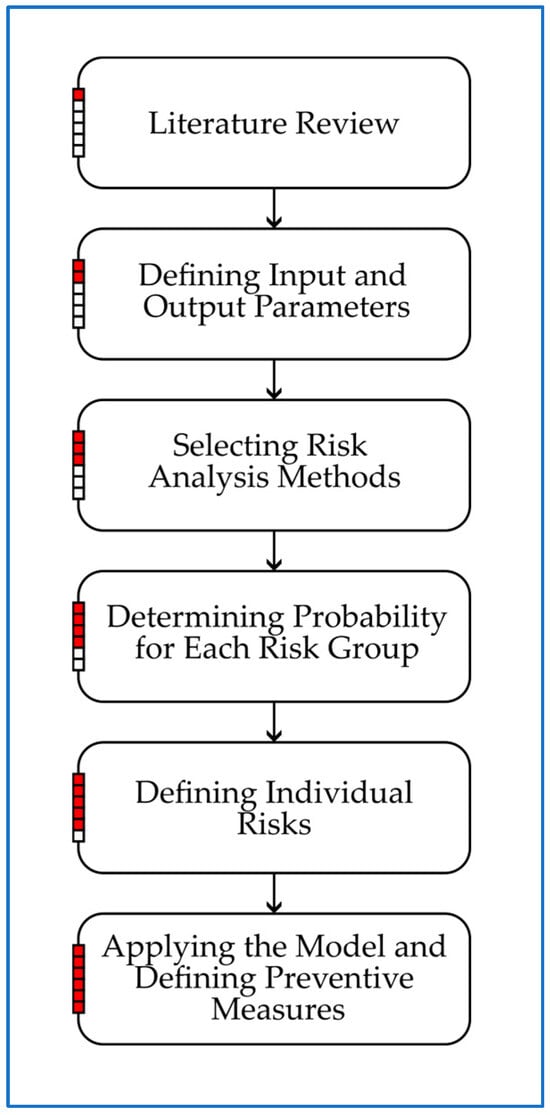
Figure 1.
Flowchart of the hybrid risk assessment model for road infrastructure projects.
Literature Review
Fuzzy logic approaches have proven to be effective tools for risk assessment in complex infrastructure projects. In the study by Alam et al. [19], the authors developed a risk assessment framework for replacing the pavement structure of a suspension bridge in Canada. By utilizing fuzzy logic and micro-simulation, they analyzed the effects of bridge reopening delays on the traffic network, showing that the probability of delay ranged between 18% and 40%. This model enables the more precise planning of traffic management strategies and minimizes the negative economic impacts of such delays. Similarly, Yazdani-Chamzini [20] investigated the application of fuzzy logic in risk analysis for tunneling projects, where uncertainty due to unpredictable geological conditions posed a significant challenge. The study demonstrated that fuzzy logic systems provide a more flexible risk assessment compared to traditional methods, particularly when input data are imprecise or subject to variability. In the context of large-scale road infrastructure projects, the study by Senić et al. [8] analyzed the application of the Sugeno fuzzy logic system for predicting Extension of Time (EoT) and Increasing Contract Price (ICP) in road infrastructure projects.
On the other hand, Sharma and Trivedi [21] employed a fuzzy-MATLAB model for risk analysis in highway construction, identifying 61 risk factors. Subya and Manoj [22] compared fuzzy logic with regression analyses in risk assessment for projects in India. These studies indicate that fuzzy logic enables the more efficient identification and categorization of key risks in construction projects. Fuzzy logic has also been applied in rail infrastructure projects. Vygnanov and Fironov [23] developed a Simulink model for risk assessment in the Moscow–Kazan high-speed rail project, allowing for the continuous monitoring and adaptation of risk management strategies throughout the project’s lifecycle. In the study by Deshpande and Valunjkar [24], fuzzy logic was applied to risk management in road construction, where the model facilitated the early identification of risk factors and their ranking based on potential budget and schedule impacts. These studies confirm that fuzzy logic-based approaches improve uncertainty assessment in infrastructure projects and enhance decision-making processes in risk management.
In addition to fuzzy logic, machine learning (ML) plays a significant role in risk management. Several studies have provided comprehensive reviews of machine learning applications in this domain. One such review [25] examines the use of modern research methodologies for cost overrun risk assessment in construction projects, with a focus on fuzzy hybrid methods, such as the Fuzzy Analytical Network Process (FANP), Fuzzy Artificial Neural Networks (FANNs), Fuzzy Monte Carlo Simulations (FMCSs), and Fuzzy Bayesian Belief Networks (FBBNs). These approaches have been utilized to enhance the modeling of uncertainty and complex interdependencies among risks in high-uncertainty conditions. The literature analysis (2008–2018) indicated that fuzzy hybrid methods are effective in risk assessment, but are constrained by data subjectivity, computational complexity, and the need for continuous model updates. A systematic review conducted by Tayefeh Hashemi et al. [26] explores machine learning-based cost estimation methods for construction projects from 1985 to 2020. The study analyzes various cost prediction approaches, including Artificial Neural Networks (ANNs), Fuzzy Neural Networks (Fuzzy NNs), Support Vector Machines (SVMs), Particle Swarm Optimization (PSO), Decision Trees (DTs), Bayesian Regression (RA), Case-Based Reasoning (CBR), Monte Carlo methods, and the Analytical Hierarchy Process (AHP). The findings reveal that ANNs and Bayesian Regression are the most frequently applied and most effective methods for cost estimation, whereas hybrid models that integrate ANNs with fuzzy logic, genetic algorithms (GA), and CBR outperform standalone techniques in terms of accuracy. The study also highlights that construction and road infrastructure projects are the most common applications of these techniques. The obtained results offer valuable insights for project managers in the early project stages, providing recommendations for selecting the most suitable machine learning methods, prioritizing data processing, and integrating ML models with traditional techniques.
The study by Gondia et al. [27] applies machine learning for delay risk analysis and prediction in construction projects, utilizing Decision Trees (DT) and Naïve Bayesian Classification. The research involved identifying key risk sources, collecting multivariate datasets on previous project delays, and applying data analytics to understand the complexity and interdependencies of risk factors. The results indicated that the Bayesian model outperformed the Decision Tree model in delay prediction, confirming the assumption that conditional independence of variables is crucial in risk analysis. In another study, Shoar et al. [28] developed a Random Forest model to predict cost overruns in engineering services (ESCO) for construction projects. The model exhibited superior performance compared to Support Vector Regression (SVR) and Multiple Linear Regression (MLR), achieving an R2 value of 0.8680 and a low mean absolute error (MAE). Artificial Neural Networks (ANNs) have also been applied in various infrastructure-related risk assessments. In Assaad and El-Adaway’s study [29], an ANN was used to analyze bridge deterioration, comparing its performance with k-nearest neighbors (KNNs). After hyperparameter optimization, the ANN achieved a prediction accuracy of 91.44%, enabling more precise maintenance planning and reduced inspection costs. Additionally, Bae et al. [30] developed an ANN-based model for classifying economic losses in transportation infrastructure projects, employing the BFGS backpropagation algorithm, where the best model achieved a classification accuracy of 74.1% on the test dataset.
Table 1 provides a summary of selected studies in the field of risk management for infrastructure projects [31], focusing on fuzzy logic, machine learning, and hybrid modeling approaches. The table highlights key focus areas, methodologies, and their relevance to this study, encompassing fuzzy logic systems, machine learning models, and comparative analyses of different computational intelligence techniques.

Table 1.
Studies on risk management in infrastructure projects.
In the context of road infrastructure projects [33,34,35,36], where the stakes are high and the margin for error is minimal, adopting innovative risk management strategies is not just advantageous, but essential. This study builds on these advancements by proposing a novel hybrid model for risk assessment and management.
The primary objective of this study is to define the probability of risk occurrence for future road infrastructure projects through the application of a hybrid model. This study analyzes the application of multiple computational intelligence techniques to a specific dataset, assessing their effectiveness in risk prediction. By comparing various computational intelligence techniques and integrating them with empirical data from real-world projects, this study identifies the most precise hybrid model, which is designed to provide a structured framework for quantifying risk probabilities. This approach enables a comprehensive understanding of potential challenges, offering a reliable foundation for proactive risk management and informed decision making throughout project planning and execution. The ultimate goal is to enhance project outcomes by identifying and prioritizing risks, thereby contributing to improved safety, efficiency, and sustainability in infrastructure development.
2. Methodology
The methodology presented in this study aims to provide a systematic approach for assessing the probability of major and secondary risks in road infrastructure projects [17] based on a hybrid model that combines empirical results, expert opinions, fuzzy logic, and result aggregation. This methodology is designed to identify potential challenges and adverse events, facilitating proactive risk management during the planning and execution of infrastructure projects.
The primary objectives of this methodology include defining project complexity coefficients to encompass essential project characteristics, utilizing fuzzy logic to model the relationship between complexity coefficients and risk probabilities, integrating empirical probabilities of adverse events with fuzzy logic outputs to compute overall risk probabilities, and prioritizing adverse events based on their likelihood of occurrence for targeted mitigation [25,37,38].
This structured methodology provides a comprehensive tool for understanding and addressing risks in road infrastructure projects, ensuring informed decision making and improved project outcomes.
2.1. Formation of Project Complexity Coefficients
The formation of project complexity coefficients is the first step in this methodology. These coefficients quantify key project characteristics, providing a comprehensive framework for assessing the inherent complexity of road infrastructure projects. The complexity coefficients were developed based on detailed analysis and expert validation. Based on their professional judgment and a thorough literature review [7,8,39,40], each expert identified a set of project-specific characteristics critical for understanding complexity, ensuring that each coefficient accurately reflects a distinct aspect of project challenges. The Environment coefficient captures environmental and geographical factors influencing the project. These include landslide frequency, archaeological sites, population density, elevation range, soil type, and structural intersections along the route. The Contractual coefficient incorporates administrative and contractual attributes, such as contract value, project duration, land acquisition progress, frequency of tender document modifications, number of bids, and price adjustment clauses. The Design coefficient evaluates technical and structural design factors, including the proportions of embankments, bridges, cuts, and tunnel lengths in relation to the section length, maximum heights of cuts and embankments, type of foundation used, and ownership of the design company.
A panel of 14 multidisciplinary experts participated in defining these coefficients. Their collective expertise ensured that the coefficients were both applicable and reflective of real-world conditions. The process included iterative reviews and consensus building to validate the relevance and accuracy of each characteristic. The identified project characteristics were quantified into three coefficients using historical project data. This approach ensures that the coefficients provide a balanced representation of project complexity [8].
2.2. Data Collection and Expert Validation
The dataset utilized in this study consists of 28 completed projects forming part of the European Road Corridor 10 in the Republic of Serbia. This corridor stretches from the northern border with Hungary and proceeds southward, splitting near the city of Niš into two branches: the southern branch extending toward Athens, Greece, and the eastern branch leading toward Asia Minor via Bulgaria. The selected projects include major highway sections, interchanges, and critical infrastructure elements constructed as part of Corridor 10’s development. These projects were chosen based on the availability of detailed risk assessment records, ensuring the reliability of the dataset for this research. Additionally, the dataset includes projects with an accepted contractual value exceeding 3 million euros, a completion deadline longer than one year, and a minimum ICP of 1.5 million euros, indicating a high occurrence of adverse events. Among these, 25 projects were selected for model training, while three were reserved for testing purposes. This dataset captures diverse project characteristics and provides a reliable basis for developing models and integrating empirical probabilities [8,17,40].
To validate the methodology and the derived coefficients, this study engaged a panel of 14 experts from various disciplines relevant to road infrastructure projects, including hydrotechnics, geotechnics, structural engineering, environmental engineering, urban planning, procurement, and project management. Each expert possessed extensive professional experience, having managed an average of 30 projects and accumulated at least 10 years of expertise in road infrastructure. The multidisciplinary composition of the panel ensured comprehensive coverage of technical, environmental, and procedural aspects. Through iterative discussions and validations, the experts reviewed and refined the identified project characteristics and coefficients, leveraging their experience from both Serbian and international projects. Many of them had held key roles in the analyzed projects, such as Employer’s Representatives, Engineers, and Implementation Consultants, providing critical insights into project planning and execution. Given that parameter evaluation has already been established in the literature [8], this study builds upon those findings to further refine the applied methodology.
The data from real projects used to quantify the project complexity coefficients were cross-validated by the expert panel to ensure consistency and accuracy. This process involved comparing the derived coefficients against empirical project outcomes to confirm their relevance and reliability. By integrating expert validation with data from real projects, this study ensured that the methodology is both scientifically grounded and practically applicable.
2.3. Methodology for Machine Learning-Based Risk Prediction
This methodology describes the process of modeling and analyzing risk probability prediction through different phases of dataset development and model optimization.
The initial dataset consisted of 28 samples, each containing three input variables (complexity coefficients) and seven output variables (probabilities of different risk groups). Given the small dataset size, overfitting was identified as a primary concern, particularly for complex models. Additionally, the input and output values were continuous numerical variables with limited variance, which could restrict the ability of machine learning models to detect meaningful patterns.
To better understand the relationships between inputs and outputs, a correlation analysis was performed using Pearson’s correlation coefficient. A correlation matrix was generated, displaying values ranging from −1 to 1. Higher values, close to 1, indicated a strong positive correlation, meaning that an increase in an input variable led to an increase in the corresponding output variable. Conversely, values close to −1 signified a strong negative correlation, suggesting that higher complexity might reduce the probability of specific risks. Values near 0 indicated no significant linear relationship between the variables.
Given the dataset’s limited size, several challenges arose. One of the main challenges was the risk of overfitting, where more complex models might memorize the dataset instead of learning generalizable patterns. Another issue was model instability, meaning that predictions could vary significantly when applied to new data, leading to unreliable outcomes. Additionally, standard validation techniques, such as k-fold cross-validation, could not be effectively applied due to the small number of samples, limiting the ability to assess model performance accurately.
To mitigate these challenges, a progressive modeling approach was adopted. Initially, simpler models were tested to establish baseline performance before introducing more complex techniques. Linear regression was the first model to assess whether a dominant linear relationship existed between inputs and outputs. If successful, this would indicate that more complex models were unnecessary. The next step involved testing the Random Forest model, which is well suited for capturing nonlinear relationships. However, due to the small dataset size, it was expected that this model might struggle to generate meaningful patterns. Finally, a basic single-hidden-layer neural network was tested. While neural networks excel at capturing complex relationships, they require substantial amounts of data to train effectively. Given the dataset constraints, it was anticipated that the neural network would underperform compared to simpler models.
If linear regression demonstrated strong performance, it would suggest that the dataset predominantly contained linear relationships. If Random Forest showed improvement over linear regression, it would indicate the presence of significant nonlinear relationships. On the other hand, if the neural network performed poorly, it would confirm that the dataset was too small to support deep learning models effectively.
To address dataset limitations, a data expansion technique using Multivariate Copula Models was employed. This method increased the dataset size from 28 to 201 samples while preserving the statistical distribution of the original dataset. After expansion, a distribution analysis was conducted to verify that the newly generated data maintained the same statistical properties as the original dataset. Following dataset expansion, all variables were standardized to ensure uniform scaling across features. The dataset was split into training and test sets to evaluate model performance on unseen data. The first step in model evaluation involved testing linear regression to determine whether a dominant linear relationship existed. If linear regression failed to produce adequate predictions, more advanced models, such as Random Forest and Gradient Boosting, were introduced to capture potential nonlinear interactions.
A Stacking Model was tested in the final stage of model evaluation, combining Linear Regression, Random Forest, and Gradient Boosting. The goal of this ensemble approach was to assess whether integrating different models could enhance predictive accuracy. Additionally, the impact of dataset expansion on model stability was analyzed. By systematically increasing dataset size and model complexity, this methodology aimed to determine the most effective approach for risk probability prediction while ensuring that the models remained generalizable and stable for practical applications.
2.4. Fuzzy Logic Model Development
The fuzzy logic model was developed to analyze the relationship between project complexity coefficients and risk probabilities. The model is based on a Sugeno-type Fuzzy Inference System (FIS), which allows for computational efficiency and is well suited for real-world applications where crisp outputs (such as probability values) are needed. This model provides a flexible and adaptive approach to risk assessment by incorporating both quantitative data and expert knowledge. The input variables for the model are the three project complexity coefficients: K1 Environment coefficient, K2 Contractual coefficient, and K3 Design coefficient. These coefficients represent the key factors affecting the probability of risk occurrence. Gaussian functions were used to describe the input variables, while the seven output variables were modeled using linear functions.
The models operate on a set of fuzzy rules derived from the training dataset of 25 projects. These fuzzy rules are generated using the Wang and Mendel approach [41,42]. Each rule represents an if–then relationship between the input coefficients and the probability of occurrence for seven defined risk groups, and the rule base is designed to capture the relationships between input variables and risk group probabilities. These risk groups include RG1 Design Risks, RG2 External Risks, RG3 Resource Risks, RG4 Employer Risks, RG5 Contractor Risks, RG6 Engineer Risks, and RG7 Project Risks. By accommodating uncertainty and variability in complex projects, the fuzzy logic approach enables a more detailed and adaptive risk evaluation.
The model’s output variables represent the probabilities of occurrence for each of the seven risk groups, which are further categorized into major and secondary risks. These probabilities were modeled using linear functions. These outputs provide a structured basis for calculating the overall risk probabilities and identifying high-priority risk areas. The model was validated by comparing its outputs with empirical data from the testing dataset, ensuring accuracy and reliability in real-world applications. By incorporating expert-defined rules and data from real projects, the fuzzy logic model offers an advanced framework for dynamic risk assessment in road infrastructure projects.
2.5. Probability Calculation for Specific Risk
To determine the likelihood of unfavorable events, the outputs of the fuzzy logic model were combined with empirical probabilities derived from data from real projects [43,44,45]. The fuzzy model outputs provide the probability of occurrence for each risk group, while the empirical data offer conditional probabilities of specific adverse events within those groups. This integration enables a more thorough evaluation of risk.
The probability of a specific risk Ri is calculated as follows:
where:
P(Ri)—probability of the specific risk Ri (within the risk group),
P(RG)—probability of the corresponding risk group RG (calculated from the fuzzy model),
P(Ri/RG)—normalized frequency of occurrence of specific risk Ri within its risk group RG, calculated from empirical project data that are presented later in this paper (for major and secondary risk),
α—calibration factor (0 ≤ α ≤ 1).
This equation was specifically developed for this study to integrate empirical risk occurrence rates with a probabilistic approach, serving as an input for the subsequent fuzzy-logic-based risk assessment. The introduction of the calibration factor α was necessary to enhance the adaptability of the proposed model. Given the inherent uncertainty in empirical data and probabilistic estimates, α serves as a weighting parameter that adjusts for discrepancies between model calculations and observed real-world occurrences. This approach ensures that the model remains applicable across varying data conditions, allowing for a more precise quantification of risk. Unlike purely data driven statistical methods, which may struggle with limited datasets, or expert-based approaches, which can be subjective, the inclusion of α provides a balanced integration of both sources. Table 2 provides recommended α values, adjusted for varying data confidence and uncertainty levels. The calibration factor α is not required when there is high confidence in the empirical probabilities and initial probabilistic estimates, with minimal uncertainty and fully representative data for the future project.
Table 2.
Suggested values for calibration factor (α) based on data confidence and uncertainty levels.
The probabilities of occurrence for individual risks have been established based on previous research, empirical project data, and the applied formulas. These probabilities, covering both major and secondary risks, are comprehensively presented in Table 3. This table provides a detailed overview of the likelihood of each risk, serving as a crucial reference for further analysis and decision making in the context of risk management.
Table 3.
Probabilities of occurrence for individual risks (major and secondary).
Once the probabilities of individual risks are calculated and validated, the next step involves analyzing and prioritizing these risks for proactive risk management. This step guarantees that resources are distributed effectively to mitigate the most critical risks. All calculated risks are ranked in descending order based on their probability of occurrence. This provides a clear understanding of which risks are most likely to affect the project.
2.6. Software Tools
The methodology utilized a range of software tools to ensure accurate calculations, comprehensive analysis, and effective data visualization. MATLAB R2024a was employed for fuzzy logic modeling, enabling the precise computation of risk group probabilities based on project complexity coefficients [46,47,48]. Statistical Package for the Social Sciences (SPSS V.28) was used for statistical analysis, including data validation, correlation testing, and descriptive statistics [49,50]. Additionally, Microsoft Excel (Microsoft Office 2016) was used for tabular data organization and initial exploratory analysis. This combination of tools provided a reliable and efficient framework for the integration of fuzzy logic and empirical data in risk assessment.
2.7. Ethical Considerations
This study adhered to strict ethical standards throughout the research process. All data were collected in accordance with established ethical principles, maintaining the integrity and credibility of the results. Expert contributions were obtained with informed consent, guaranteeing their voluntary participation and providing them with a clear understanding of the study’s purpose and scope. Anonymity and confidentiality were strictly maintained, with all personally identifiable information removed during data processing and analysis. The data used in the study were derived from real-world projects, with appropriate permissions obtained for their use. Additionally, the research design was reviewed to ensure compliance with ethical principles, including fairness, transparency, and respect for all participants. These measures underscore the commitment to conducting a study that upholds the highest standards of ethical responsibility.
3. Results
This section presents the study’s findings, focusing on the application of machine learning models and fuzzy logic systems for risk analysis. The results provide an in-depth evaluation of model performance, highlighting the effectiveness and limitations of various predictive approaches. By comparing these methodologies, this study aims to determine the most suitable strategy for handling the complexity and uncertainty associated with infrastructure project risks.
3.1. Results of Risk Analysis Using Machine Learning
The correlation matrix analysis of input and output data revealed that the input variables did not exhibit strong linear dependencies with all output variables. Moderate correlations were observed between certain inputs and outputs (0.25 to 0.37), while some outputs showed negative correlations (−0.50 to −0.38), indicating that increasing project complexity may reduce the likelihood of certain risks. The highest correlations were around 0.37, suggesting slightly linear relationships but not entirely pronounced.
3.1.1. Initial Model Performance Evaluation
The testing results of the initial models confirmed the limitations of both linear and nonlinear models due to the small dataset size:
- -
- Linear Regression: MAE = 0.0161, R2 = −0.35 (indicating some linear patterns but with significant deviations);
- -
- Random Forest: MAE = 0.0162, R2 = −0.60 (failed to capture significant nonlinear patterns);
- -
- Neural Network: MAE = 0.2374, R2 = −137165.96 (catastrophic generalization failure due to insufficient data).
3.1.2. Performance Improvement After Dataset Expansion
To address these limitations, the dataset was expanded from 28 to 201 samples using Multivariate Copula Models, leading to notable improvements in model performance:
- -
- Linear Regression: MAE = 0.0135, R2 = −0.09;
- -
- Random Forest: MAE = 0.0142, R2 = −0.19;
- -
- Gradient Boosting: MAE = 0.0146, R2 = −0.29;
- -
- Stacking Model: MAE = 0.0137, R2 = −0.11.
3.1.3. Challenges in Model Generalization
Although performance improvements are evident, the coefficient of determination (R2) remains negative across all models, indicating persistent challenges with model generalization. This suggests that the dataset is still not sufficiently informative for achieving reliable risk probability predictions. Further expansion of the dataset and refinement of input variables are necessary to improve model stability and predictive accuracy.
3.2. Case Study of Sugeno Fuzzy Logic System
The case study in this paper is based on the application of an approach founded on a developed Sugeno fuzzy logic system [51,52]. The main goal is to assess the likelihood of the occurrence of a group of risks for a specific project under consideration. Subsequently, following the methodology, the probability of each individual risk within the groups can be assessed. Data from significant road infrastructure projects in the Republic of Serbia were used for training and testing the fuzzy logic system.
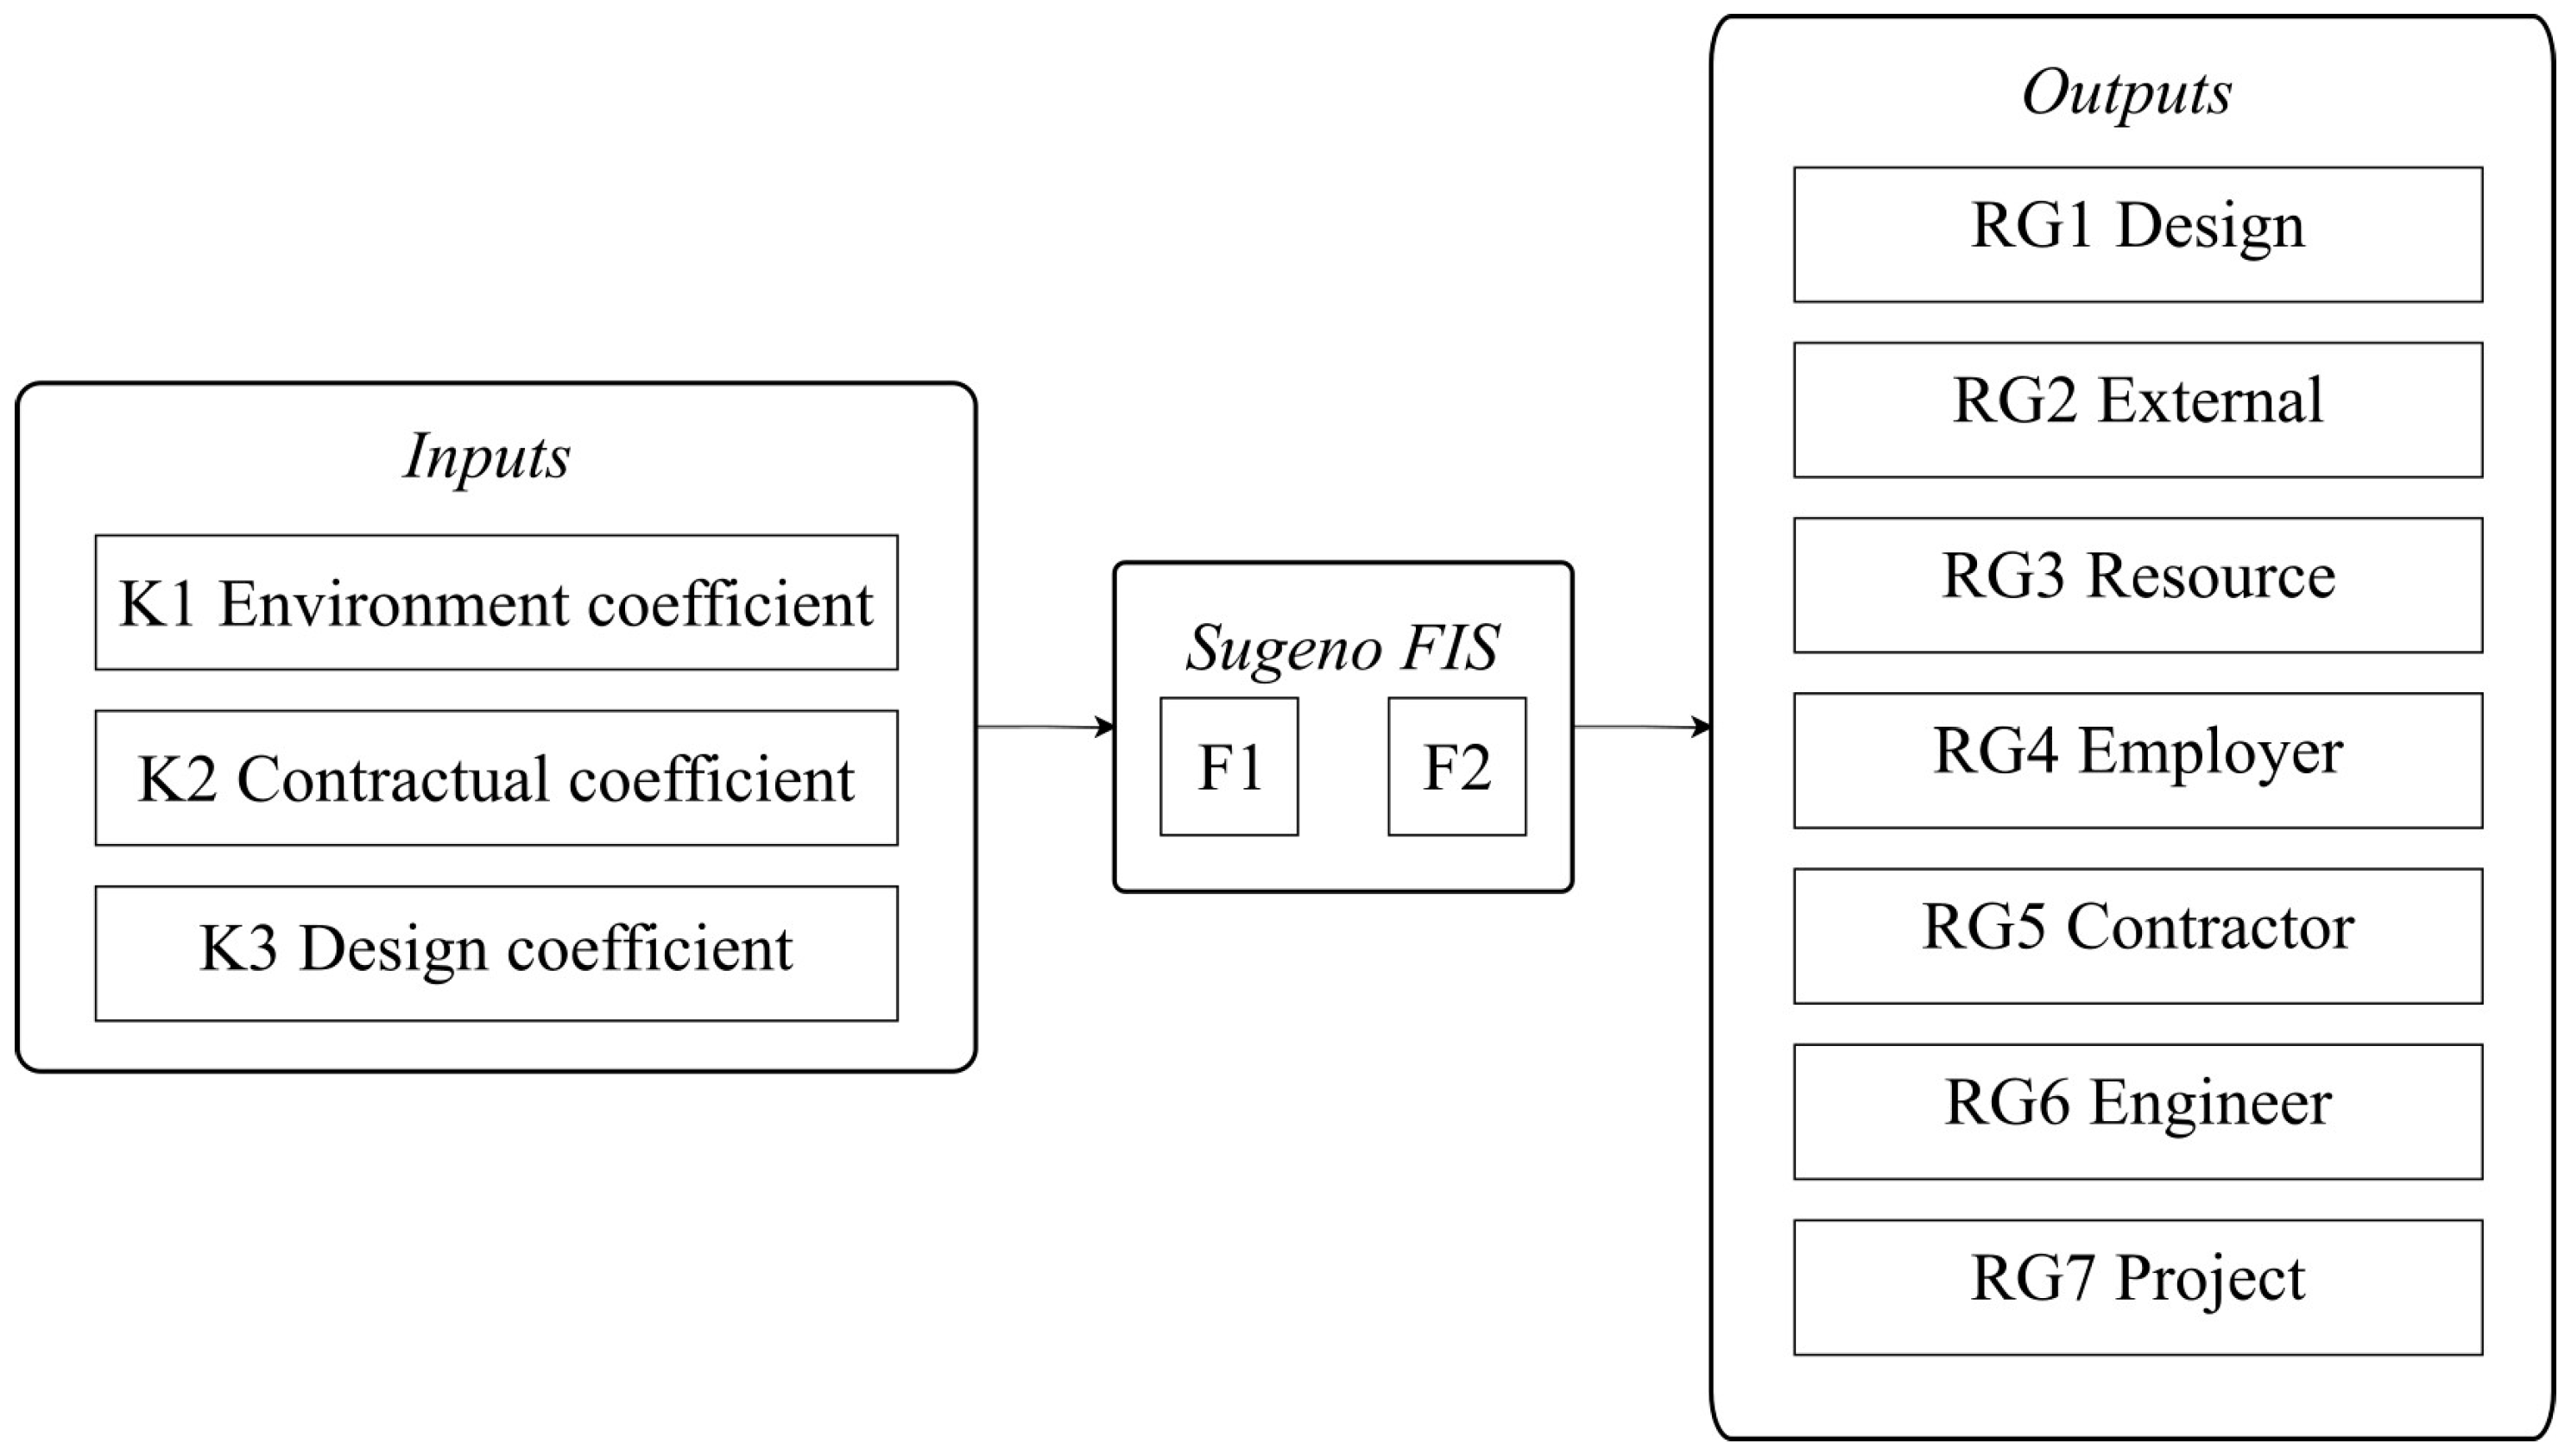
For the purposes of the study, two FISs were developed in MATLAB 2024a, both with identical structures, as shown in Figure 2. They differ in that one pertains to the occurrence of major risk groups (FIS F1) and the other to secondary risk groups (FIS F2). They were trained with different datasets, using the same input variables but yielding distinct output values representing probabilities for major and secondary risk groups. The systems consist of three input (coefficients: K1–K3) and seven output (risk groups: RG1–RG7) variables. The obtained probability values for the risk groups at the output can be used, based on Equation (1), to determine the probability of each individual risk within the groups.

Figure 2.
Structure of the developed fuzzy inference systems.
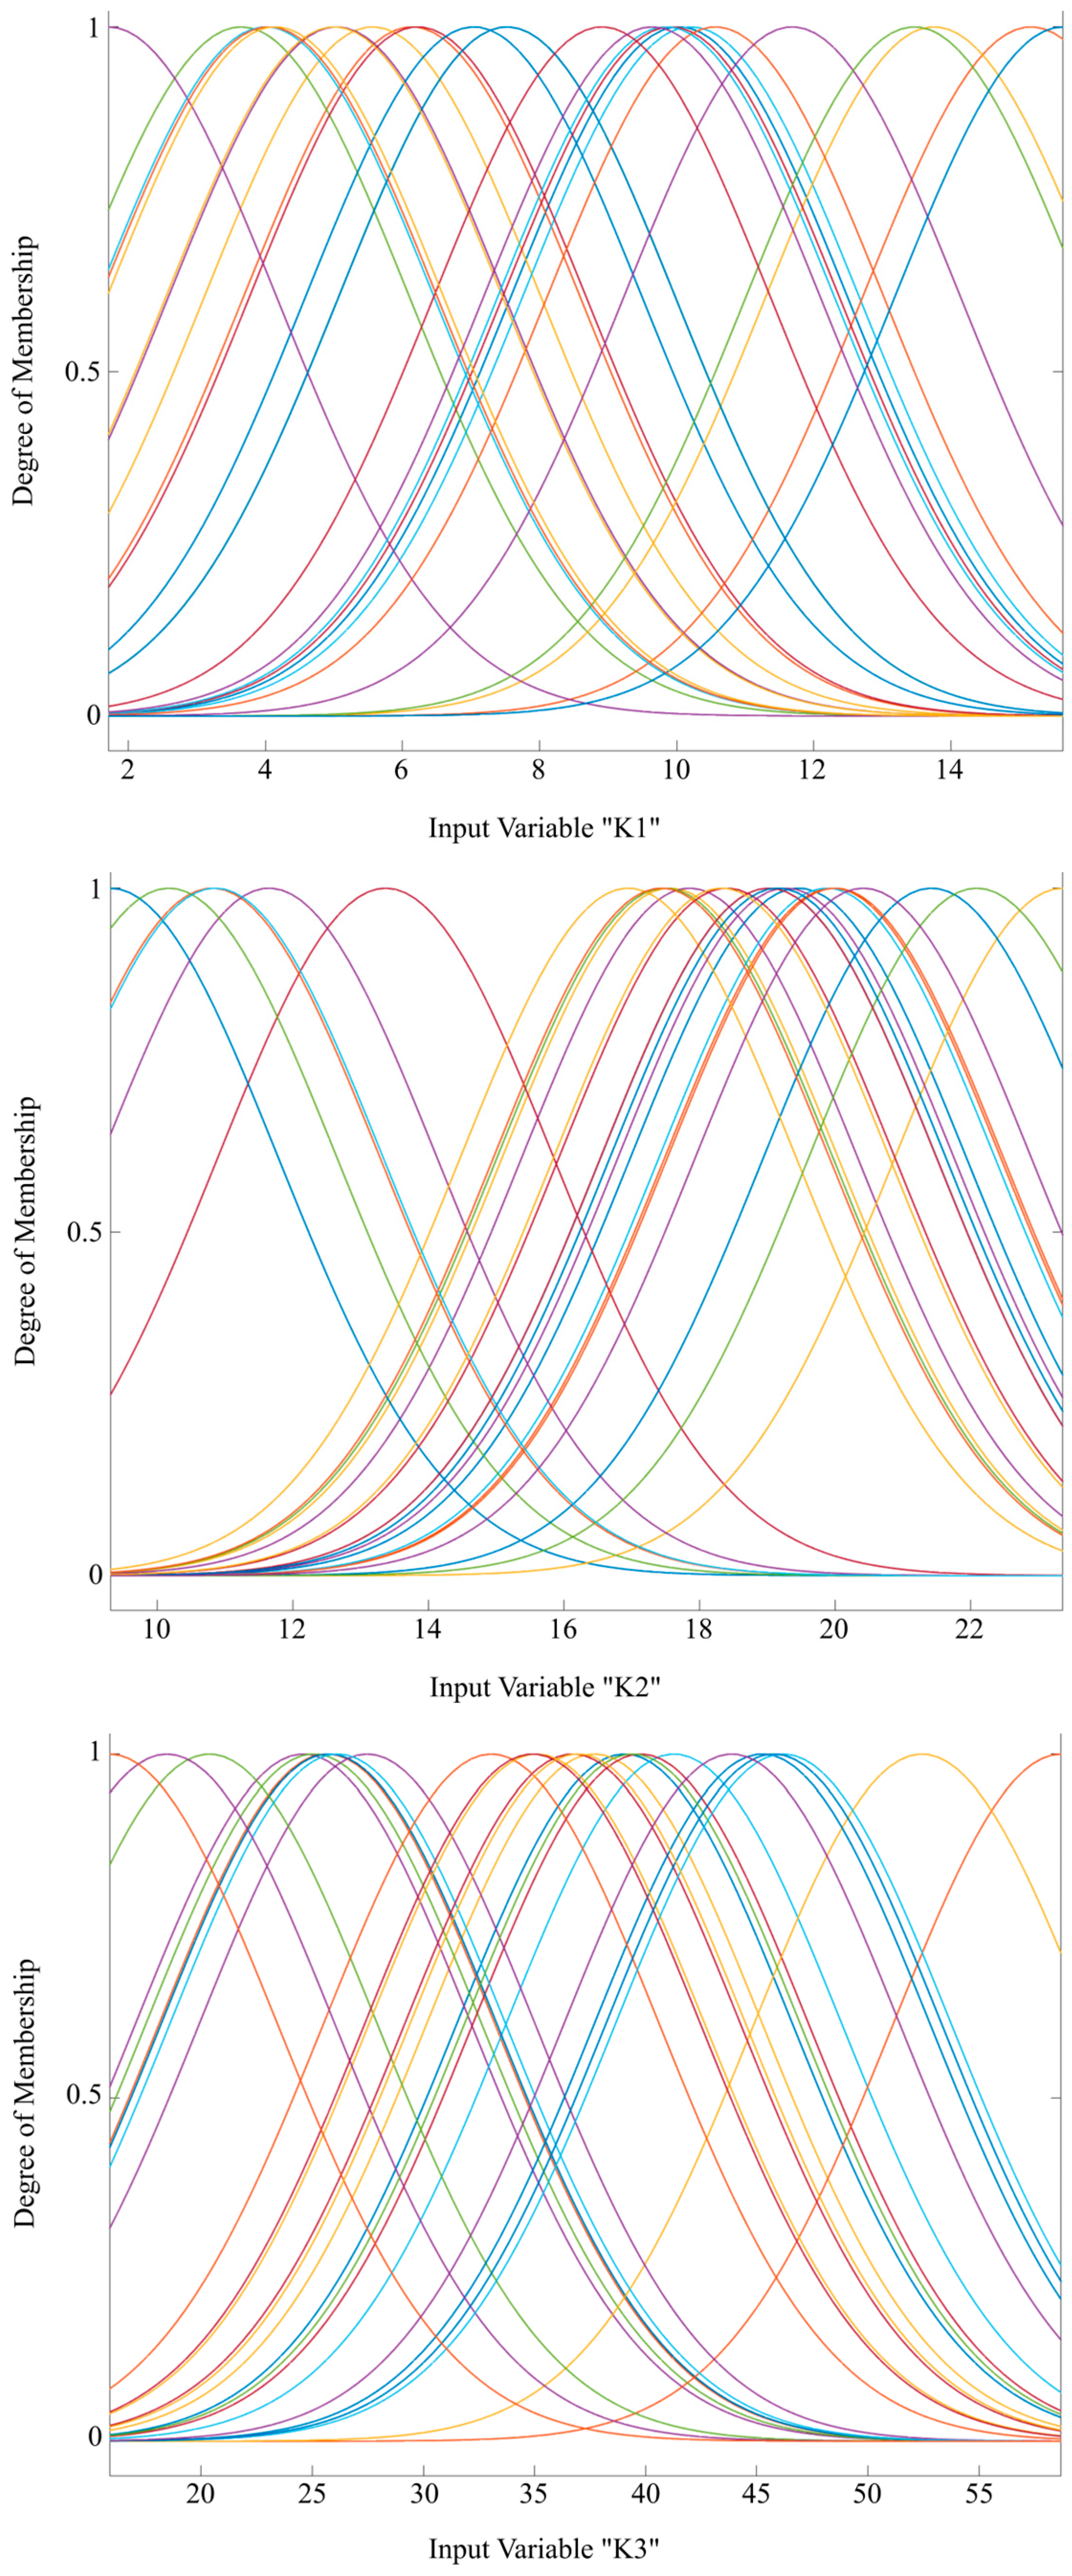
In Figure 3, the input variables in fuzzy logic systems F1 and F2 are presented, along with their basic characteristics, degree of membership, and value ranges, as can be inferred from the figure. Gaussian functions were used to describe the input variables, while the seven output variables were modeled using linear functions. Gaussian membership functions provide continuous and smooth transitions between fuzzy sets, which is crucial for accurately modeling uncertainty in complex projects. Compared to other membership functions (e.g., triangular or trapezoidal), Gaussian functions are less sensitive to noise in the input data, making them more stable in real-world applications. Additionally, Gaussian functions are differentiable everywhere, facilitating the optimization and fine-tuning of fuzzy logic models, especially when combined with machine learning techniques. Linear output functions allow for faster computation compared to more complex nonlinear functions, making the model more practical for real-time applications. In a Sugeno-type system, using linear output functions simplifies the defuzzification process, ensuring that final risk probabilities are computed efficiently. As previously mentioned, two fuzzy logic systems were created, and for this purpose, two datasets were prepared for their training. The input parameters remain the same, while the outputs differ, as they pertain to the probabilities of risk group occurrences as major and secondary.
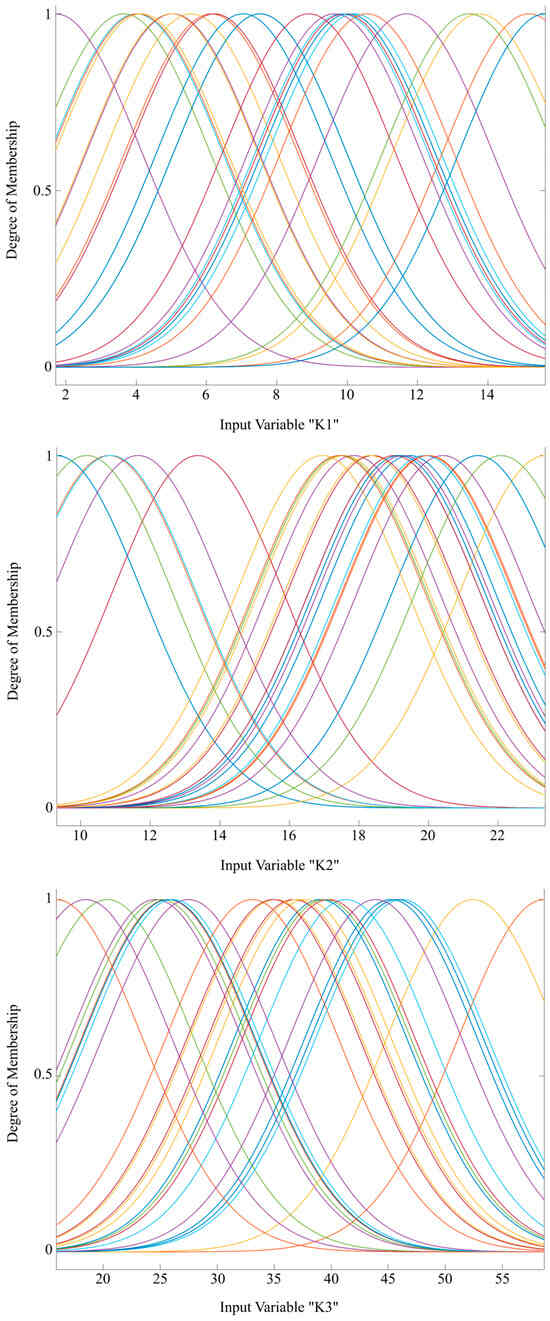
Figure 3.
Input variables K1, K2, and K3 with 25 membership functions. Note: Different colors designate different membership functions.
As stated earlier, the available data originate from a dataset comprising 28 road infrastructure projects in the Republic of Serbia. With three projects set aside for testing, 25 fuzzy rules were generated based on the remaining 25 projects. It is important to emphasize that systems of this type can always be improved by expanding their training datasets, thereby increasing the number of rules and, consequently, enhancing the accuracy and reliability of output modeling during application. This adaptability makes them particularly useful in dynamic and complex environments, such as risk assessment in infrastructure projects.
From Figure 3, it can be concluded that the membership functions for the input variable K1 are relatively evenly distributed, with overlaps that allow for smooth transitions between fuzzy sets. For the variable K2, a denser distribution of membership functions is noticeable in the central part of the domain, which may indicate higher precision in that segment. In the case of the variable K3, the domain is significantly wider compared to the previous variables, and the large number of membership functions with substantial overlap suggests a detailed segmentation of values.
The testing of the developed systems was conducted using data from three real road infrastructure projects in the Republic of Serbia. Table 4 presents the data for the probabilities of major risk groups from the real system, as well as the corresponding simulated indicators obtained as outputs from the fuzzy logic system F1, along with the associated deviations.
Table 4.
Testing results for the fuzzy logic system F1 with average deviation.
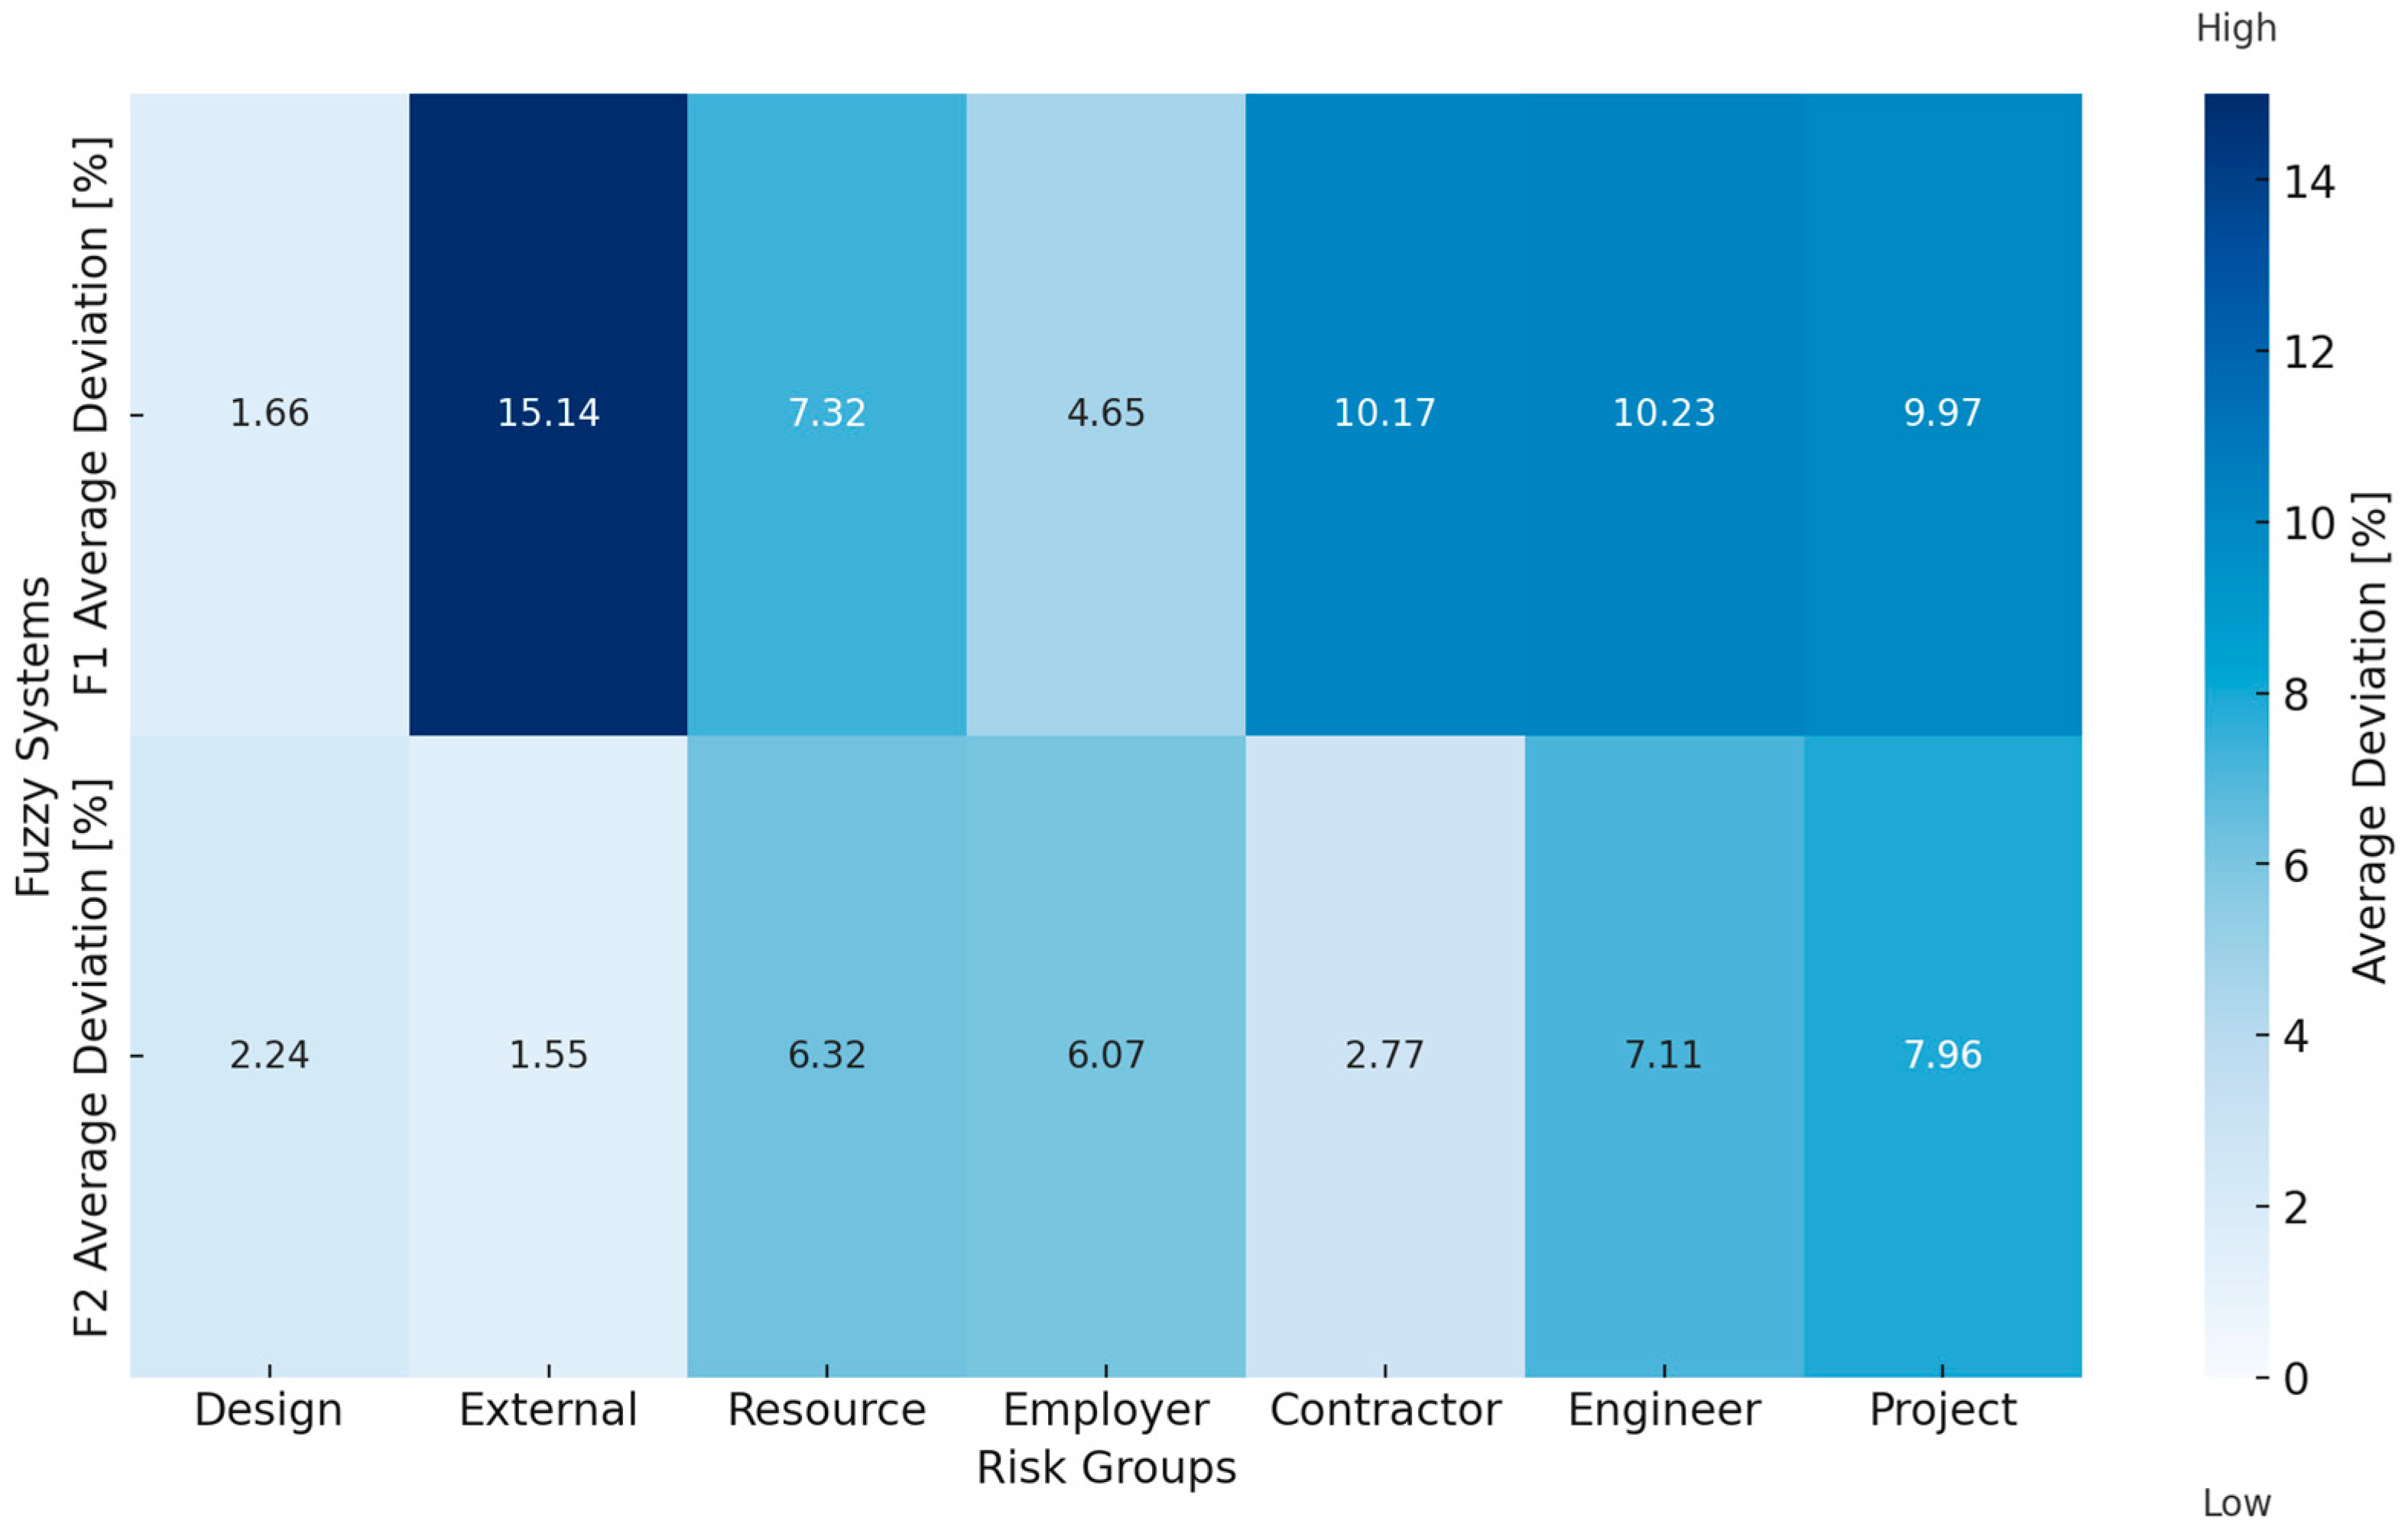
It is evident that the highest average deviation occurs in the “External” risk category, which may indicate greater variability or the model’s lower ability to accurately predict this category. On the other hand, the smallest deviation is observed in the “Design” risk category, suggesting that the model approximates this group well. Additionally, the “Contractor” and “Engineer” risk categories exhibit similar, slightly more significant deviations, while the other categories remain more moderate. The overall average deviation across all categories indicates relatively solid model accuracy but with room for improvement, especially in categories with higher deviations.
Table 5 presents the data for the probabilities of secondary risk groups from the real system, as well as the corresponding simulated indicators obtained as outputs from the fuzzy logic system F2, along with the associated deviations.
Table 5.
Testing results for the fuzzy logic system F2 with average deviation.
In this case, evident improvements in accuracy can be observed across almost all risk categories; however, there is still room for further enhancements, particularly in the assessment of “Project” and “Engineer” risks.
The testing results of the fuzzy logic systems F1 and F2 demonstrate varying levels of accuracy in estimating the probabilities for different risk groups. However, as observed in the heatmap (Figure 4), the deviations for certain risk groups are at a similar or comparable level. The overall average deviation for both fuzzy logic systems is less than 10%. The difference in accuracy between these fuzzy systems is a result of the differing structures of the training datasets. At the planning and development stage, this level of accuracy meets the requirements. The further optimization of membership functions and rules could help reduce deviations, particularly for categories with larger errors, thereby enhancing both systems for specific applications.
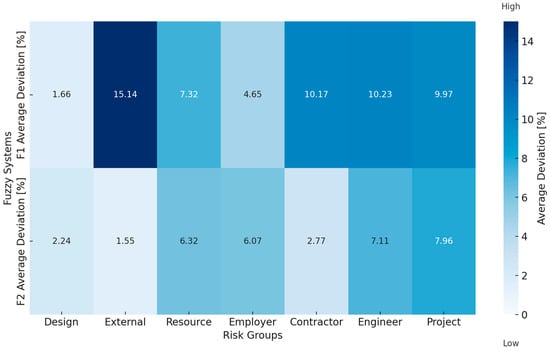
Figure 4.
Comparison of average deviations for F1 and F2 by risk groups.
The obtained probability values for the occurrence of risk groups can be used to calculate the probabilities of occurrence for each individual risk within the groups.
3.3. Case Study of Mamdani Fuzzy Logic System
In the case of the Mamdani FIS approach, we investigated the same relationships between the variables of interest as in the case of Sugeno FIS structures. First, we divided the input and output spaces of the given numerical data into fuzzy regions. Each variable was described by five fuzzy regions, i.e., five membership functions. The domain interval of each variable was determined by the interval of the possible values from the sample. By applying adequate programming code, as described in Section 2, we obtained the fuzzy rule database. Finally, the obtained FIS structures were tested on the controlling sample, and the achieved performance is shown in Table 6 and Table 7.
Table 6.
Test results for the Mamdani fuzzy logic system F1 with average deviation.
Table 7.
Test results for the Mamdani fuzzy logic system F2 with average deviation.
3.4. Model for Determining the Probability of Individual Risks
Risk assessment in road infrastructure projects requires a structured approach to quantify the probability of occurrence of individual risks. Since each risk group consists of multiple individual risks, refining probability estimation at the individual level is essential. This methodology establishes a systematic process for determining the probability of each specific risk by integrating fuzzy-logic-based outputs with empirical data from real-world projects.
Risk Probability Model Structure
The probability of each individual risk Ri is determined by combining multiple factors. First, the probability of the corresponding risk group RGj is obtained from the Sugeno fuzzy inference model. Next, the relative frequency of the specific risk within its group is derived from empirical project data, as presented in Table 3. Finally, adjustment factors are applied to account for project-specific uncertainties, particularly the potential impact of risks on Extension of Time (EoT) and Increasing Contract Price (ICP). This integrated approach ensures a more precise estimation of risk probabilities while considering both historical data and project-specific conditions.
Since certain risks contribute more significantly to delays (EoT) or cost overruns (ICP), the model separately evaluates these two aspects using the following equations:
where:
- P(RiEoT), P(RiICP)—probability of the specific risk Ri in relation to EoT and ICP, respectively;
- P(RGj)—probability of the corresponding risk group RGj, determined through Sugeno fuzzy inference model;
- P(Ri/RGj)—relative frequency of individual risk Ri within its risk group RGj, derived from empirical project data (Table 3);
- EoT—expected project delay factor (percentage of total project duration);
- ICP—expected cost increase factor (percentage of total project budget);
- —weighting coefficients reflecting the sensitivity of individual risks to time and cost impacts.
This approach ensures that the risk probabilities are not only assessed in absolute terms, but are also adjusted based on their potential impact on project duration and cost overruns. By integrating historical risk occurrence rates (Table 3) with fuzzy model predictions, this methodology enables project managers to systematically quantify and mitigate risks, providing a practical decision-making framework for improving control over project timelines, costs, and overall risk exposure.
4. Discussion
The machine learning models applied in this study did not yield satisfactory results in risk prediction, which can be attributed to dataset limitations. The analysis revealed that input variables did not exhibit strong linear dependencies with all output variables, with only moderate correlations observed between certain variables. Additionally, some negative correlations suggest that increasing project complexity may reduce the probability of certain risks. These findings indicate that the dataset lacks sufficient variability to fully capture complex relationships, affecting the performance of machine learning models [53,54,55]. One of the key findings is that the coefficient of determination (R2) remained negative across all models, even after dataset expansion. This suggests that the models struggled with generalization, which is a common issue in machine learning when dealing with small datasets and high-dimensional problems [54,56]. The neural network model performed poorly, which was expected, as deep learning techniques typically require substantially larger training sets to avoid overfitting [57,58]. Small datasets can limit the learning capacity of machine learning models, particularly when the relationships between variables are weak or nonlinear. In such cases, models may fail to distinguish between signal and noise, leading to unstable and unreliable predictions [53,54,55].
Comparing these results with findings from previous research, it is evident that datasets with fewer than a few thousand examples rarely produce strong machine learning models for predictive risk assessment [26,27,28,29]. Studies that have successfully applied machine learning for risk modeling typically use larger datasets featuring engineering techniques and hybrid modeling approaches to improve accuracy [27,28,59].
For instance, prior research has shown that Random Forest and Gradient Boosting models can effectively capture nonlinear risk patterns, but only when the dataset is sufficiently large and diverse [28,54]. Similarly, studies utilizing hybrid fuzzy logic and machine learning approaches have reported improved results, particularly in domains where uncertainty and limited data availability are key challenges [46,59,60,61]. These insights highlight the importance of data quality and preprocessing in risk prediction models. While machine learning holds significant potential for improving risk assessment methodologies, its effectiveness largely depends on data availability, feature selection, and model optimization.
On the other hand, fuzzy logic provided very promising results, particularly the Sugeno FIS. In Figure 5 and Figure 6, comparisons between the Sugeno and Mamdani FIS structures are made. As can be noticed, from 14 considered scenarios, the Sugeno outperformed the Mamdani FIS in 12 cases.
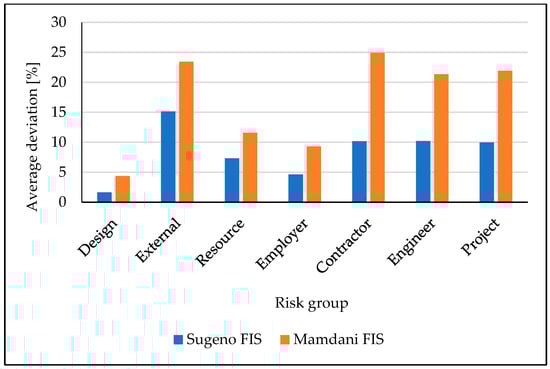
Figure 5.
Comparison of average deviations between the Sugeno and Mamdani FIS structures for F1 by risk groups.
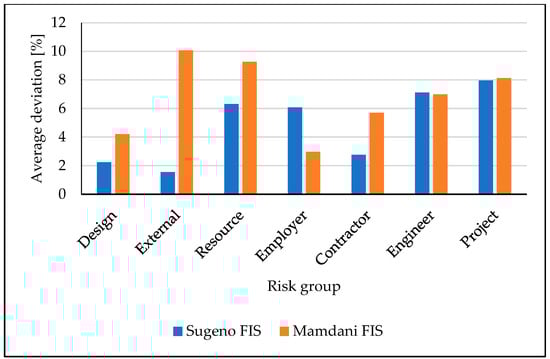
Figure 6.
Comparison of average deviations between the Sugeno and Mamdani FIS structures for F2 by risk groups.
This study demonstrates the Sugeno FIS’s accuracy and practicality for risk management in road infrastructure projects. The calculated probabilities of individual risks and their prioritization provide a clear foundation for targeted preventive measures. With deviations from real-world data averaging below 10%, the model ensures reliability and precision, enabling stakeholders to proactively address risks and improve project outcomes. These results highlight the model’s applicability as a focused and efficient tool for advancing risk management practices in road infrastructure development.
Future research should focus on expanding the dataset with real-world projects from diverse regions to improve the model’s generalizability and quality. Incorporating additional project characteristics, such as advanced environmental factors or technological innovations, could enhance the model’s complexity assessment. Developing a dynamic framework that updates probabilities in real time based on project progress and external influences would improve its practical applicability. The validation of the model across different types of infrastructure, such as railways or airports, could test its versatility. Moreover, creating user-friendly software tools and evaluating the effectiveness of identified preventive measures could further enhance the model’s practical utility for risk management [62].
4.1. Expanding the Dataset
By minimizing resource wastage and providing a standardized framework, the model contributes to sustainable project practices. Expanding the dataset to include projects from diverse geographical regions and infrastructure sectors, such as railways and airports, will enhance the model’s generalizability and accuracy. Incorporating data from international projects will allow the identification of broader patterns and region-specific risk factors, contributing to a stronger and more adaptive framework. Such an expanded dataset will not only improve predictive accuracy, but also provide insights into diverse infrastructural challenges, fostering a more comprehensive approach to risk management. To enhance predictive performance and improve model generalization, future work should focus on expanding the dataset to at least 1500 samples, ensuring greater variability in input variables; exploring additional input parameters that may contribute to more accurate predictions; and employing alternative data augmentation techniques to enhance dataset informativeness.
4.2. Developing a Dynamic System
A dynamic system capable of updating risk probabilities in real time based on project progress and external influences (e.g., weather conditions or changes in material costs) would significantly enhance the model’s practicality and adaptability. Such a system would enable project managers to respond swiftly to emerging risks and optimize decision making throughout the project lifecycle. By integrating real-time monitoring tools, such as sensors, IoT devices, and predictive analytics, a dynamic system could provide continuous updates on key risk indicators. This would allow for proactive adjustments to project plans, resource allocation, and risk mitigation strategies, reducing the likelihood of major disruptions. The implementation of a dynamic system would bridge the gap between static risk models and the dynamic nature of real-world projects, ensuring more effective risk management and project resilience.
4.3. Enhancing Expert Validation
The greater involvement of multidisciplinary experts in defining fuzzy logic rules, combined with quantitative methods to reduce subjectivity, is essential for improving the model’s reliability and applicability across diverse project contexts. Engaging experts with diverse specializations, including environmental engineering, structural design, and risk analysis, ensures that the model captures the full spectrum of project-specific complexities and uncertainties. Additionally, iterative validation sessions, where experts review and refine fuzzy logic rules based on real-world scenarios, can help align the model with practical challenges. This process can be supplemented with sensitivity analyses to identify and address any inconsistencies in the model’s outputs. By fostering collaboration among experts and leveraging advanced validation techniques, the model can evolve into a highly reliable tool for proactive risk management in infrastructure projects.
4.4. Testing in International Contexts
Testing the model in an international context, where legal and infrastructural frameworks vary significantly, would provide valuable insights into its flexibility, scalability, and ability to address region-specific challenges. International testing can uncover region-specific risk factors, such as unique environmental conditions, regulatory constraints, or cultural approaches to project management. These insights can enhance the model’s ability to adapt to diverse project environments. Legal and infrastructural differences across countries can reveal how the model performs under various compliance requirements, ensuring it remains relevant and practical in different jurisdictions. By validating the model across diverse infrastructural and geographical conditions, its potential as a global standard for risk management can be firmly established. Through international testing, the model can evolve into a universal framework capable of addressing the complexities of diverse infrastructure projects, thus ensuring its broad applicability and long-term impact.
These research directions would not only increase the model’s accuracy, but also broaden its application in risk management for infrastructure projects globally. Collaboration among researchers, policymakers, and industry stakeholders is essential to fully realize the model’s potential in revolutionizing risk management for global infrastructure projects.
5. Conclusions
This study presents the development and application of a hybrid model for risk assessment and management in road infrastructure projects. The model successfully integrates project-specific characteristics, expert evaluations, empirical data, and probabilistic methods to quantify the probabilities of risk occurrence. By systematically addressing major and secondary risks, the model enables project managers to identify critical risks and implement targeted preventive measures, thereby reducing potential delays and cost overruns. This study offers a practical framework that combines predictive accuracy with adaptability, addressing common challenges in road infrastructure projects and enhancing decision-making processes.
The application of machine learning in this study did not yield satisfactory results in predicting risk probabilities, primarily due to the small dataset size and the specific nature of the available data. Machine learning models, such as Random Forest, Gradient Boosting, and neural networks, typically require large and diverse datasets to learn complex patterns and relationships between variables effectively. In this study, despite dataset expansion, the coefficient of determination (R2) remained negative across all models, indicating that the models struggled with generalization and predictive accuracy. This limitation can be attributed to the high-dimensional nature of the problem, the limited variability in input features, and the lack of sufficient training examples, all of which hinder the ability of machine learning models to extract meaningful patterns. The neural network model, in particular, performed poorly, as expected, since deep learning methods require substantial amounts of data to avoid overfitting and to generalize effectively. These findings align with previous research indicating that machine learning models are highly sensitive to data availability and often fail to provide strong predictions when trained on small datasets.
In contrast, the application of fuzzy logic systems, particularly the Sugeno FIS, proved to be far more effective for risk assessment in road infrastructure projects. Fuzzy logic methods excel in scenarios where data availability is limited and where uncertainty and imprecision in expert assessments need to be systematically incorporated into the decision-making process. The comparison of Sugeno and Mamdani fuzzy inference systems demonstrated that Sugeno FIS consistently outperformed Mamdani FIS in 12 out of 14 tested scenarios, confirming its higher accuracy, stability, and predictive reliability. This suggests that fuzzy logic is better suited for modeling risk probabilities in cases where traditional machine learning struggles due to data constraints. By leveraging rule-based reasoning and expert-defined membership functions, Sugeno FIS was able to model uncertainty more effectively, producing risk assessments that closely aligned with real-world observations.
These results underscore the importance of selecting appropriate modeling techniques based on data characteristics. While machine learning approaches remain promising for large-scale risk prediction problems, their applicability in small-sample scenarios with complex interdependencies remains limited. Conversely, fuzzy logic systems, particularly Sugeno FIS, have demonstrated strong adaptability, making them a more suitable choice for risk assessment in infrastructure projects with constrained data availability. Future research should focus on expanding the dataset, improving feature selection methodologies, and integrating hybrid approaches that combine fuzzy logic with machine learning techniques to leverage the strengths of both paradigms for enhanced predictive accuracy.
Testing conducted on real-world road infrastructure projects demonstrated the Sugeno FIS model’s high reliability and accuracy, with average deviations from observed probabilities being less than 10%. This demonstrates the model’s potential to serve as a standardized tool for risk quantification, applicable across diverse project settings and adaptable to evolving project demands. This level of accuracy confirms the applicability of the methodology in real complex road infrastructure projects. By addressing key risks proactively, the model empowers stakeholders—investors, contractors, and policymakers—to make informed decisions, ensuring better resource allocation and operational efficiency. The hybrid model significantly enhances risk management by achieving an average deviation of less than 10%, which is notably lower than traditional methods. For instance, in Project 1, the model accurately predicted design risks with only a 1.66% deviation. Moreover, its ability to rank risks based on their probabilities allowed for targeted interventions, such as prioritizing measures against external factors with a high likelihood of occurrence (20.88%). Additionally, the integration of multiple analytical tools and datasets ensures that the model is both adaptable and comprehensive, making it a valuable asset for decision making in project planning and implementation.
The results demonstrate the model’s ability to streamline risk management, optimize resource use, and improve outcomes. By offering a structured and quantitative framework for assessing risks, the methodology contributes to safer, more efficient, and economically sustainable road infrastructure development. Its application provides project stakeholders with the necessary insights to proactively manage risks and achieve better control over project timelines and budgets.
While demonstrating the effectiveness of the developed hybrid model for risk assessment and management in road infrastructure projects, this study acknowledges several limitations. First, the accuracy and reliability of the model are inherently tied to the quality and volume of the input data. Increasing the dataset size with additional results from real-world projects would enhance the model’s quality and predictive accuracy, as more diverse scenarios and risk occurrences could be accounted for in the analysis. Second, the input data used in this study were derived from projects implemented within the territory of Serbia. While the validation was conducted by a panel of experts with extensive international experience, the applicability of the model’s results to other regions remains an open question. Differences in regulatory frameworks, environmental conditions, and project characteristics may affect the generalizability of the findings.
Additionally, the reliance on expert evaluations introduces a degree of subjectivity into the process. Although measures were taken to ensure the consistency and reliability of expert inputs, variations in judgments or interpretations could influence the derived probabilities and conclusions. Lastly, the integration of fuzzy logic, while highly effective for managing uncertainty, assumes that the defined rules and membership functions adequately represent real-world conditions. Further refinement and validation of these components may be necessary for broader applications. Despite these constraints, this research offers a solid basis for the future development and application of hybrid risk management models, with opportunities for expansion and refinement to address these identified challenges.
Future research should focus on expanding the dataset with real-world projects from diverse regions to improve the model’s generalizability and quality. Incorporating additional project characteristics, such as advanced environmental factors or technological innovations, could enhance the model’s complexity assessment. Developing a dynamic framework that updates probabilities in real time based on project progress and external influences would improve its practical applicability. The validation of the model across different types of infrastructure, such as railways or airports, could test its versatility. Moreover, creating user-friendly software tools and evaluating the effectiveness of identified preventive measures could further enhance the model’s practical utility for risk management.
To enhance predictive performance and improve model generalization, future work should focus on expanding the dataset to at least 1500 samples, ensuring greater variability in input variables; exploring additional input parameters that may contribute to more accurate predictions; and employing alternative data augmentation techniques to enhance dataset informativeness.
This study demonstrates the hybrid model’s accuracy and practicality for risk management in road infrastructure projects. The calculated probabilities of individual risks and their prioritization provide a clear foundation for targeted preventive measures. With deviations from real-world data averaging below 10%, the model ensures reliability and precision, enabling stakeholders to proactively address risks and improve project outcomes. These results highlight the model’s applicability as a focused and efficient tool for advancing risk management practices in road infrastructure development.
Author Contributions
Conceptualization, A.S.; methodology, A.S.; software, M.D. and Z.S.; validation, A.S. and Z.S.; formal analysis, A.S. and M.D.; investigation, A.S.; resources, A.S.; data curation, A.S.; writing—original draft preparation, A.S. and Z.S.; visualization, M.D. and N.S.; supervision, Z.S. and N.S.; writing—review and editing, A.S., M.D., Z.S. and N.S.; project administration, M.D and N.S. All authors have read and agreed to the published version of the manuscript.
Funding
This research received no external funding.
Institutional Review Board Statement
Not applicable.
Informed Consent Statement
Not applicable.
Data Availability Statement
The data supporting the reported results are available upon request.
Conflicts of Interest
The authors declare no conflicts of interest.
References
- Bian, Y.; Chen, H.; Liu, Z.; Chen, L.; Guo, Y.; Yang, Y. Geological Disaster Susceptibility Evaluation Using Machine Learning: A Case Study of the Atal Tunnel in Tibetan Plateau. Sustainability 2024, 16, 4604. [Google Scholar] [CrossRef]
- Lee, J.; Jung, D.; Baek, C.; Hu, Y.-C.; Lin, M.-H.; Tsai, J.-F.; Nguyen, P.-H.; Lu, M.-T.; Lee, J.; Jung, D.; et al. An Analytical Study Predicting Future Conditions and Application Strategies of Concrete Bridge Pavement Based on Pavement Management System Database. Sustainability 2023, 15, 16680. [Google Scholar] [CrossRef]
- Sareen, S.; Remme, D.; Haarstad, H. E-Scooter Regulation: The Micro-Politics of Market-Making for Micro-Mobility in Bergen. Environ. Innov. Soc. Transit. 2021, 40, 461–473. [Google Scholar] [CrossRef]
- Sa’dl Issa Alkhawaja, A.; Varouqa, I.F. Risks Management of Infrastructure Line Services and Their Impact on the Financial Costs of Road Projects in Jordan. Meas. Sens. 2023, 25, 100647. [Google Scholar] [CrossRef]
- Khatleli, N. Risk Management in Construction Projects; IntechOpen Limited: London UK, 2020. [Google Scholar]
- Trifunović, A.; Senić, A.; Čičević, S.; Ivanišević, T.; Vukšić, V.; Simović, S. Evaluating the Road Environment Through the Lens of Professional Drivers: A Traffic Safety Perspective. Mechatron. Intell. Transp. Syst. 2024, 3, 31–38. [Google Scholar] [CrossRef]
- Simić, N.; Ivanišević, N.; Nedeljković, Ð.; Senić, A.; Stojadinović, Z.; Ivanović, M. Early Highway Construction Cost Estimation: Selection of Key Cost Drivers. Sustainability 2023, 15, 5584. [Google Scholar] [CrossRef]
- Senić, A.; Dobrodolac, M.; Stojadinović, Z. Predicting Extension of Time and Increasing Contract Price in Road Infrastructure Projects Using a Sugeno Fuzzy Logic Model. Mathematics 2024, 12, 2852. [Google Scholar] [CrossRef]
- Greenan, M.; Toussaint, M.; Peek-Asa, C.; Rohlman, D.; Ramirez, M.R. The Effects of Roadway Characteristics on Farm Equipment Crashes: A Geographic Information Systems Approach. Inj. Epidemiol. 2016, 3, 31. [Google Scholar] [CrossRef]
- Pešić, A.; Stephens, A.N.; Newnam, S.; Čičević, S.; Pešić, D.; Trifunović, A. Youth Perceptions and Attitudes towards Road Safety in Serbia. Systems 2022, 10, 191. [Google Scholar] [CrossRef]
- Marković, N.; Ivanišević, T.; Čičević, S.; Trifunović, A. Fuzzy Logic Model for Assessing Accident Proneness Based on Passenger Vehicle Speed in Real and Virtual Traffic Conditions. Mathematics 2024, 12, 421. [Google Scholar] [CrossRef]
- Jamroz, K.; Budzyński, M.; Kustra, W.; Michalski, L.; Gaca, S. Tools for Road Infrastructure Safety Management—Polish Experiences. Transp. Res. Procedia 2014, 3, 730–739. [Google Scholar] [CrossRef]
- Makarova, I.; Yakupova, G.; Buyvol, P.; Abashev, A.; Mukhametdinov, E. Risk Management Methodology for Transport Infrastructure Security. Infrastructures 2022, 7, 81. [Google Scholar] [CrossRef]
- Buffarini, G.; Clemente, P.; Giovinazzi, S.; Ormando, C.; Pollino, M.; Rosato, V. Preventing and Managing Risks Induced by Natural Hazards to Critical Infrastructures. Infrastructures 2022, 7, 76. [Google Scholar] [CrossRef]
- Li, Y.; Chen, Y. A New Method Based on Field Strength for Road Infrastructure Risk Assessment. J. Adv. Transp. 2018, 2018, 6379146. [Google Scholar] [CrossRef]
- Rusim, D.A.; Parung, H.; Latief, R.U.; Tjaronge, W. Risk Analysis of Time on Road Infrastructure Development (Case Study: Construction Industry in Papua). IOP Conf. Ser. Earth Environ. Sci. 2019, 235, 012077. [Google Scholar] [CrossRef]
- Senić, A.; Dobrodolac, M.; Stojadinović, Z. Development of Risk Quantification Models in Road Infrastructure Projects. Sustainability 2024, 16, 7694. [Google Scholar] [CrossRef]
- Razi, P.Z.; Ali, M.I.; Ramli, N.I. Exploring Risk Associated to Public Road Infrastructure Construction Projects. IOP Conf. Ser. Earth Environ. Sci. 2021, 682, 012030. [Google Scholar] [CrossRef]
- Alam, M.J.; Habib, M.A.; Quigley, K. Critical Infrastructure Renewal: A Framework for Fuzzy Logic Based Risk Assessment and Microscopic Traffic Simulation Modelling. Transp. Res. Procedia 2017, 25, 1397–1415. [Google Scholar] [CrossRef]
- Yazdani-Chamzini, A. Proposing a New Methodology Based on Fuzzy Logic for Tunnelling Risk Assessment. J. Civ. Eng. Manag. 2014, 20, 82–94. [Google Scholar] [CrossRef]
- Sharma, K.; Trivedi, M.K. Risk Analysis in Highway Construction Projects Using Failure Mode & Effect Analysis. Int. J. Res. Appl. Sci. Eng. Technol. 2019, 7, 311–318. [Google Scholar] [CrossRef]
- Subya, R.; Manoj, M. Risk Assessment of Highway Construction Projects Using Fuzzy Logic and Multiple Regression Analysis. Int. Res. J. Eng. Technol. 2017, 4, 2344. [Google Scholar]
- Vygnanov, A.A.; Fironov, A.N. Fuzzy-Logic Expert System to Estimate the Risks of High-Speed Railways Projects. Autobusy Tech. Eksploat. Syst. Transp. 2017, 18, 651–655. [Google Scholar]
- Deshpande, P.; Valunjkar, S.S. Risk Management in Highway Project Using Fuzzy Logic. Int. Res. J. Mod. Eng. Technol. Sci. 2020, 2, 2582–5208. [Google Scholar]
- Afzal, F.; Yunfei, S.; Nazir, M.; Bhatti, S.M. A Review of Artificial Intelligence Based Risk Assessment Methods for Capturing Complexity-Risk Interdependencies: Cost Overrun in Construction Projects. Int. J. Manag. Proj. Bus. 2021, 14, 300–328. [Google Scholar] [CrossRef]
- Tayefeh Hashemi, S.; Ebadati, O.M.; Kaur, H. Cost Estimation and Prediction in Construction Projects: A Systematic Review on Machine Learning Techniques. SN Appl. Sci. 2020, 2, 1703. [Google Scholar] [CrossRef]
- Gondia, A.; Siam, A.; El-Dakhakhni, W.; Nassar, A.H. Machine Learning Algorithms for Construction Projects Delay Risk Prediction. J. Constr. Eng. Manag. 2019, 146, 04019085. [Google Scholar] [CrossRef]
- Shoar, S.; Chileshe, N.; Edwards, J.D. Machine Learning-Aided Engineering Services’ Cost Overruns Prediction in High-Rise Residential Building Projects: Application of Random Forest Regression. J. Build. Eng. 2022, 50, 104102. [Google Scholar] [CrossRef]
- Assaad, R.; El-Adaway, I.H. Bridge Infrastructure Asset Management System: Comparative Computational Machine Learning Approach for Evaluating and Predicting Deck Deterioration Conditions. J. Infrastruct. Syst. 2020, 26, 04020032. [Google Scholar] [CrossRef]
- Bae, J.; Yum, S.-G.; Kim, J.-M.; Rodríguez-Rivero, R.; Ortiz-Marcos, I. Harnessing Machine Learning for Classifying Economic Damage Trends in Transportation Infrastructure Projects. Sustainability 2021, 13, 6376. [Google Scholar] [CrossRef]
- Papadimitriou, E.; Filtness, A.; Ziakopoulos, A.; Theofilatos, A.; Yannis, G. Comparative Assessment and Ranking of Infrastructure Related Crash Risk Factors. In Proceedings of the Road Safety & Simulation International Conference 2017, The Hague, The Netherland, 17–19 October 2017. [Google Scholar]
- Appleton, I. Road Safety Data: Collection and Analysis for Target Setting and Monitoring Performances and Progress Road Infrastructure Safety Assessment; New Zealand Transport Agency: Wellington, New Zealand, 2009.
- Lozano-Ramírez, N.E.; Sánchez, O.; Carrasco-Beltrán, D.; Vidal-Méndez, S.; Castañeda, K. Digitalization and Sustainability in Linear Projects Trends: A Bibliometric Analysis. Sustainability 2023, 15, 15962. [Google Scholar] [CrossRef]
- Zakarka, M.; Skuodis, Š.; Dirgėlienė, N. Triaxial Test of Coarse-Grained Soils Reinforced with One Layer of Geogrid. Appl. Sci. 2023, 13, 12480. [Google Scholar] [CrossRef]
- Kapatsa, C.; Kavishe, N.; Maro, G.; Zulu, S. The Identification of Sustainability Assessment Indicators for Road Infrastructure Projects in Tanzania. Sustainability 2023, 15, 14840. [Google Scholar] [CrossRef]
- Canesi, R.; Gallo, B. Risk Assessment in Sustainable Infrastructure Development Projects: A Tool for Mitigating Cost Overruns. Land 2023, 13, 41. [Google Scholar] [CrossRef]
- Fayaz, M.; Ullah, I.; Kim, D.H. Underground Risk Index Assessment and Prediction Using a Simplified Hierarchical Fuzzy Logic Model and Kalman Filter. Processes 2018, 6, 103. [Google Scholar] [CrossRef]
- Tah, J.H.M.; Carr, V. A Proposal for Construction Project Risk Assessment Using Fuzzy Logic. Constr. Manag. Econ. 2000, 18, 491–500. [Google Scholar] [CrossRef]
- Ivanović, M.Z.; Nedeljković, Đ.; Stojadinović, Z.; Marinković, D.; Ivanišević, N.; Simić, N. Detection and In-Depth Analysis of Causes of Delay in Construction Projects: Synergy between Machine Learning and Expert Knowledge. Sustainability 2022, 14, 14927. [Google Scholar] [CrossRef]
- Senić, A.; Ivanović, M.; Dobrodolac, M.; Stojadinović, Z. Prioritization of Preventive Measures: A Multi-Criteria Approach to Risk Mitigation in Road Infrastructure Projects. Mathematics 2025, 13, 278. [Google Scholar] [CrossRef]
- Wang, L.X.; Mendel, J.M. Generating Fuzzy Rules by Learning from Examples. IEEE Trans. Syst. Man Cybern. 1992, 22, 1414–1427. [Google Scholar] [CrossRef]
- Čubranić-Dobrodolac, M.; Švadlenka, L.; Čičević, S.; Dobrodolac, M. Modelling Driver Propensity for Traffic Accidents: A Comparison of Multiple Regression Analysis and Fuzzy Approach. Int. J. Inj. Contr. Saf. Promot. 2020, 27, 156–167. [Google Scholar] [CrossRef]
- Tabakov, M.; Chlopowiec, A.B.; Chlopowiec, A.R. A Novel Classification Method Using the Takagi–Sugeno Model and a Type-2 Fuzzy Rule Induction Approach. Appl. Sci. 2023, 13, 5279. [Google Scholar] [CrossRef]
- Benzaouia, A.; El Hajjaji, A. Advanced Takagi–Sugeno Fuzzy Systems; Springer Nature: Dordrecht, The Netherlands, 2014; Volume 8. [Google Scholar] [CrossRef]
- Lendek, Z.; Guerra, T.M.; Babuška, R.; De Schutter, B. Stability Analysis and Nonlinear Observer Design Using Takagi–Sugeno Fuzzy Models. In Studies in Fuzziness and Soft Computing; Springer Nature: Dordrecht, The Netherlands, 2010; Volume 262, pp. 1–205. [Google Scholar] [CrossRef]
- Baghdadi, A.; Babovic, N.; Kloft, H. Fuzzy Logic, Neural Network, and Adaptive Neuro-Fuzzy Inference System in Delegation of Standard Concrete Beam Calculations. Building 2023, 14, 15. [Google Scholar] [CrossRef]
- Saralegui, R.; Sanchez, A.; de Castro, A. Efficient Hardware-in-the-Loop Models Using Automatic Code Generation with MATLAB/Simulink. Electronics 2023, 12, 2786. [Google Scholar] [CrossRef]
- Čubranić-Dobrodolac, M.; Jovčić, S.; Bošković, S.; Babić, D. A Decision-Making Model for Professional Drivers Selection: A Hybridized Fuzzy–AROMAN–Fuller Approach. Mathematics 2023, 11, 2831. [Google Scholar] [CrossRef]
- Pallant, J. SPSS Survival Manual, 3rd ed.; McGraw-Hill Open University Press: London, UK, 2007. [Google Scholar]
- Landau, S.; Everitt, B.S. A Handbook of Statistical Analyses Using SPSS|Enhanced Reader; Chapman and Hall/CRC: London, UK, 2003. [Google Scholar]
- Chadli, M.; Chadli, M.; Borne, P. Multiple Models Approach in Automation. In Takagi–Sugeno Fuzzy Systems; John Wiley & Sons: Hoboken, NJ, USA, 2012. [Google Scholar]
- Lin, C. LMI Approach to Analysis and Control of Takagi–Sugeno Fuzzy Systems with Time Delay; Springer: Berlin/Heidelberg, Germany, 2007; p. 204. [Google Scholar]
- Nandy, A.; Duan, C.; Kulik, H.J. Audacity of Huge: Overcoming Challenges of Data Scarcity and Data Quality for Machine Learning in Computational Materials Discovery. Curr. Opin. Chem. Eng. 2022, 36, 100778. [Google Scholar] [CrossRef]
- Hakami, A. Strategies for Overcoming Data Scarcity, Imbalance, and Feature Selection Challenges in Machine Learning Models for Predictive Maintenance. Sci. Rep. 2024, 14, 9645. [Google Scholar] [CrossRef]
- Bansal, A.; Sharma, R.; Kathuria, M. A Systematic Review on Data Scarcity Problem in Deep Learning: Solution and Applications. ACM Comput. Surv. 2022, 54, 1–29. [Google Scholar] [CrossRef]
- Babbar, R.; Schölkopf, B. Data Scarcity, Robustness and Extreme Multi-Label Classification. Mach. Learn. 2019, 108, 1329–1351. [Google Scholar] [CrossRef]
- Biedermann, A.; Taroni, F. Bayesian Networks and Probabilistic Reasoning about Scientific Evidence When There Is a Lack of Data. Forensic Sci. Int. 2006, 157, 163–167. [Google Scholar] [CrossRef]
- Ponzio, F.; Urgese, G.; Ficarra, E.; Di Cataldo, S. Dealing with Lack of Training Data for Convolutional Neural Networks: The Case of Digital Pathology. Electronics 2019, 8, 256. [Google Scholar] [CrossRef]
- Seresht, N.G.; Lourenzutti, R.; Salah, A.; Fayek, A.R. Overview of Fuzzy Hybrid Techniques in Construction Engineering and Management. In Fuzzy Hybrid Computing in Construction Engineering and Management; Emerald Publishing Limited: Leeds, UK, 2018; pp. 37–107. [Google Scholar] [CrossRef]
- Dhimish, M.; Holmes, V.; Mehrdadi, B.; Dales, M. Comparing Mamdani Sugeno Fuzzy Logic and RBF ANN Network for PV Fault Detection. Renew. Energy 2018, 117, 257–274. [Google Scholar] [CrossRef]
- Polap, D. Automatic Fuzzy Parameter Tuning for Neural Network Models. In Proceedings of the IEEE International Conference on Fuzzy Systems (FUZZ-IEEE), Padua, Italy, 18–23 July 2022. [Google Scholar] [CrossRef]
- Amato, F.; Querol, X.; Johansson, C.; Nagl, C.; Alastuey, A. A Review on the Effectiveness of Street Sweeping, Washing and Dust Suppressants as Urban PM Control Methods. Sci. Total Environ. 2010, 408, 3070–3084. [Google Scholar] [CrossRef] [PubMed]


Disclaimer/Publisher’s Note: The statements, opinions and data contained in all publications are solely those of the individual author(s) and contributor(s) and not of MDPI and/or the editor(s). MDPI and/or the editor(s) disclaim responsibility for any injury to people or property resulting from any ideas, methods, instructions or products referred to in the content. |
© 2025 by the authors. Licensee MDPI, Basel, Switzerland. This article is an open access article distributed under the terms and conditions of the Creative Commons Attribution (CC BY) license (https://creativecommons.org/licenses/by/4.0/).