Article

Design and Development of Supersonic Shockwave Soil-Loosening Device That Can Improve the Aeration of Crop Root Zone

1
Department of Management, Air Force Institute of Technology, Kaohsiung 820009, Taiwan
2
Bachelor Program in Artificial Intelligence and Mechatronics, Pingtung University of Science and Technology, Pingtung 912301, Taiwan
3
Bachelor of Program in Scientific Agriculture, Pingtung University of Science and Technology, Pingtung 912301, Taiwan
4
Department of Plant Industry, Pingtung University of Science and Technology, Pingtung 912301, Taiwan
*
Authors to whom correspondence should be addressed.
Appl. Sci. 2025, 15(5), 2714; https://doi.org/10.3390/app15052714
Submission received: 4 February 2025 / Revised: 27 February 2025 / Accepted: 1 March 2025 / Published: 3 March 2025

Abstract

:

Featured Application

The shockwave soil-loosening device developed in this paper can effectively improve the aeration of the soil in crops’ root zones. It can also significantly reduce the amount of carbon released during the tillage and soil-loosening process, which helps reduce agricultural carbon. We can expand this equipment into a shockwave hole fertilization device to conduct efficient hole-digging and fertilization operations on woody crops.

Abstract

When the soil at the plant roots is poorly ventilated due to few pores, the root system will grow short and shallow, leading to poor growth. In this paper, we developed a shockwave soil-loosening device. It can first drill a hollow drill bit containing multi-directional holes into the soil near the roots of the crops and then generate high-pressure gas to impact the soil outside the drill bit to increase the soil pores. Therefore, this can quickly improve soil aeration. We conducted numerical simulations of shockwave loosening to explore how 3.4 atm shockwaves are emitted from the drill bit’s porous nozzles and analyze the behavior and efficiency of shockwave loosening. We also performed visual observation experiments of shockwave multi-directional impact in a transparent acrylic water tank. Furthermore, we used eight pressure sensors to automatically measure the range of shockwave impact and found that when the storage tank volume was 5000 cm3, we could achieve a soil loosening range of 30 cm. Finally, this shockwave-loosening mechanism ensures that the soil surface will not be damaged during the loosening process, thus avoiding large-scale tillage disturbance of the soil. This will reduce carbon emissions stored in soil and released into the atmosphere.

1. Introduction

Soil supports the roots of plants and allows crops to grow. The minerals and organic matter in the soil can also provide a source of crop nutrients. The physical properties of soil, such as aeration, drainage, and texture thickness, determine the soil’s ability to supply water and nutrients and indirectly affect the survival of soil organisms and the growth of plants [1]. The plant root zone is the interface region between the soil and vegetation that controls the movement of water, nutrients, and other substances into the plant [2]. When soil aeration is high, it helps roots grow or move through soil pores [3]. Depending on the crop type, the distribution of crop roots in the soil will be different, and the oxygen requirements in the soil will also be different. Regarding soil physical properties, when there are few soil pores, it will lead to poor ventilation and shallow root growth. At this time, crops will have poor growth. Depending on the crop type, the distribution of crop roots in the soil will be different, and the oxygen requirements in the soil will also be different. The three-phase distribution of high-yield soil is as follows: solid phase rate, 40–57%; moisture content, 20–40%; and air content, 15–37%. When the soil air content is insufficient and the oxygen concentration in the root zone is too low, this will significantly inhibit root growth and greatly reduce the absorption of nutrients, such as nitrogen, phosphorus, potassium, calcium, magnesium, zinc, manganese, boron, and iron [4,5]. Soil with poor ventilation can quickly accumulate carbon dioxide or produce toxic gases such as hydrogen sulfide [6,7,8].
At present, the most common method to improve soil aeration is plowing, which uses blades or rakes to turn up the soil and chop the caked soil into pieces, which is used to turn and loosen the soil to create a more suitable environment for growing crops (as shown in Figure 1). Although plowing can effectively loosen soil, increase soil porosity and improve soil permeability and aeration [9], Ben and Friedman believe plowing destroys the soil structure and can easily lead to soil loss, accelerated water evaporation, and accelerated decomposition of organic matter [8]. Aerated irrigation injects air through underground drip irrigation lines to improve soil aeration. Studies have confirmed that this root zone aeration positively impacts crop production [10,11]. Niu et al. proposed that root zone aeration after drip irrigation can increase cucumbers’ yield and nutritional value [12]. In addition to plowing, Ben-Noah and Friedman concluded that methods to improve soil aeration include direct air injection into the soil, irrigation with bubble water, adding hydrogen peroxide to water, and adding urea peroxide or calcium oxide to water. Although the above methods all have apparent positive effects, the transportation of oxygen is complicated. It is not easy, and the application cost is too high. They believe that it is more feasible to inject air through the underground drip irrigation system [8]. However, its soil aeration effect is still minimal, and the construction cost of the underground drip irrigation system is also extremely high.
Net-zero carbon emissions by 2050 are the current goal of all countries, and the storage and reduction of carbon dioxide is an essential means to slow down the Earth’s warming. Soil is the third largest carbon storage pool among the five largest carbon pools in the world [13]. Rotter plows are used to plow the soil before crop planting to improve soil aeration. According to Reicosky’s research [14], every time a field is plowed, the soil will lose 30% of its carbon, which is not conducive to promoting net-zero carbon emissions goals. Conservative tillage is considered a way to reduce soil carbon emissions; the type includes mulch tillage, ridge tillage, zone tillage, and no-tillage. A main variant of the latter is direct drilling (sometimes termed zero-tillage). Not tillage the soil can prevent soil organic matter from being decomposed and mineralized, and through cultivation without land preparation, per hectare of land can store 0.3 to 0.5 metric tons of carbon annually [14]. Therefore, the land-free “conservative tillage farming” model has become a new cultivation model for carbon-reduction farming methods. Mühlbachová et al. [15] indicate reducing tillage and no-tillage decrease CO2 emissions by a 6-year average of 45% and 51%, respectively, compared with convention tillage. CO2 emissions from a 4-year maize field was reduced by 35.9% under no-tillage compared with under convention tillage [16]. “No-tillage agriculture” is a method in which crops are planted directly without plowing the soil or cleaning up crop residues before planting. There are two types of non-land preparation plowing. One is no-tillage, which does not turn over the soil at all but lacks the loosening effect on the soil structure; the other is reduced tillage, which reduces the number of plowing times and limits the plow area, such as conservation plow. As long as the plowing area is controlled within 30% of agricultural land, we can retain 70% of the carbon in the soil. Shockwave tillage combines the advantage of zone tillage and no-tillage. On the other hand, since tillage promotes soil water evaporation, no-till methods can improve infiltration and reduce evaporation to maintain moisture in the soil for crop production in semi-arid and arid areas with limited water resources [17].
Deliberately creating a low-pressure area in front of high-pressure gas guides all gas molecules to move in this direction. Such gas movement is the so-called shockwave [18]. When the shockwave speed reaches Mach 1 (i.e., the speed of sound, about 340.3 m/s), it can be called a supersonic shockwave. The operation and experimental research of missiles, supersonic aircraft, space rockets, and various vacuum high-speed flows are all applications of supersonic fluids. At present, various research institutions and industries need to use the rapid compression of the high- and low-pressure ranges of the fluid to generate shockwaves [19]. To conduct operations or experiments on supersonic fluids, This research team has achieved many research results on generating and applying supersonic shockwaves. We have designed a new type of supersonic shockwave generator [20], which has the advantages of easy operation, high safety, and reusability. The developed shockwave monitoring system measures the shockwaves generated by this generator, which can have a speed of Mach 3–4 and an output pressure of up to 90 MPa [21]. We have taken advantage of the characteristics of this new type of shockwave generator that can generate high-pressure and high-speed shockwaves to conduct application research on high-pressure shockwave removal of pipe obstructions [22] and high-pressure shockwave-driven power generation [21].
To solve the current problems of soil loosening in the root zone of crops, this research used this new shockwave generator as the basis to propose a system architecture that can perform high-pressure shockwave soil-loosening and develop a high-pressure shockwave soil-loosening device. This device can first drill a hollow drill bit containing multi-directional holes into the soil near the roots of the crops and then generate high-pressure gas to impact the soil outside the drill bit to increase the soil pores and improve the soil ventilation quickly. Furthermore, we also conducted numerical simulations of shockwave soil loosening to explore the effectiveness of high-pressure shockwaves in improving soil aeration. On the other hand, we carried out some shockwave multi-directional impact experiments in a transparent acrylic water tank. The effectiveness of shockwave impact was automatically measured through eight pressure sensors. Finally, regarding research on reducing agricultural carbon emissions, this kind of shockwave soil loosening farming method will not damage the soil surface while loosening the crop roots. It will prevent the soil from being disturbed by large-scale plowing and reduce emissions of carbon stored in soil into the atmosphere.

2. System Design and Development

2.1. System Architecture

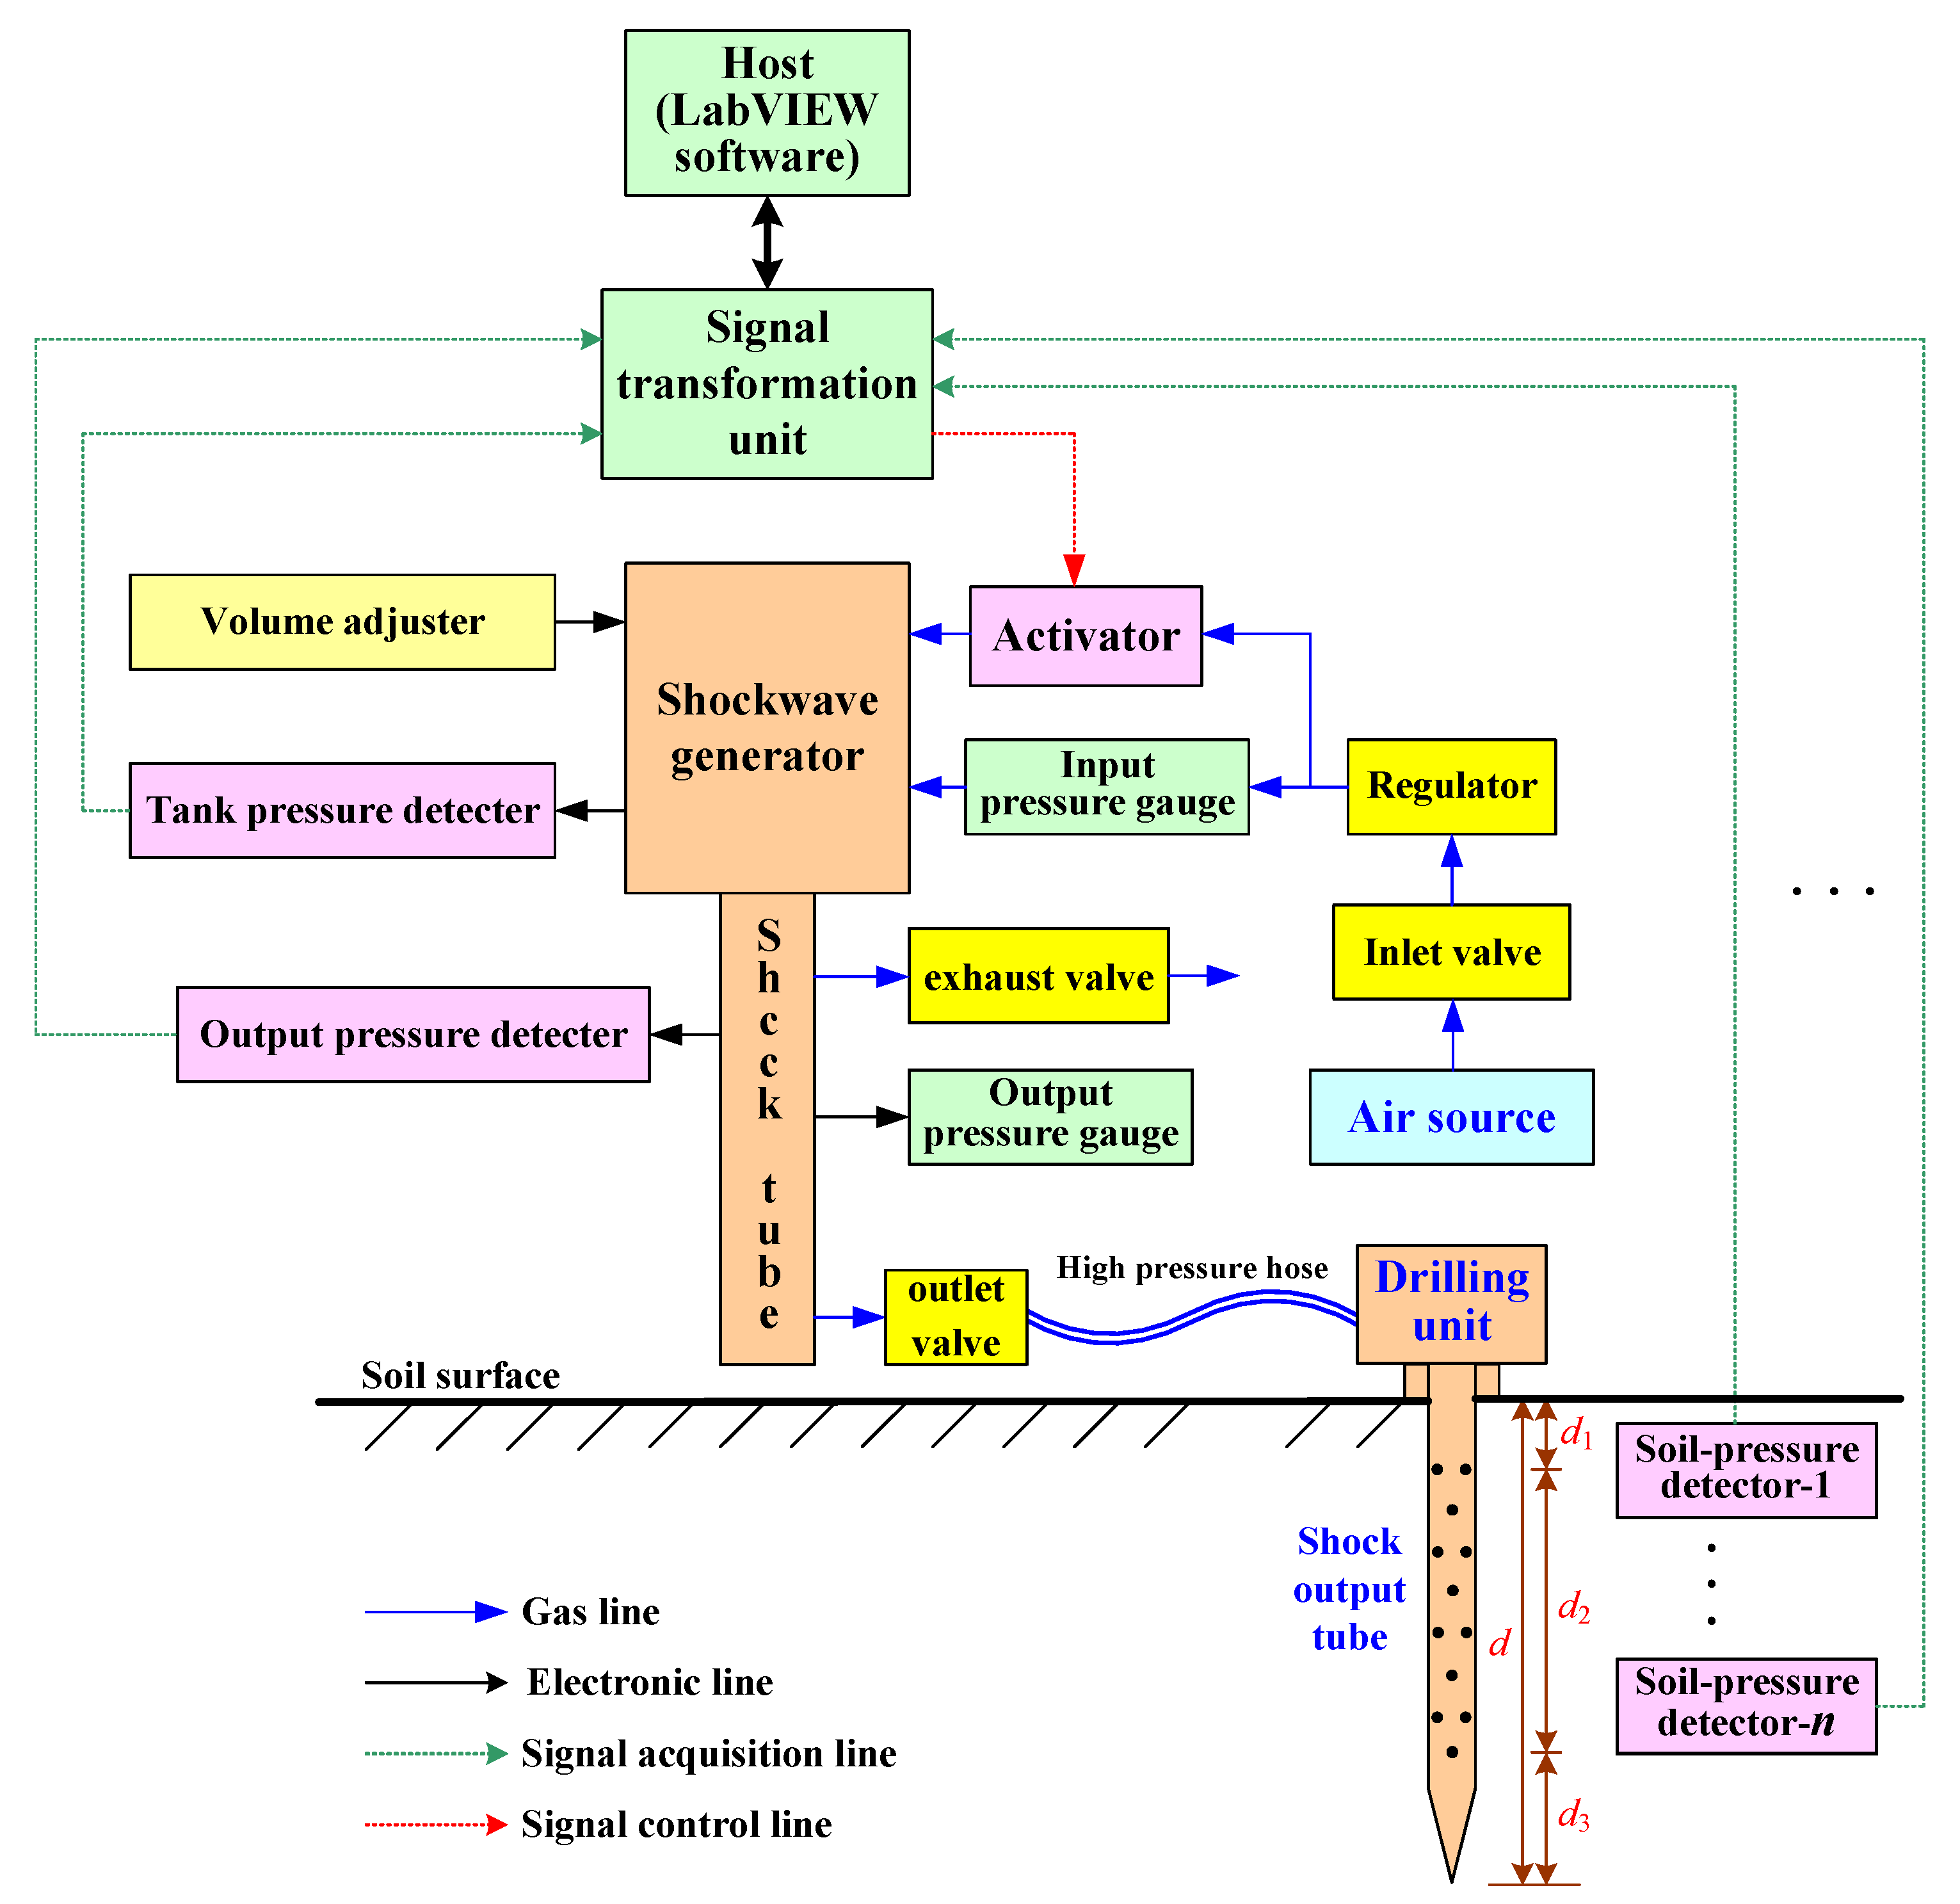
This research mainly develops a high-pressure shockwave soil-loosening device with automatic monitoring capabilities. Figure 2 shows the system architecture. This shockwave soil-loosening device uses gas to transmit high-pressure shockwaves. To provide this shockwave soil-loosening device with automatic monitoring capabilities for experimental analysis of shockwave soil-loosening effectiveness, we combine this device with a shockwave activator and multiple pressure detectors and integrate software design, hardware development, and interface technology. This system can automatically measure parameter values such as tank pressure, output pressure, and soil impact pressures at different distances while activating shockwaves to loosen the soil. In the system architecture of Figure 2, the black lines represent the electronic circuits, the blue lines represent the gas pipelines, the red dotted line is the signal control line, and the green dotted lines are the signal acquisition lines.
In the following, we will describe the functions of each component in the system architecture.
(1)
Shockwave generator: This is a supersonic shockwave-generating device. It allows users to adjust the volume and pressure of the device’s storage tank.
(2)
Activator: This is a solenoid valve that starts the shockwave generator to generate supersonic shockwaves. The monitoring host can control the solenoid valve.
(3)
Air source: It can supply the high-pressure gas required for the shockwave generator’s storage tank. An air source can be a high-pressure gas cylinder or an air compressor.
(4)
Regulator: It can adjust the gas pressure of the shockwave generator’s storage tank.
(5)
Input pressure gauge: It can display the gas pressure of the shockwave generator’s storage tank.
(6)
Inlet valve: This valve controls the gas flow from the gas source into the shockwave generator’s storage tank.
(7)
Volume adjuster: It can adjust the volume of the shockwave generator’s storage tank by changing its piston position.
(8)
Tank pressure detector: This is a PM20C gas pressure sensor (spt) [23] used to detect the pressure of the storage tank. The maximum pressure of each detector is 1 MPa. The signal transformation unit can send the detected pressure signal (pt) to the monitoring host for processing.
(9)
Shock tube: The shockwaves generated by the generator first enter the shock tube, which uses gas to transmit high-pressure shockwaves.
(10)
Output pressure gauge: This is a legacy mechanical pressure gauge installed on the shock tube to indicate its maximum pressure.
(11)
Output pressure detector: This is a Model 113B23 high-pressure and high-speed pressure sensor (spo) [24]. The maximum pressure of the detector is 103.42 MPa. It can detect the shockwave pressure output to the shock tube. The signal transformation unit can send the detected pressure signal (po) to the monitoring host for processing.
(12)
Outlet valve: This is a control valve that can transmit high-pressure shockwaves from the shock tube. The transmitted high-pressure shockwaves can be sent to the drilling unit’s shock output tube through the high-pressure hose for injection output.
(13)
Exhaust valve: This is a control valve used to discharge the high-pressure gas accumulated in the shock tube.
(14)
Drilling unit: It mainly comprises a charging motor, a reducer, and a rotary joint and drives the shock output tube to complete the earth drilling work.
(15)
Shock output tube: This is a hollow stainless steel spiral output tube (drill bit). There are many holes drilled around the output tube. When the output tube is drilled into the soil to a predetermined depth, the shockwaves generated by the shockwave generator can be directly ejected from these holes to loosen soil at the crop roots. As shown in Figure 2, the length of the shock output tube is d, the distance between the uppermost output hole and the soil surface is d1, the depth covered by the shock output holes is d2, and the depth below the output holes is d3.
(16)
Soil pressure detectors 1 − n: They are UBX-100 kg pressure sensors [25] (sp1, sp2, …, spm, m in total) installed around the shock output tube in the soil. The maximum pressure of each detector is 10 MPa. They can detect the impact pressure emitted by the shock output tube on the soil. The detected pressure signals (ps1, ps2, …, psm) can be transmitted to the monitoring host through the signal transformation unit for processing.
(17)
Signal transformation unit: This is an NI USB-6351 multi-function data acquisition card [26], which has 16 analog input (AI) channels, 2 analog output (AO) channels, and 24 programmable digital input/output (DIO) channels. The sampling rate of multiple AI channels is 1.00 MS/s. This data acquisition card can activate the shockwave generator to generate high-pressure shockwaves through one DO channel and capture the signals of the tank pressure, output pressure, and soil pressures through six AI channels.
(18)
Monitoring host: This is a personal computer with Microsoft Windows 11. It can execute the self-developed LabVIEW software to measure shockwave soil loosening automatically. The monitoring host can use the buffered sampling function provided by the NI USB-6351 data acquisition card to automatically and quickly capture tank pressure, output pressure, and soil pressures from the designated AI channels according to the set sampling rate and number of sampling points. The measurement data are stored in the buffer of the acquisition card, and then, the monitoring host further records and draws the curves of various parameter data for users to analyze the effectiveness of shockwave soil loosening.

2.2. Physical Development of the Shockwave-Loosening Device

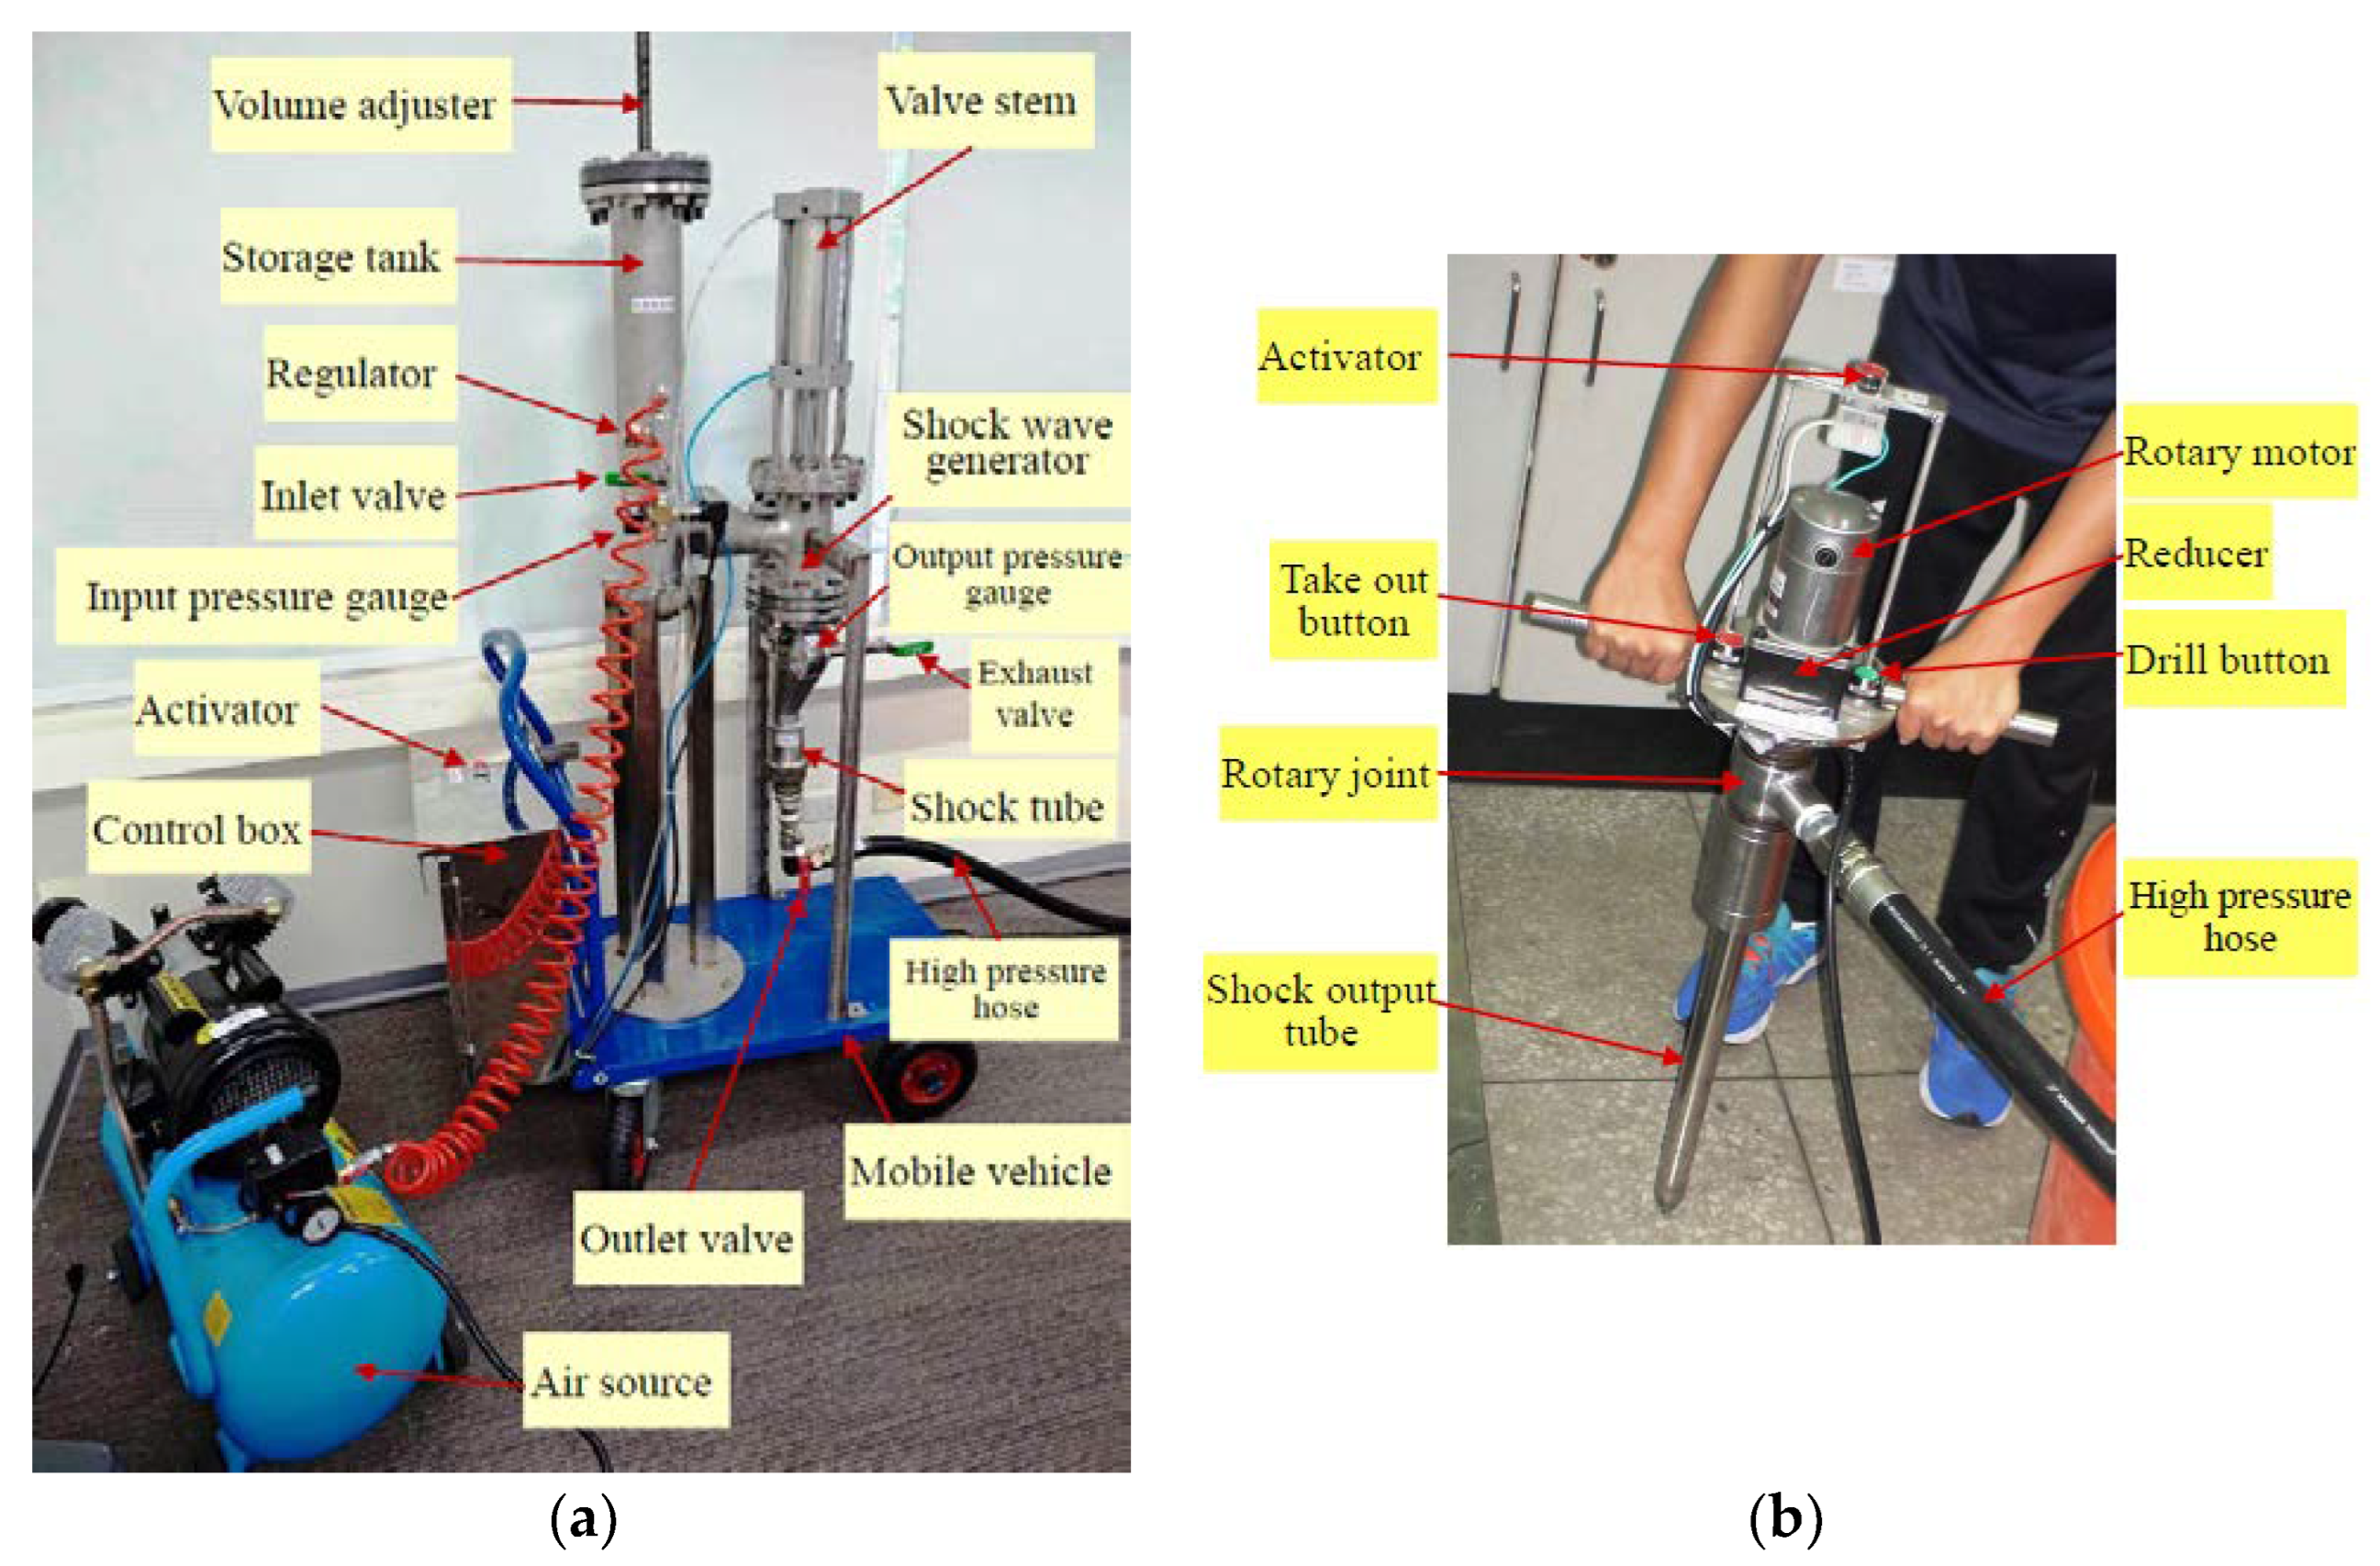
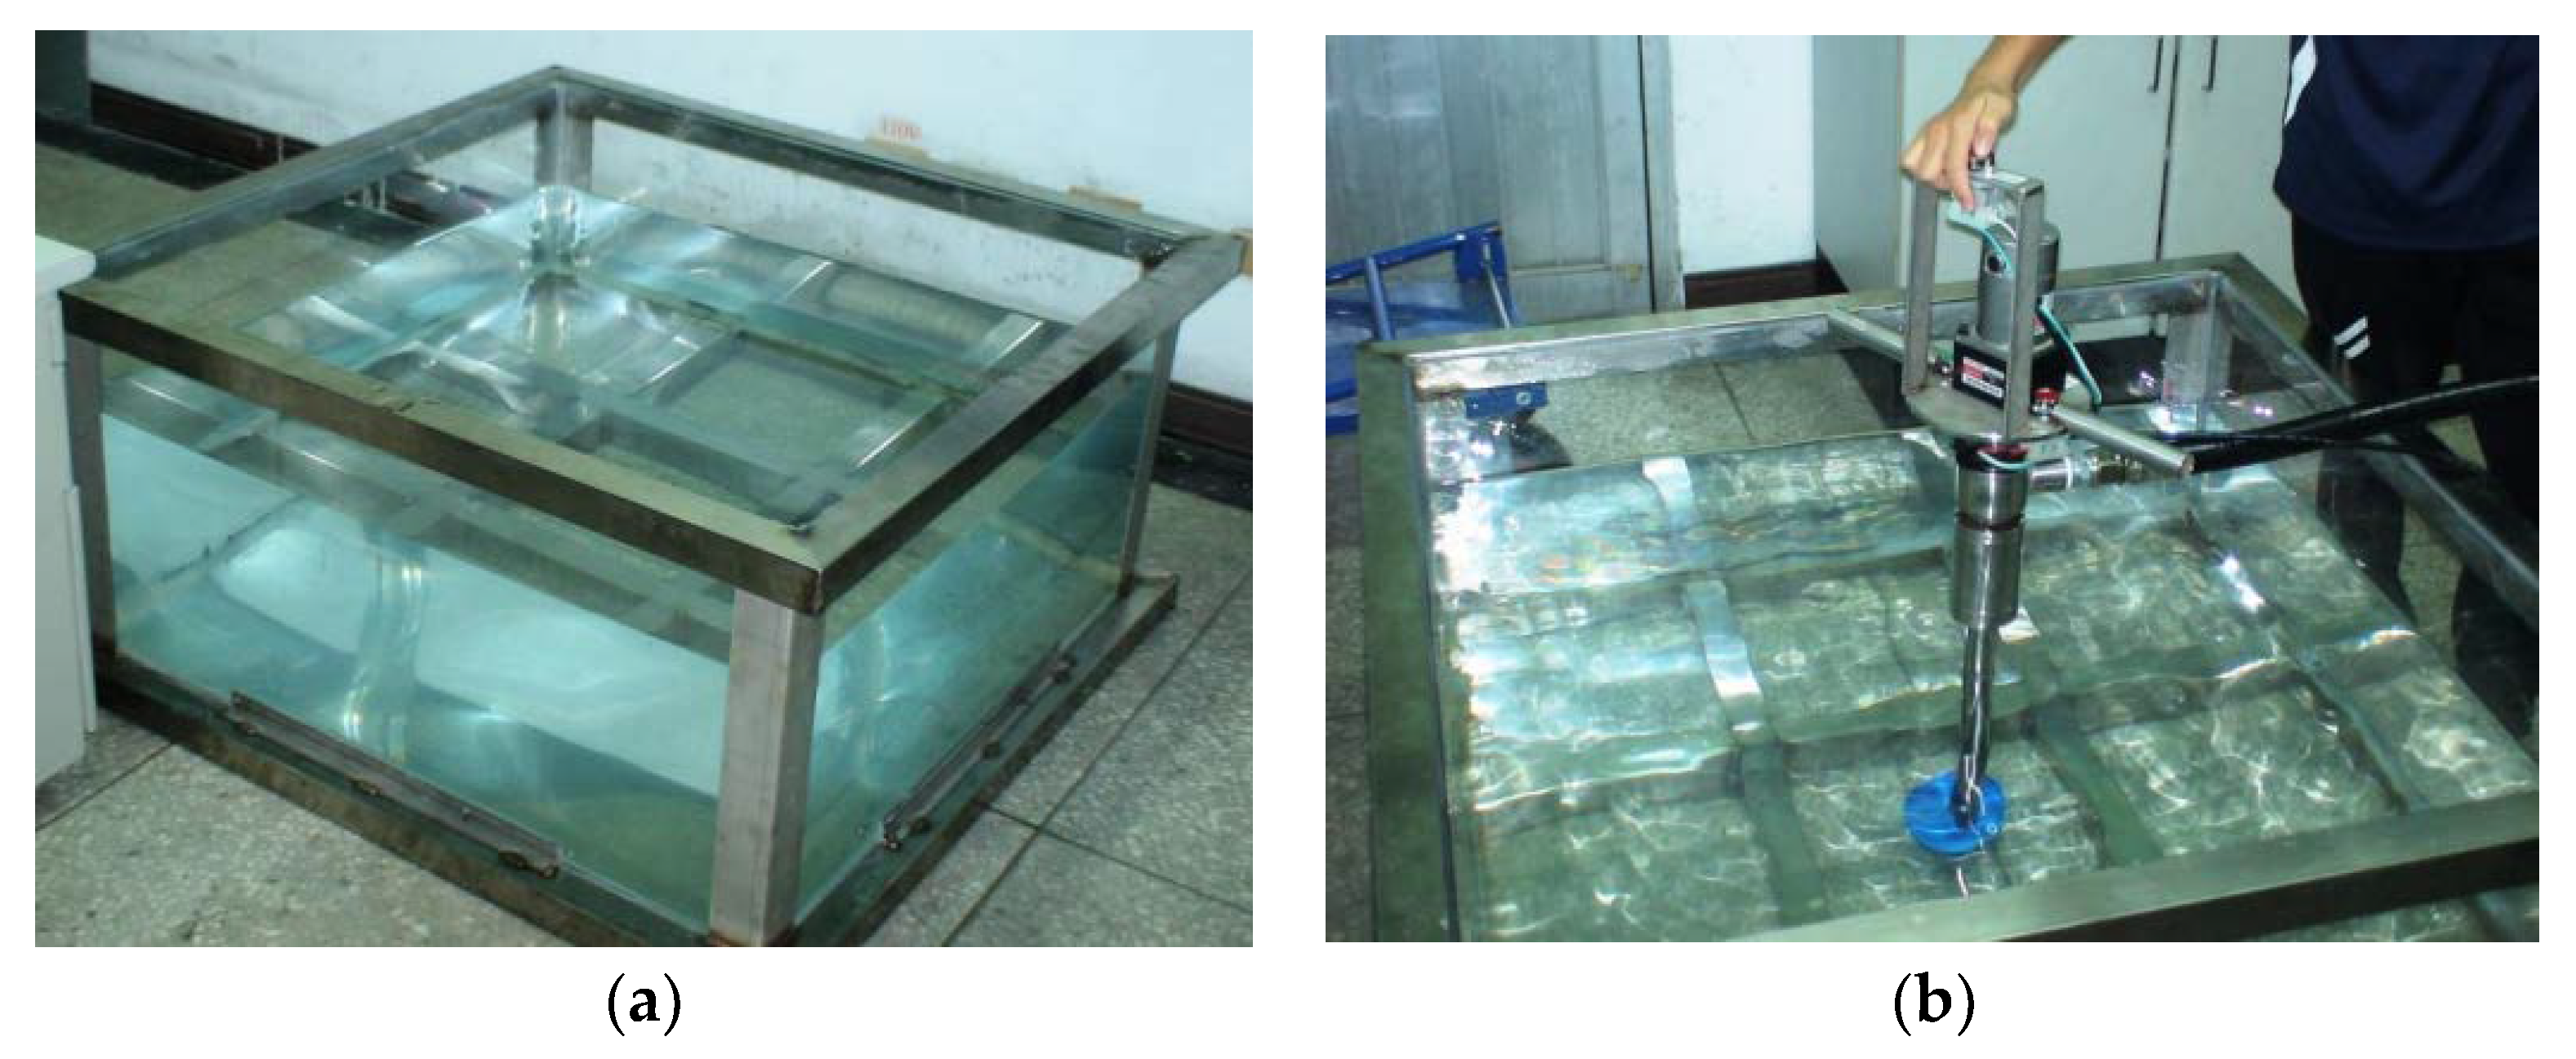
Figure 3a shows the physical structure of the supersonic shockwave soil-loosening device developed based on the system architecture in Figure 2. The storage tank is a cylinder with an inner radius of 4 cm and a length of 100 cm (circle area = 3.14 × 42 ≈ 50 cm2). The volume adjuster is used to adjust the volume of the storage tank, and the adjustment range is 1000 cm3 to 5000 cm3 (length from 20 cm to 100 cm). The regulator is used to adjust the gas pressure in the tank. There is a red activated button above the control box. Pressing this button can activate the generator to generate high-pressure shockwaves. This high-pressure shockwave can be transmitted to the drilling unit (as shown in Figure 3b). There is a green button on the left-hand grip of the drilling unit. Pressing this button can drive the shock output tube to rotate forward and drill into the soil. Pressing the red button on the right-hand grip can drive the shock output tube to reverse and take it out from the soil. After drilling into the ground, the user can press the top activator, which can also activate the generator to generate high-pressure shockwaves, which are transmitted to the shock output tube through the high-pressure hose and ejected.

2.3. Design and Development of the Shock Output Tube

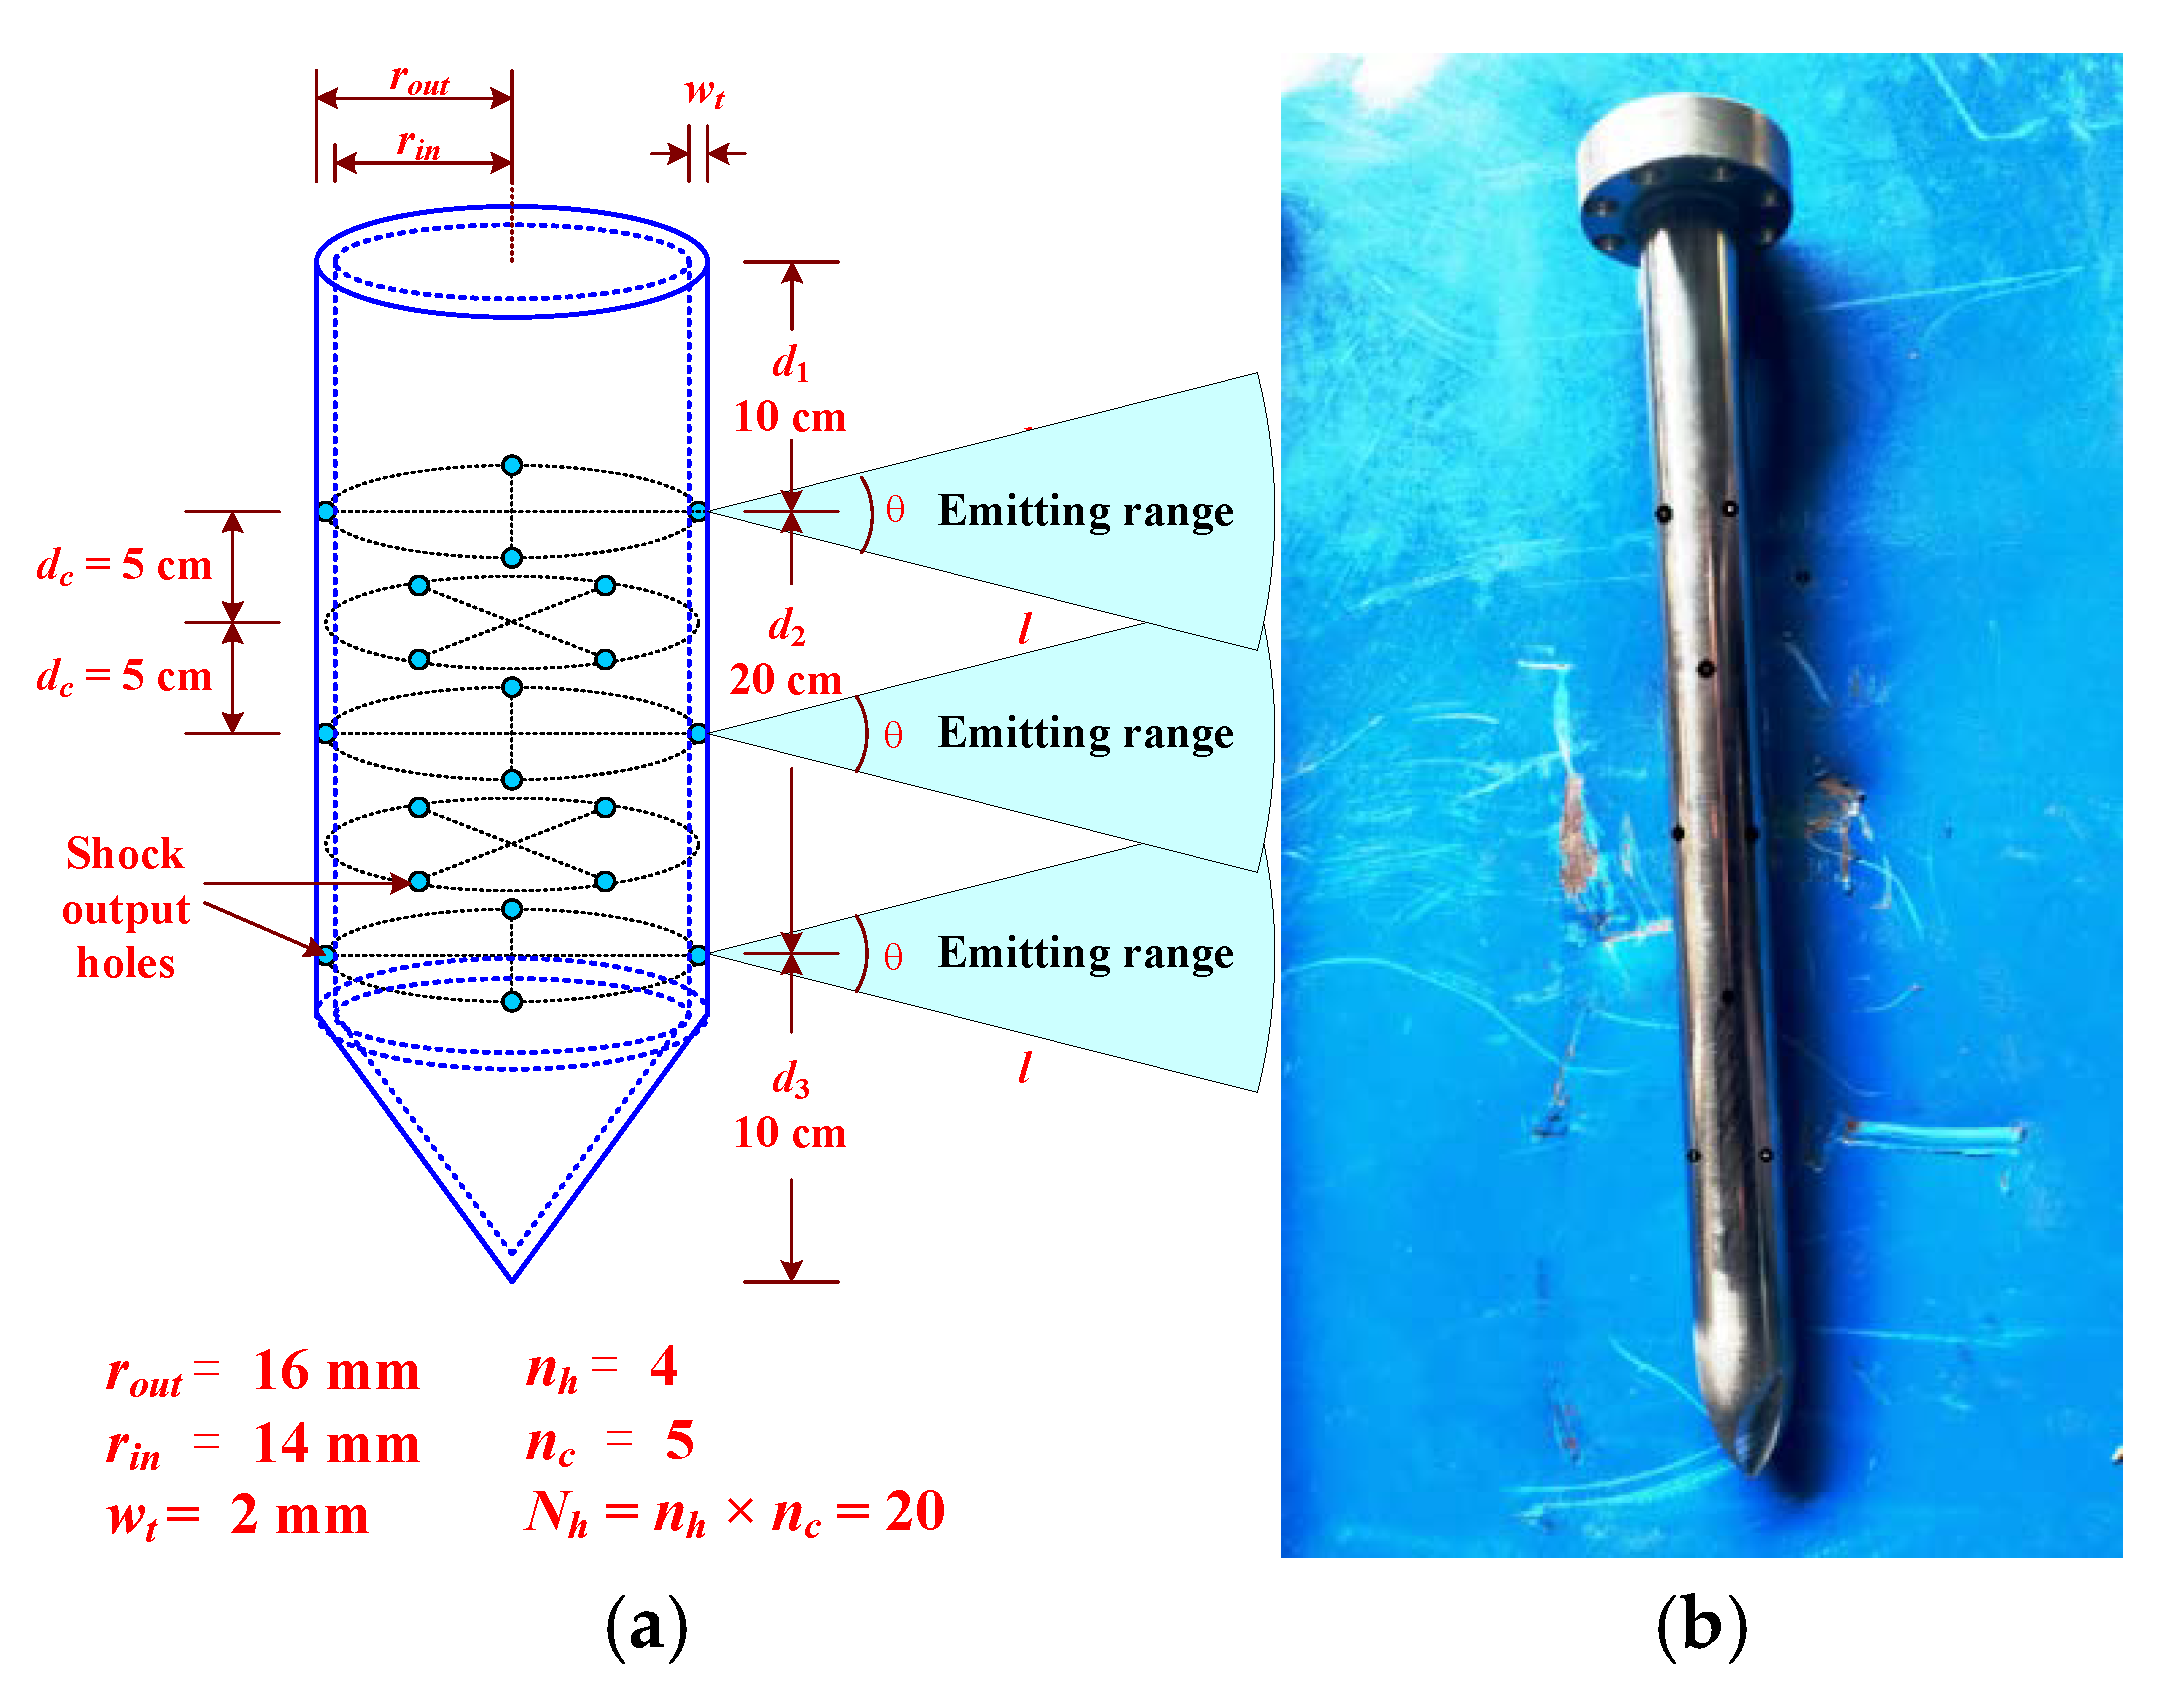
In this study, we designed and produced a shock output tube with a d = 40 cm length. The tube wall thickness wt is 2 mm, the inner ring radius rin is 14 mm, the distance between the uppermost output hole and the soil surface d1 is 10 cm, the coverage depth of the output holes d2 is 20 cm, the depth below the output holes d3 is 10 cm, the number of holes per circle nh is 4, the total number of circles nc is 5, and the total number of output holes Nh = nh × nc is 20, as shown in Figure 4a. In addition, regarding the injection direction of the output holes of the shock output tube, odd-numbered circles and even-numbered circles are injected in staggered directions. Suppose the injection directions of the odd-numbered circles are east, west, south, and north. In that case, the injection directions of the even-numbered circles are northeast, southeast, southwest, and northwest, so it can completely cover eight directions. Figure 4b shows the physical shock output tube produced according to the above specifications.

3. Numerical Simulation of Shockwave Soil Loosening

To evaluate the behavior and efficiency of the proposed shockwave-loosening system, a numerical simulation was conducted using computational fluid dynamics (CFD) techniques. The purpose of the simulation was to analyze the propagation of shockwaves in soil, quantify their impact on soil porosity and compaction and optimize the system’s design parameters for effective soil loosening.

3.1. Governing Equations and the Preconditioning System

This research employs a multi-block grid technique, utilizing a CFD algorithm that integrates the control volume method and the preconditioning approach to address Navier–Stokes equations for modeling interactions between compressible and incompressible flows. The inviscid flux vector F is expressed in the standard conservation form as follows:
F = ρ V ρ V v x + p i ρ V v y + p j ρ V v z + p k ρ V E + p V
In this context, ρ represents the density, while V denotes the velocity vector, with vx, vy, and vz corresponding to the velocity components in the x, y, and z directions, respectively. The parameter p signifies pressure, and E denotes the total energy per unit mass. The relationship between E and the total enthalpy H is given by H is H = Ep/ρ, where H = CpT + V2/2, with Cp being the specific heat at a constant pressure and T representing the temperature. The system is governed by the equation of state, typically expressed as ρ = ρ(p, T).
In this study, the AUSM+ method, which employs a low-diffusion flux splitting technique, is applied [27]. The inviscid interface flux Fi+1/2 in the x direction can be separated into two distinct components: the convective contribution F 1 / 2 c and the pressure contribution F 1 / 2 p . Here, the subscript 1/2 denotes the midpoint of the computational grid, and both the convection term F 1 / 2 c and the pressure term F 1 / 2 p are formulated as follows:
F 1 / 2 c = ρ v x 1 / 2 1 v x v y v z H i / i + 1 ,   F 1 / 2 p = ρ v x 1 / 2 0 p 1 / 2 0 0 0
In the convection term F 1 / 2 c , if interface mass flux (ρvx)1/2 is non-negative, then state i is selected for column vector (1, vx, vy, vz, H)T; if (ρvx)1/2 is negative, then state i + 1 is selected. The interface quantities (ρvx)1/2 and p1/2 are defined as follows:
ρ v x 1 / 2 = a 1 / 2 ρ i m 1 / 2 + + ρ i + 1 m 1 / 2
p 1 / 2 = P ( 5 ) + M i p i + P ( 5 ) M i + 1 p i + 1
Among them, a1/2 is the interface sound speed, Mi is the MACH number, Mi = vxi/a1/2, and m 1 / 2 + and m 1 / 2 are defined as follows:
m 1 / 2 + = M ( 4 ) + M i + M ( 4 ) M i + 1
m 1 / 2 = 1 2 M 1 / 2 + M 1 / 2
The terms P ( 5 ) + and P ( 5 ) in Equation (4) are both fifth-degree polynomials of M, and they are defined as follows:
P ( 5 ) ± M ± 1 2 2 M 4 ± 3 M M 2 1 2 16 ,   i f   M < 1 M + M 2 M ,   o t h e r w i s e
Similarly, M ( 4 ) + and M ( 4 ) in Equation (5) represent fourth-degree polynomials of M, with their definitions given below:
M ( 4 ) ± ± M ± 1 2 4 ,   i f   M < 1 M ± M 2 ,   o t h e r w i s e
Subsequently, the Navier–Stokes equations are employed as the governing equations:
t Ω W d + F G · d A = 0
where Ω denotes an arbitrary control volume, A represents the surface area, W is the vector of conservative variables, and G corresponds to the viscous flux vector in the standard conservation form. The definitions of W and G are as follows:
W = ρ ρ v x ρ v y ρ v z ρ E , G = 0 τ x i τ y i τ z i τ i j v j + q
In the preconditioning method, we convert the governing equations defined by the conservative variable W into the form defined by the primitive variable Q = (p, vx, vy, vz, T)T as follows:
Γ t Q d V + F G · d A = 0
where Γ represents the preconditioning matrix, originally introduced by Choi and Merkle [28] and later refined by Weiss and Smith [29]. The formal definition of Γ is as follows:
Γ = Θ + 1 R T 0 0 0   ρ T v x Θ + 1 R T   ρ 0 0   ρ v x T v y Θ + 1 R T   0 ρ 0   ρ v y T v z Θ + 1 R T   0 0 ρ ρ v z T H Θ + 1 R T 1   ρ v x ρ v y ρ v z   ρ C p H T
where R is the gas constant, and Θ and H are defined as follows:
Θ = 1 U r e f 2 1 a 2
U r e f 2 = m i n a 2 ,   m a x V 2 , K V 2
H = C p T + 1 2 ( v x 2 + v y 2 + v z 2 )
where |V| is the local velocity, |V| is the fixed reference velocity, a is the speed of sound, and K is the constant. The Weiss–Smith preconditioner is formed by adding the vector [1, vx, vy, vz, T]T to the Jacobian matrix ∂W/∂Q, where W is a vector of conservative variables. In this study, K is fixed at 0.25, and the eigenvalues of Γ−1A (A = ∂F/∂W) are vx, vx’ ± a’, where vx is the velocity component in the x direction, and
v x ± a = 1 2 ( 1 + M r e f 2 ) v x ± a 1 M r e f 2 2 M 2 + 4 M r e f 2
M r e f 2 = U r e f 2 a 2

3.2. Assumptions

The numerical simulation employed the CFD self-code [30] to model the propagation of shockwaves through a soil medium. The following methodologies and assumptions were applied:
  • Shockwave characteristics: The initial shockwave was generated with a pressure of 10 atm (about 1000 kPa) at the shock tube inlet, simulating the shockwave start-pressure of the system.
  • Soil model: The soil was modeled as a porous medium with specific properties, including a density of 1500 kg/m3 and a porosity of 30%.
  • Boundary conditions: The shock tube inlet was set as a pressure inlet with an initial high-pressure patch, while the far-field boundaries were defined as pressure outlets to minimize reflections.

3.3. Results and Observations

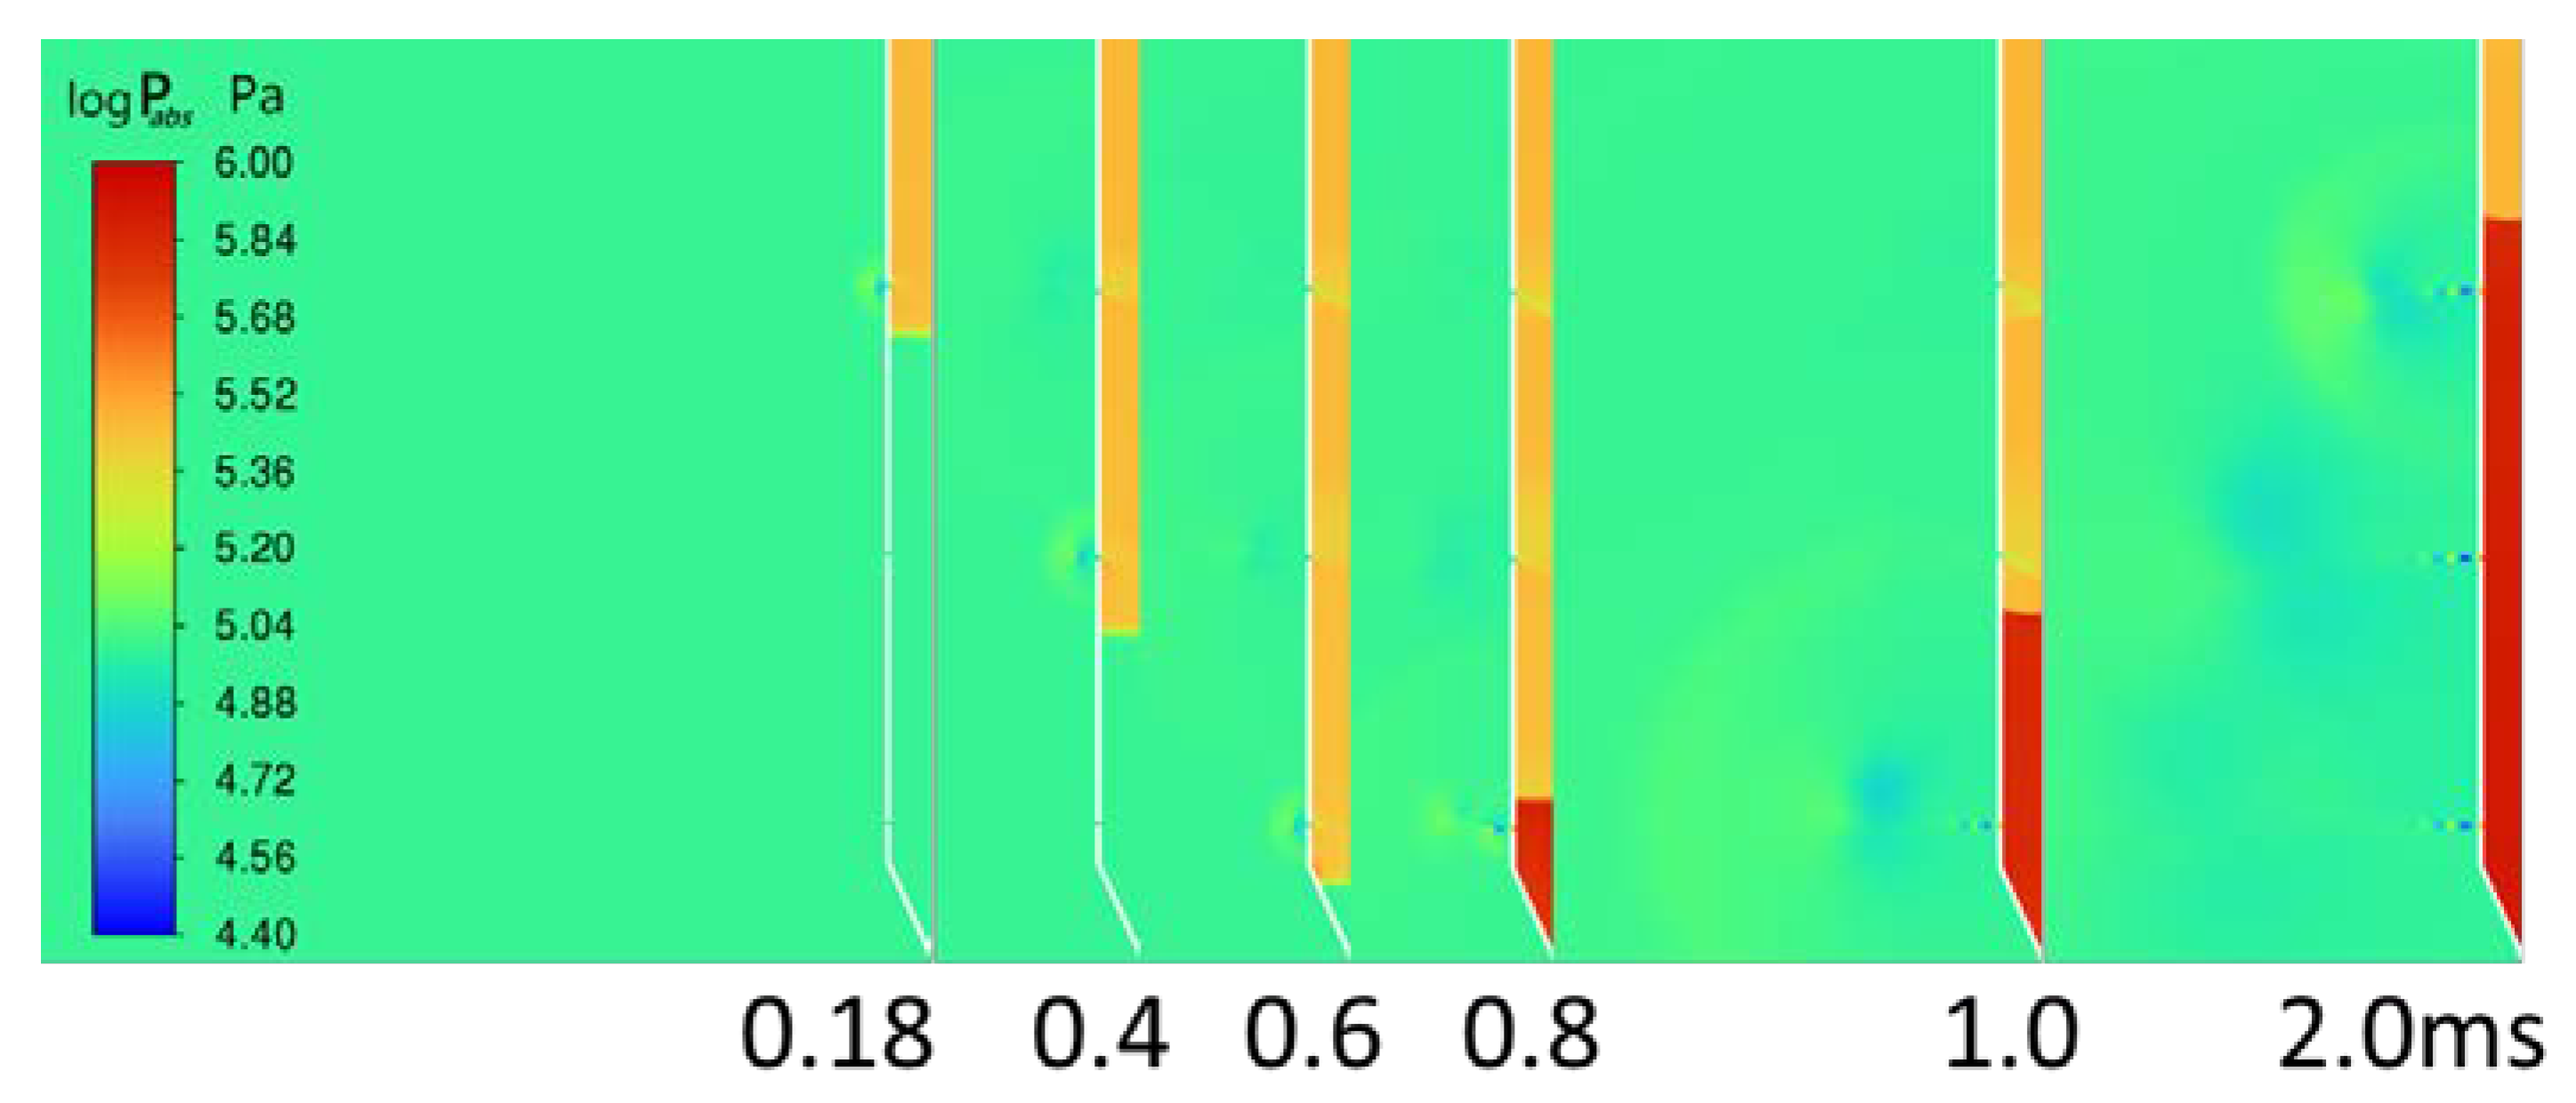
Utilizing the configuration shown in Figure 4, a numerical analysis of the shock phenomenon at the output tube was conducted using computational fluid dynamics (CFD) simulations. The study examined the shockwave behavior at injection holes A, B, and C, as well as the shockwave dynamics within the pipe, from upstream to downstream.
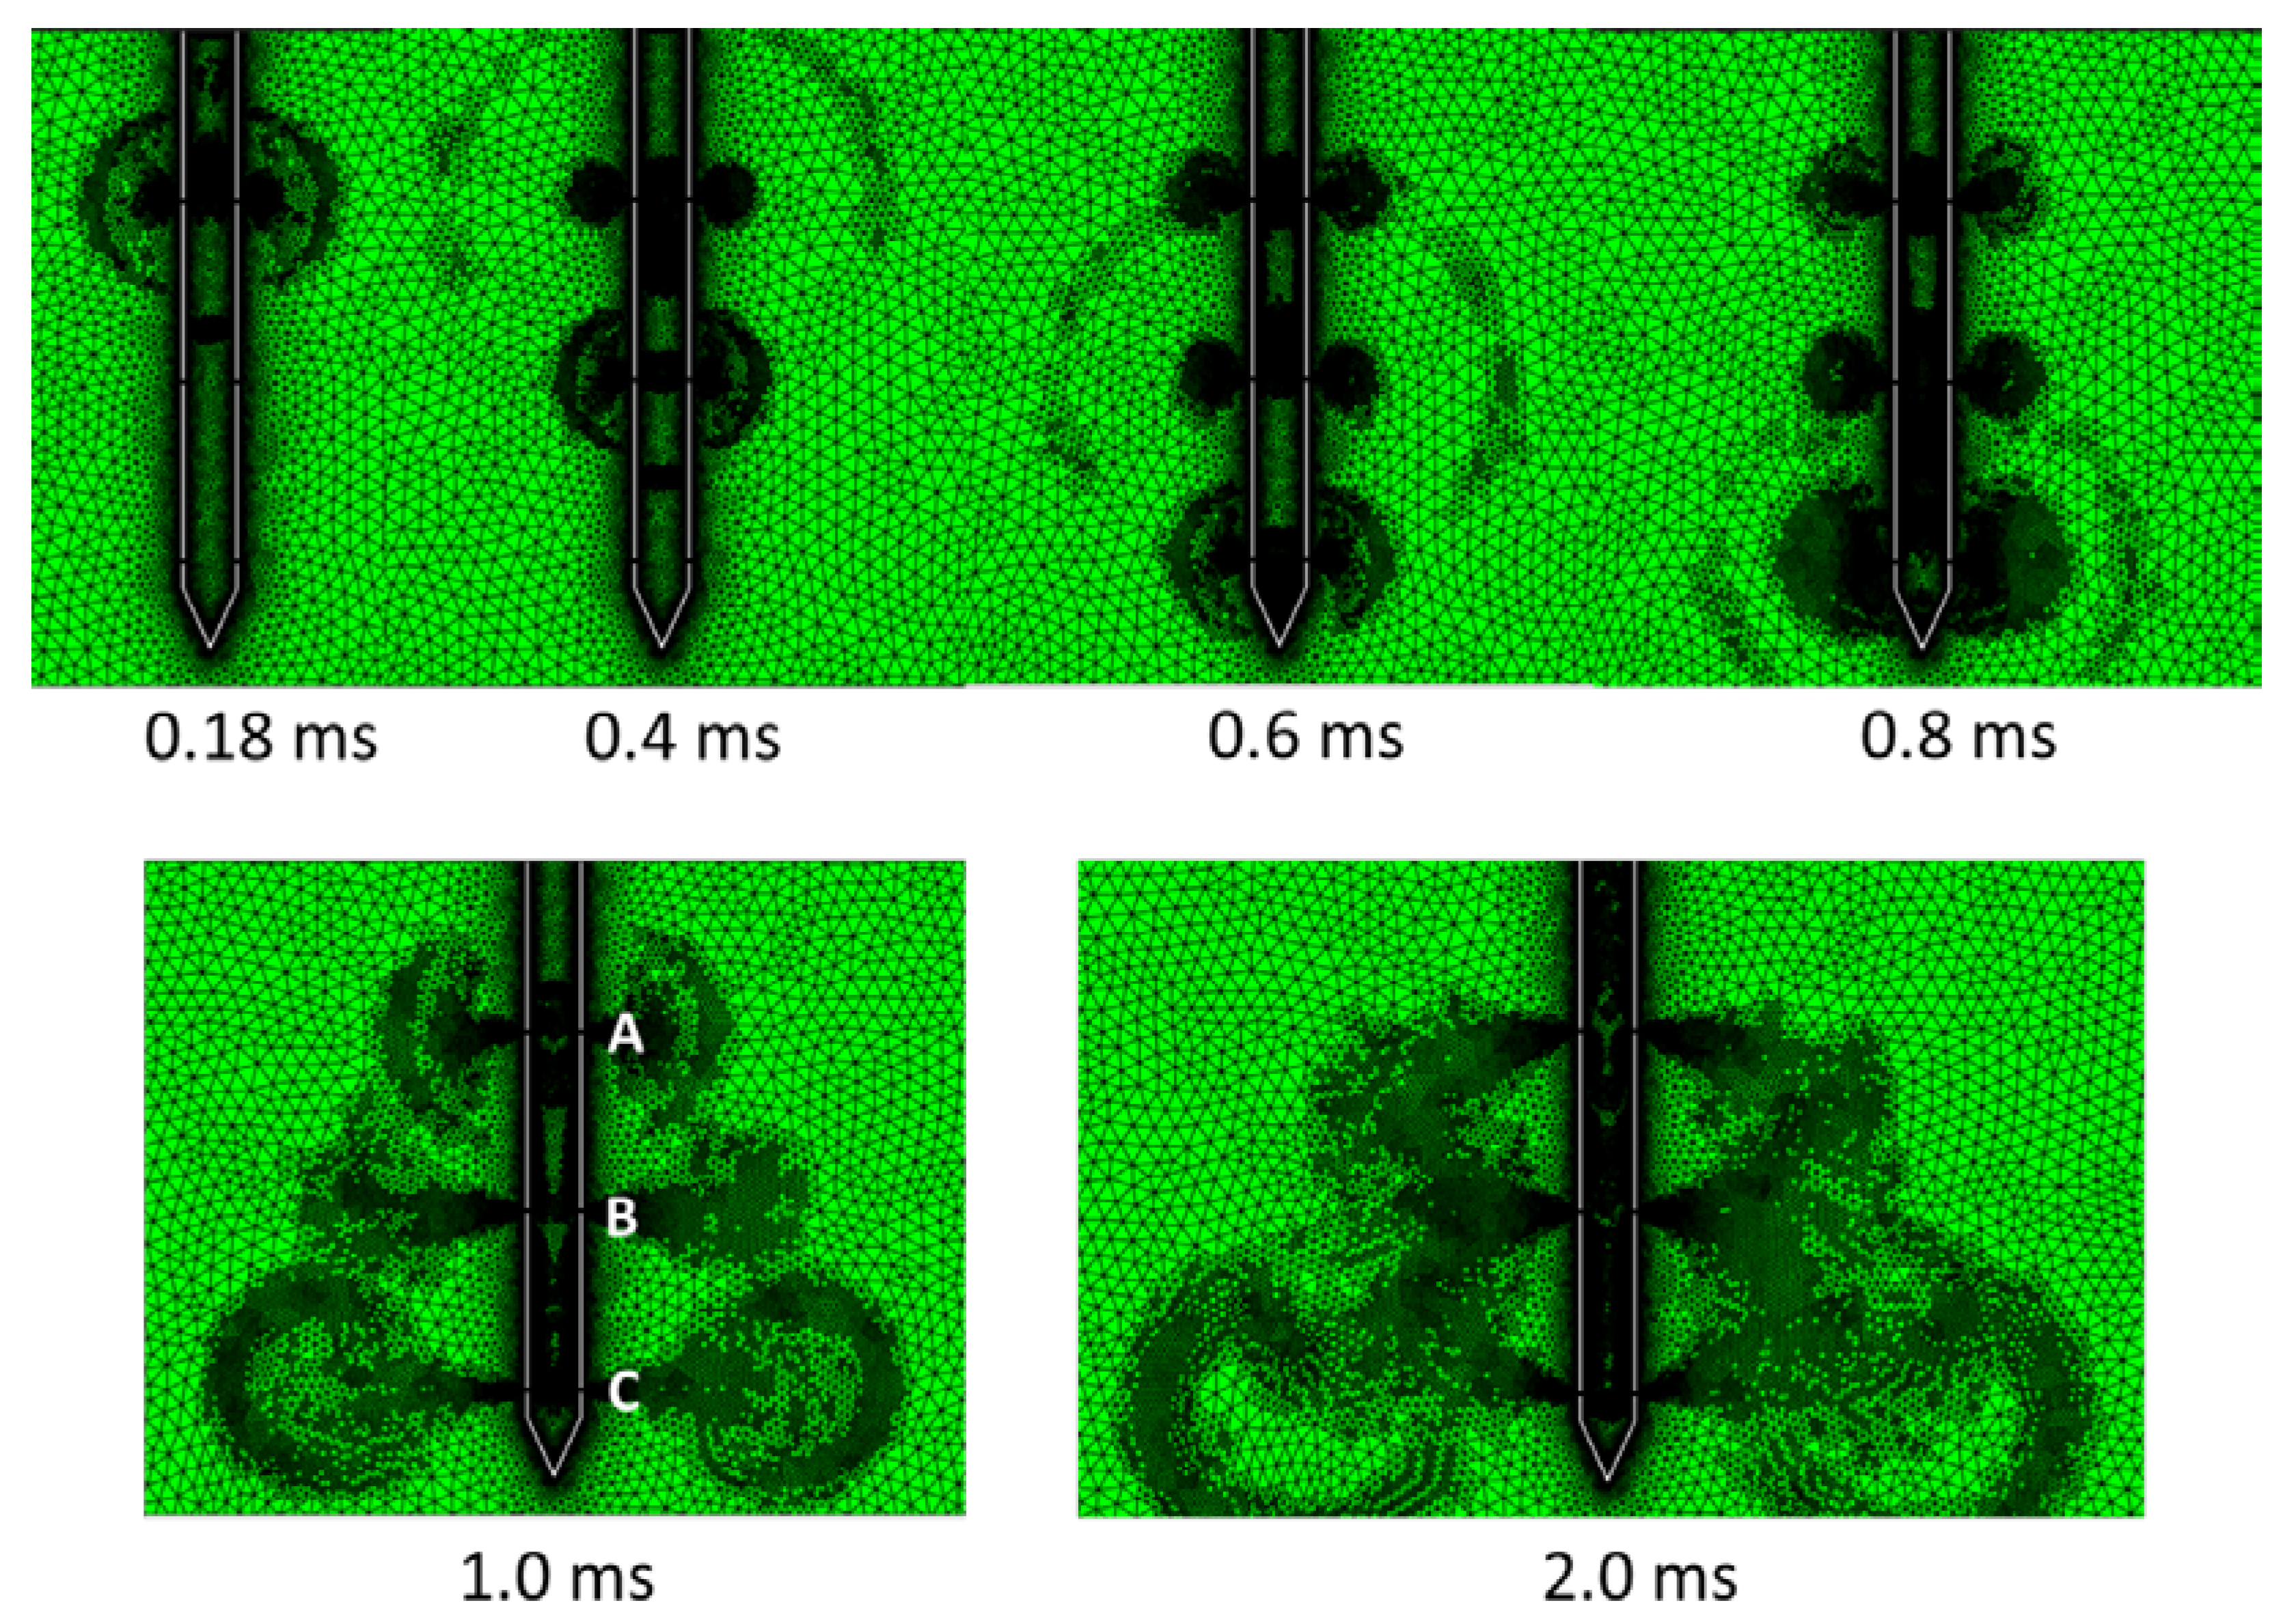
Figure 5 illustrates the propagation of shockwaves at 0.18 ms, 0.4 ms, 0.6 ms, 1 ms, and 2 ms after generation. At 0.18 ms, a shockwave was emitted from hole A, exiting the nozzle and propagating into the soil. In its initial phase, the shockwave formed a near-spherical shape with a uniform pressure distribution. By 0.4 ms, a second shockwave was emitted from hole B, with a time interval of 0.18 ms between emissions from holes A and B. At 0.6 ms, hole C emitted another shockwave, with a 0.2 ms interval between holes B and C—slightly longer than the interval between holes A and B (by 0.02 ms). This delay was attributed to energy attenuation as the shockwave propagated through the output tube. At 0.8 ms, a reflected shockwave traveled back toward hole C and interacted with the original shockwave emitted from that location, inducing a resonance phenomenon. Similar resonance effects were observed at 1.0 ms and 2.0 ms at holes B and A, respectively. Since holes A, B, and C were evenly spaced, it was noted that as the shockwave traveled further downstream, its propagation speed gradually decreased. Additionally, when the reflected shockwave moved upstream within the output tube, resonance effects were observed.
At 0.18 ms, when a low-intensity shockwave was emitted from hole A, a low-pressure bubble was observed at the exit of hole A. The presence of a notch on the surface of the shockwave output tube led to the formation of an oblique shockwave within hole A. As the shockwave continued propagating, similar phenomena were detected at holes B and C, as depicted in Figure 6 and Figure 7. By 0.8 ms, the reflected shockwave traveling upstream interacted with the shockwave within the output tube at hole C, triggering resonance effects. This interaction resulted in shockwave superposition, leading to periodic fluctuations in high- and low-pressure jet flows, as shown in Figure 6.
The further analysis of Mach number variations (Figure 7) revealed a characteristic nozzle-interacting shockwave jet. Although the Mach numbers of the shockwave jets from holes A, B, and C exhibited slight differences, the overall pressure distribution remained relatively consistent, as demonstrated in Figure 8. Figure 8 shows the pressure variations over time at the shockwave output holes. Initially, the shockwaves emitted from holes A, B, and C exhibited a pressure of approximately 1.5 atm. However, due to interactions between the reflected and upstream shockwaves, the pressure of the emitted shockwaves eventually increased to 3.4 atm. Furthermore, the interaction region exhibited periodic pressure oscillations, inducing the formation of standing waves or resonance effects.

4. Visual Observation Experiments of Soil Loosening by Shockwaves

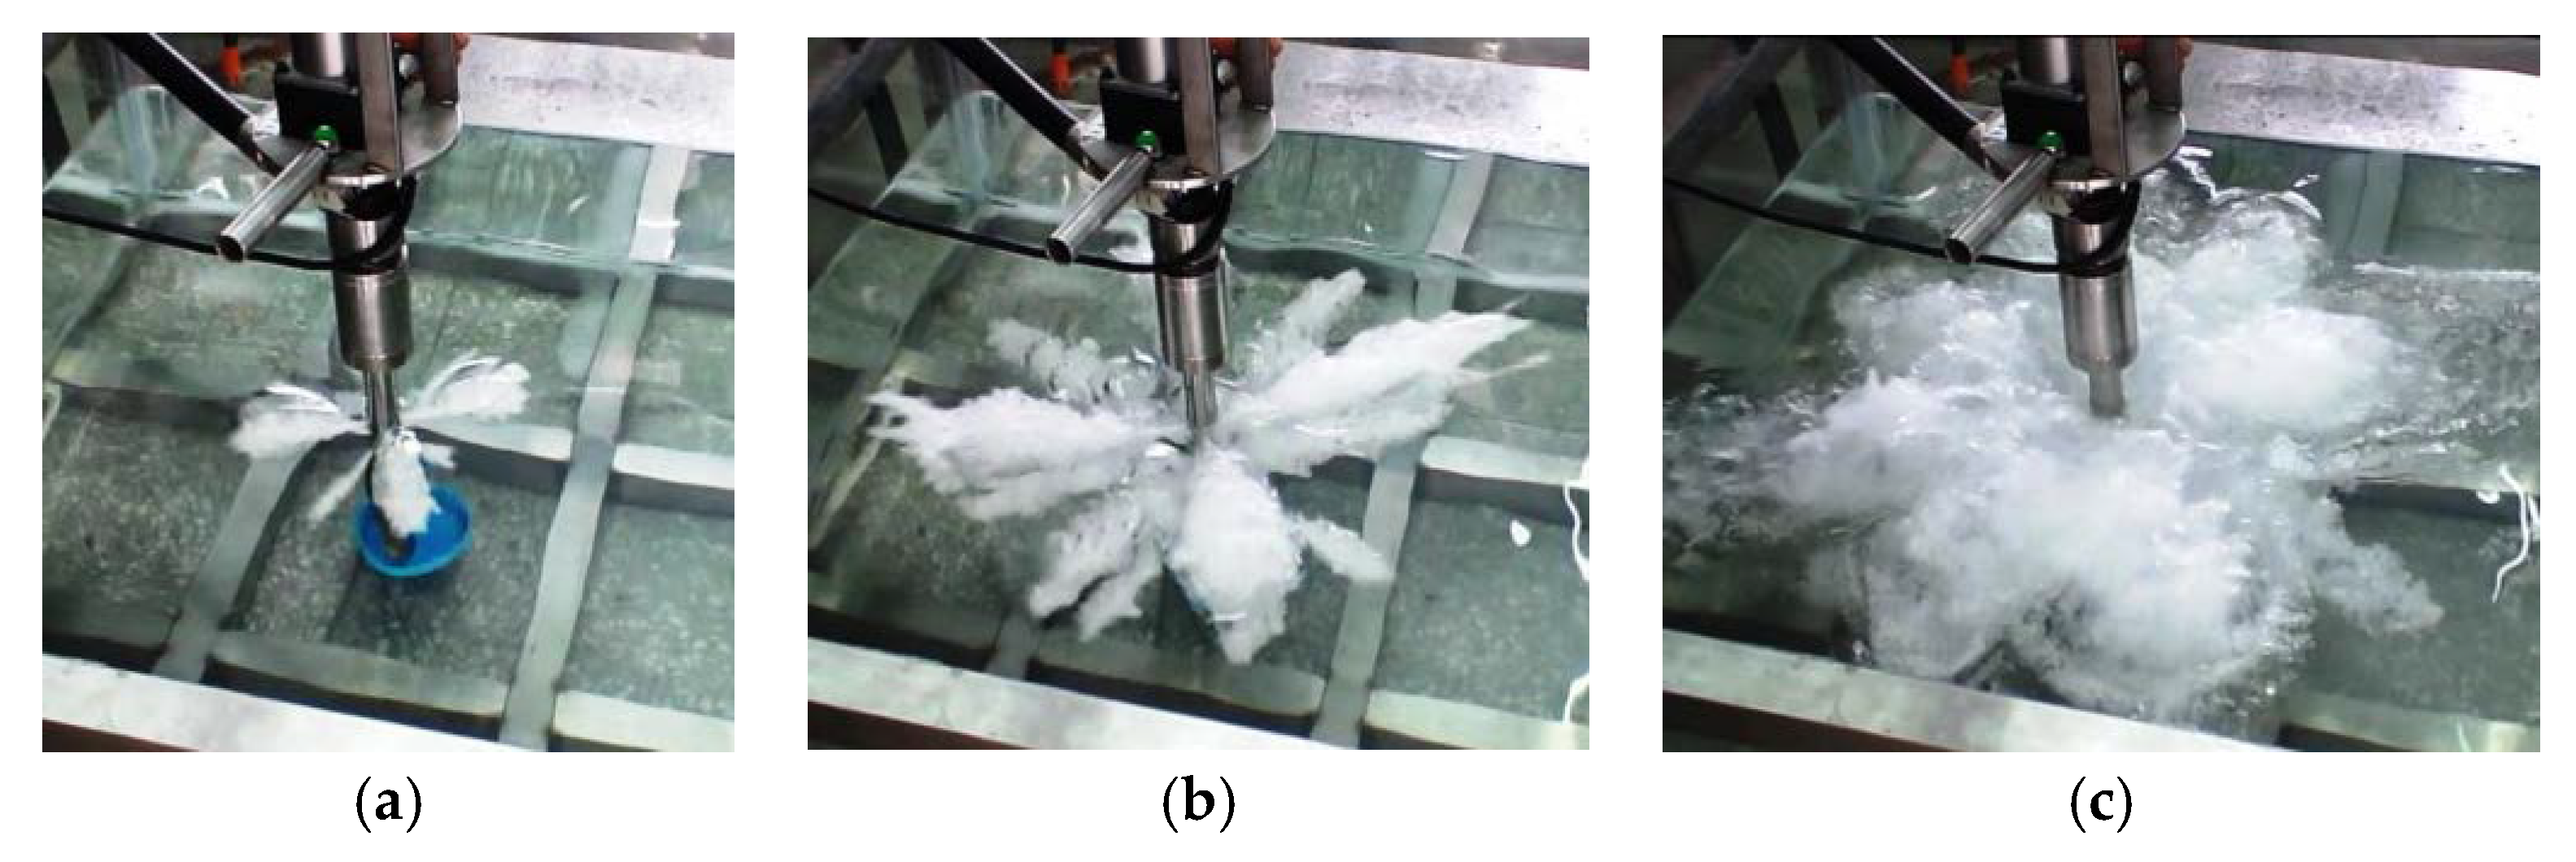
To observe the effect of supersonic shockwaves emitted from eight directions of the shock output tube, we built an acrylic transparent observation tank with a length of 100 cm, a width of 100 cm, and a height of 50 cm. The sides and bottom of this observation tank are fixed with stainless steel. Thirty-five centimeters of high water is placed in the observation tank, as shown in Figure 9a. When conducting a shockwave injection experiment, first insert the shock output tube of the drilling unit into the center of the tank, as shown in Figure 9b; then open the air inlet valve of the shockwave-loosening device to inflate the air storage tank. After completion, close the air inlet valve and then open the outlet valve of the shock tube to complete the preparations for shockwave generation. Finally, press the shockwave start button above the drilling unit to generate high-pressure shockwaves and eject them from each shock output hole. This study uses video screenshots to present the changes in shockwave emission sequentially. Figure 10 shows a visual observation experiment of a top-view shockwave emission, while Figure 11 shows a visual observation experiment of a side-view shockwave emission.
Analyzing the changes from Figure 10a–c and from Figure 11a–c, we can observe that the shockwaves are emitted from each output hole in sequence, where the order of injection is from top to bottom (in order of arrival), the distance of injection is from near to far, and the direction of injection is the direction where odd-numbered circles and even-numbered circles intersect. There are four emitted shockwaves in each circle.

5. Pressure Measurement Experiments for Shockwave Impact

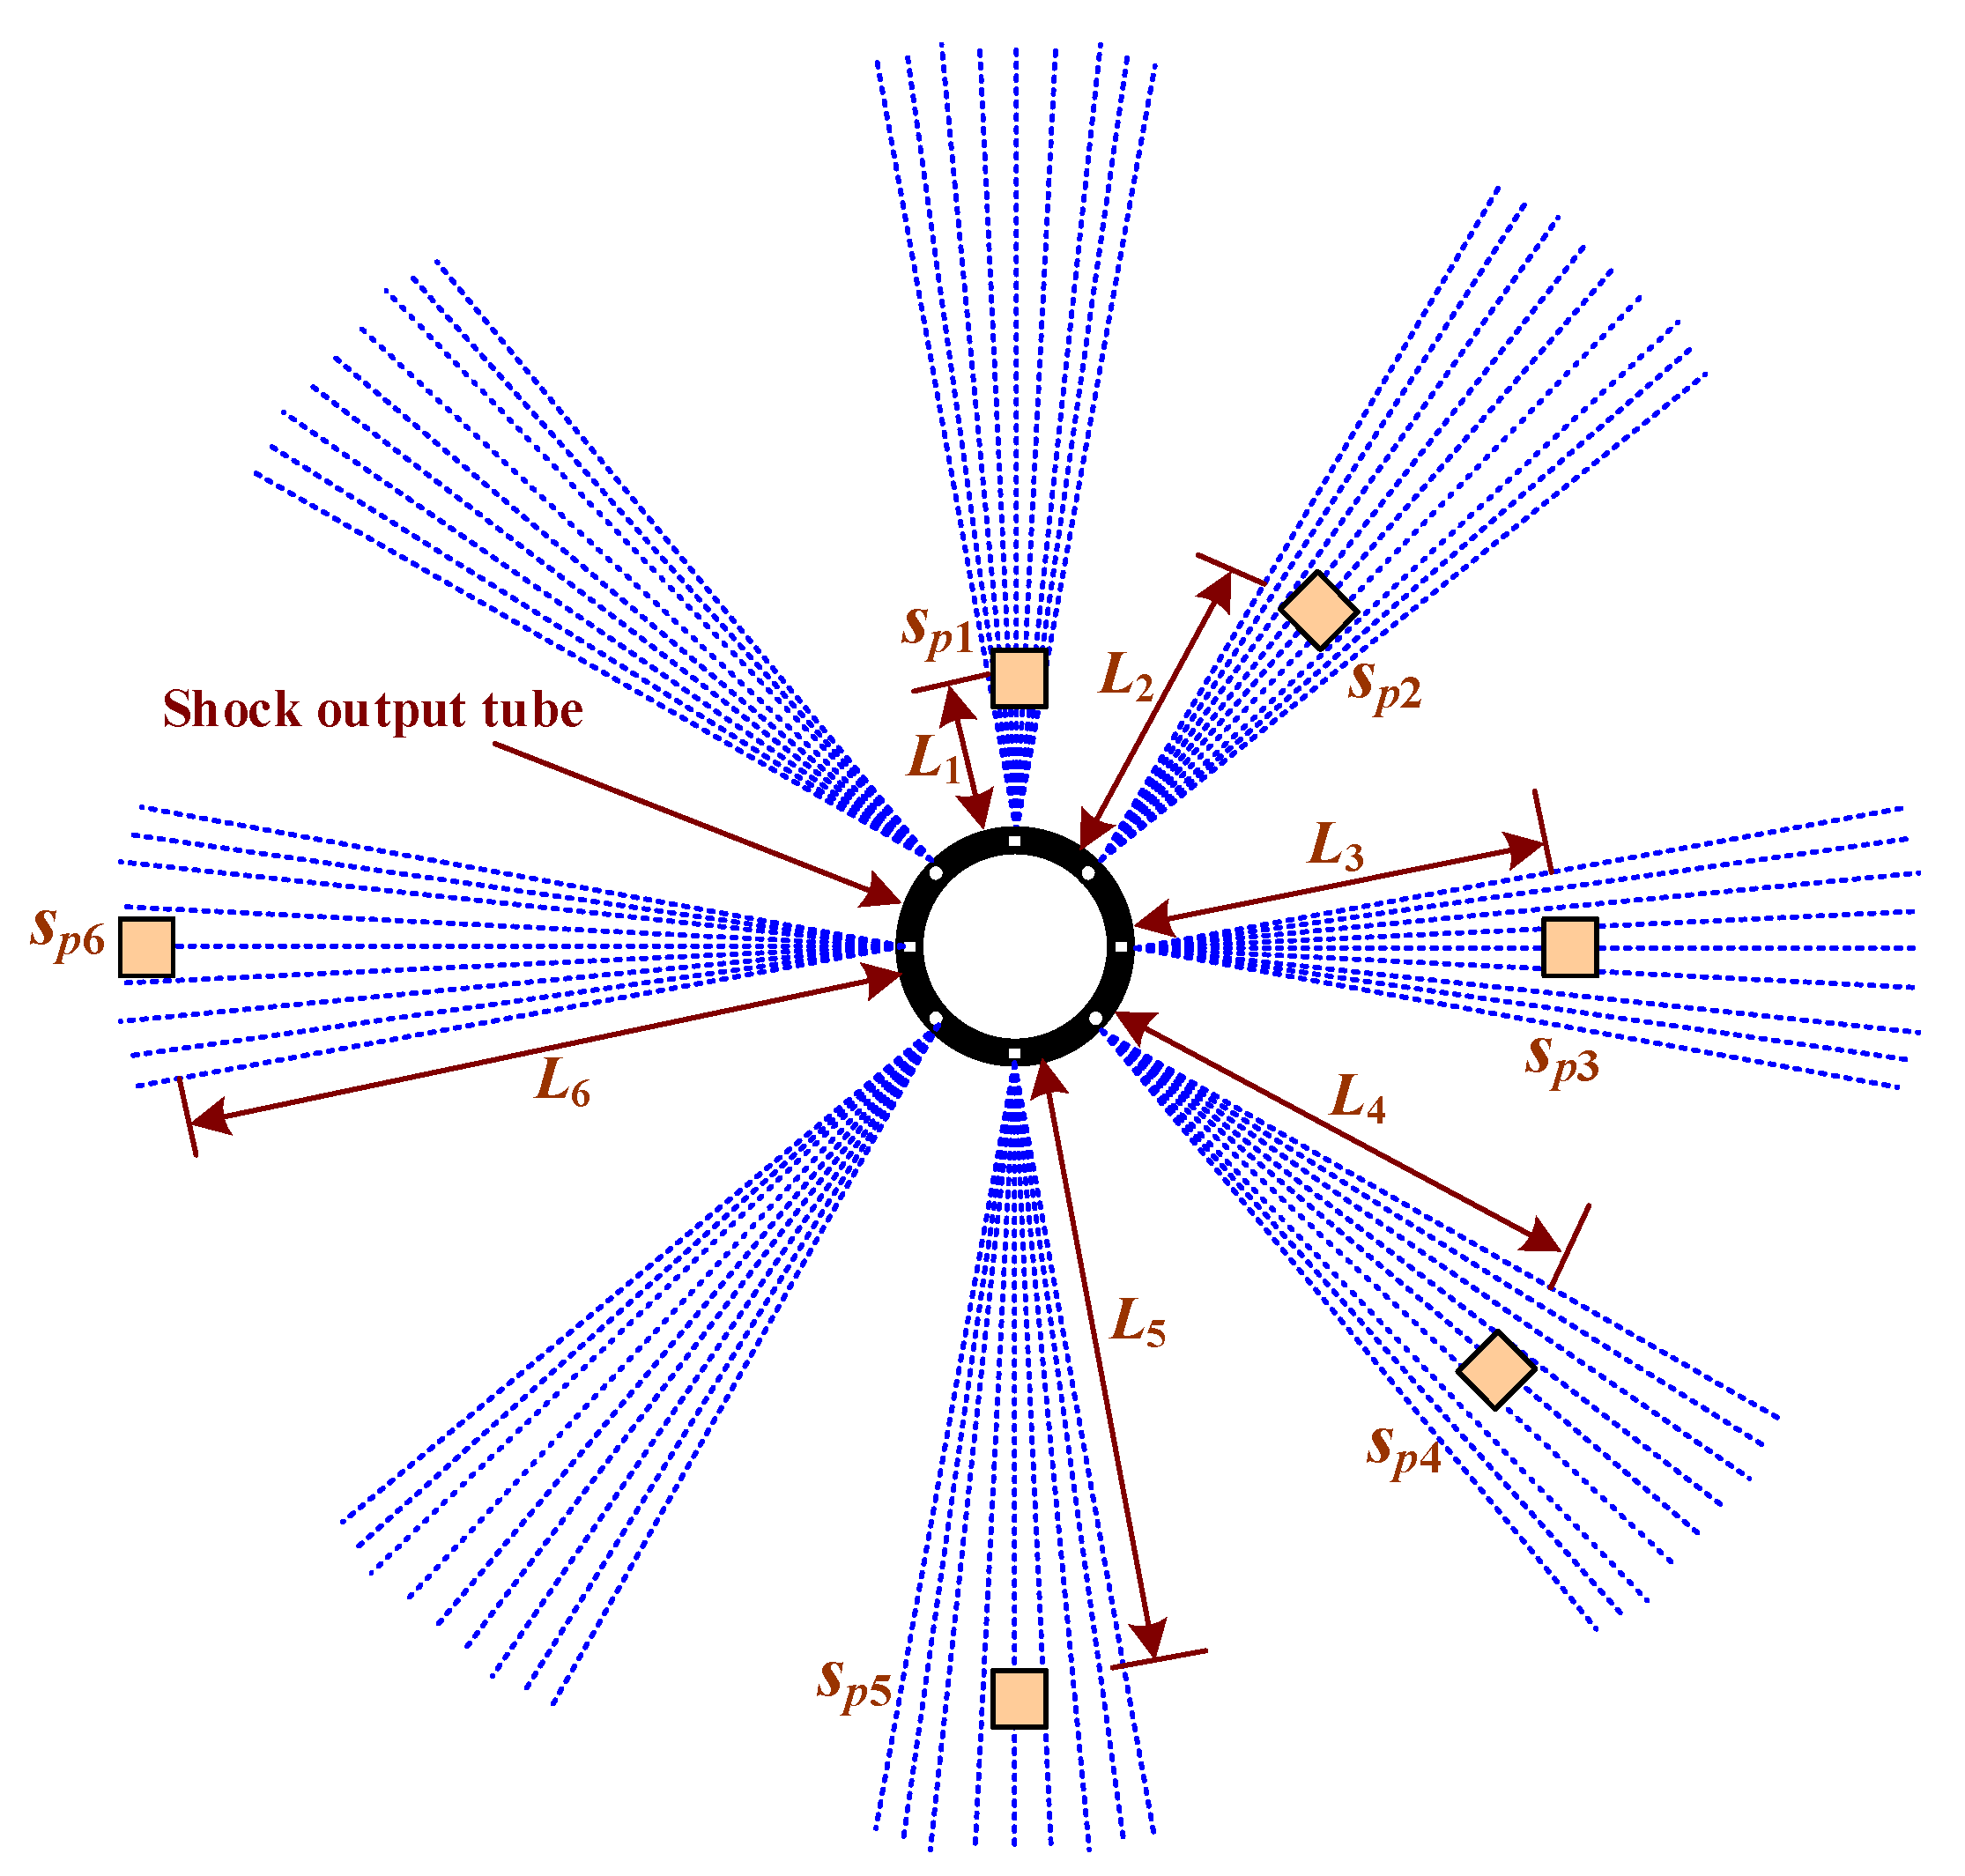
This study used LabVIEW graphical language with version 2014 SP1 [31,32,33] to develop automatic monitoring software for shockwave emission. This monitoring software can automatically capture the pressure signals of shockwave impact through the NI USB-6351 data acquisition card [26]. We conducted pressure measurement experiments on the shockwave impact in a water tank to monitor the pressures and distances of the shockwaves emitted from the output tube. We used a tank pressure sensor (spt), an output pressure sensor (spo), and six soil pressure sensors (sp1, …, spm, m = 6), which were buried at six different distances (L1, L2, L3, L4, L5, and L6) around the shock output tube, and the direction of the shockwaves was selected, as shown in Figure 12. Their distances were from near to far, that is, L1 < L2 < L3 < L4 < L5 < L6. The calibration procedure is performed for each sensor every year. As a result, spt was calibrated with an accuracy of ±1 kPa, spo was calibrated with an accuracy of ±0.1 MPa, and sp1sp6 were calibrated with an accuracy of ±0.01 MPa.
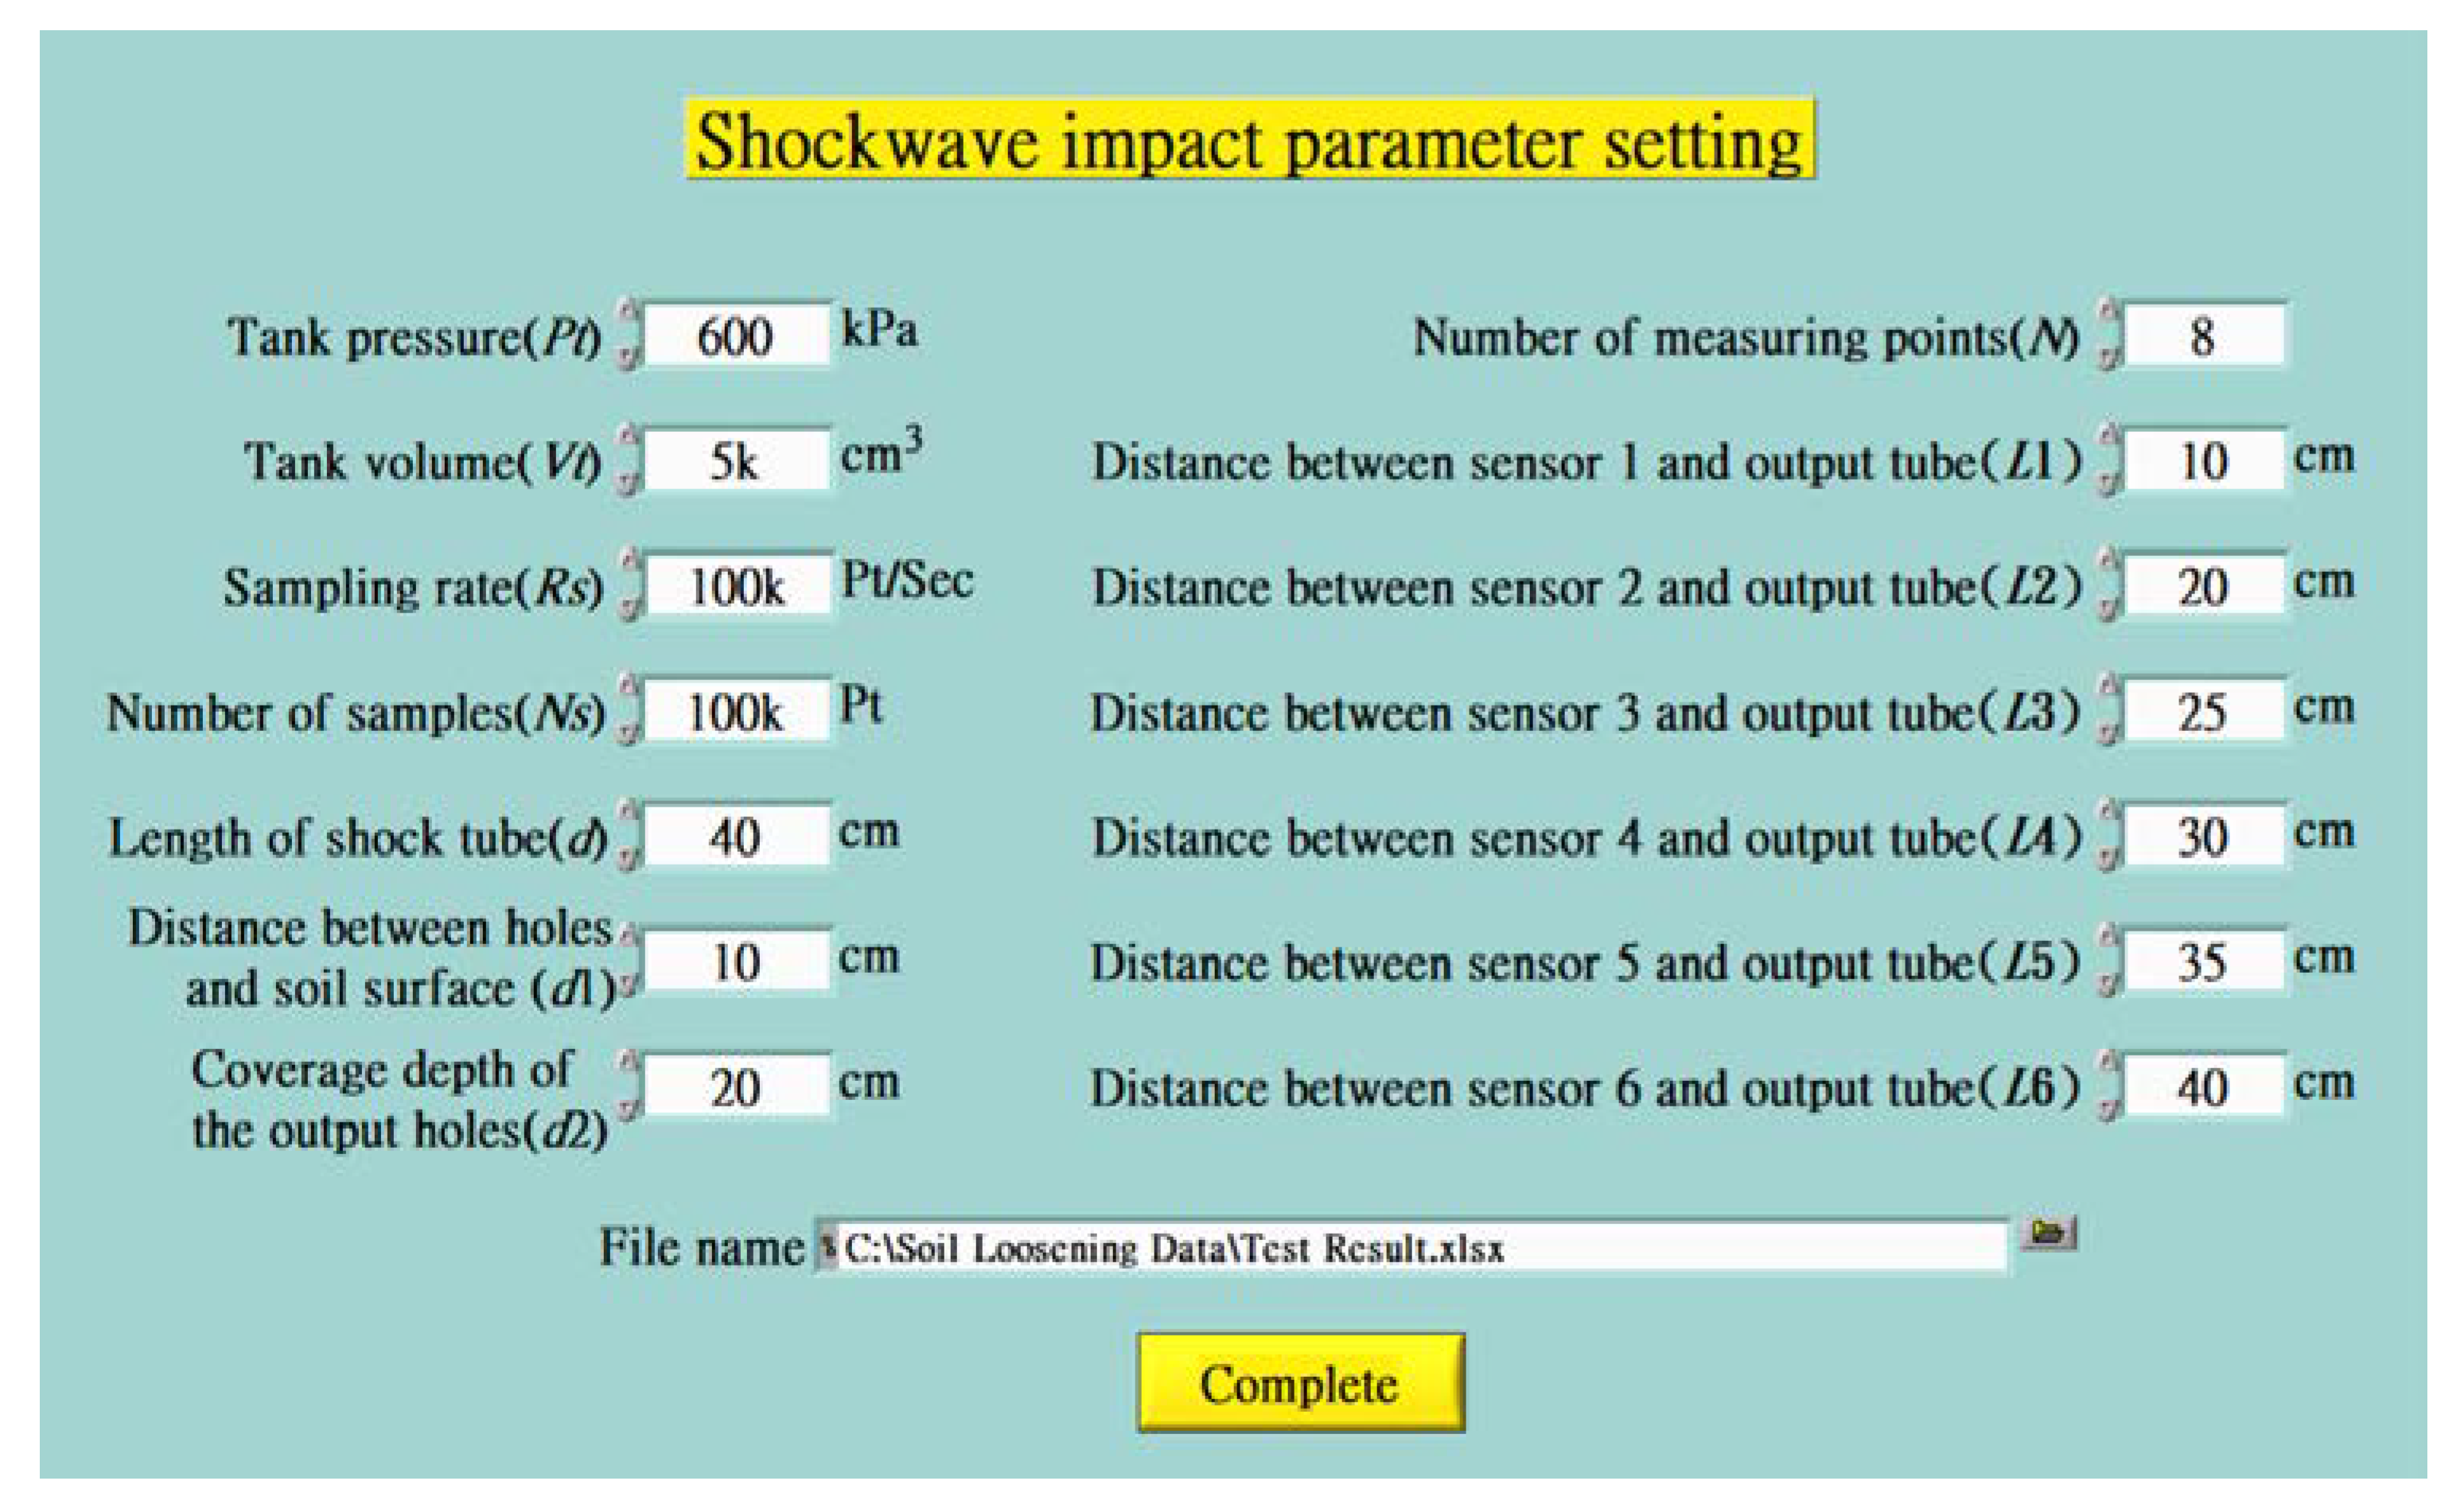
In addition, considering that the speed of the shockwave is too fast, we used the buffer sampling method to directly capture all the pressure data detected by the six sensors in 1 s and store them in the buffer of the USB-6351 data acquisition card. This buffer can store 800,000 data allocated to eight channels and 100,000 records per channel. The monitoring host then reads the pressure data from the buffer and puts them into the computer for processing, drawing, and analysis. In the automatic monitoring software, the user can first set various monitoring parameters in the parameter-setting screen shown in Figure 13, such as tank pressure Pt (600 kPa), soil texture (Silt), pressure measurement points N (8), tank volume Vt (5000 cm3), sampling rate Rs (100,000 Pt/Sec), the number of samples Ns (100,000 Pt), the file name (C:\Soil Loosening Data\Test Results.xls), and shock output tube parameters such as d (40 cm), d1 (10 cm), d2 (20 cm), L1 (10 cm), L2 (20 cm), L3 (25 cm), L4 (30 cm), L5 (35 cm), and L6 (40 cm). The values in brackets are user-set values.
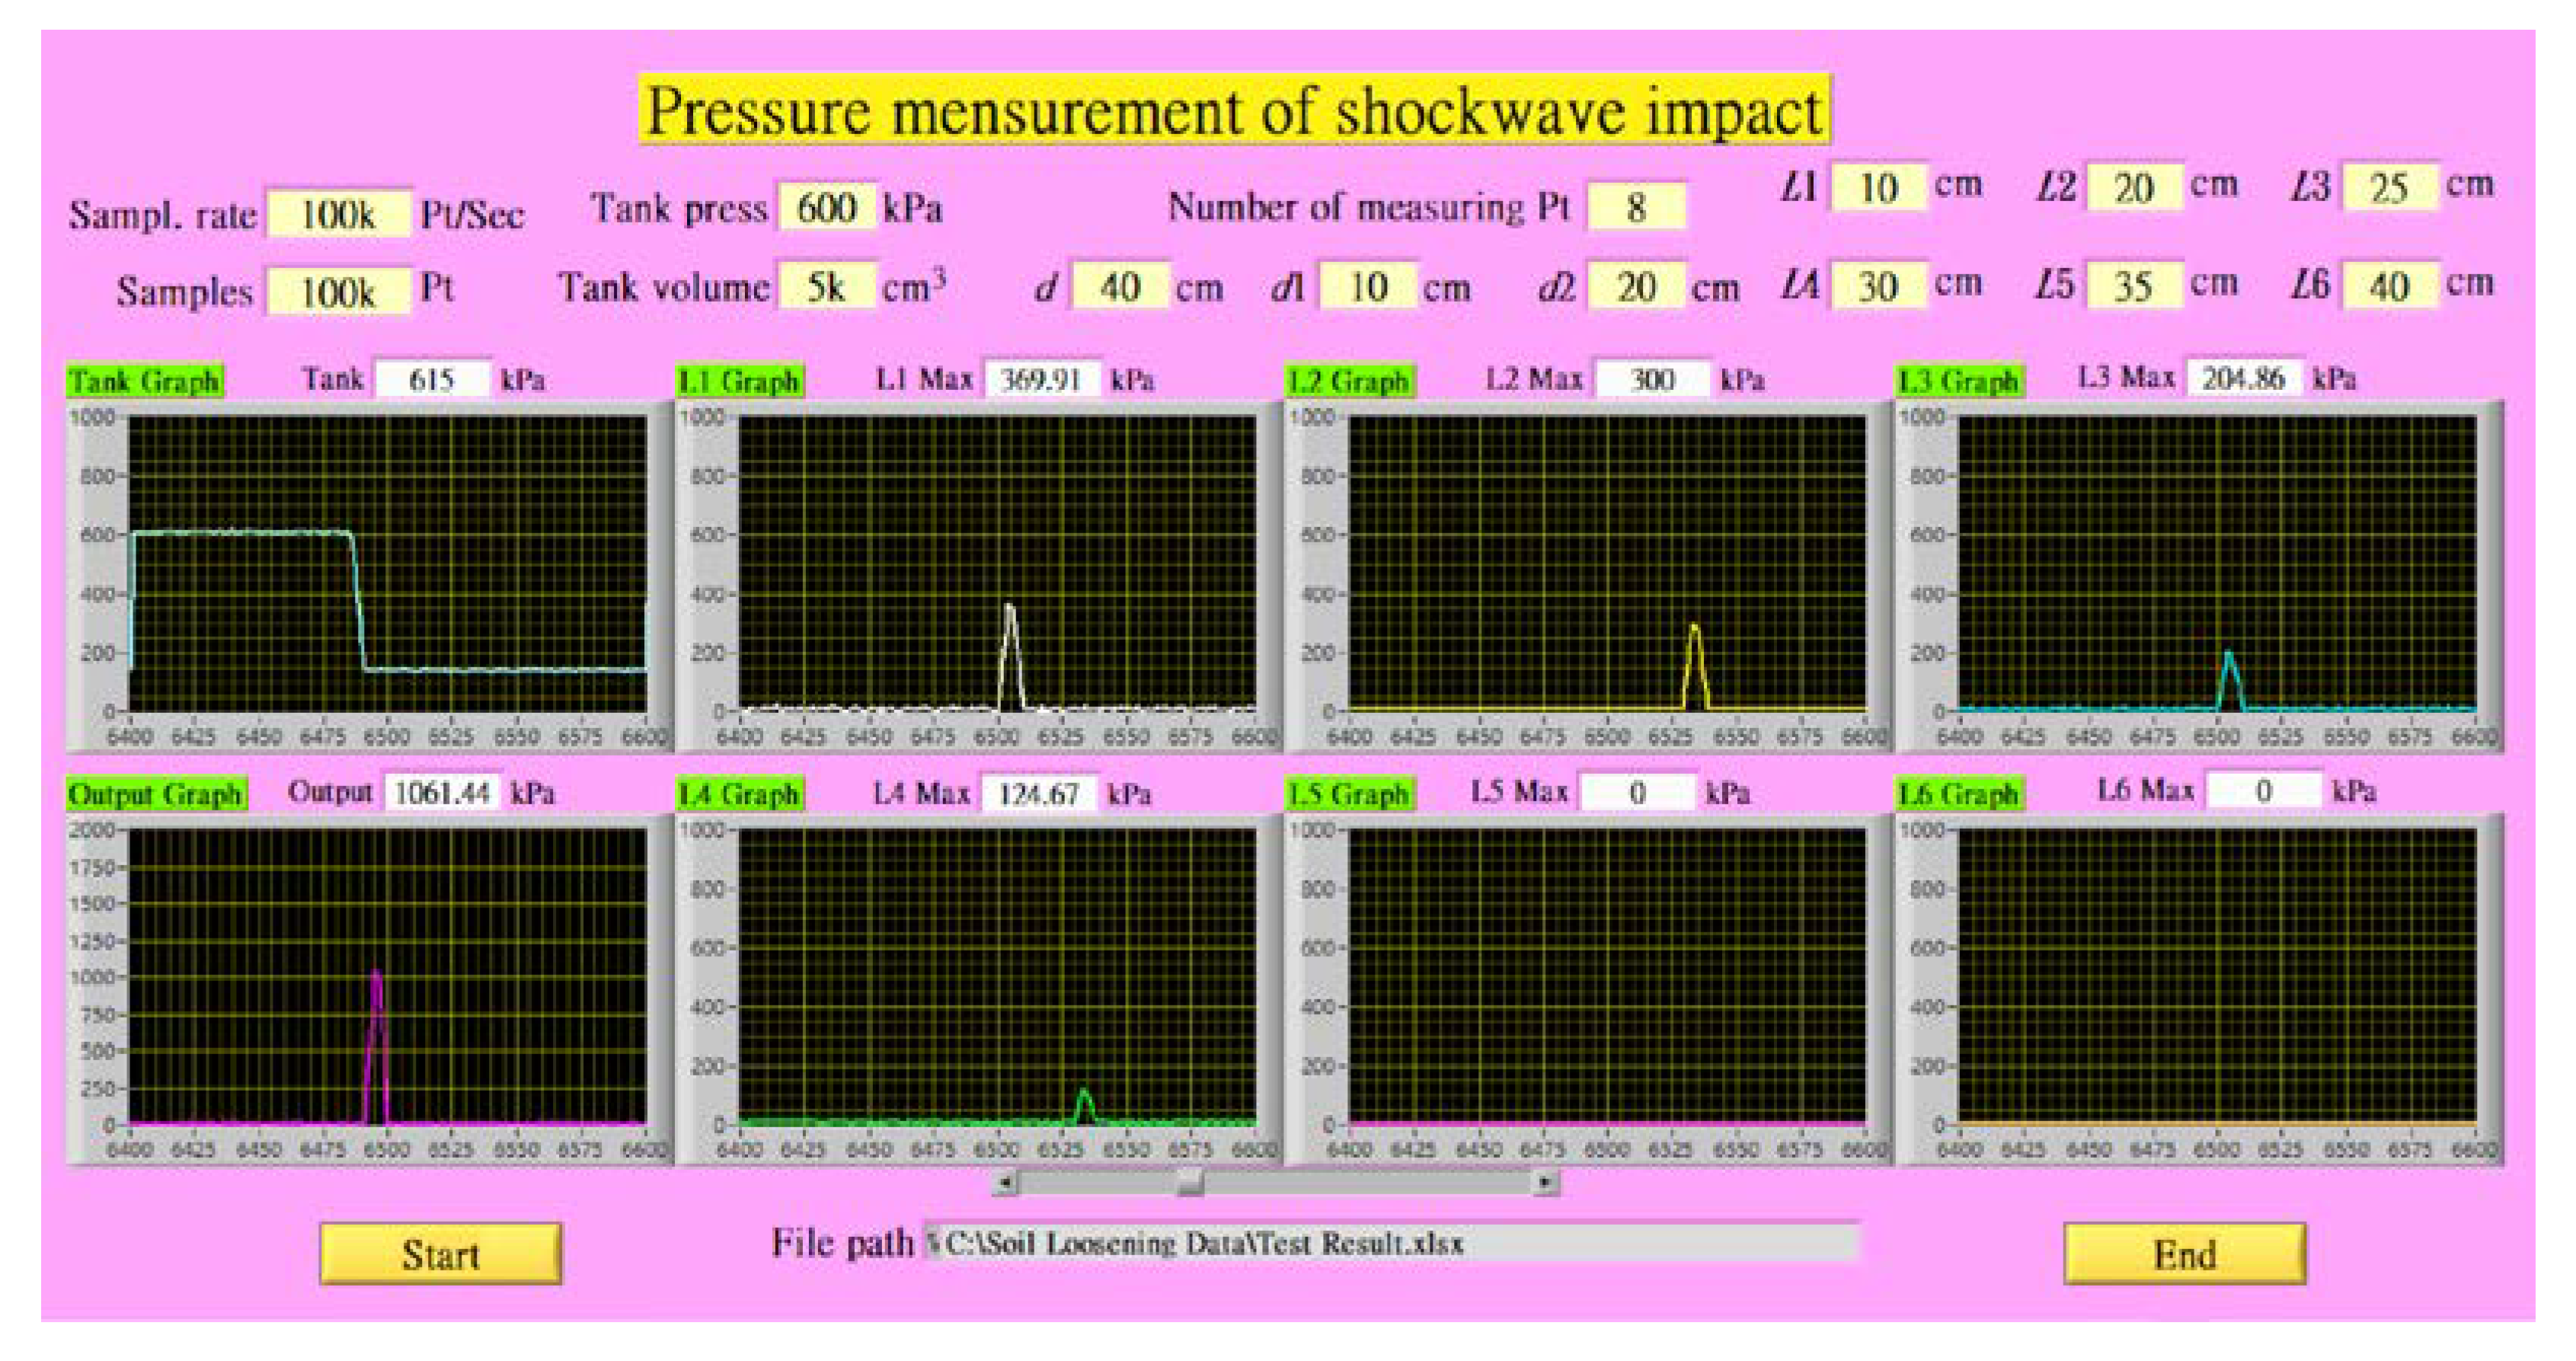
Figure 14 shows the pressure-monitoring screen of shockwave impact. The top of the screen displays the various parameters set by the user. The middle of the screen contains eight pressure curve graphs (N = 8), including the tank graph (pt curve), output graph (po curve), and L1 graph (ps1 curve)−L6 graph (ps6 curve). They display the pressure data measured by eight sensors (spt, spo, sp1sp6). The system automatically displays the maximum pressure of each curve in the center of the curve graph to help users observe and analyze the effectiveness of shockwave impact. We define the maximum pressure ps1max of ps1 curve data as in Equation (18). The displayed minimum (xmin) and maximum (xmax) values on the X-axis are defined in Equations (19) and (20):
p s 1 m a x = m a x ( p s 1 i , i = 1 ,   , N s )
x m i n = x k N x 2 ,   w h e r e   p s 1 k = p s 1 m a x
x max = x min + N x
where Nx is the number of display points on the X-axis. The maximum pressure of the ps1 curve appears at the kth point, which is displayed at the center of the X-axis display range (xmin to xmax) of the L1 graph. The display range of the other seven graphs is also xmin to xmax. In Figure 13, the display ranges of the eight graphs are all set to Nx = 200, xmin = 6400, and xmax = 6600. We display the maximum pressure value of each curve above the corresponding curve graph.
As shown in the tank and output pressure curves in Figure 13, when a shockwave is generated, the tank pressure will first drop sharply from a high pressure of about 600 kPa to a low pressure of about 140 kPa. Then, the output pressure will have a high-pressure pulse wave (about 1060 kPa). From the pressure curves of the L1 graph to the L6 graph, we can see that the sensors sp1 to sp4 can detect the pressure pulses (psimax > 0, i = 1, …, 4), while the sensors of sp5 and sp6 cannot (psimax = 0, i = 5, 6). Therefore, the shockwave’s maximum emitting distance (demax) can reach L4 (30 cm).

6. Analysis of Pressure Measurement Experiments

In this study, we conducted automatic monitoring experiments of shockwave emission for four combinations of storage tank volumes Vt of 3000 cm3 (with a length of 60 cm) and 5000 cm3 (with a length of 100 cm) and storage tank pressures Pt of 400 kPa and 600 kPa. Table 1 shows the results of the maximum pressure measurements for the four soil-loosening experiments, where pomax represents the maximum value of po and psimax (i = 1, …, 6) is the maximum value of psi (i = 1, …, 6).
From the maximum pressure values of the four experiments recorded in Table 1, we can see that in experiments 1 and 2 (Vt = 3000 cm3), the demax of the shockwave is 25 cm (psimax = 0, i = 4, 5, 6). In experiments 3 and 4 (Vt = 5000 cm3), the demax of the shockwave is 30 cm (psimax = 0, i = 5, 6). Therefore, the larger the storage tank volume, the farther the shockwave impacts the soil. Comparing experiment 1 (Pt = 400 kPa) with experiment 2 (Pt = 600 kPa), we can find that the ps1max, ps2max, and ps3max in the latter are all higher than those in the former. The greater the tank pressure, the greater the pressure of the shockwave impact. We can also get the same result by comparing the ps1max, ps2max, ps3max, and ps4max in experiment 3 and experiment 4.
Comparing the pressure measurement results of each experiment in Table 1 with the numerical simulation of the time-dependent pressure variation in Figure 8, we can find that in experiment 3, the maximum output pressure pomax is 1036.3 kPa and the maximum pressure at the L1 position ps1max is 345.4 kPa. In numerical simulation, when we set the pressure at the shock tube inlet to 10 atm (about 1000 kPa), the shockwave pressure emitted from each hole can increase to 3.4 atm (about 340 kPa). We can see that the pressure measurement results of experiment 3 are consistent with the numerical simulation results in Figure 8.
In the shockwave soil-loosening visual observation experiment in Section 4, we can observe that shockwaves are emitted from the output holes in eight directions and a top-down order. In the measurement experiment in Section 5, we buried the soil pressure sensors sp1, sp3, sp5, and sp6 in the emission directions of the output holes of the first circle (i.e., north, east, south, and west) according to the measurement plan in Figure 12. We buried sp2 and sp4 in the emission directions of the output holes of the second circle (northeast and southeast). The measurement results shown in Table 1 show that the maximum pressures measured by the sensors within the maximum emission distance demax are all greater than zero, and the pressure decreases as the distance increases. For example, in experiments 1 and 2, ps1max > ps2max > ps3max > 0, and in experiments 3 and 4, ps1max > ps2max > ps3max > ps4max > 0. This proves that shockwaves can be emitted from output holes in different directions. In addition, by comparing the positions of the maximum pressure of each curve in Figure 14, we can see that the positions of ps1max and ps3max detected by sp1 and sp3 are approximately 6505, while the positions of ps2max and ps4max detected by sp2 and sp4 are approximately 6535. This proves that the propagation of the shockwave first reaches sp1 and sp3 in the first circle, and sp2 and sp4 in the second circle arrive later.

7. Conclusions

This paper develops a device that uses supersonic high-pressure shockwaves to loosen the soil in the root zone of crops. It conducts CFD numerical simulation of shockwave loosening to analyze the transmission of shockwaves in the soil and quantify its impact on soil porosity and compaction. We conducted visual observation experiments on the multi-directional emission of shockwaves and pressure measurement experiments on shockwave impact. Through the analysis of these experimental results, we can draw the following conclusions: 1. The larger the storage tank volume of the shockwave generator, the farther the shockwave impacts the soil; the greater the storage tank pressure, the greater the shockwave impact pressure; therefore, users can set different storage tank volumes or pressures according to their needs to produce different shockwave-loosening effects. 2. By comparing the pressure measurement experiments with the numerical simulation of the time-dependent pressure variation, we found that pomax = 1036.3 kPa and ps1max = 345.4 kPa in experiment 3. This pressure measurement result is consistent with the numerical simulation results which show the shock tube inlet pressure is 10 atm (about 1000 kPa) and the output hole pressure can reach 3.4 atm (about 340 kPa). 3. Through the visual observation experiments and pressure measurement experiments of shockwave impact, we can prove that the shockwaves propagate from top to bottom in the output tube and are emitted from the output holes in multiple directions in sequence to impact the soil outside the output tube to achieve the goal of soil loosening.
We have completed the pressure measurement experiments of shockwave impact in a water tank. In the future, we will conduct shockwave emission and soil-loosening measurement experiments in a pectin tank and actual soil to verify the effectiveness of soil loosening by high-pressure shockwaves. In addition, since the soil is the world’s third-largest carbon storage reservoir, traditional farming uses rotary plows to till the soil. Although this can improve soil aeration, each tillage will emit about 30% of carbon, which is not conducive to promoting net-zero carbon emissions goals. The shockwave-loosening mechanism proposed in this study does not damage the soil surface during the loosening process, thus preventing the soil from being disturbed by large-scale tillage, which will reduce the emission of carbon stored in the soil into the atmosphere.

8. Patents

In this research, we have obtained two patents from the R.O.C. In the design of the shockwave generator, we have obtained the patent “Generating device for supersonic shock waves [21]”. We have obtained the patent regarding soil loosening by supersonic shockwaves: “Supersonic shock wave soil loosening and hole fertilization device [23]”.

Author Contributions

Conceptualization, M.-S.H., U.-K.H., S.-H.T. and C.-H.L.; methodology, M.-S.H., U.-K.H., S.-H.T. and C.-H.L.; software, M.-S.H. and U.-K.H.; validation, M.-S.H., U.-K.H., S.-H.T. and C.-H.L.; formal analysis, M.-S.H. and S.-H.T.; investigation, M.-S.H., S.-H.T. and C.-H.L.; resources, M.-S.H. and U.-K.H.; data curation, M.-S.H. and U.-K.H.; writing—original draft preparation, M.-S.H., U.-K.H. and S.-H.T.; writing—review and editing, M.-S.H. and U.-K.H.; visualization, M.-S.H., U.-K.H. and S.-H.T.; supervision, M.-S.H.; project administration, M.-S.H.; funding acquisition, M.-S.H., U.-K.H. and S.-H.T. All authors have read and agreed to the published version of the manuscript.

Funding

Three research projects funded this research. Their funders are all the National Science Council of the R. O. C., and their funding numbers are NSTC 113-2221-E-344-001, NSTC 113-2221-E-020-010, and NSTC 113-2221-E-020-011.

Institutional Review Board Statement

This study did not require ethical approval and did not involve humans or animals.

Informed Consent Statement

Not applicable.

Data Availability Statement

No new data were created, and data are unavailable due to privacy restrictions.

Acknowledgments

This study acknowledges Su You-Lin from Jiurong Industrial Co., Ltd., for his hardware technical support.

Conflicts of Interest

The authors declare no conflicts of interest.

References

  1. McNear, D.H., Jr. The Rhizosphere: Roots, Soil and Everything in Between. Nat. Educ. Knowl. 2013, 4, 1. [Google Scholar]
  2. Lazarovitch, N.; Vanderborght, J.; Jin, Y.; Van Genuchten, M.T. The Root Zone: Soil Physics and Beyond. Vadose Zone J. 2018, 17, 1–6. [Google Scholar] [CrossRef]
  3. Wesseling, J.; van Wijk, W.R. Soil physical conditions in relation to drain depth. Drain. Agric. Lands 1957, 7, 461–504. [Google Scholar]
  4. Lin, Y.Z.; Chen, B.H.; Cai, Y.P. Citrus Growth and Cultivation Management; Special Issue No. 175; Agricultural Research Institute, Council of Agriculture: Taichung, Taiwan, 2013. [Google Scholar]
  5. Guo, Y.G. Soil. In Introduction to Agriculture; Shen, Z.M., Ed.; National Chiayi University: Chiayi, Taiwan, 2007; pp. 69–78. [Google Scholar]
  6. Bhattarai, S.P.; Pendergast, L.; Midmore, D.J. Root aeration improves yield and water use efficiency of tomato in heavy clay and saline soils. Sci. Hortic. 2006, 108, 278–288. [Google Scholar] [CrossRef]
  7. Ben-Noah, I.; Friedman, S.P. Review and evaluation of root respiration and of natural and agricultural processes of soil aeration. Vadose Zone J. 2018, 17, 170119. [Google Scholar] [CrossRef]
  8. Abuarab, M.; Mostafa, E.; Ibrahim, M. Effect of air injection under subsurface drip irrigation on yield and water use efficiency of corn in a sandy clay loam soil. J. Adv. Res. 2013, 4, 493–499. [Google Scholar] [CrossRef] [PubMed]
  9. Ben-Noah, I.; Fredman, S.P. Aeration of clayey soils by injecting air through subsurface drippers: Lysimetric and field experiments. Agric. Water Manag. 2016, 176, 222–233. [Google Scholar] [CrossRef]
  10. Niu, W.Q.; Fan, W.T.; Persaud, N.; Zhou, X.B. Effect of Post-Irrigation Aeration on Growth and Quality of Greenhouse Cucumber. Pedophere 2013, 23, 790–798. [Google Scholar] [CrossRef]
  11. Li, J.F.; Zheng, D.Y.; Chang, B.C.; Jiang, Y.L. Improving Soil Aeration by water jet to restore the tree vigor of Pomelo. J. Taiwan Soc. Hort. Sci. 2018, 64, 269–277. [Google Scholar]
  12. Chen, K.Z. Nutritional Diagnosis and Fertilization of Fruit Trees; Xu Style Cultural and Educational Foundation: Berlin, Germany, 1992. [Google Scholar]
  13. Zhu, Y.Z.; Li, Z.H.; Yang, Z.W.; Huang, W.D. Effects of Permaculture on Soil Organic Carbon Pools. J. Weed Soc. Repub. China 2018, 39, 85–96. [Google Scholar]
  14. Reicosky, D. Tillage-induced CO2 emission from soil. Nutr. Cycl. Agroecosyst. 1997, 49, 273–285. [Google Scholar] [CrossRef]
  15. Mühlbachová, G.; Růžek, P.; Kusá, H.; Vavera, R. CO2 emissions from soils under different tillage practices and weather conditions. Agronomy 2023, 13, 3084. [Google Scholar] [CrossRef]
  16. Li, Z.; Zhang, Q.; Li, Z.; Qiao, Y.; Du, K.; Yue, Z.; Tian, C.; Leng, P.; Cheng, H.; Chen, G.; et al. Responses of soil CO2 emissions to tillage practices in a wheat maize cropping system: A 4-year field study. Field Crops Res. 2023, 294, 108832. [Google Scholar] [CrossRef]
  17. Jones, O.R.; Hauser, V.L.; Popham, T.W. No-tillage effects on infiltration and water conservation on dryland. Trans. ASAE 1994, 37, 473–479. [Google Scholar] [CrossRef]
  18. Ben-Dor, G. Shockwave Reflections Phenomena; Springer: New York, NY, USA, 1991. [Google Scholar]
  19. Wen, C.Y. Pilot Supersonic Combustion Ramjet Engine Research Project (II); Achievements Report on the Special Research Program of the National Science Council; NSC 99-2623-E-006-010-D; National Science Council: Taipei, Taiwan, 2011.
  20. Hu, M.S.; Su, R.H. Generating Device for Supersonic Shock Waves. R.O.C. New Patent M553377, 21 December 2017. [Google Scholar]
  21. Hu, M.S.; Hsu, U.K. Design of a New Supersonic Shock Wave Generator and Application in Power Generation. Appl. Sci. 2024, 14, 5074. [Google Scholar] [CrossRef]
  22. Hu, M.S.; Tsai, J.Y. The Application of Supersonic Shock Waves in Removing Pipeline Obstructions. J. Air Force Inst. Technol. 2024, 23, 23–32. [Google Scholar]
  23. Ceramic Pressure Transmitter, Type: PM20C. Available online: https://www.fullwins.com.tw/uploadfiles/38/ftp/pdf/pm20c_c.pdf (accessed on 21 February 2025).
  24. Model 113B23, ICP® Pressure Sensor Installation and Operating Manual, PCB Piezotronics, Inc. Available online: https://www.pcb.com/contentstore/docs/PCB_Corporate/Pressure/Products/Manuals/113B23.pdf (accessed on 2 February 2025).
  25. Long Strip Load Cell, UBX-100kg, CHUNDE. Available online: https://www.chunde.com.tw/pdf/19374/UBA%20%20UBX%20%20UBAX.pdf (accessed on 21 February 2025).
  26. NI USB-6351, X Series Multifunction DAQ (16AI, 24DIO, 2AO), 1.25MS/s Single-Channel Sampling Rate, National Instruments. Available online: https://www.ni.com/docs/zh-TW/bundle/pcie-usb-6351-specs/page/specs.html (accessed on 2 February 2025).
  27. Liou, M.S. A Continuing Search for a Near-Perfect Numerical Flux Scheme, Part I: AUSM+, NASA TM 106524; NASA: Washington, DC, USA, March 1994.
  28. Choi, Y.H.; Merkle, C.L. The application of preconditioning in viscous flows. J. Comput. Phys. 1993, 105, 207–233. [Google Scholar] [CrossRef]
  29. Weiss, J.M.; Smith, W.A. Preconditioning applied to variable and constant density flows. AIAA J. 1995, 33, 2050–2057. [Google Scholar] [CrossRef]
  30. Hsu, U.K.; Tai, C.H.; Tsai, C.H. All Speed and High-Resolution Scheme Applied to Three-Dimensional Multi-Block Complex Flowfield System. Chin. J. Mech. Ser. A 2004, 20, 21–33. [Google Scholar] [CrossRef]
  31. Hsiao, T.C.; Wang, C.Y.; Chu, J.W. Virtual Instrument Control Programming—LabVIEW 201X; Gao Li Book Corp.: New Taipei, Taiwan, 2014. [Google Scholar]
  32. Chen, C.C. LabVIEW Applications (Include Automatic Measurement and Remote Control); Gao Li Book Corp. Ltd.: New Taipei, Taiwan, 2014. [Google Scholar]
  33. Hsu, Y.H. Interface Design and Practice—Using LabVIEW; Chuan Yua Book Corp. Ltd.: Taipei, Taiwan, 2014. [Google Scholar]
Figure 1. Plowing is a common practice to improve soil aeration. (Source: https://www.yunung.com/product/24/73, accessed on 2 February 2025.)
Applsci 15 02714 g001
Figure 2. System architecture of the high-pressure shockwave soil-loosening device.
Applsci 15 02714 g002
Figure 3. The physical structure of the supersonic shockwave soil loosening device: (a) shockwave soil-loosening device; (b) drilling unit.
Applsci 15 02714 g003
Figure 4. Design and production of a shock output tube: (a) design of a shock output tube; (b) physical entity of a shock output tube.
Applsci 15 02714 g004
Figure 5. Propagation of shockwaves at different times.
Applsci 15 02714 g005
Figure 6. Pressure variations at each nozzle exit at different times.
Applsci 15 02714 g006
Figure 7. Mach number variations at each nozzle exit at different times.
Applsci 15 02714 g007
Figure 8. Time-dependent pressure variations at the nozzle exit.
Applsci 15 02714 g008
Figure 9. The built acrylic transparent observation tank: (a) an acrylic transparent observation tank; (b) the shock output tube inserted into the water of the tank.
Applsci 15 02714 g009
Figure 10. A visual observation experiment of a top-view shockwave emission: (a) the shockwaves are just emitted; (b) shockwaves are in the process of being emitted; (c) the ejected shockwaves create large waves.
Applsci 15 02714 g010
Figure 11. A visual observation experiment of a side-view shockwave emission: (a) the shockwaves is just emitted; (b) shockwaves are in the process of being emitted; (c) the ejected shockwaves create large waves.
Applsci 15 02714 g011
Figure 12. Shockwave impact monitoring diagram.
Applsci 15 02714 g012
Figure 13. Shockwave impact parameter-setting screen.
Applsci 15 02714 g013
Figure 14. The pressure-monitoring screen of shockwave impact.
Applsci 15 02714 g014
Table 1. Maximum pressure measurement results of four shockwave impact experiments.
TestVtPtpomaxps1maxps2maxps3maxps4maxps5maxps6maxdemax
(cm3)(kPa)(kPa)(kPa)(kPa)(kPa)(kPa)(kPa)(kPa)(cm)
13000400824.3226.4165.265.800025
23000600865.8273.6182.492.500025
350004001036.3342.4263.6186.796.80030
450006001161.4369.9317.7204.9124.90030
Disclaimer/Publisher’s Note: The statements, opinions and data contained in all publications are solely those of the individual author(s) and contributor(s) and not of MDPI and/or the editor(s). MDPI and/or the editor(s) disclaim responsibility for any injury to people or property resulting from any ideas, methods, instructions or products referred to in the content.