Article

Collaborative Learning Groupings Incorporating Deep Knowledge Tracing Optimization Strategies

School of Education, Zhejiang University of Technology, 288 Liuhe Road, Xihu District, Hangzhou 310023, China
*
Author to whom correspondence should be addressed.
Appl. Sci. 2025, 15(5), 2692; https://doi.org/10.3390/app15052692
Submission received: 30 December 2024 / Revised: 4 February 2025 / Accepted: 6 February 2025 / Published: 3 March 2025

Abstract

:
Effective grouping in collaborative learning is crucial for enhancing the efficiency of collaborative learning. A well-structured collaborative learning group can significantly enhance the learning effectiveness of both individuals and group members. However, the current approaches to collaborative learning grouping often lack a thorough examination of students’ knowledge-level characteristics, thereby failing to ensure that the knowledge structures of group members complement each other. Therefore, a collaborative learning grouping method incorporating the optimization strategy of deep knowledge tracking is proposed. Firstly, the optimized deep knowledge tracking (DKVMN-EKC) model is used to model the knowledge state of learners to obtain the degree of knowledge mastery of learners, and then the K-means method is used to similarly cluster all learners, and finally, the learners of different clusters are assigned to suitable learning groups according to the principle of heterogeneity of grouping. Extensive experiments have demonstrated that DKVMN-EKC can precisely model students’ knowledge mastery levels and that the proposed approach facilitates effective grouping at the level of students’ knowledge structures, thereby ensuring fairer and more heterogeneous grouping results. This approach fosters positive interactions among students, enabling them to learn from one another and effectively improve their understanding of various knowledge points.

1. Introduction

Collaborative learning, as a pedagogical cornerstone, is deeply rooted in social constructivism—a theory positing that knowledge is co-constructed through social interactions and shared problem-solving. This approach transcends unidirectional knowledge transfer from teachers to students, fostering multi-dimensional exchanges among learners and instructors. Over decades, the efficacy of collaborative learning has been empirically validated [1,2], with studies demonstrating its role in enhancing theoretical proficiency, innovation, and practical application skills [3].
Recent advancements in cognitive science further elucidate the mechanisms underlying collaborative learning. The cognitive load theory suggests that distributing complex tasks among group members mitigates individual cognitive overload, thereby optimizing knowledge retention. Concurrently, distributed cognition frameworks emphasize that knowledge states emerge collectively through group interactions rather than residing solely within individuals. These theoretical foundations align with modern AI-driven tools, such as deep knowledge tracing (DKT) models [4], which dynamically map learners’ evolving competencies across shared knowledge domains.
However, to ensure that collaborative learning can be conducted effectively, it is crucial to assign each student to an appropriate learning group. Research consistently demonstrates that the effectiveness of group learning with a good organizational structure is considerably higher than that of arbitrary groups or individuals [5,6,7]. Currently, collaborative learning groups are typically grouped manually or through the application of automatic matching algorithms [8]. However, these two approaches are relatively simplistic in modeling the features of students’ knowledge levels, neglecting to consider the vast diversity in students’ knowledge compositions. Consequently, they cannot ensure the complementarity of the knowledge structures of members within the group. Even among students with the same level of achievement, there may exist notably distinct knowledge structures, and an accurate assessment of students’ knowledge states becomes paramount, as it can help uncover individual weaknesses and promote efficient communication amongst learners.
Knowledge tracing is a mainstream approach to diagnosing students’ knowledge states, and it can be used to obtain students’ cognitive states through their response data and diagnose their mastery of each knowledge point. Knowledge tracing provides a more efficient approach for accurately diagnosing students’ knowledge states and offers the possibility of further improving the complementarity of knowledge structures among group members.
In this study, to achieve the complementary grouping of knowledge structures, we conducted the following steps:
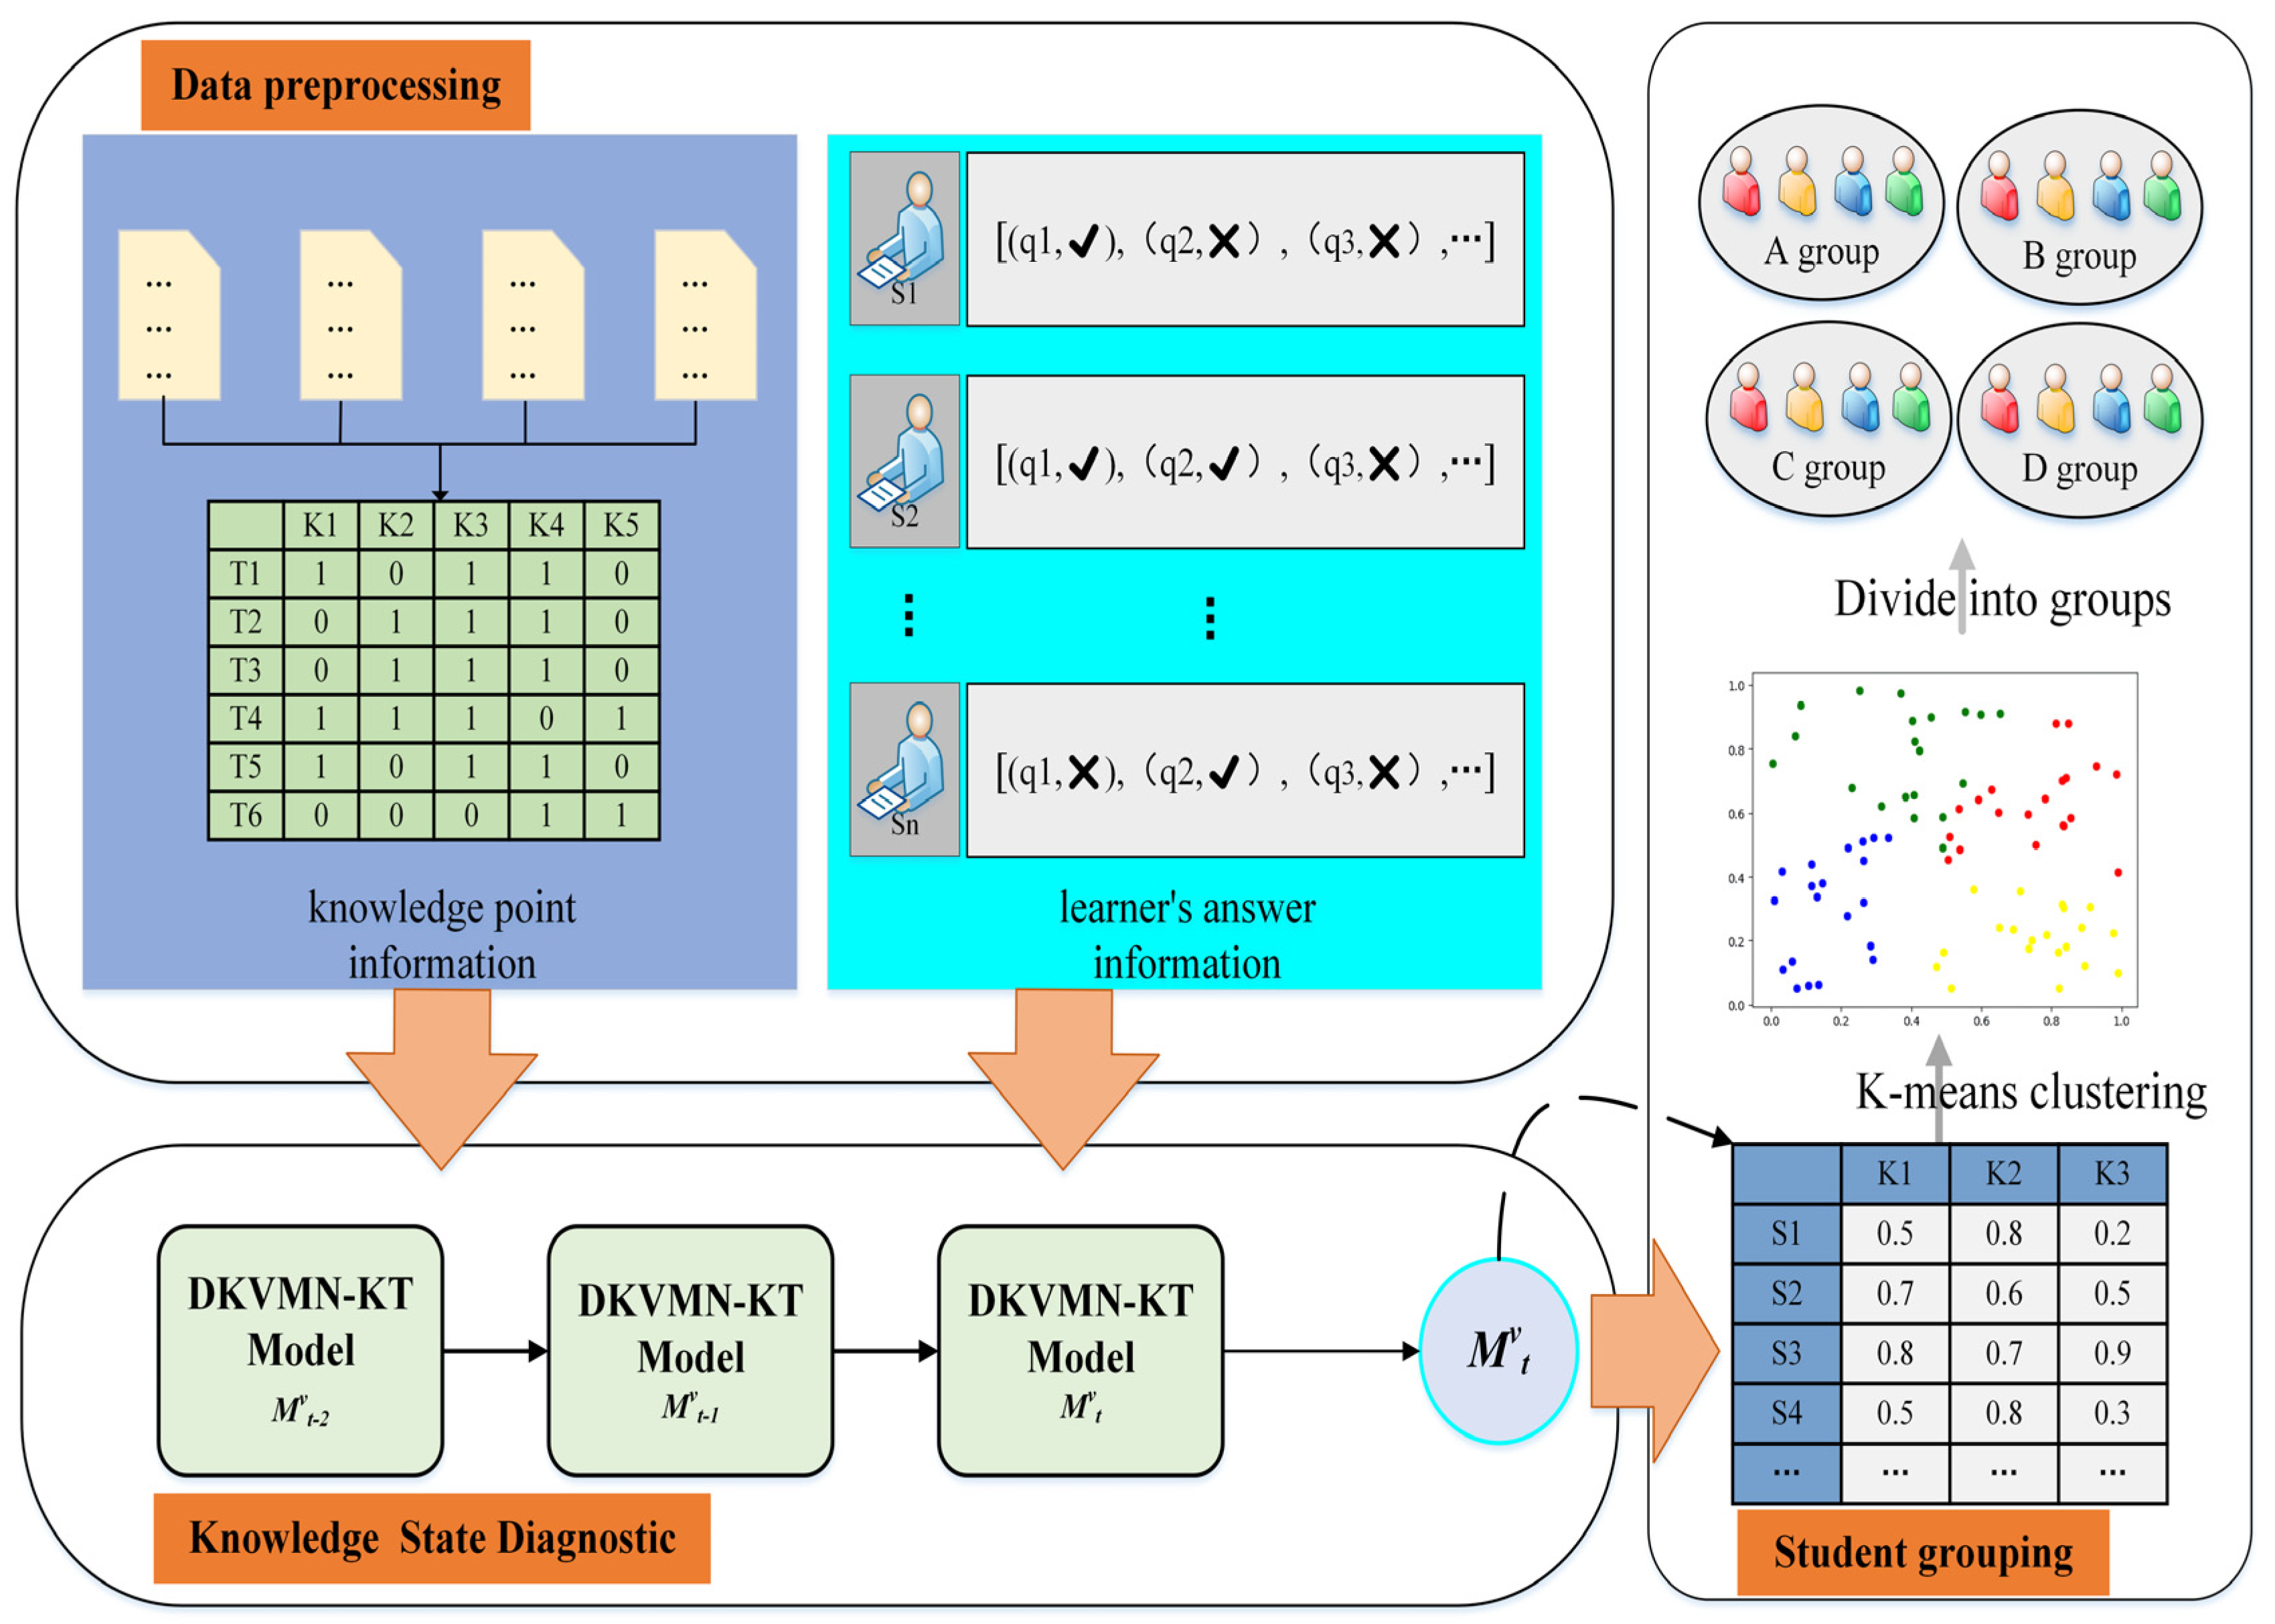
  • We considered students’ knowledge mastery levels in the grouping process of collaborative learning and presented an innovative approach that incorporated deep knowledge tracing optimization strategies. The approach included three key modules: a data processing module, a knowledge state diagnosis module, and a student grouping module.
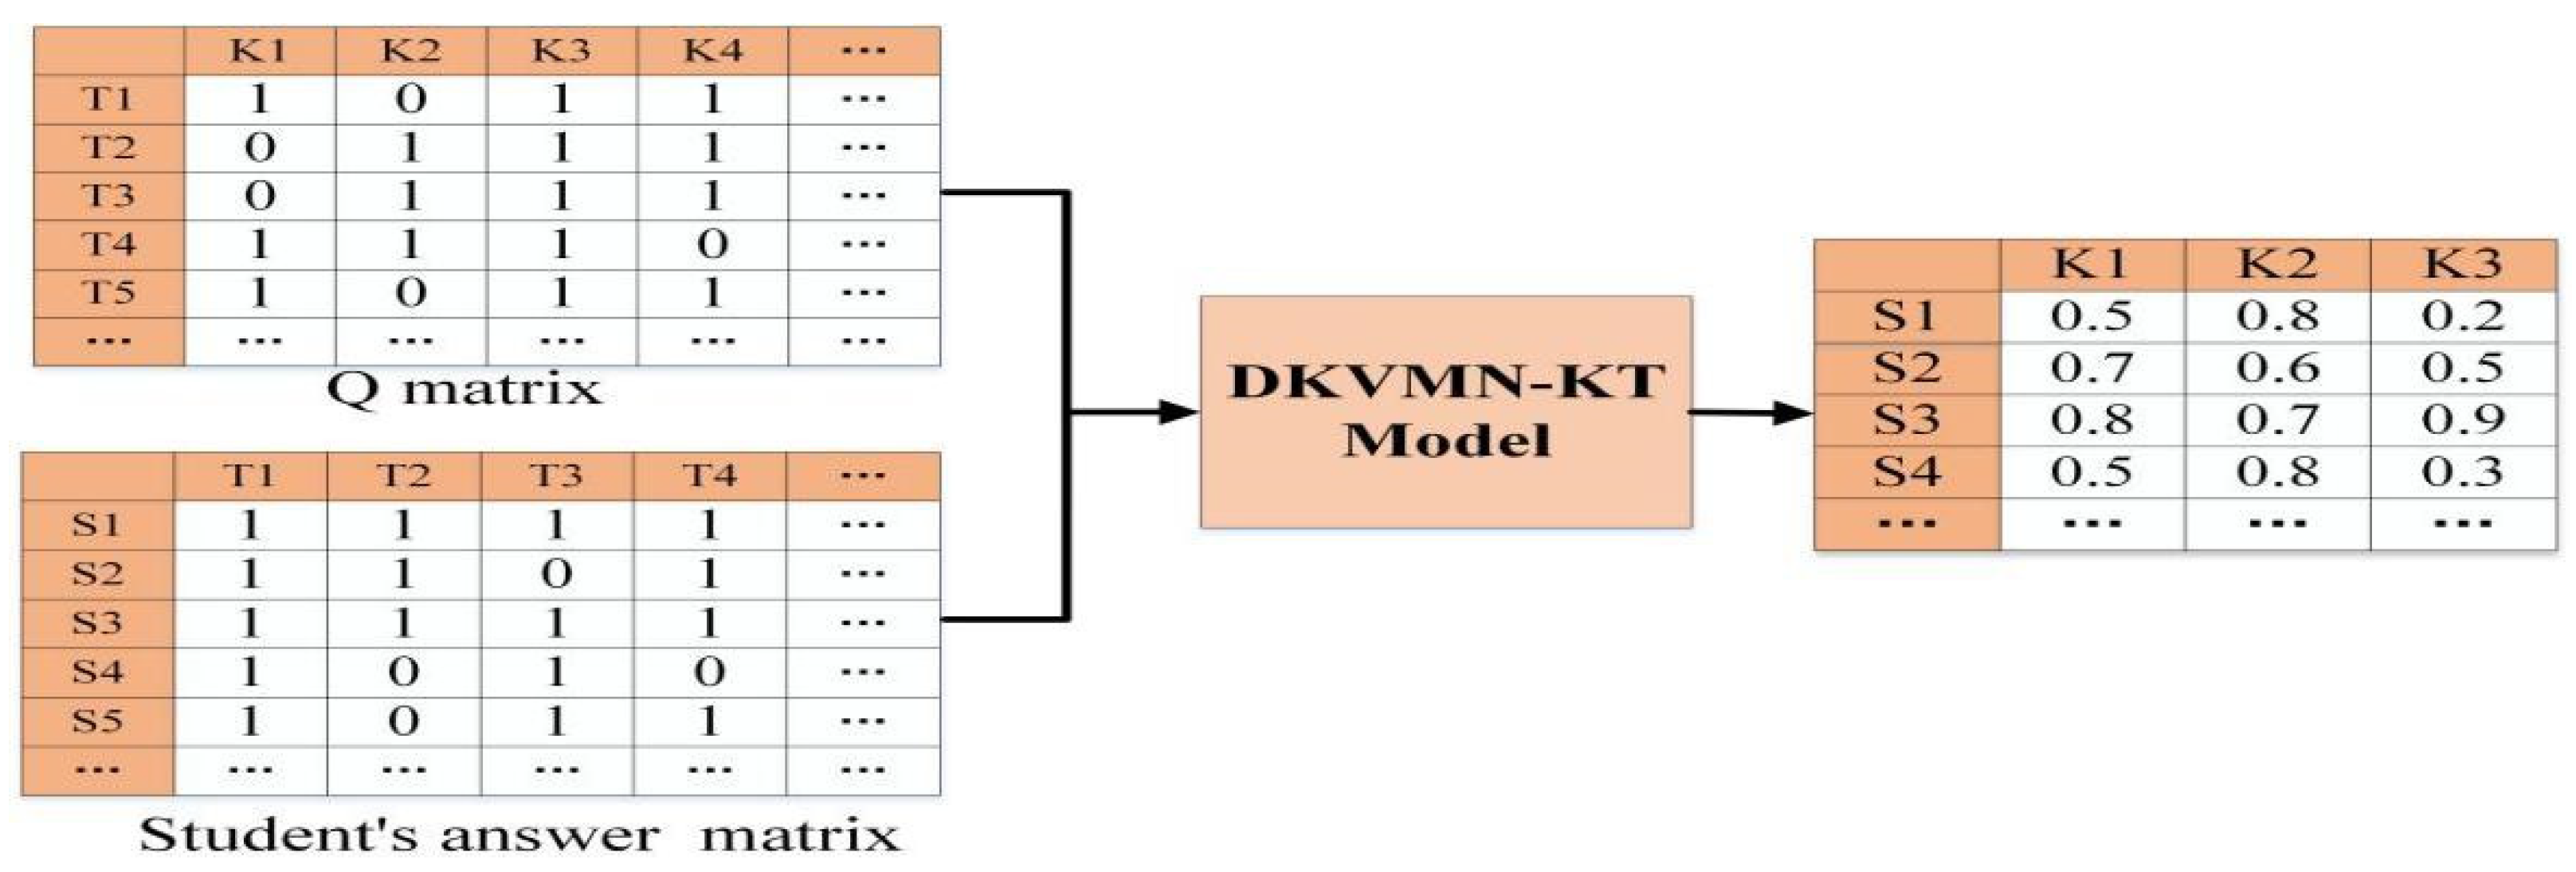
  • A dynamic key–value memory network with exercise knowledge characteristics (DKVMN-EKC) model was proposed to improve the existing dynamic key–value memory network (DKVMN) model. DKVMN-EKC effectively represents students’ actual knowledge points and precisely evaluates their mastery levels of knowledge points.
  • Considering the knowledge level of the students, the efficacy of the grouping approach was rigorously evaluated by comparing multiple groups of experiments.
The remainder of this paper is organized as follows: Section 2 focuses on the current collaborative learning grouping and the diagnostic approach of student knowledge states; Section 3 introduces a collaborative learning grouping approach incorporating deep knowledge tracing optimization strategies; Section 4 evaluates the performance of the improved deep knowledge tracking model; Section 5 evaluates the performance of the collaborative learning grouping approach; and Section 6 concludes the paper with remarks and directions for future research.

2. Related Work

This section elaborates on two aspects. The first aspect pertains to the current research landscape concerning collaborative learning grouping. The second aspect focuses on studies regarding diagnostic methods for assessing students’ knowledge states.

2.1. Collaborative Learning Grouping

Collaborative learning grouping has received widespread research attention as an important component within the collaborative learning framework. Presently, approaches to collaborative learning grouping can broadly fall into two main categories: manual selection and automated algorithm-based learning team formation. Manual grouping methods allow students to self-select or be assigned to groups by teachers, which has the drawbacks of being subjective and random. These methods cannot recommend targeted learning teams for students, as highlighted by Gibbs [9] and Davis [10]. To overcome these limitations, researchers have proposed learning grouping methods based on automatic algorithms. For instance, Ma employed Bayesian classification to categorize students into suggesters, questioners, and supporters based on various factors such as IQ, cognitive abilities, motivation, emotions, and willingness to learn. This resulted in heterogeneous groups. Lin [11] introduced an improved particle swarm optimization algorithm to help teachers plan different types of collaborative learning processes and the creation of well-structured learning groups. Ullmann [12] utilized a particle swarm optimization algorithm to form cooperation groups by integrating students’ knowledge levels and interests. Chen and Kuo [13] proposed a genetic algorithm-based group formation approach that considers students’ knowledge levels, heterogeneity of learning roles, and homogeneity of social interactions among members. Miranda [14] further optimized the genetic algorithm-based grouping process by considering intra-group homogeneity, intra-group heterogeneity, and empathy. However, both the manual and automated grouping methods have their limitations. Manual grouping heavily relies on teachers’ experience to assess students’ knowledge states. In the grouping approach based on automatic algorithms, the knowledge level characteristics are only modeled by the performance of students’ answers, limiting the surface knowledge level of students, or using simulated values of the characteristics to conduct simulation experiments when obtaining a real dataset is difficult. These two types of grouping methods cannot sufficiently model the characteristics of knowledge levels and neglect to calculate the composition of students’ knowledge, which may result in a low complementarity of knowledge structures among students in the group. To address these shortcomings, we propose enhancing the effectiveness of collaborative learning grouping methods. Thus, they are not conducive to the development of mutual learning activities among members. Therefore, we improved the effectiveness of collaborative learning grouping methods by obtaining the students’ learning knowledge mastery levels and realized knowledge structure-level grouping.

2.2. Diagnostic Approaches for Students’ Knowledge States

Knowledge state diagnosis refers to the assessment of students’ mastery of knowledge through the sequence of their answers. Depending on the modeling techniques employed, this process can be categorized into three primary groups: cognitive diagnosis, probabilistic graph-based diagnosis, and deep learning-based diagnosis.

2.2.1. Cognitive Diagnosis Based Knowledge State Diagnosis

Based on cognitive psychology and psychometrics, the cognitive diagnosis theory strives to dismantle the conventional “statistical structure” by introducing discrete two-dimensional variables as students’ mastery of measured knowledge or skills, classify students according to the different composition modes of measured attributes, and establish the corresponding relationship between students’ answers and the measured knowledge or skills. With the development of the cognitive diagnosis theory, the student state diagnosis model based on cognitive diagnosis has been widely studied. Commonly used models include the rule space methodology model (RSM) [15] and the deterministic input noisy “and” gate model (DINA) [16]. Tatsuoka proposed the RSM model based on the project response theory. The model determines the relationship between topics and knowledge points, as well as the hierarchical relationships between knowledge points. It constructs the rule space and classifies students into different ideal models according to their responses. This process facilitates the diagnosis of students’ knowledge structures. The RSM model is better suited to disciplines with clear knowledge-level relationships. The DINA model assumes that knowledge points are independent of each other and uses a Q matrix [17] to map the relationship between topics and knowledge points. It considers two influential factors: errors and guesses. Due to its simplicity and high parameter estimation accuracy, DINA has been used widely in cognitive diagnosis [18]. Tu et al. [17] developed a polytomous (P-DINA) model applicable only to multilevel rating data. Zhang et al. [19] proposed the reduced response time (RRT-DINA) model to improve diagnostic accuracy using student response time information in the assessment process of the DINA model. However, models based on cognitive diagnosis have limitations: the RSM model ignores the influence of student guessing and errors on the diagnosis result and DINA ignores dynamic changes in the students’ knowledge state during the answering process.

2.2.2. Probabilistic Graph-Based Knowledge State Diagnosis

Corbett and Anderson [20] first proposed the Bayesian knowledge tracing (BKT) model. This model classifies students’ knowledge into mastery and non-mastery employing the hidden Markov model (HMM) to model students’ learning process. Zhang and Yao [19] recognized that the knowledge state represented by binary variables could not reflect the complexity of the learning process and expanded the BKT model to include a third “learning” transition state alongside the traditional binary states. In a related development, Kaser [21] proposed a dynamic Bayesian knowledge tracing model (DBKT) using dynamic Bayesian networks to combine various knowledge points and increase their association. Meanwhile, Spaulding and Breazeal [22] enriched the hidden Markov nodes by incorporating additional observations, such as boredom, doubt, and input, providing a more holistic view of the learning experience. Probabilistic graph-based knowledge state diagnostics stand out for their structured models and explanatory power. Nevertheless, they suffer from low predictive accuracy.

2.2.3. Deep Learning-Based Knowledge State Diagnosis

The advancement of deep learning technology has enabled its introduction into diverse fields, knowledge state diagnosis being a prime example. Common models in this space include deep knowledge tracing (DKT), which leverages recurrent neural networks (RNNs) and long short-term memory (LSTM) to model learners’ knowledge states. The adoption of deep neural networks has significantly improved the predictive accuracy of such models [4]. However, the DKT model faces challenges in diagnosing students’ knowledge mastery because it has difficulty outputting students’ mastery levels for each knowledge point. Conversely, the DKVMN model uses a key matrix to store all the knowledge points across exercises and a value matrix to record students’ mastery states for each knowledge point, This enables the model to output mastery states for each individual point [23]. While the DKVMN model combines the strengths of both the BKT and DKT models, however, the DKVMN model models simulated knowledge points rather than real knowledge points and ignores the effect of the student’s current knowledge level on knowledge growth. The Self-Attentive Knowledge Tracing (SAKT) model utilizes a self-attentive mechanism to assign varying weights to input sequences. This enables the model to give different degrees of importance to a student’s historical practice while making the current predictions [24]. In response to the limitations of these approaches, numerous studies have proposed targeted improvement models. Through continuous research in the field of deep knowledge tracing, these models have undergone significant enhancements in both prediction accuracy and interpretability.

3. Collaborative Learning Grouping Approach Incorporating Deep Knowledge Tracing Optimization Strategies

Our collaborative learning grouping approach, which integrates deep knowledge tracing optimization strategies, comprises three main modules. Firstly, the data preprocessing module encompasses the standardized processing of two parts of data: the students’ answer information and the knowledge point information of the exercise. Secondly, the knowledge state diagnosis module, utilizing our innovative DKVMN-EKC model, accurately assesses students’ mastery levels of various knowledge points. Thirdly, the student grouping module, in conjunction with the K-means algorithm, clusters students based on their knowledge mastery levels as features to obtain similar student clusters and assigns students to different learning groups. This process is schematically represented in Figure 1.

3.1. Data Preprocessing

Data preprocessing involves the handling of two datasets: knowledge point information and student answer information. Both require a three-part process of collecting, converting, and cleaning the data. The process is shown in Figure 2.

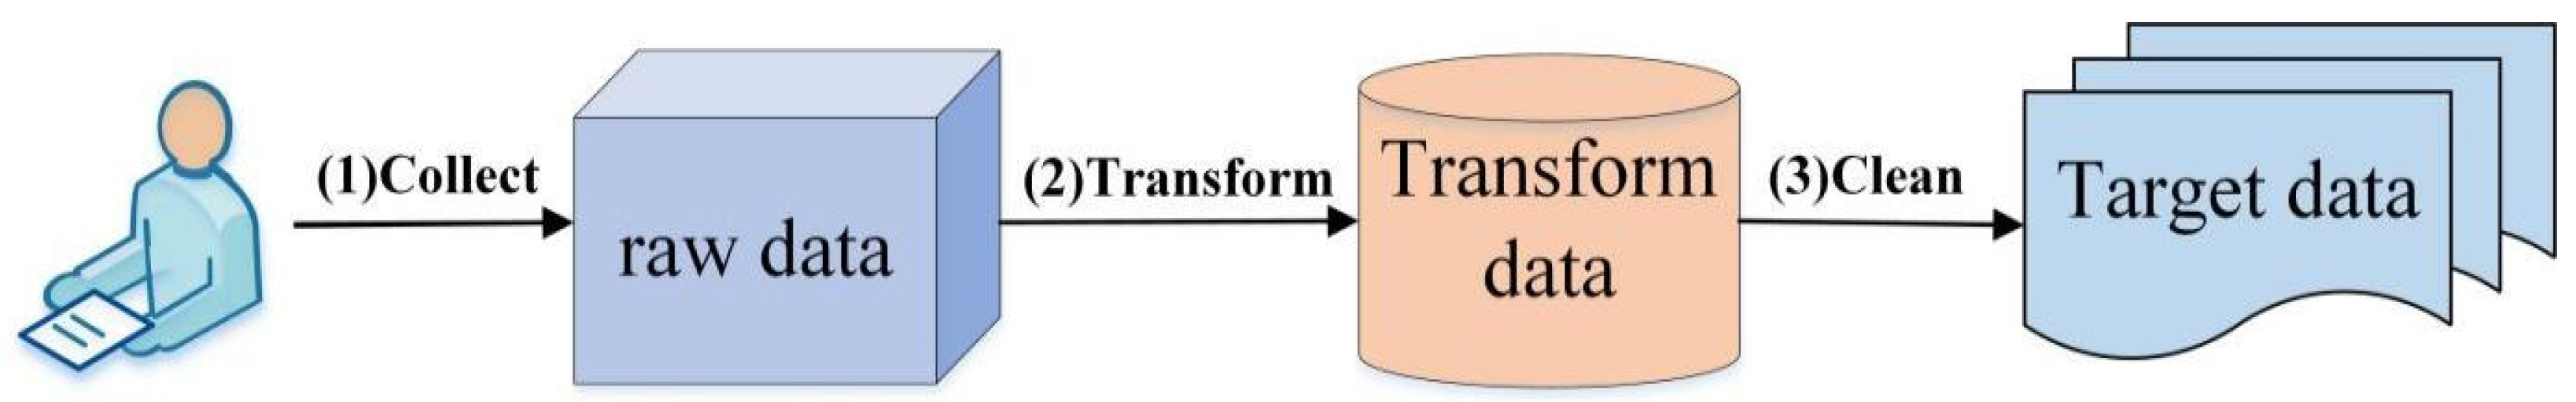
3.1.1. Data Collection

The knowledge points for the questions are sourced from experts, while the answer data are obtained from students’ test papers.

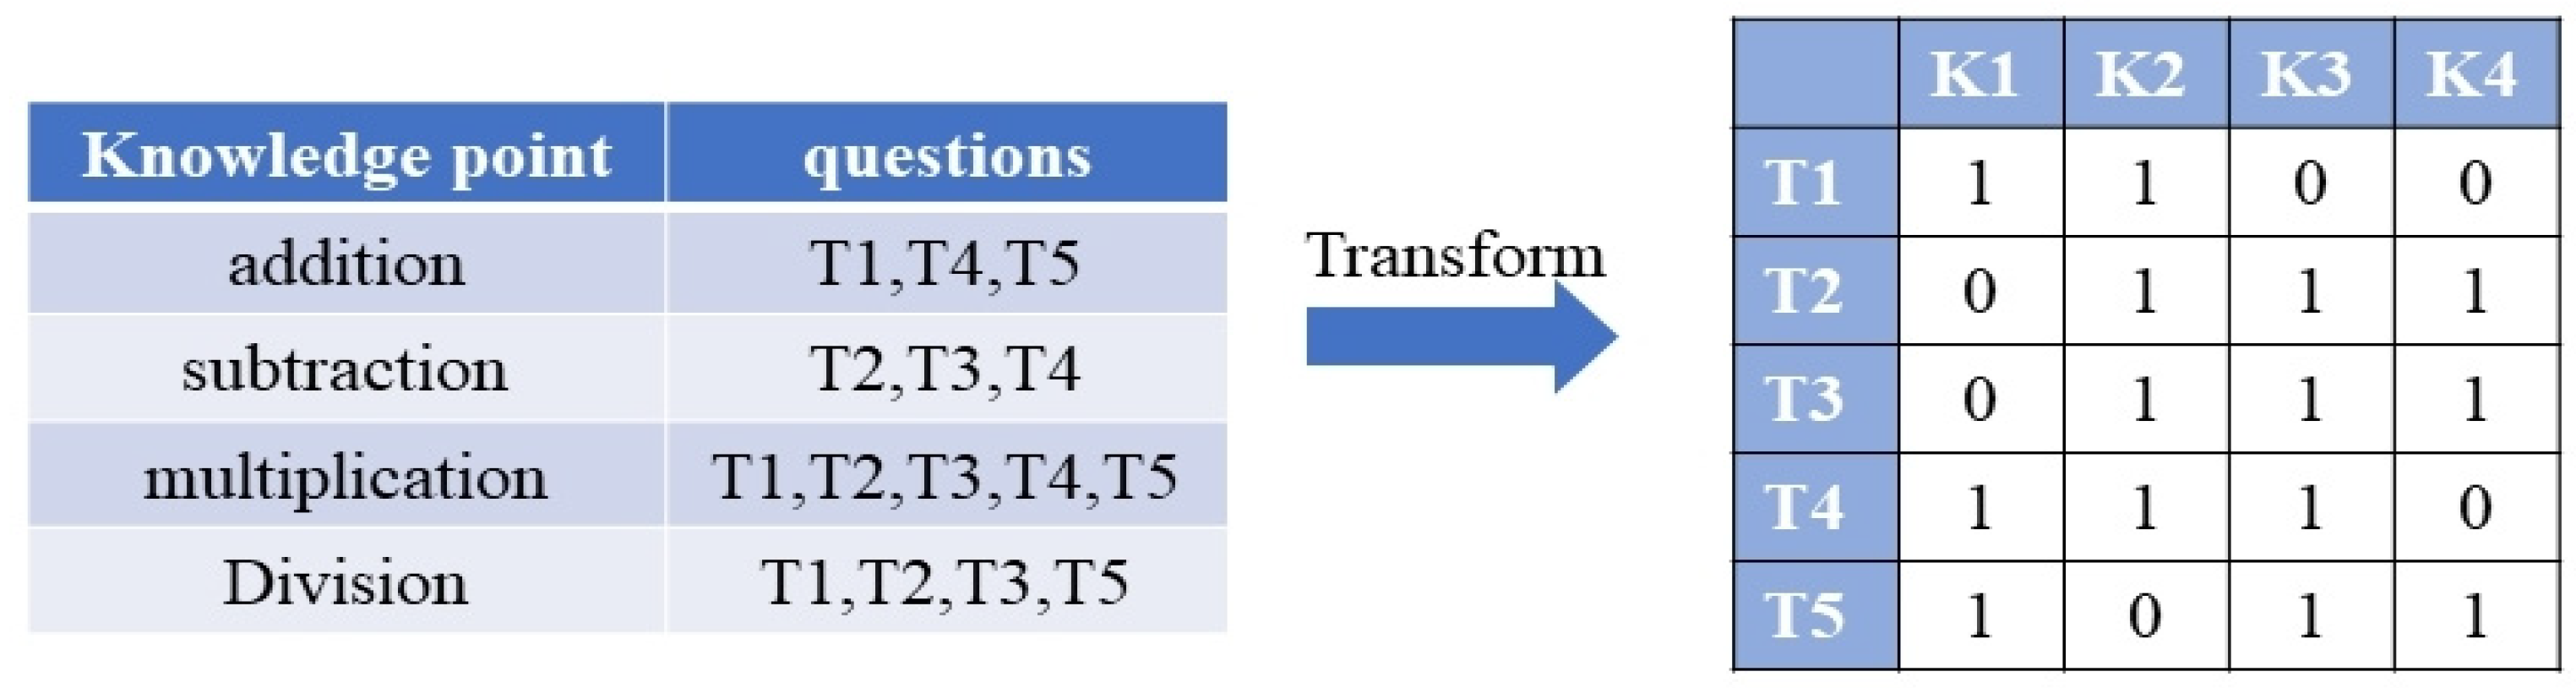
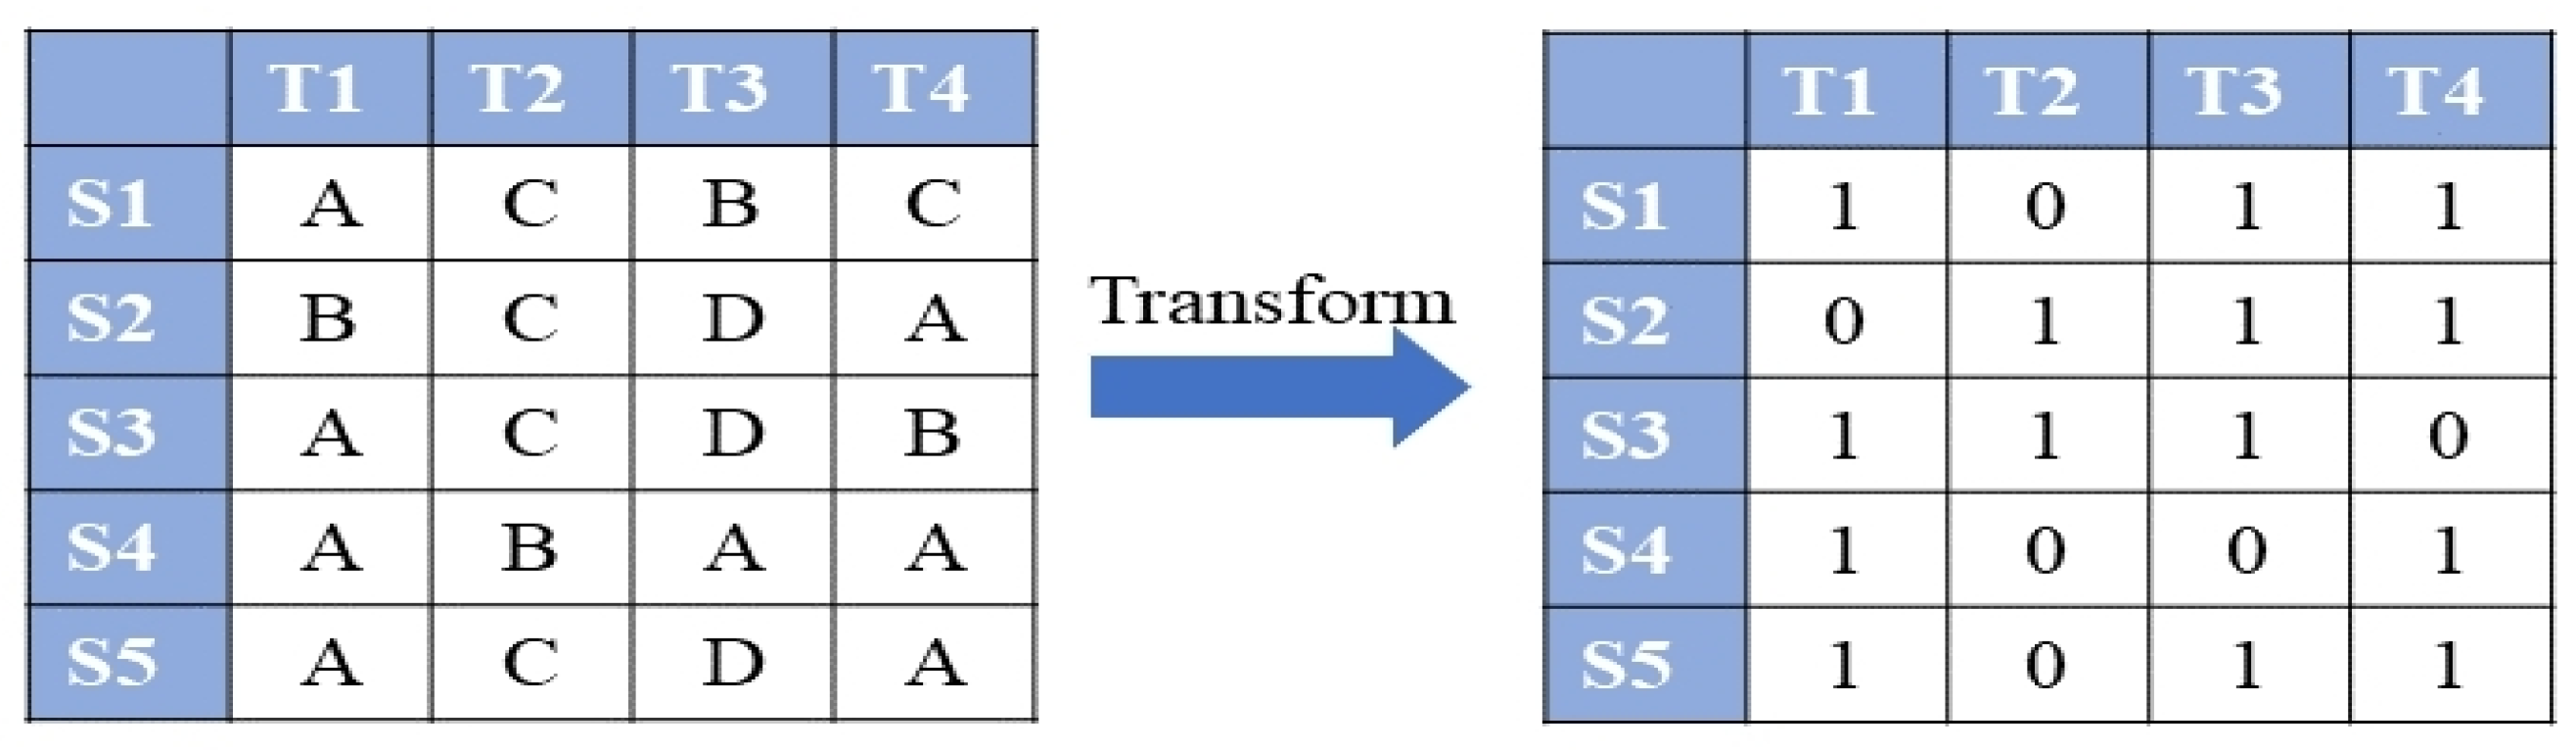
3.1.2. Data Transformation

The two types of data undergo separate processing. First, the knowledge point information for each exercise undergoes encoding based on the expert’s classification. During this procedure, a value of 1 is assigned if the exercise encompasses a specific knowledge point, whereas a value of 0 is assigned if it does not. This encoding ultimately yields a two-dimensional Q matrix that reflects the distribution of 0 and 1, providing a visual representation of the knowledge points’ presence or absence in each exercise. An example of this transformation is presented in Figure 3.
Secondly, the student’s answer data are encoded. If a student answers an exercise correctly, it is recorded as 1, whereas an incorrect answer is recorded as 0. This encoding process ultimately results in the generation of a student response matrix. Figure 4 provides an example of this data transformation, showcasing the student answer matrix.

3.1.3. Data Cleaning

Data cleaning involves the process of checking, correcting, and sorting data. The Q matrix and student answer matrix undergo a rigorous examination to identify and rectify any illegal data (values other than 1 and 0). Additionally, data from incomplete or illegible test papers are discarded to maintain data quality.

3.2. Knowledge State Diagnostic

The Q matrix and the student’s answer matrix, which are obtained after meticulous data preprocessing, serve as inputs for the subsequent analysis. The DKVMN-EKC model, at its core, is used to accurately obtain each student’s mastery level on each knowledge point; the diagnostic process is illustrated in Figure 5.
We improved the DKVMN model to create DKVMN-EKC, a deep knowledge tracing model for collaborative learning environments. The DKVMN model is based on exercises q t and responses r t 0,1 . The key matrix is used to store the potential knowledge points contained in the exercise, and the value matrix is used to store the learners’ mastery of each knowledge point. Through read-and-write operations, the model predicts the likelihood of students answering questions correctly and updates the value matrix accordingly. However, when applied in collaborative learning settings, the direct utilization of DKVMN has certain limitations. First, DKVMN models a student’s state of mastery of potential knowledge points rather than real knowledge points. Therefore, we first modified the weight calculation of the DKVMN model by incorporating the Q matrix to enable the diagnosis of real knowledge points. Furthermore, in the traditional DKVMN model, the growth in students’ knowledge after each question-answering activity is relevant to the activity at hand. However, the amount of knowledge growth varies among students with different foundations. The knowledge growth of a student in learning should be related to all the students’ current knowledge states. To address this issue, we have further optimized the write operation process of the DKVMN model by considering each student’s unique knowledge state during the knowledge increment phase. The model includes weight calculation, read operation, and write operation. The structure is shown in Figure 6.

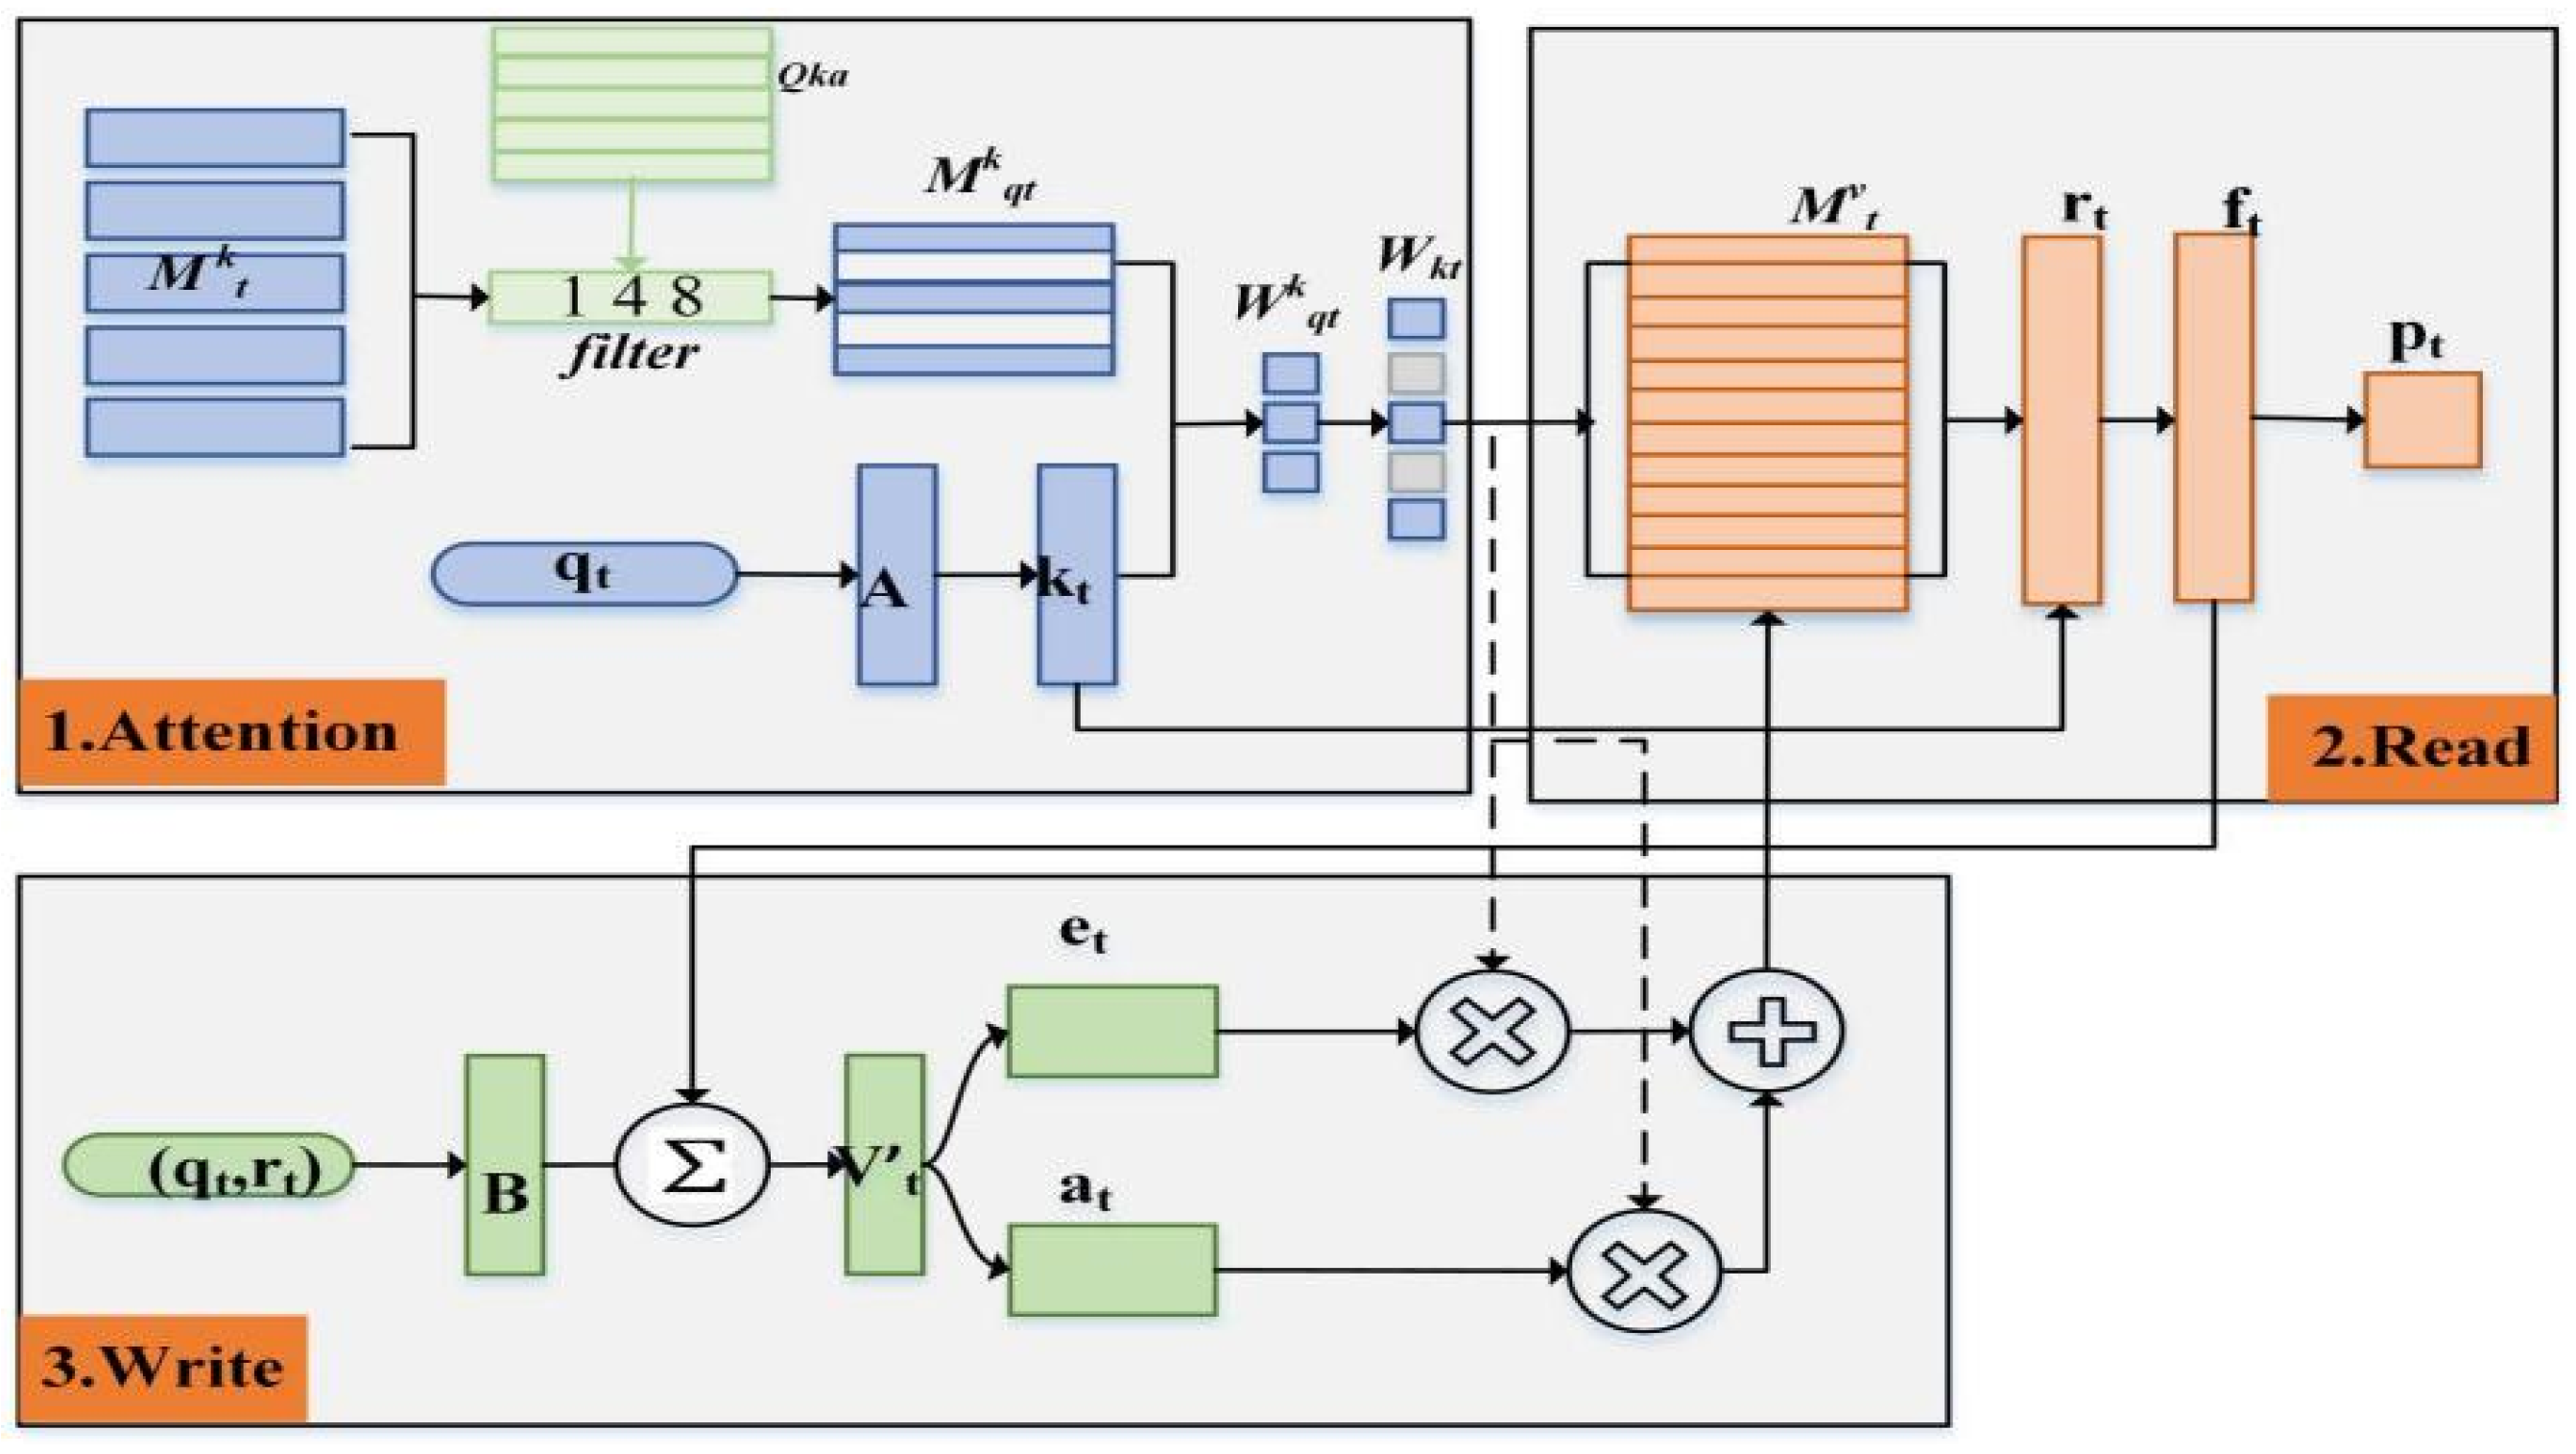
3.2.1. Attention Mechanism

The exercise q t is multiplied by the embedding matrix A R Q × d k to obtain an embedding vector k t R d k containing the exercise feature information. The Q k a R m × n matrix contains the correspondence between the exercises and knowledge points, where m is the total number of exercises and n is the total number of knowledge points examined. The filter uses the value of Q q t k a corresponding to exercise q t as the key matrix M t k to obtain the key matrix M q t k R j × d k associated with the student’s answer to the exercise at time t , where j   j n is the number of knowledge points included in the exercise q t , and obtains the relevant weights W q t k R j of each knowledge point included in the exercise q t through the S o f t m a x function:
W q t k = S o f t m a x k t T M q t k i .
The knowledge weights are W k t R n . First, the value w k t i = 0 is initialized, and then each value of W q t k is filled into the position of the knowledge points related to the exercise q t . The knowledge weights are calculated by incorporating the real knowledge information of the exercise.

3.2.2. Read Operations

The knowledge state in memory M t v i is read at time t to form the read vector r t . Subsequently, the read vector r t is vertically concatenated with the embedded vector k t to generate a feature vector f t and obtain the probability p t of students correctly answering the exercises q t . The calculation is as follows:
r t = i = 1 N W k t i M t v i ,
f t = T a n h W f r t , k t + b f ,
p t = S i g m o i d W p f t + b p ,
where W f , W p , and b f , b p represent the weight vectors and bias vectors of its neural network, respectively.

3.2.3. Write Operations

The student response tuple q t , r t is multiplied by the embedding matrix B R 2 Q × d v to obtain the knowledge growth vector v t R d v . Subsequently, the learner’s knowledge state is accounted for in the learner’s knowledge increment, and the knowledge growth vector v t R d v is obtained. The erasure vector e t and addition vector a t are calculated based on the knowledge growth vector v t , and are used to update the value matrix M t v i . The value matrix M t v i is dynamic and stores the student’s mastery of each knowledge point at time t . The calculation is as follows:
v t = v t , f t ,
e t = S i g m o i d W e v t + b e ,
a t = t a n h ( W a v t + b a ) ,
M t v i = M ^ t v i 1 W k t i e t 1 + W k t i a t ,
where W e , W a and b e , b a represent the weight and bias vectors of the neural network, respectively.
By minimizing the model predictions p t with the true value of the student’s response r t of the cross-entropy loss function to train the model, we update the key matrix M k , embedding matrices A and B , weight vector W and, bias vector b , and other model parameters. The formula is as follows:
l o s s = t ( r t log p t + ( 1 r t ) log ( 1 p t ) ) .

3.3. Student Grouping

The value matrix M t v i of the DKVMN-EKC model stores the knowledge level mastery vector x i = x i 1 , x i 2 , x i n of each student x i at time t , where n represents the number of knowledge points and the K-means algorithm is chosen to assign students with similar states to the same cluster. The K-means algorithm for student clustering iteratively finds a student partitioning scheme with K clusters, such that the loss function corresponding to the clustering result is minimized [25].
The sizes of clusters generated by the conventional K-means algorithm may vary; nevertheless, in educational settings, it is imperative that groupings are as uniform as possible to maintain consistency in the number of individuals across groups. Therefore, it is advisable to enhance the original K-means algorithm by giving precedence to assigning students to clusters that have not yet attained their maximum capacity. This approach will guarantee uniformity in the size of each cluster. Algorithm 1 outlines the process of clustering students accordingly.
Algorithm 1. K-means-based clustering algorithm for students.
Input:  Student   set   S = x 1 , x 2 , x p ,   the   number   of   study   groups   q ,   then   the   number   of   clusters   k = p / q
Output:  Cluster   division   C = C 1 , C 2 , C k
1 :   From   S   randomly   selected   from   k   samples   as   the   initialized   mean   vector   u 1 , u 2 , u k
2:   repeat
3 :   The   order   C i = 1 i k ,   the   number   of   C i The number of n in is denoted as n
4 :   for   j = 1,2 , , p  do
5 : d i j = x j u i 2   / /   Calculate   the   student   x j   with   each   mean   vector   u i 1 i k of the distance
6 : λ j = a r g m i n i 1,2 , 3 , k d i j   and   ( n q ) // The closest cluster that is under the maximum number is marked
7 : C λ j = C λ j x j   / /   assign   the   sample   x j into the appropriate cluster
8:     end for
9 : for   i = 1,2 , , k  do
10 : u i = 1 C i x C i x // Calculate the new mean vector
11 : if   u i u i  then //
12 :         u i = u i   / /   update   the   current   mean   vector   u i   is   updated   to   u i otherwise, leave the current mean vector unchanged
13:    end if
14:   end for
15: until None of the current mean vectors have been updated
Once k clusters are obtained through student clustering, students within each cluster have similar levels of knowledge mastery. Subsequently, to achieve heterogeneous grouping, students from the same cluster are distributed into distinct learning groups, ensuring that group members have different knowledge structures.

4. Evaluation of Student Knowledge State Diagnosis

4.1. Dataset

This experiment used three datasets, two of which (Math1 and Math2) were exam data from multiple high school final exams [26], and one (Item II) was a private dataset. The Item II test papers were selected from twenty-nine classes in Zhejiang Province. These three datasets each included a Q matrix for examining knowledge points in an exercise and a student performance matrix for answering questions. Table 1 provides a brief description of the three datasets.

4.2. Performance Comparison

To validate the efficacy of the proposed knowledge tracing optimization strategy centered around the DKVMN-EKC model, we conducted student score prediction experiments on three datasets separately. In each experiment, 80% of the students were randomly allocated from the dataset for training purposes, while the remaining 20% were for testing the trained models. To mitigate the impact of Q matrix sparsity, we conducted a sensitivity analysis by randomly masking 10–30% of the knowledge point associations. The results showed that DKVMN-EKC maintained stable performance (AUC > 0.72) under moderate sparsity, indicating robustness to incomplete Q matrix annotations. The following three models were selected as the baseline for comparison in this study:
  • DINA model [27]: This is a common model for modeling students’ knowledge states in the field of educational psychology. It uses a Q matrix to map the relationship between exercises and knowledge points and considers the two influencing factors of errors and guesses to obtain a binary estimate of students’ knowledge states.
  • IRT model [28]: This model is based on the relationship between a student’s ability and the percentage of correct responses. It integrates the student’s ability with the situation in the question paper (difficulty, differentiation, etc.) and assesses the student’s unidimensional ability values to diagnose potential traits.
  • DKVMN model [23]: This model represents and tracks the conceptual state of each knowledge point using a dynamic key–value pair memory network to characterize a student’s knowledge state as a high-dimensional continuous feature. It is the basis for the DKVMN-EKC model.
The student score prediction problem is a classification problem. Therefore, this experiment uses two evaluation metrics commonly used in classification: area under the curve (AUC) and accuracy (ACC), to measure the model’s performance. The experimental findings are presented in Table 2.
Analysis of the experimental results led to the following conclusions:
  • The DKVMN-EKC model surpassed the DINA model for all three datasets, with the most significant improvement in Item II, where the AUC improved by 0.16 and the ACC improved by 0.05. The DINA model represents students’ mastery of knowledge points as discrete two-dimensional variables. However, unlike the DKVMN-EKC model, it disregards the dynamic shifts in students’ knowledge and mastery states during the response process. Instead, it only considers two influencing factors: student error and guessing, which are modeled in an excessively simplified manner.
  • The DKVMN-EKC model outperformed the IRT model on all three datasets, with the most significant improvement in Item II, where the AUC improved by 0.22 and ACC improved by 0.05. The IRT model uses a continuous variable to assess students’ latent characteristics with difficulty in diagnosing students’ mastery of their individual knowledge points, in contrast to the DKVMN-EKC model.
  • Compared to the DKVMN model, the DKVMN-EKC model performed slightly worse on both the Math2 and Item II datasets but was still within acceptable limits. This is because, compared to the DKVMN model, the DKVMN-EKC model introduces a Q matrix, which inevitably leads to a degree of matrix sparsity; thus, the performance of the model is slightly degraded. However, it compensates for the inability of the DKVMN model to model real knowledge points and calculate students’ personalized knowledge growth. Taken together, the model proposed in this study not only retains the function-fitting capability of the DKVMN model but also models real knowledge points, enhancing the model’s interpretability, and being able to effectively model students’ knowledge mastery levels.
Although the AUC of DKVMN-EKC on the Math2 dataset is slightly lower than that of DKVMN (0.76 vs. 0.77), this difference is due to the sparsity of the Q matrix in Math2 (30% of the 16 knowledge points are unlabeled) and the limitation of data size (only 3911 records). Further sensitivity experiments indicate that when the integrity of the Q matrix is ≥80%, the AUC of DKVMN-EKC remains stable above 0.75. Therefore, this model is more suitable for scenarios that require complete annotation and fine-grained knowledge diagnosis, while in sparse annotation or small data scenarios, it is recommended to combine a hybrid modeling strategy to balance performance.

5. Evaluation of Student Groups

5.1. Experiment Subjects

The experiment involved 30 students (28 males and 2 females; aged between 16 and 18) from a vocational Internet of Things (IoT) class in Zhejiang Province, China. The participants were selected based on their registration status in the course “Installation and Testing of Electrical Basic Circuits” to ensure the homogeneity of academic background and prior knowledge. Students with incomplete attendance records or previous exposure to similar experiments were excluded to minimize confounding factors.
Prior to the start of the experiment, we obtained written informed consent from all the participants and their guardians. The consent form detailed the purpose of the study, data collection procedures, and the rights of participants, including the option to withdraw at any time without penalty. To protect privacy, the students used unique identifiers for anonymization (S1–S30), and all data were securely stored in accordance with the GDPR guidelines. Although the experimental sample comes from a single vocational education background, the design of the DKVMN-EKC model has the following scalability features: the data-driven model has good generalization ability, and the model can capture cognitive mode differences among different student groups by dynamically updating the knowledge state matrix. For example, in university or high school scenarios, it is only necessary to retrain the model and update the Q matrix to adapt to new knowledge points.

5.2. Experiment Materials and Procedures

For this experiment, we used the teaching content of the “Installation and Testing of Resistor Circuits” module in the textbook “Installation and Testing of Electrical Basic Circuits” published by the Higher Education Press. Under the expert guidance of educators specializing in this field, the pertinent content was segmented into 11 distinct knowledge points and a test paper consisting of 30 objective questions was prepared. Detailed information pertaining to each knowledge point assessed in the test is presented in Table 3. Once the students had been taught the content, the test was conducted and the test papers were collected.

5.3. Experiment Evaluation Indicators

Inspired by the definition of the grouping effect in [29], we used the average degree and total average deviation, as a percentage, between each feature in the team as a measure of fairness between the groups. We first calculated the mean value of each knowledge-point mastery among all the students:
c ¯ = c 1 ¯ , c 2 ¯ , c 3 ¯ , , c n ¯ ,
where c n ¯ denotes the mean mastery of the knowledge point n among all the students.
The mean value of knowledge-point mastery within each subgroup was then calculated as follows:
c ¯ G g = c 1 ¯ G g , c 2 ¯ G g , c 3 ¯ G g , , c n ¯ G g ,
where c n ¯ G g denotes the mean mastery for the students in group g.
Finally, the total mean deviation from the total group mean was calculated as follows:
E r r o r T o t a l   G r o u p s | i = 1 R Q g = 1 Q n = 1 N c n ¯ G g c n 2 100
We measured the effectiveness of grouping based on two aspects: fairness and heterogeneity. Fairness refers to the fact that the average knowledge mastery within a group should be as close as possible to the total average knowledge mastery of all the students, and the total average deviation should be as small as possible. Heterogeneity means that the group should be as heterogeneous as possible. We compared this by measuring the differences in the mastery of each knowledge point among the group.

5.4. Collaborative Learning Groupings Effectiveness Comparison

Based on the performance matrix of the answers and the Q matrix composed of the questions and knowledge points of the IoT students, we obtained the mastery level of each student for each knowledge point using the DKVMN-EKC model. Table 4 lists the knowledge structure compositions of all the students.
Three different characteristics were used for grouping in this experiment. The first was based on the students’ raw scores on the test questions: scores of 80% and above were A, scores of 70–80% were B, scores of 60–70% were C, and scores of less than 60% were D. The second was the students’ knowledge mastery state obtained from the DINA model, which had only two forms: 0 and 1. The third was the deep knowledge tracing proposed in the optimization model, obtained from the student’s knowledge mastery state. The class was divided into six learning groups using these three characteristics. The results of the groupings are presented in Table 5, Table 6 and Table 7, where the data details the mean (expression (12)) and the overall mean deviation (expression (14)) for each knowledge point in the group.

5.4.1. Fairness of the Grouping Approach

We used the mean value of each knowledge-point mastery within each subgroup and the overall mean deviation of each level of knowledge mastery as measures of subgroup equity.
  • The mean knowledge acquisition values of students in the quality groups should be consistent with the mean knowledge acquisition of the average student as far as possible. Table 5, Table 6 and Table 7 record the mean knowledge acquisition values of the learning groups formed based on the three different characteristics for each knowledge point. Figure 7 illustrates the mean knowledge acquisition values of Group 1 and the IOT students for the three grouping approaches, with the closest line to the mean being the group formed by our model.
2.
The total average deviation for each knowledge level should be minimized. From the experimental results, for the four knowledge points of the basic elements of circuits (K1), basic knowledge of resistors (K3), electrical power (K9), and Ohm’s law (K11), the total average deviation of the learning group formed based on the DKVMN-EKC model is lower than that of the other two approaches. The total mean deviation of the DKVMN-EKC model-based learning groups was between that of the other two approaches for three knowledge points: resistor classification and symbol (K4), resistor type and parameters (K5), and current (K6). The other two grouping approaches had two or three knowledge points with relatively small total mean deviations.
The data demonstrate that the proposed grouping approach has a higher level of fairness than the other two approaches.

5.4.2. Heterogeneity of the Grouping Approach

Heterogeneity refers to the need for groups to be as heterogeneous as possible and must be measured by the variability of student knowledge acquisition data within each group. An analysis of the data in Table 4, Table 5 and Table 6 shows that the groupings based on raw scores and the DINA model will place many homogeneous students in the same group. For instance, in group 3 of the groupings based on raw scores, S18 and S24 are both students with relatively good mastery of circuit operating conditions (K2), resistor type and parameters (K5), and average mastery of other knowledge. Similarly, in group 5, formed based on the DINA model, S7 and S10 were both students with relatively good knowledge of resistor basics (K3), resistor type and parameters (K5), electrical power (K9), and Ohm’s law (K11), and their knowledge structures showed a high degree of homogeneity.
To quantify the heterogeneity of group compositions, we calculated the Gini Index (GI) for each knowledge point within groups. The Gini Index, ranging from 0 (perfect homogeneity) to 1 (maximal heterogeneity), provides a standardized measure of diversity. The groups formed by DKVMN-EKC achieved significantly higher GI values (mean GI = 0.42) compared to the raw-score-based (GI = 0.28) and DINA-based (GI = 0.31) groups, confirming enhanced intra-group diversity. For example, in Group 1 formed by DKVMN-EKC, the GI for knowledge points K2 (circuit operating state) and K5 (resistor type and parameters) were 0.48 and 0.45, respectively, indicating substantial variability in student mastery levels. In contrast, the corresponding GI values for raw-score-based groups were 0.32 and 0.29, reflecting lower diversity.
While our method achieved higher intra-group diversity than the baseline approaches, it is important to contextualize these results. Prior studies on collaborative learning grouping (e.g., Chen & Kuo, 2019; Miranda et al., 2020) [13,14] typically involved 100–500 participants across multiple institutions. Our smaller sample (N = 30) may amplify random variations in group composition, as seen in the wider confidence intervals for heterogeneity metrics. Future work should prioritize scaling to cohorts of similar size to the established literature.
To better illustrate the variability in the degree of knowledge mastery of the group members, Figure 8 shows Group 1, formed based on our model, as an example. The horizontal coordinates indicate the knowledge points, the vertical coordinates indicate the students, and the height indicates the knowledge mastery. In this study group, S10 can tutor group members on knowledge points related to the working state of a circuit (K2), resistor type and parameters (K5), electrical power (K9), and Ohm’s law (K11); S21 can help group member S16 to tutor knowledge points related to the basic knowledge of resistance (K3), electrical power (K9), and electrical energy (K10); and S16 can teach S21 about basic elements of circuit composition (K1), circuit operating state (K2), and other relevant knowledge points. There is a clear difference in the degree of mastery of each knowledge point among the group members, reflecting the heterogeneity of the group. Students in the same group have different advantageous knowledge points, which can improve positive interactions among students by learning others’ knowledge to effectively improve students’ knowledge points.
The analysis of fairness and heterogeneity revealed that the collaborative learning grouping strategy based on the DKVMN-EKC model effectively established learning teams characterized by enhanced inter-group fairness and intra-group heterogeneity in terms of knowledge structure, and that the approach had good learning group formation performance, which was analyzed with the following in mind:
  • The conventional grouping approach, which relies solely on raw scores as a measure of students’ knowledge level and is widely employed in related research [13,14], has significant limitations. It merely utilizes superficial data from students’ answers, failing to delve into their cognitive processes or effectively harness the wealth of information contained within their responses.
  • While the DINA model-based learning groups establish a relationship between students’ answers and their internal cognitive characteristics, they have significant limitations. These groups rely solely on discrete two-dimensional variables to represent students’ knowledge mastery levels, which are reduced to the binary states of mastery and non-mastery. Clearly, this approach fails to accurately capture the complexities and nuances of real-world scenarios, thereby limiting its effectiveness in representing students’ true knowledge mastery.
  • Learning groups formed based on the DKVMN-EKC model: First, in terms of model optimization, DKVMN-EKC is an improvement on the DKVMN model, which uses memory-enhanced network modeling, with the key matrix storing information about knowledge points, and the value matrix storing information about the student’s mastery of each knowledge point. Compared with the DKT model, to represent all the students’ knowledge mastery states, the DKVMN model uses two matrices to store information that is more explanatory than the DKT model; further, the current DKVMN model stores the potential knowledge points modeled by the neural network rather than the real knowledge points of exercises, and therefore introduces a Q matrix that incorporates the real knowledge points of the students. Moreover, the calculation of knowledge growth for the DKVMN model only considers the current responses of the students multiplied by an already trained embedding matrix and ignores the influence of the students’ cognitive processes. Although it has the same response, the students’ knowledge levels are different and the obtained knowledge growth should be different; hence, the model introduces the students’ previous knowledge states to the knowledge growth calculation to derive different knowledge increments for each student. Second, in terms of the cognitive diagnostic process, the DKVMN-EKC model uses the student’s response sequence and the Q matrix as inputs, and the Q matrix is used as a filter for the key matrix, enabling the model to incorporate information about the real knowledge points. The DKVMN-EKC model uses the student’s response sequence to simulate the student’s dynamic learning process, and the value matrix stores the student’s continuous knowledge mastery state for each knowledge point. Third, in terms of the formation results, the students’ mastery states formed using the DKVMN-EKC model are less granular. The model not only yields whether the students have mastery of the knowledge points but also accurately measures the degree of the students’ knowledge mastery using continuous values to represent the students’ knowledge mastery state. The model then uses the K-means algorithm to divide all the student objects into clusters, where the knowledge mastery level of the students in each cluster is similar, but not similar to the students in other clusters. The positive interactions between students lead to improved learning outcomes.

6. Conclusions and Future Work

To address the problem that the current collaborative learning grouping approaches lack deep calculations of students’ knowledge level characteristics, we propose a collaborative learning grouping approach that incorporates deep knowledge tracing optimization strategies. Particularly, we introduce a Q matrix to the DKVMN model and consider students’ current knowledge state in the knowledge increments. We design the DKVMN-EKC model, and use the proposed deep knowledge tracing model to explore the deep connotations behind students’ test scores and obtain students’ knowledge mastery level to perform similarity clustering of students. Subsequently, we assign students within a cluster to different learning groups and conduct an empirical study to demonstrate the effectiveness of the proposed grouping approach. The incorporation of the knowledge tracing model focuses collaborative learning grouping on students’ cognitive states and realizes learning group division on this basis; conversely, it addresses the existing problem of simplifying the modeling of the knowledge level characteristics of collaborative learning grouping, and on the other hand, grouping from the perspective of the knowledge composition structure can effectively enhance positive interactions among students [30].
Although the grouping approach proposed in this study has achieved some success, there are still areas for improvement. While the proposed grouping approach demonstrated effectiveness in this study, the small sample size (n = 30) and the homogeneous nature of the vocational student population limit the generalizability of the results. The study’s findings are specific to a particular educational context and may not be directly applicable to other settings. To address this limitation, future research should involve larger, more diverse student populations across different educational stages (e.g., secondary schools and universities) and disciplines (e.g., humanities and sciences). Additionally, the current study’s sample size was determined by the availability of participants in the specific vocational program, which constrained the statistical power of the analysis. Future studies should aim for larger sample sizes to enhance the reliability of the results. For instance, a sample size of at least 100 students would allow for more robust statistical testing and better representation of diverse learning profiles.
Furthermore, the study’s sample was limited to a specific region, which may not reflect the broader demographic and educational diversity found in other regions. Future research should include participants from multiple geographic locations and cultural backgrounds to assess the cross-cultural validity of the proposed method.
To ensure the robustness of the findings, future studies should also employ a mixed-methods approach, combining quantitative data with qualitative insights from student interviews and teacher observations. This would provide a more comprehensive understanding of the impact of the grouping approach on collaborative learning outcomes. In summary, while the current study provides a promising foundation, its conclusions should be interpreted with caution due to the small and homogeneous sample. Future research with larger, more diverse samples and cross-cultural validation is needed to fully establish the generalizability of the proposed method.

Author Contributions

Conceptualization, H.L. and Y.C.; methodology, H.L. and Y.C.; software, W.L.; validation, X.W., W.L. and Y.C.; formal analysis, H.L.; investigation, Y.C.; resources, H.L.; data curation, W.L.; writing—original draft preparation, Y.C.; writing—review and editing, W.L.; visualization, X.W.; supervision, H.L.; project administration, H.L.; funding acquisition, H.L. All authors have read and agreed to the published version of the manuscript.

Funding

This work was supported by the National Natural Science Foundation of China under Grant 62077043.Zhejiang Provincial Philosophy and Social Sciences Planning Interdisciplinary Key Supported Project: 22JCXK05Z.

Institutional Review Board Statement

The study was conducted in accordance with the Declaration of Helsinki, and approved by the Ethics Committee of the Education College at Zhejiang University of Technology (project identification code: 2021D018 and date of approval: 12 September 2021).

Informed Consent Statement

Informed consent was obtained from all subjects involved in the study.

Data Availability Statement

The original contributions presented in this study are included in the article. Further inquiries can be directed to the corresponding author.

Conflicts of Interest

The authors declare no conflicts of interest.

References

  1. Smith, K.A. Cooperative learning: Effective teamwork for engineering classrooms. In Proceedings of the Proceedings Frontiers in Education 1995 25th Annual Conference. Engineering Education for the 21st Century, Atlanta, GA, USA, 6 August 2002; IEEE: New York, NY, USA; Volume 1. [Google Scholar]
  2. Hu, X.Y.; Li, Y.L.; Xu, X.H. Practical Strategies for Optimizing Group Learning Effects: A Case Study of Educational Communication Course; South China Normal University (Social Science Edition): Guangzhou, China, 2009; Volume 1, p. 107. [Google Scholar]
  3. Li, Z.J.; Qiu, D.F. Student’s self-regulated learning: The conditions and strategies of teaching. Glob. Educ. 2017, 1, 47–57. [Google Scholar]
  4. Piech, C.; Bassen, J.; Huang, J.; Ganguli, S.; Sahami, M.; Guibas, L.J.; Sohl-Dickstein, J. Deep knowledge tracing. Adv. Neural Inf. Process. Syst. 2015, 28. Available online: https://proceedings.neurips.cc/paper/2015/hash/bac9162b47c56fc8a4d2a519803d51b3-Abstract.html (accessed on 3 February 2025).
  5. Lindow, J.A.; Wilkinson, L.C.; Peterson, P.L. Antecedents and consequences of verbal disagreements during small-group learning. J. Educ. Psychol. 1985, 77, 658–667. [Google Scholar] [CrossRef]
  6. Barth-Cohen, L.A.; Wittmann, M.C. Aligning coordination class theory with a new context: Applying a theory of individual learning to group learning. Sci. Educ. 2017, 101, 333–363. [Google Scholar] [CrossRef]
  7. Molina, A.I.; Arroyo, Y.; Lacave, C.; Redondo, M.A. Learn-CIAN: A visual language for the modelling of group learning processes. Br. J. Educ. Technol. 2018, 49, 1096–1112. [Google Scholar] [CrossRef]
  8. Liu, Y.; Liu, Q.; Wu, R.; Chen, E.; Hu, G. Collaborative Learning Team Formation: ACognitive Modeling Perspective. In Proceedings of the International Conference on Database Systems for Advanced Applications, Xi’an, China, 16–19 April 2016. [Google Scholar]
  9. Gibbs. Learning in Teams: A Tutor Guide; Oxford Centre for Staff and Learning Development: Oxford, UK, 1995. [Google Scholar]
  10. Ounnas, A.; Davis, H.; Millard, D. A framework for semantic group formation. In Proceedings of the 2008 Eighth IEEE International Conference on Advanced Learning Technologies, Santander, Spain, 1–5 July 2008; IEEE: New York, NY, USA; pp. 34–38. [Google Scholar]
  11. Lin, Y.T.; Huang, Y.M.; Cheng, S.C. An automatic group composition system for composing collaborative learning groups using enhanced particle swarm optimization. Comput. Educ. 2010, 55, 1483–1493. [Google Scholar] [CrossRef]
  12. Ullmann, M.R.; Ferreira, D.J.; Camilo, C.G.; Caetano, S.S.; de Assis, L. Formation of learning groups in cmoocs using particle swarm optimization. In Proceedings of the 2015 IEEE Congress on Evolutionary Computation (CEC), Sendai, Japan, 25–28 May 2015; IEEE: New York, NY, USA; pp. 3296–3304. [Google Scholar]
  13. Chen, C.M.; Kuo, C.H. An optimized group formation scheme to promote collaborative problem-based learning. Comput. Educ. 2019, 133, 94–115. [Google Scholar] [CrossRef]
  14. Miranda, P.B.; Mello, R.F.; Nascimento, A.C. A multi-objective optimization approach for the group formation problem. Expert Syst. Appl. 2020, 162, 113828. [Google Scholar] [CrossRef]
  15. Tatsuoka, K.K. Architecture of knowledge structures and cognitive diagnosis: A statistical pattern recognition and classification approach. In Cognitively Diagnostic Assessment; Routledge: Oxfordshire, UK, 2012; pp. 327–359. [Google Scholar]
  16. Junker, B.W.; Sijtsma, K. Cognitive assessment models with few assumptions, and connections with nonparametric item response theory. Appl. Psychol. Meas. 2001, 25, 258–272. [Google Scholar] [CrossRef]
  17. Tu, D.B.; Cai, Y.; Dai, H.Q.; Ding, S.L. A polytomous cognitive diagnosis model: P-DINA model. Acta Psychol. Sin. 2010, 42, 1011–1020. [Google Scholar] [CrossRef]
  18. Tianpeng, Z.; Wenjie, Z.; Lei, G. Cognitive diagnosis modelling based on response times. J. Psychol. Sci. 2023, 46, 478. [Google Scholar]
  19. Zhang, K.; Yao, Y. A three learning states Bayesian knowledge tracing model. Knowl.-Based Syst. 2018, 148, 189–201. [Google Scholar] [CrossRef]
  20. Corbett, A.T.; Anderson, J.R. Knowledge tracing: Modeling the acquisition of procedural knowledge. User Model. User-Adapt. Interact. 1994, 4, 253–278. [Google Scholar] [CrossRef]
  21. Käser, T.; Klingler, S.; Schwing, A.G.; Gross, M. Dynamic Bayesian networks for student modeling. IEEE Trans. Learn. Technol. 2017, 10, 450–462. [Google Scholar] [CrossRef]
  22. Spaulding, S.; Breazeal, C. Affect and inference in Bayesian knowledge tracing with a robot tutor. In Proceedings of the Tenth Annual ACM/IEEE International Conference on Human-Robot Interaction Extended Abstracts, Chicago, IL, USA, 2–3 March 2015; pp. 219–220. [Google Scholar]
  23. Zhang, J.; Shi, X.; King, I.; Yeung, D.Y. Dynamic key-value memory networks for knowledge tracing. In Proceedings of the 26th International Conference on World Wide Web, Perth, Australia, 3–7 April 2017; pp. 765–774. [Google Scholar]
  24. Pandey, S.; Karypis, G. A self-attentive model for knowledge tracing. arXiv 2019, arXiv:1907.06837. [Google Scholar]
  25. Capó, M.; Pérez, A.; Lozano, J.A. An efficient split-merge re-start for the K-means algorithm. IEEE Trans. Knowl. Data Eng. 2020, 34, 1618–1627. [Google Scholar] [CrossRef]
  26. Wu, R.; Liu, Q.; Liu, Y.; Chen, E.; Su, Y.; Chen, Z.; Hu, G. Cognitive modelling for predicting examinee performance. In Proceedings of the Twenty-Fourth International Joint Conference on Artificial Intelligence, Buenos Aires, Argentina, 25–31 June 2015; Available online: http://staff.ustc.edu.cn/~qiliuql/files/Publications/Runze-IJCAI2015.pdf (accessed on 3 February 2025).
  27. Tatsuoka, K.K. Rule space: An approach for dealing with misconceptions based on item response theory. J. Educ. Meas. 1983, 20, 345–354. [Google Scholar] [CrossRef]
  28. Hambleton, R.K.; Swaminathan, H. Item Response Theory: Principles and Applications; Springer Science & Business Media: Berlin/Heidelberg, Germany, 2013. [Google Scholar]
  29. Garshasbi, S.; Mohammadi, Y.; Graf, S.; Garshasbi, S.; Shen, J. Optimal learning group formation: A multi-objective heuristic search strategy for enhancing inter-group homogeneity and intra-group heterogeneity. Expert Syst. Appl. 2019, 118, 506–521. [Google Scholar] [CrossRef]
  30. Rogers, J.; Nehme, M. Motivated to collaborate: A self-determination framework to improve group-based learning. Leg. Educ. Rev. 2019, 29, 1. [Google Scholar] [CrossRef]
Figure 1. Collaborative learning grouping approach incorporating deep knowledge tracing optimization strategies.
Applsci 15 02692 g001
Figure 2. Data preprocessing process.
Applsci 15 02692 g002
Figure 3. Q matrix data transformation.
Applsci 15 02692 g003
Figure 4. Student answer matrix data transformation.
Applsci 15 02692 g004
Figure 5. Diagnostic process for determining knowledge state.
Applsci 15 02692 g005
Figure 6. Structure of the DKVMN-EKC model.
Applsci 15 02692 g006
Figure 7. Group 1 mean knowledge acquisition.
Applsci 15 02692 g007
Figure 8. Visualization of the state of knowledge acquisition of students in group 1.
Applsci 15 02692 g008
Table 1. Experimental dataset.
DatasetRecordsStudentsQuestionsKnowledge Points
Math163,13542091511
Math262,57639111616
Item II33,60011203011
Table 2. Comparison of AUC and ACC indicators by model.
ModelMath1Math2Item II
AUCACCAUCACCAUCACC
DINA0.660.630.680.640.590.69
IRT0.690.640.710.650.530.70
DKVMN0.740.680.770.690.770.75
DKVMN-EKC0.740.680.760.690.750.74
Table 3. Division of knowledge in test papers.
Knowledge PointQuestions
Basic elements of circuit composition (K1)T1, T11, and T26
Circuit operating state (K2)T2, T12, T24, T25, and T30
Basic knowledge of resistance (K3)T3, T9, and T13
Resistor classification and symbols (K4)T14 and T27
Resistor type and parameters (K5)T4, T5, T15, T16, T17, and T18
Current (K6)T6 and T19
Voltage (K7)T28
Electric potential (K8)T20 and T30
Electrical power (K9)T9, T10, T21, and T29
Electrical energy (K10)T10 and T22
Ohm’s law (K11)T7, T8, T20, T23, T24, T25, and T30
Table 4. Student knowledge structure.
Student
ID
K1K2K3K4K5K6K7K8K9K10K11
S10.710.790.500.530.630.560.590.670.650.740.71
S20.770.570.500.580.620.550.580.690.250.360.33
S30.770.610.810.580.930.550.590.690.960.740.65
S40.770.710.520.530.620.550.590.690.650.740.90
S50.710.710.520.530.620.560.590.310.650.740.70
S60.770.910.520.490.710.590.580.670.650.740.65
S70.770.710.810.580.930.550.590.690.960.740.90
S80.770.610.500.580.710.590.590.690.650.740.44
S90.770.610.810.580.930.550.590.690.960.740.65
S100.770.920.810.580.930.550.590.690.960.740.90
S110.770.920.810.580.930.590.590.310.960.740.70
S120.770.540.520.580.650.550.590.280.650.740.60
S130.280.570.520.580.930.550.590.690.650.740.72
S140.280.610.500.580.710.590.590.310.650.740.63
S150.770.760.500.580.630.560.580.670.650.740.30
S160.770.760.520.580.660.590.590.670.260.360.63
S170.770.760.500.580.930.590.590.690.650.740.69
S180.770.910.500.580.930.550.590.670.650.740.62
S190.770.800.810.580.710.550.590.690.960.740.39
S200.770.710.270.530.930.590.590.690.650.740.90
S210.290.540.810.580.700.590.580.670.960.740.68
S220.770.760.500.580.420.600.590.690.650.740.36
S230.770.910.500.580.930.560.590.670.650.740.65
S240.770.910.500.580.930.550.580.280.650.740.70
S250.290.760.810.580.930.590.590.670.960.740.63
S260.770.910.810.530.620.590.590.670.960.740.88
S270.290.710.500.580.620.550.590.280.650.740.70
S280.770.920.520.580.740.550.590.690.650.740.90
S290.770.920.810.580.930.550.590.690.960.740.90
S300.290.790.500.580.630.550.580.670.650.740.71
Avg.0.670.750.600.570.770.570.590.600.730.710.67
Table 5. Learning groups formed based on raw scores.
Group IDK1K2K3K4K5K6K7K8K9K10K11
10.770.690.520.570.830.580.590.690.630.660.66
20.670.810.570.580.770.560.590.530.630.660.66
30.760.800.570.570.770.560.590.530.710.740.66
40.670.760.690.580.770.560.590.600.840.740.56
50.580.770.690.570.760.570.590.610.840.740.75
60.560.700.570.540.720.570.590.680.710.740.73
Error a7.994.606.491.353.210.810.006.388.663.796.11
Group members. 1: S8, S9, S16, S17, S20. 2: S2, S11, S23, S27, S28. 3: S5, S7, S18, S22, S24. 4: S12, S15, S19, S25, S29. 5: S3, S10, S14, S26, S30. 6: S1, S4, S6, S13, and S21. a total average deviation in percentage (error).
Table 6. Learning groups formed based on the DINA model.
Group IDK1K2K3K4K5K6K7K8K9K10K11
10.670.670.580.560.720.570.590.690.690.660.64
20.650.760.500.560.660.570.590.530.650.740.60
30.770.810.570.570.770.570.590.600.710.740.74
40.670.820.750.580.930.570.590.530.900.740.72
50.670.800.630.560.770.570.590.60.700.660.76
60.580.670.570.580.770.560.590.680.710.740.56
Error a5.556.317.700.918.190.410.006.368.023.797.46
Group members. 1: S2, S4, S19, S20, S21. 2: S1, S5, S14, S18, S22. 3: S12, S17, S23, S26, S28. 4: S3, S11, S24, S25, S29. 5: S6, S7, S10, S16, S27. 6: S8, S9, S13, S15, and S30. a total average deviation in percentage (error).
Table 7. Learning groups formed based on the DKVMN-EKC optimization strategy model.
Group IDK1K2K3K4K5K6K7K8K9K10K11
10.670.740.580.570.770.580.590.680.700.660.68
20.670.640.570.580.820.570.590.690.630.660.62
30.670.720.570.560.790.570.590.520.710.740.63
40.750.750.630.550.750.560.590.530.770.740.73
50.670.860.670.570.820.570.590.600.840.740.65
60.580.820.570.580.670.560.590.600.710.740.71
Error a4.927.083.851.085.130.710.006.566.513.794.04
Group members. 1: S10, S15, S16, S20, S21. 2: S2, S7, S8, S13, S17. 3: S6, S9, S12, S14, S18. 4: S1, S3, S4, S5, S11. 5: S19, S23, S24, S25, S26. 6: S22, S27, S28, S29, and S30. a total average deviation in percentage (error).
Disclaimer/Publisher’s Note: The statements, opinions and data contained in all publications are solely those of the individual author(s) and contributor(s) and not of MDPI and/or the editor(s). MDPI and/or the editor(s) disclaim responsibility for any injury to people or property resulting from any ideas, methods, instructions or products referred to in the content.

