
Drying Behavior and Effect of Drying Temperatures on Cyanide, Bioactive Compounds, and Quality of Dried Cassava Leaves

 , ,
, ,  and
and 
Abstract
1. Introduction
2. Materials and Methods
2.1. Materials
2.2. Drying Characteristic
2.3. Drying for Quality Analysis
2.4. Quality Analysis
2.5. Statistical Analysis
3. Results and Discussion
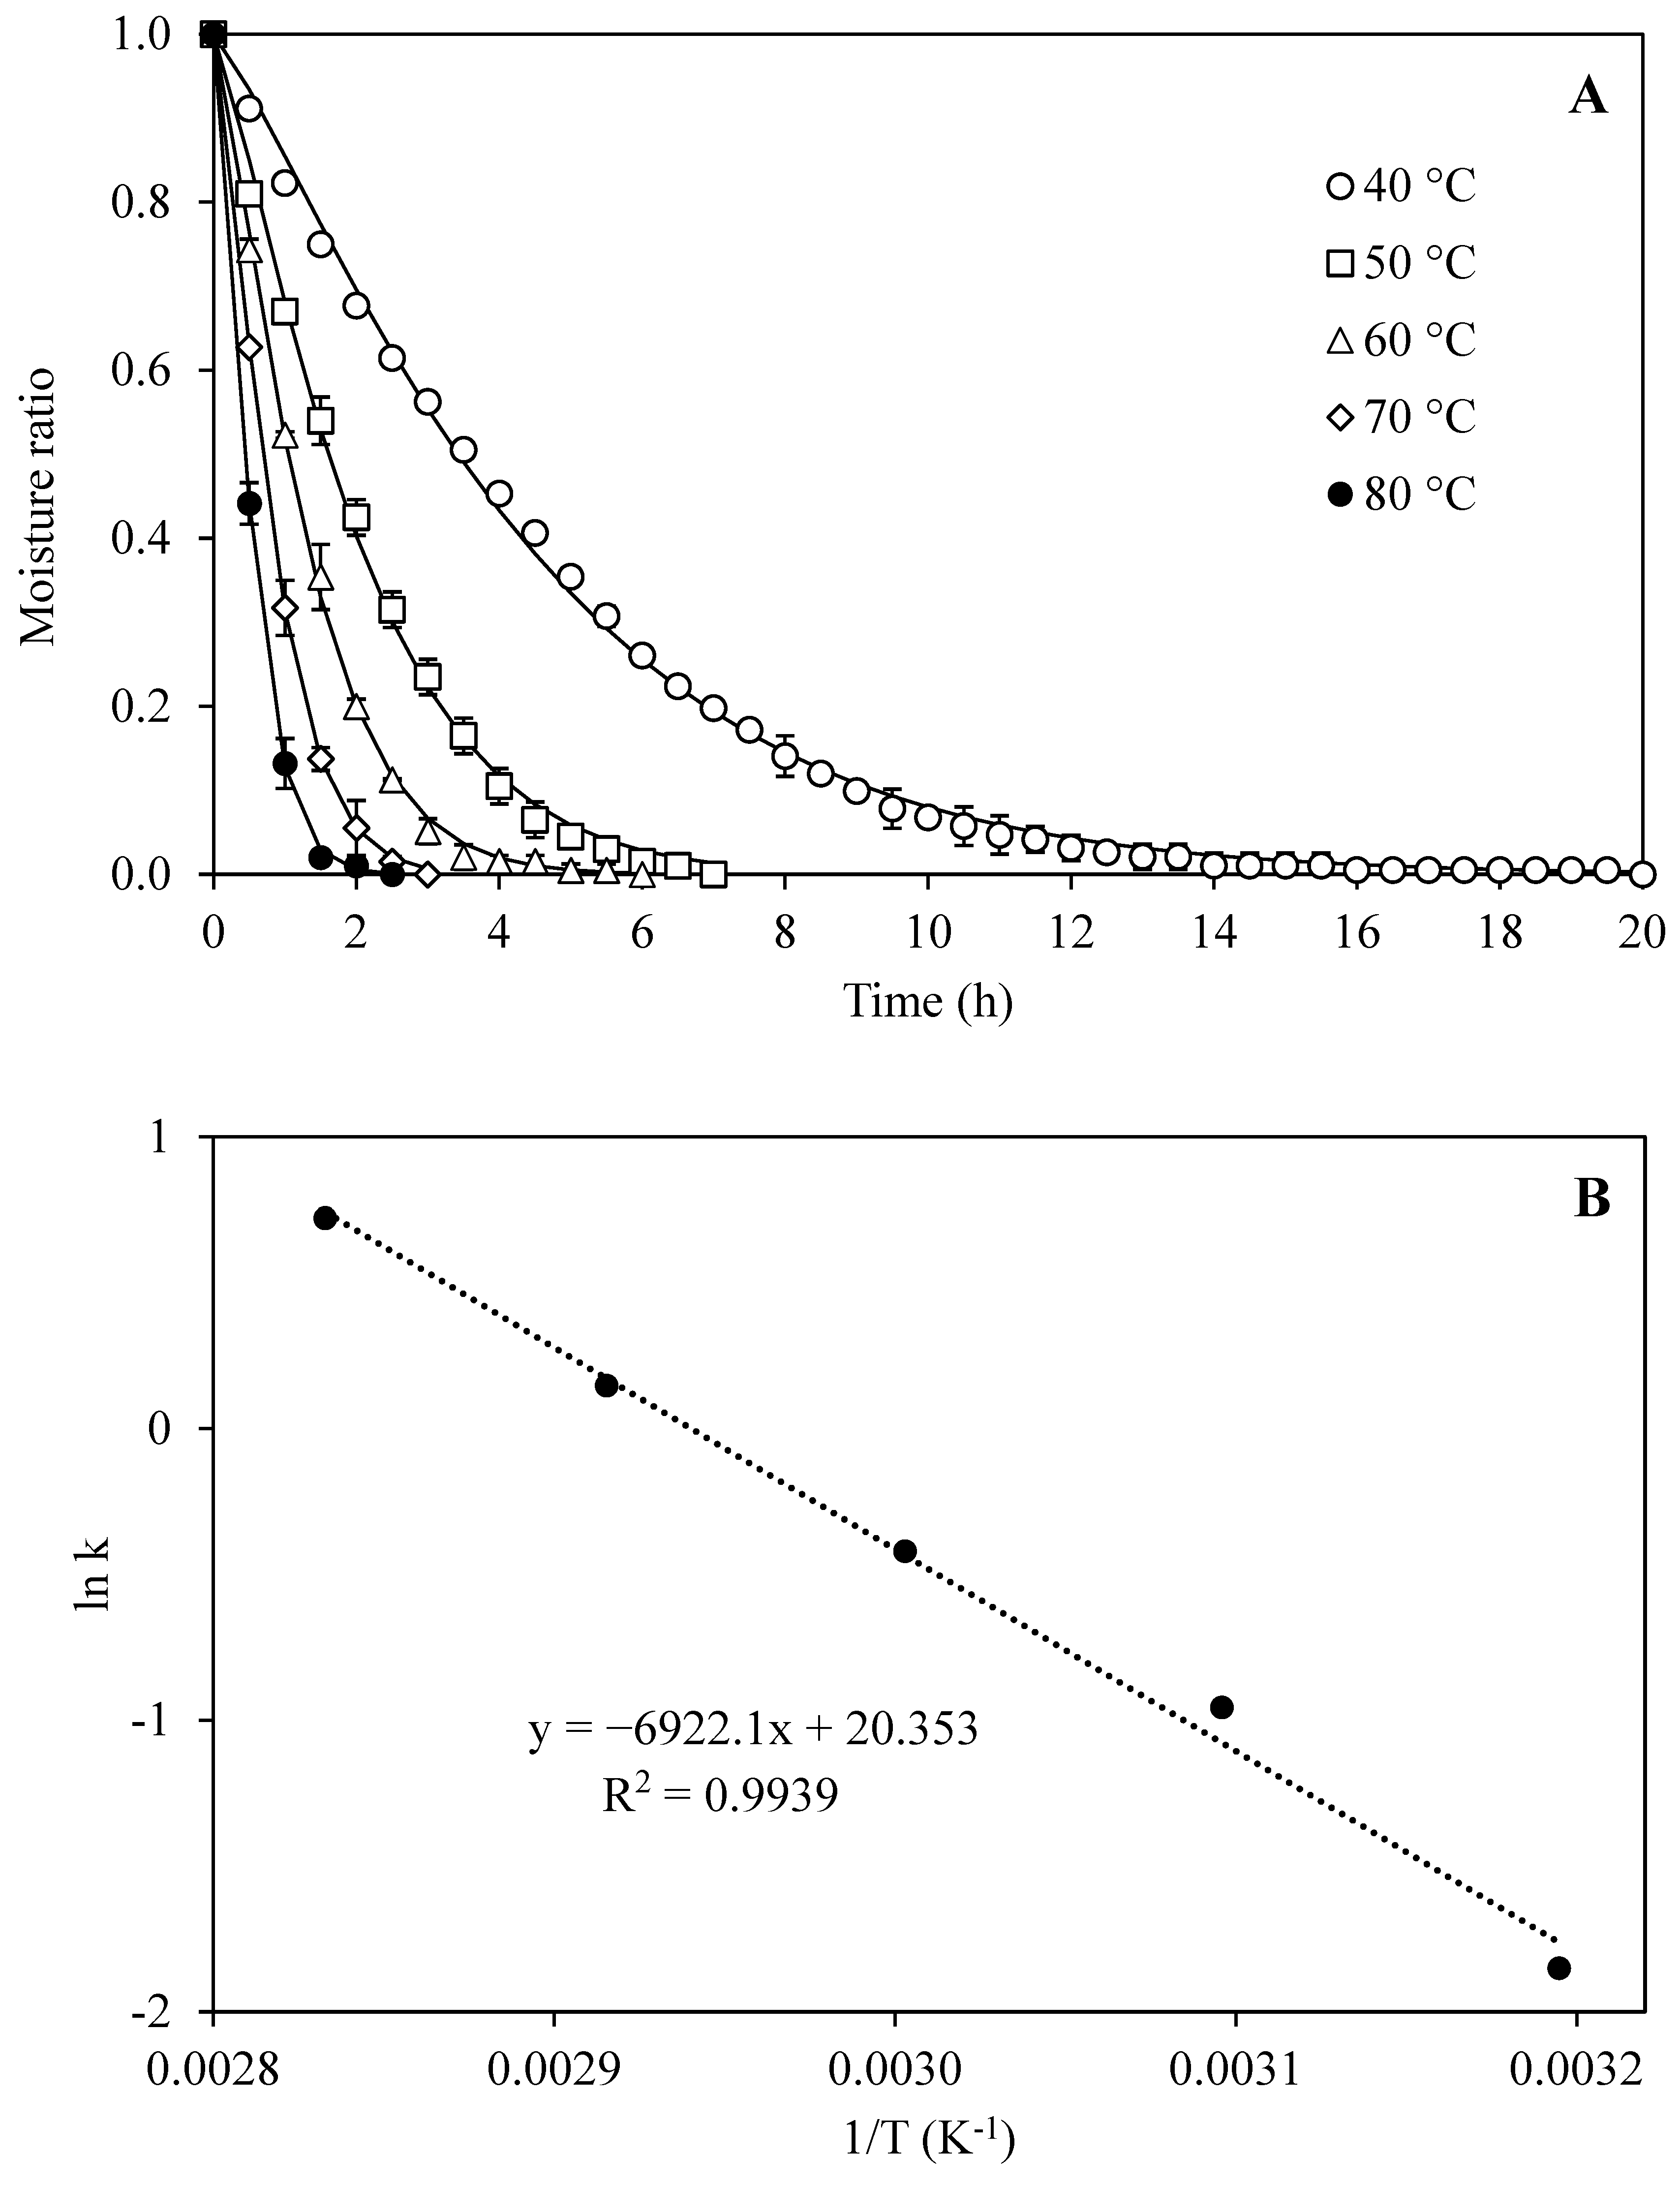
3.1. Drying Characteristic of Cassava Leaves
3.2. Effect of Drying on Cassava Leaves Quality
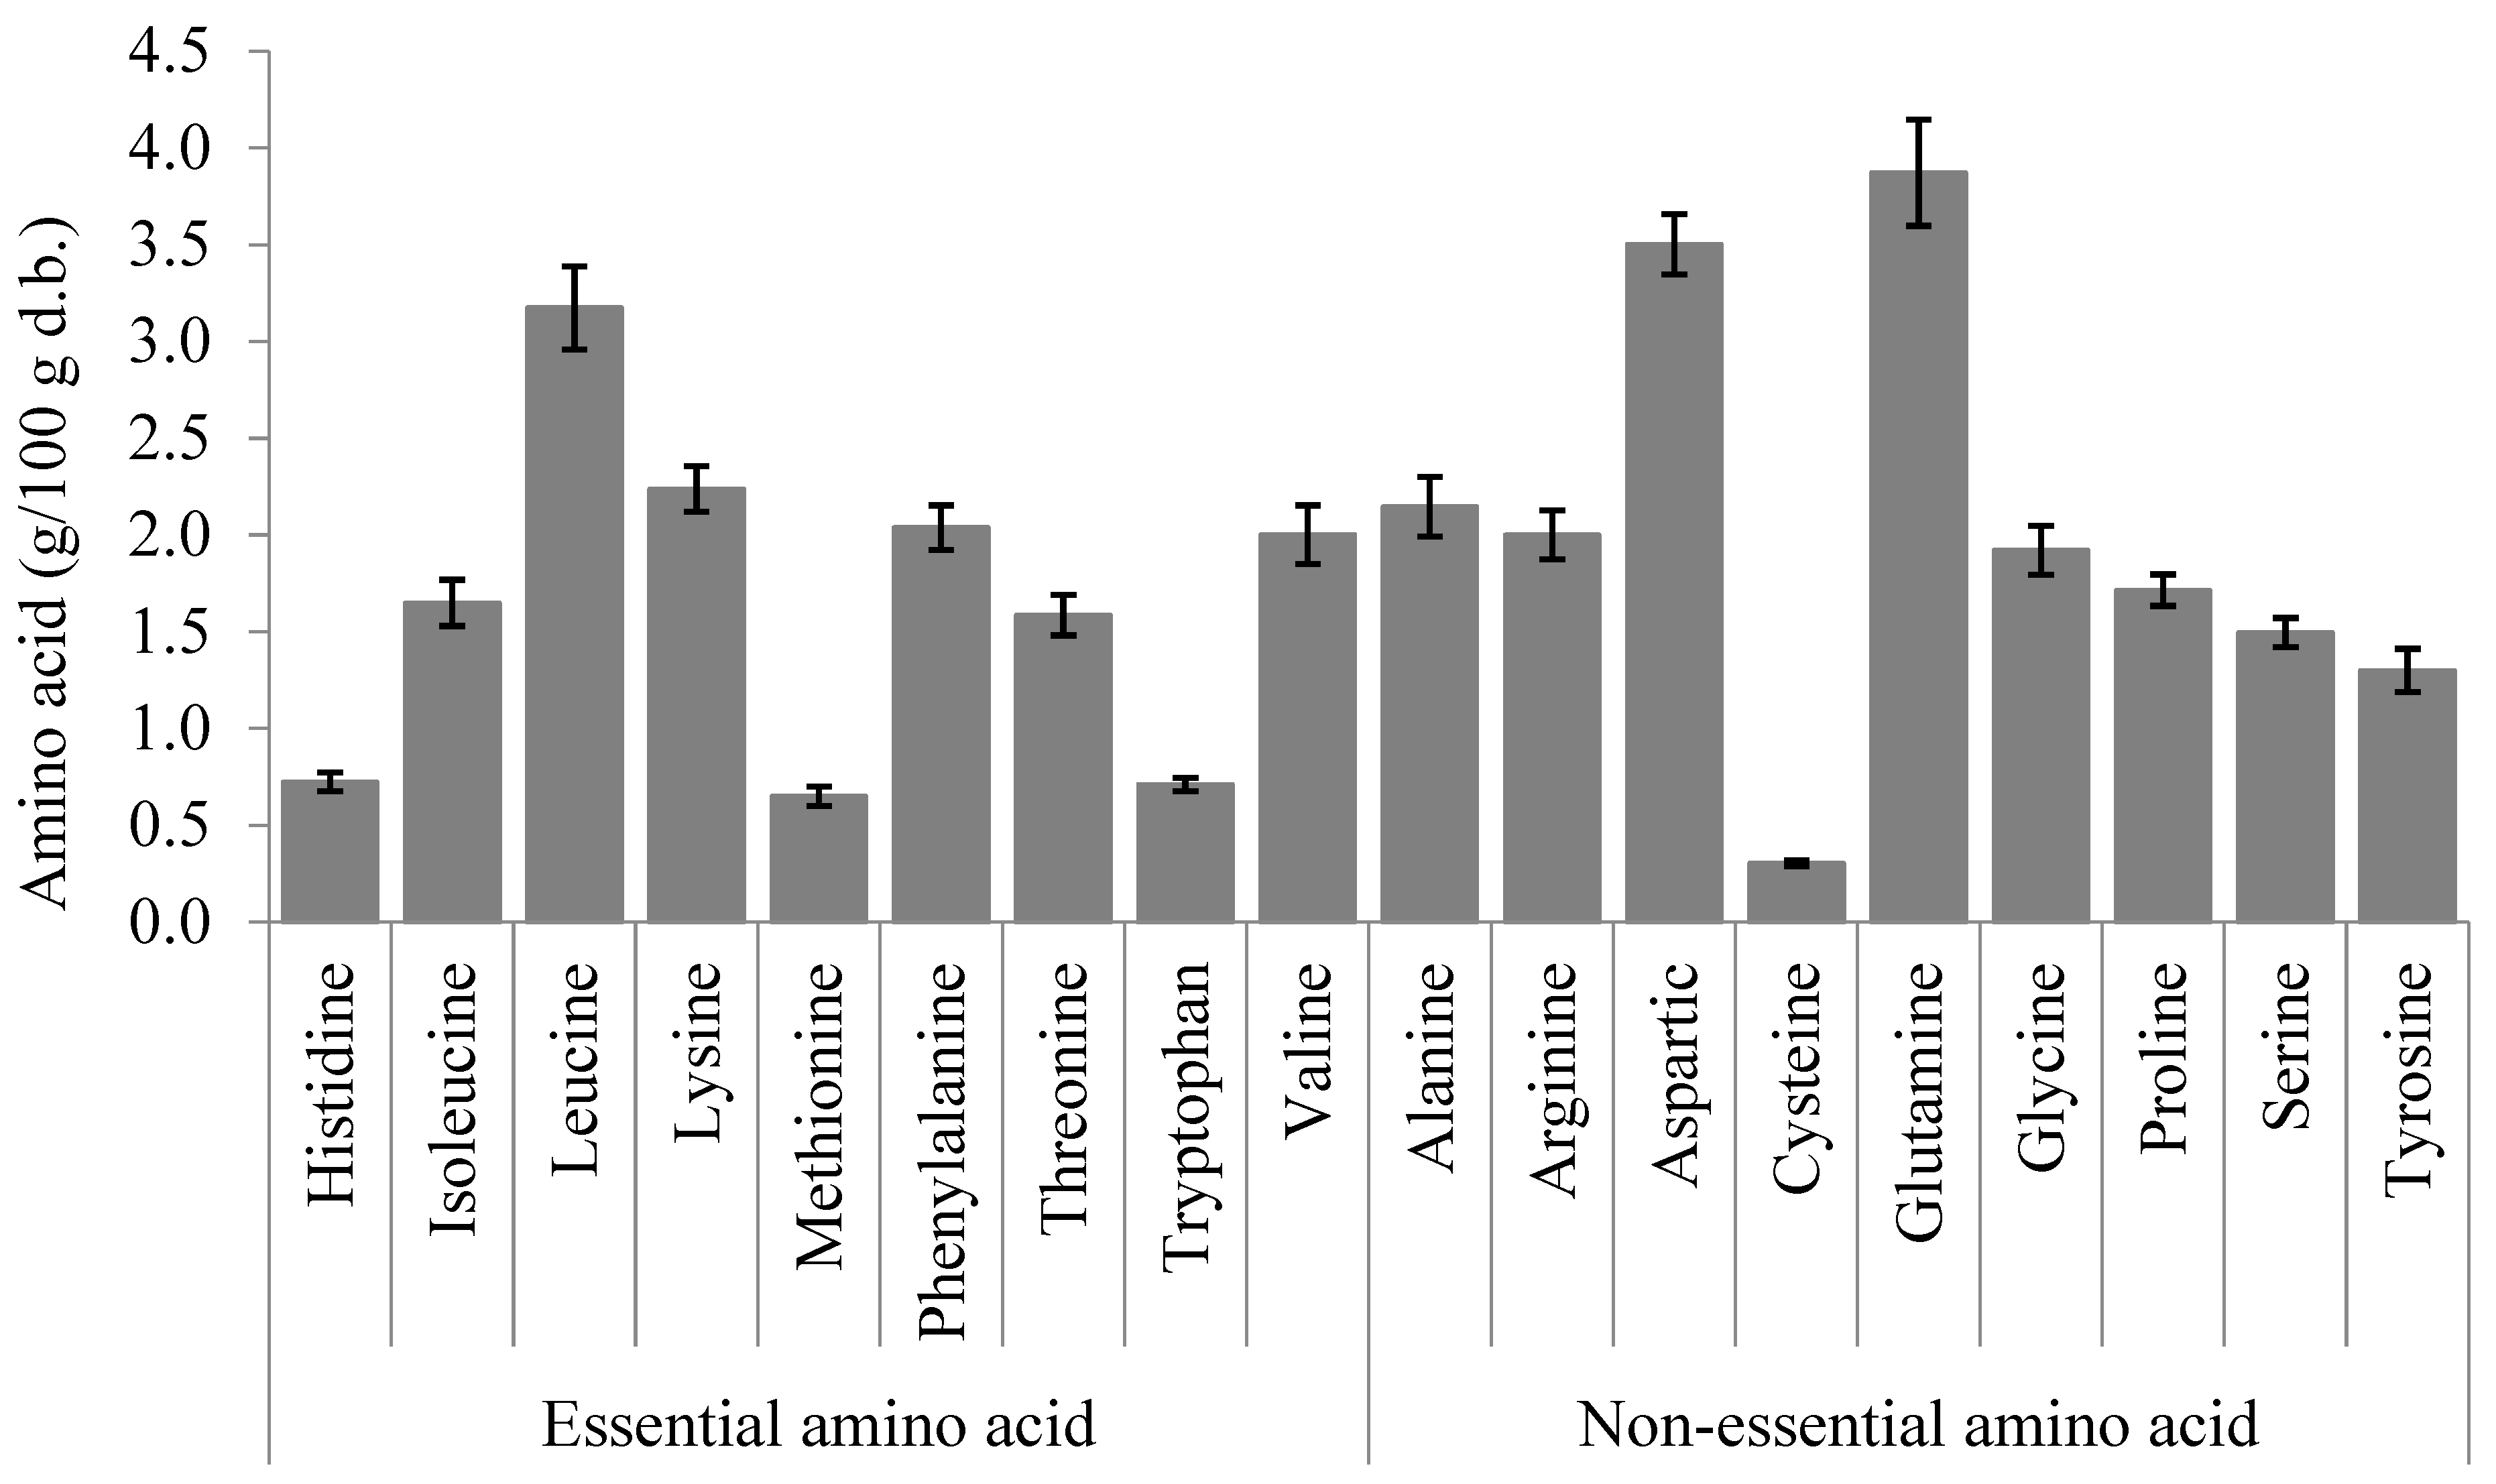
3.2.1. Quality of Fresh Cassava Leaves
3.2.2. Effect of Drying Temperatures on Cassava Leaves Quality
4. Conclusions
Author Contributions
Funding
Institutional Review Board Statement
Informed Consent Statement
Data Availability Statement
Acknowledgments
Conflicts of Interest
References
- FAOSTAT Food and Agricultural Organization of the United Nations. 2023. Available online: https://www.Fao.Org/Faostat/En/#data/QCL (accessed on 15 December 2024).
- Latif, S.; Müller, J. Potential of Cassava Leaves in Human Nutrition: A Review. Trends Food Sci. Technol. 2015, 44, 147–158. [Google Scholar] [CrossRef]
- Chaiareekitwat, S.; Latif, S.; Mahayothee, B.; Khuwijitjaru, P.; Nagle, M.; Amawan, S.; Müller, J. Protein Composition, Chlorophyll, Carotenoids, and Cyanide Content of Cassava Leaves (Manihot esculenta Crantz) as Influenced by Cultivar, Plant Age, and Leaf Position. Food Chem. 2022, 372, 131173. [Google Scholar] [CrossRef]
- Ngudi, D.D.; Kuo, Y.H.; Lambein, F. Amino Acid Profiles and Protein Quality of Cooked Cassava Leaves or “Saka-Saka”. J. Sci. Food Agric. 2003, 83, 529–534. [Google Scholar] [CrossRef]
- Achidi, A.U.; Ajayi, O.A.; Bokanga, M.; Maziya-Dixon, B. The Use of Cassava Leaves as Food in Africa. Ecol. Food Nutr. 2005, 44, 423–435. [Google Scholar] [CrossRef]
- Babu, A.K.; Kumaresan, G.; Raj, V.A.A.; Velraj, R. Review of Leaf Drying: Mechanism and Influencing Parameters, Drying Methods, Nutrient Preservation, and Mathematical Models. Renew. Sustain. Energy Rev. 2018, 90, 536–556. [Google Scholar] [CrossRef]
- Panchariya, P.C.; Popovic, D.; Sharma, A.L. Thin-Layer Modelling of Black Tea Drying Process. J. Food Eng. 2002, 52, 349–357. [Google Scholar] [CrossRef]
- Gunhan, T.; Demir, V.; Hancioglu, E.; Hepbasli, A. Mathematical Modelling of Drying of Bay Leaves. Energy Convers. Manag. 2005, 46, 1667–1679. [Google Scholar] [CrossRef]
- El-Sebaii, A.A.; Shalaby, S.M. Experimental Investigation of an Indirect-Mode Forced Convection Solar Dryer for Drying Thymus and Mint. Energy Convers. Manag. 2013, 74, 109–116. [Google Scholar] [CrossRef]
- Costa, A.B.S.; Freire, F.B.; do Carmo Ferreira, M.; Freire, J.T. Convective Drying of Regular Mint Leaves: Analysis Based on Fitting Empirical Correlations, Response Surface Methodology and Neural Networks. Acta Sci. Technol. 2014, 36, 271–278. [Google Scholar] [CrossRef]
- Akpinar, E.K.; Bicer, Y.; Cetinkaya, F. Modelling of Thin Layer Drying of Parsley Leaves in a Convective Dryer and Under Open Sun. J. Food Eng. 2006, 75, 308–315. [Google Scholar] [CrossRef]
- Premi, M.; Sharma, H.K.; Sarkar, B.C.; Singh, C. Kinetics of Drumstick Leaves (Moringa oleifera) during Convective Drying. Afr. J. Plant Sci. 2010, 4, 391–400. [Google Scholar]
- Saini, R.K.; Shetty, N.P.; Prakash, M.; Giridhar, P. Effect of Dehydration Methods on Retention of Carotenoids, Tocopherols, Ascorbic Acid and Antioxidant Activity in Moringa Oleifera Leaves and Preparation of a RTE Product. J. Food Sci. Technol. 2014, 51, 2176–2182. [Google Scholar] [CrossRef]
- Guan, T.T.Y.; Cenkowski, S.; Hydamaka, A. Effect of Drying on the Nutraceutical Quality of Sea Buckthorn (Hippophae rhamnoides L. ssp. Sinensis) Leaves. J. Food Sci. 2005, 70, E514–E518. [Google Scholar] [CrossRef]
- Lemus-Mondaca, R.; Ah-Hen, K.; Vega-Gálvez, A.; Honores, C.; Moraga, N.O. Stevia Rebaudiana Leaves: Effect of Drying Process Temperature on Bioactive Components, Antioxidant Capacity and Natural Sweeteners. Plant Foods Hum. Nutr. 2016, 71, 49–56. [Google Scholar] [CrossRef] [PubMed]
- Montagnac, J.A.; Davis, C.R.; Tanumihardjo, S.A. Processing Techniques to Reduce Toxicity and Antinutrients of Cassava for Use as a Staple Food. Compr. Rev. Food Sci. Food Saf. 2009, 8, 17–27. [Google Scholar] [CrossRef]
- Maherawati; Utami, T.; Pranoto, Y.; Cahyanto, M.N. Activity and Stability of Linamarase from Cassava (Manihot Esculenta Crantz) Leaves and Its Ability to Hydrolyze Linamarin. Int. J. Sci. Technoledge 2017, 5, 82–87. [Google Scholar]
- Argyropoulos, D.; Heindl, A.; Müller, J. Assessment of Convection, Hot-Air Combined with Microwave-Vacuum and Freeze-Drying Methods for Mushrooms with Regard to Product Quality. Int. J. Food Sci. Technol. 2011, 46, 333–342. [Google Scholar] [CrossRef]
- AOAC International. AOAC Official Methods of Analysis of AOAC International, 17th ed.; AOAC International: Gaithersburg, MD, USA, 2000. [Google Scholar]
- Bradbury, M.G.; Egan, S.V.; Bradbury, J.H. Picrate Paper Kits for Determination of Total Cyanogens in Cassava Roots and All Forms of Cyanogens in Cassava Products. J. Sci. Food Agric. 1999, 79, 593–601. [Google Scholar] [CrossRef]
- European Commission. Commission Regulation (EC) No 152/2009 of 27 January 2009 Laying down the Methods of Sampling and Analysis for the Official Control of Feed. Off. J. Eur. Union 2009, 152, 45–52. [Google Scholar]
- Lee, J.; Hwang, Y.S.; Kang, I.K.; Choung, M.G. Lipophilic Pigments Differentially Respond to Drying Methods in Tea (Camellia sinensis L.) Leaves. LWT 2015, 61, 201–208. [Google Scholar] [CrossRef]
- Valente, A.; Albuquerque, T.G.; Sanches-Silva, A.; Costa, H.S. Ascorbic Acid Content in Exotic Fruits: A Contribution to Produce Quality Data for Food Composition Databases. Food Res. Int. 2011, 44, 2237–2242. [Google Scholar] [CrossRef]
- Kara, C.; Doymaz, İ. Effective Moisture Diffusivity Determination and Mathematical Modelling of Drying Curves of Apple Pomace. Heat Mass Transf. 2015, 51, 983–989. [Google Scholar] [CrossRef]
- Doymaz, I. Thin-Layer Drying of Spinach Leaves in a Convective Dryer. J. Food Process Eng. 2007, 32, 112–125. [Google Scholar] [CrossRef]
- Mabasso, G.A.; Cabral, J.C.O.; Barbosa, K.F.; Resende, O.; de Oliveira, D.E.C.; de Almeida, A.B. Drying Kinetics, Thermodynamic Properties and Physicochemical Characteristics of Rue Leaves. Sci. Rep. 2024, 14, 14526. [Google Scholar] [CrossRef] [PubMed]
- Mbegbu, N.N.; Ojediran, J.O.; Nwajinka, C.O.; Chukwuma, E.C. Thin Layer Drying and Effect of Temperature on the Drying Characteristics of Bushbuck (Gongronema latifolium) Leaves. J. Agric. Food Res. 2024, 18, 101379. [Google Scholar] [CrossRef]
- de Figueiredo, D.V.P.; Rodrigues, T.J.A.; Santos, N.C.; da Silva, L.R.; Moura, H.V.; Martins, L.E.P.; Amadeu, L.T.S.; da Costa, M.E.M.D.; Araújo, G.T.; Rocha, A.P.T. Potential of Convective Drying in Valorization of Broccoli Leaves: Kinetic Study, Bioaccessibility of Phenolic Compounds and Structural Characteristics. J. Food Meas. Charact. 2024, 18, 10049–10061. [Google Scholar] [CrossRef]
- Pereira, I.G.; Vagula, J.M.; Marchi, D.F.; Barão, C.E.; Almeida, G.R.S.; Visentainer, J.V.; Maruyamab, S.A.; Júnior, O.O.S. Easy Method for Removal of Cyanogens from Cassava Leaves with Retention of Vitamins and Omega-3 Fatty Acids. J. Braz. Chem. Soc. 2016, 27, 1290–1296. [Google Scholar] [CrossRef]
- Nunes, E.; Junior, M.; Campos, R.; Pena, S. Oven Drying and Hot Water Cooking Processes Decrease HCN Contents of Cassava Leaves. Food Res. Int. 2019, 119, 517–523. [Google Scholar] [CrossRef]
- FAO/WHO Joint FAO/WHO Food Standards Programme. Codex Alimentarius Commission XII; Supplement 4; FAO: Rome, Italy, 1991. [Google Scholar]
- Nilnakara, S.; Chiewchan, N.; Devahastin, S. Production of Antioxidant Dietary Fibre Powder from Cabbage Outer Leaves. Food Bioprod. Process. 2009, 87, 301–307. [Google Scholar] [CrossRef]
- Roshanak, S.; Rahimmalek, M.; Goli, S.A.H. Evaluation of Seven Different Drying Treatments in Respect to Total Flavonoid, Phenolic, Vitamin C Content, Chlorophyll, Antioxidant Activity and Color of Green Tea (Camellia sinensis or C. assamica) Leaves. J. Food Sci. Technol. 2016, 53, 721–729. [Google Scholar] [CrossRef]
- Madhava Naidu, M.; Vedashree, M.; Satapathy, P.; Khanum, H.; Ramsamy, R.; Hebbar, H.U. Effect of Drying Methods on the Quality Characteristics of Dill (Anethum graveolens) Greens. Food Chem. 2016, 192, 849–856. [Google Scholar] [CrossRef]
- Karabulut, I.; Topcu, A.; Duran, A.; Turan, S.; Ozturk, B. Effect of Hot Air Drying and Sun Drying on Color Values and β-Carotene Content of Apricot (Prunus armenica L.). LWT Food Sci. Technol. 2007, 40, 753–758. [Google Scholar] [CrossRef]
- Muratore, G.; Rizzo, V.; Licciardello, F.; Maccarone, E. Partial Dehydration of Cherry Tomato at Different Temperature, and Nutritional Quality of the Products. Food Chem. 2008, 111, 887–891. [Google Scholar] [CrossRef]
- Shivanna, V.B.; Subban, N. Carotenoids Retention in Processed Curry Leaves (Murraya koenigii L. Spreng). Int. J. Food Sci. Nutr. 2013, 64, 58–62. [Google Scholar] [CrossRef] [PubMed]
- Nora, C.D.; Müller, C.D.R.; de Bona, G.S.; de Oliveira Rios, A.; Hertz, P.F.; Jablonski, A.; De Jong, E.V.; Flôres, S.H. Effect of Processing on the Stability of Bioactive Compounds from Red Guava (Psidium cattleyanum Sabine) and Guabiju (Myrcianthes pungens). J. Food Compos. Anal. 2014, 34, 18–25. [Google Scholar] [CrossRef]
- Siriamornpun, S.; Kaisoon, O.; Meeso, N. Changes in Colour, Antioxidant Activities and Carotenoids (Lycopene, β-Carotene, Lutein) of Marigold Flower (Tagetes erecta L.) Resulting from Different Drying Processes. J. Funct. Foods 2012, 4, 757–766. [Google Scholar] [CrossRef]
- Calvo, M.M. Lutein: A Valuable Ingredient of Fruit and Vegetables. Crit. Rev. Food Sci. Nutr. 2005, 45, 671–696. [Google Scholar] [CrossRef]
- Umuhozariho, M.G.; Shayo, N.B.; Msuya, J.M.; Sallah, P.Y.K. Cyanide and Selected Nutrients Content of Different Preparations of Leaves from Three Cassava Species. Afr. J. Food Sci. 2014, 8, 122–129. [Google Scholar] [CrossRef]
- Weiss, I.M.; Muth, C.; Drumm, R.; Kirchner, H.O.K. Thermal Decomposition of the Amino Acids Glycine, Cysteine, Aspartic Acid, Asparagine, Glutamic Acid, Glutamine, Arginine and Histidine. BMC Biophys. 2018, 11, 2. [Google Scholar] [CrossRef]
- Jha, A.K.; Sit, N. Drying Characteristics and Kinetics of Colour Change and Degradation of Phytocomponents and Antioxidant Activity during Convective Drying of Deseeded Terminalia Chebula Fruit. J. Food Meas. Charact. 2020, 14, 2067–2077. [Google Scholar] [CrossRef]


| Models Equation * | Temperature (°C) | Parameters | R2 | MAPE | RMSE | ||
|---|---|---|---|---|---|---|---|
| k | a | n, g, b | |||||
| Lewis MR = exp(−kt) | 40 | 0.2242 | 0.9895 | 2.6157 | 0.0045 | ||
| 50 | 0.4826 | 0.9860 | 5.0923 | 0.0096 | |||
| 60 | 0.7593 | 0.9873 | 8.8639 | 0.0099 | |||
| 70 | 1.1796 | 0.9879 | 9.9045 | 0.0145 | |||
| 80 | 1.8493 | 0.9939 | 15.2210 | 0.0115 | |||
| Page MR = exp(−ktn) | 40 | 0.1570 | 1.2065 | 0.9982 | 0.6074 | 0.0019 | |
| 50 | 0.3843 | 1.2419 | 0.9973 | 1.6251 | 0.0042 | ||
| 60 | 0.6566 | 1.2913 | 0.9988 | 1.6186 | 0.0031 | ||
| 70 | 1.1590 | 1.3277 | 0.9999 | 0.9707 | 0.0014 | ||
| 80 | 2.0584 | 1.3374 | 0.9998 | 3.6879 | 0.0018 | ||
| Henderson and Pabis MR = a·exp(−kt) | 40 | 0.2352 | 1.0533 | 0.9920 | 2.1846 | 0.0040 | |
| 50 | 0.5020 | 1.0440 | 0.9882 | 4.5775 | 0.0088 | ||
| 60 | 0.7868 | 1.0423 | 0.9891 | 7.8898 | 0.0091 | ||
| 70 | 1.2063 | 1.0278 | 0.9889 | 9.4084 | 0.0139 | ||
| 80 | 1.8624 | 1.0103 | 0.9941 | 14.9701 | 0.0114 | ||
| Two-term exponential MR = a·exp(−kt) + (1 − a)exp(−kat) | 40 | 0.2994 | 1.7341 | 0.9980 | 0.8556 | 0.0020 | |
| 50 | 0.6574 | 1.7682 | 0.9969 | 2.2231 | 0.0045 | ||
| 60 | 1.0661 | 1.8330 | 0.9982 | 2.1726 | 0.0037 | ||
| 70 | 1.7191 | 1.9075 | 0.9996 | 2.2986 | 0.0027 | ||
| 80 | 2.7258 | 1.9866 | 0.9997 | 3.3528 | 0.0024 | ||
| Verma MR = a·exp(−kt) + (1 − a)exp(−gt) | 40 | 0.1435 | 5.9405 | 0.1316 | 0.9967 | 1.9392 | 0.0026 |
| 50 | 0.2653 | 7.9531 | 0.2437 | 0.9976 | 1.7214 | 0.0039 | |
| 60 | 0.4698 | 10.2358 | 0.4469 | 0.9945 | 7.7550 | 0.0065 | |
| 70 | 0.6640 | 9.6509 | 0.6225 | 0.9965 | 2.2694 | 0.0078 | |
| 80 | 3.3682 | 23.6361 | 3.4944 | 0.9998 | 3.5129 | 0.0021 | |
| Diffusion approximation MR = a·exp(−kt) + (1 − a)exp(−kbt) | 40 | 0.3481 | 5.1768 | 1.1411 | 0.9984 | 0.6725 | 0.0018 |
| 50 | 0.2731 | 4.7597 | 0.8614 | 0.9976 | 1.7214 | 0.0039 | |
| 60 | 0.4800 | 5.6582 | 0.9101 | 0.9945 | 7.7364 | 0.0065 | |
| 70 | 0.6812 | 5.5214 | 0.8887 | 0.9965 | 2.2555 | 0.0078 | |
| 80 | 0.3481 | 5.1768 | 1.1411 | 0.9997 | 3.3528 | 0.0024 | |
| Drying Temperatures | Time (h:min) | Moisture (% w.b.) | aw | Retention (%) | ||||||
|---|---|---|---|---|---|---|---|---|---|---|
| Crude Proteins | Vitamin C | β-Carotene | Lutein | Chlorophyll–a | Chlorophyll–b | Total Cyanide | ||||
| Fresh | - | 72.34 ± 0.89 a | 0.99 ± 0.00 a | 100.00 a | 100.00 ab | 100.00 ab | 100.00 a | 100.00 a | 100.00 a | 100.00 a |
| 40 °C | 14:00 ± 0:00 | 8.93 ± 0.17 b | 0.56 ± 0.02 b | 103.56 ± 2.83 a | 29.25 ± 10.27 e | 91.55 ± 5.83 c | 87.84 ± 4.35 d | 66.77 ± 1.48 bc | 68.70 ± 2.27 b | 82.46 ± 9.02 b |
| 50 °C | 5:34 ± 0:07 | 8.09 ± 1.34 bc | 0.50 ± 0.09 bc | 100.77 ± 2.45 a | 57.50 ± 10.97 d | 95.95 ± 0.80 bc | 89.22 ± 2.03 cd | 71.40 ± 5.63 bc | 72.40 ± 6.19 b | 79.16 ± 2.56 b |
| 60 °C | 2:52 ± 0:28 | 6.64 ± 1.24 c | 0.41 ± 0.09 c | 99.52 ± 2.38 a | 75.68 ± 2.25 c | 94.80 ± 1.31 bc | 86.67 ± 2.36 d | 66.03 ± 5.07 c | 66.94 ± 5.06 b | 66.95 ± 2.01 c |
| 70 °C | 1:33 ± 0:03 | 7.29 ± 1.00 bc | 0.46 ± 0.07 bc | 102.07 ± 1.80 a | 88.15 ± 12.01 bc | 99.77 ± 1.68 ab | 92.93 ± 0.36 bc | 72.85 ± 1.32 b | 73.88 ± 2.37 b | 54.36 ± 10.60 d |
| 80 °C | 1:01 ± 0:01 | 6.41 ± 0.70 c | 0.41 ± 0.05 c | 100.54 ± 4.97 a | 106.60 ± 5.12 a | 102.87 ± 4.00 a | 94.73 ± 2.67 b | 71.89 ± 3.49 bc | 72.15 ± 4.75 b | 37.40 ± 3.06 e |
| Amino Acid | Fresh | 40 °C | 50 °C | 60 °C | 70 °C | 80 °C |
|---|---|---|---|---|---|---|
| Essential amino acid | ||||||
| Histidine | 100.00 b | 112.32 ± 5.07 a | 111.46 ± 2.80 a | 108.09 ± 2.84 a | 111.92 ± 1.60 a | 111.85 ± 4.15 a |
| Isoleucine | 100.00 a | 105.56 ± 5.18 a | 105.08 ± 1.87 a | 101.49 ± 4.30 a | 101.72 ± 3.84 a | 100.52 ± 4.98 a |
| Leucine | 100.00 a | 105.63 ± 3.34 a | 105.43 ± 1.91 a | 101.69 ± 3.08 a | 102.45 ± 3.73 a | 101.62 ± 5.26 a |
| Lysine | 100.00 a | 102.11 ± 2.35 a | 102.75 ± 1.50 a | 99.76 ± 3.80 a | 100.33 ± 2.81 a | 100.06 ± 5.73 a |
| Methionine | 100.00 a | 107.37 ± 3.68 a | 105.71 ± 4.82 a | 103.75 ± 1.80 a | 103.98 ± 1.47 a | 103.40 ± 7.01 a |
| Phenylalanine | 100.00 a | 105.87 ± 3.57 a | 105.18 ± 1.92 a | 101.44 ± 3.49 a | 101.71 ± 4.01 a | 101.30 ± 5.39 a |
| Threonine | 100.00 b | 108.64 ± 3.18 a | 107.20 ± 2.46 a | 103.32 ± 2.73 ab | 104.09 ± 3.13 ab | 102.89 ± 5.24 ab |
| Tryptophan | 100.00 a | 109.58 ± 7.49 a | 107.11 ± 7.77 a | 104.96 ± 10.51 a | 105.67 ± 11.02 a | 105.39 ± 10.04 a |
| Valine | 100.00 a | 106.12 ± 5.75 a | 105.48 ± 2.64 a | 101.30 ± 3.22 a | 101.26 ± 3.20 a | 99.89 ± 4.96 a |
| Non-essential amino acid | ||||||
| Alanine | 100.00 b | 110.14 ± 3.73 a | 113.61 ± 2.11 a | 114.16 ± 2.67 a | 115.03 ± 2.32 a | 110.77 ± 5.34 a |
| Arginine | 100.00 b | 104.36 ± 3.46 b | 106.41 ± 1.39 a | 102.48 ± 3.24 b | 103.95 ± 3.09 b | 102.46 ± 5.18 b |
| Aspartic | 100.00 abc | 105.32 ± 3.11 a | 100.39 ± 1.49 ab | 94.62 ± 3.44 bcd | 94.00 ± 3.34 cd | 93.57 ± 5.40 d |
| Cysteine | 100.00 b | 137.85 ± 8.11 a | 137.52 ± 7.28 a | 128.50 ± 13.71 a | 129.37 ± 8.68 a | 135.44 ± 14.02 a |
| Glutamine | 100.00 bc | 106.56 ± 4.06 a | 104.73 ± 2.16 ab | 99.01 ± 3.70 bc | 97.00 ± 2.11 c | 95.93 ± 4.70 c |
| Glycine | 100.00 a | 105.62 ± 3.75 a | 104.60 ± 2.40 a | 100.18 ± 2.58 a | 101.14 ± 3.08 a | 100.58 ± 4.40 a |
| Proline | 100.00 a | 108.52 ± 1.01 a | 106.31 ± 1.52 a | 102.65 ± 4.32 a | 101.63 ± 8.04 a | 101.64 ± 7.98 a |
| Serine | 100.00 b | 106.60 ± 2.19 a | 103.77 ± 2.59 ab | 100.13 ± 1.27 b | 101.56 ± 3.72 ab | 101.87 ± 4.06 ab |
| Tyrosine | 100.00 a | 105.27 ± 4.77 a | 105.48 ± 4.17 a | 100.32 ± 2.74 a | 100.65 ± 2.93 a | 99.48 ± 3.86 a |
| Drying Methods | Dried Leaves | Color Values of Ground Leaves | |||||
|---|---|---|---|---|---|---|---|
| Ground Leaves | L* | a* | b* | Hue Angle | Chroma | ||
| 40 °C |  |  | 41.65 ± 0.87 a | −10.71 ± 0.19 a | 27.99 ± 1.43 a | 110.96 ± 0.62 a | 29.97 ± 1.41 a |
| 50 °C | 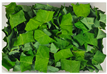 |  | 41.50 ± 0.20 a | −10.75 ± 0.16 a | 27.82 ± 1.33 a | 111.14 ± 0.74 a | 29.82 ± 1.28 a |
| 60 °C | 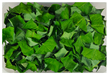 |  | 41.28 ± 0.35 a | −10.69 ± 0.23 a | 27.73 ± 1.69 a | 111.11 ± 0.77 a | 29.72 ± 1.66 a |
| 70 °C | 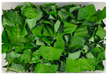 |  | 40.79 ± 0.10 ab | −10.94 ± 0.19 a | 28.54 ± 0.60 a | 110.98 ± 0.69 a | 30.57 ± 0.51 a |
| 80 °C | 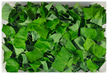 |  | 40.20 ± 0.54 b | −11.32 ± 0.17 b | 28.52 ± 1.02 a | 111.65 ± 0.59 a | 30.68 ± 0.99 a |
Disclaimer/Publisher’s Note: The statements, opinions and data contained in all publications are solely those of the individual author(s) and contributor(s) and not of MDPI and/or the editor(s). MDPI and/or the editor(s) disclaim responsibility for any injury to people or property resulting from any ideas, methods, instructions or products referred to in the content. |
© 2025 by the authors. Licensee MDPI, Basel, Switzerland. This article is an open access article distributed under the terms and conditions of the Creative Commons Attribution (CC BY) license (https://creativecommons.org/licenses/by/4.0/).
Share and Cite
Chaiareekitwat, S.; Nagle, M.; Mahayothee, B.; Khuwijitjaru, P.; Rungpichayapichet, P.; Latif, S.; Müller, J. Drying Behavior and Effect of Drying Temperatures on Cyanide, Bioactive Compounds, and Quality of Dried Cassava Leaves. Appl. Sci. 2025, 15, 2680. https://doi.org/10.3390/app15052680
Chaiareekitwat S, Nagle M, Mahayothee B, Khuwijitjaru P, Rungpichayapichet P, Latif S, Müller J. Drying Behavior and Effect of Drying Temperatures on Cyanide, Bioactive Compounds, and Quality of Dried Cassava Leaves. Applied Sciences. 2025; 15(5):2680. https://doi.org/10.3390/app15052680
Chicago/Turabian StyleChaiareekitwat, Sawittree, Marcus Nagle, Busarakorn Mahayothee, Pramote Khuwijitjaru, Parika Rungpichayapichet, Sajid Latif, and Joachim Müller. 2025. "Drying Behavior and Effect of Drying Temperatures on Cyanide, Bioactive Compounds, and Quality of Dried Cassava Leaves" Applied Sciences 15, no. 5: 2680. https://doi.org/10.3390/app15052680
APA StyleChaiareekitwat, S., Nagle, M., Mahayothee, B., Khuwijitjaru, P., Rungpichayapichet, P., Latif, S., & Müller, J. (2025). Drying Behavior and Effect of Drying Temperatures on Cyanide, Bioactive Compounds, and Quality of Dried Cassava Leaves. Applied Sciences, 15(5), 2680. https://doi.org/10.3390/app15052680