Abstract
We employed the nonlinear finite element software ANSYS LS-DYNA 19.0 to develop a coupled dynamic-static load model for shale oil reservoirs in the Qianjiang Depression through theoretical analysis and numerical simulation and to investigate an oil extraction technology by improving oil yield while maintaining environmental sustainability of Qianjiang Depression. The effects of various loading conditions, including hole size and different oxygen balance of explosives, on oil recovery efficiency during reservoir rock blasting are extensively examined. Numerical simulations reveal that NTNMT explosions transfer more energy to the reservoir rock, compared to DEGDN and TNT. Specifically, when the charging radius is set to 6 cm, NTNMT yields optimal fracture expansion and coalescence, leading to improved economic benefits for shale oil extraction. Additionally, density functional theory (DFT) simulations were conducted to analyze the decomposition processes of different oxygen balance explosive molecules within the reservoir and assess their potential pollution. The results indicate that all the explosives can degrade reservoir rocks, but the explosion of positive oxygen balance, NTNMT, exhibits the highest degradability and lowest environmental impact.
1. Introduction
With the advancement of society, China’s demand for oil has been steadily increasing, thereby heightening the strategic importance of oil resources. Continental shale oil serves as a pivotal alternative resource for China’s petroleum industry. Various types of reservoirs form continuously distributed “sweet sections” and “sweet areas” in or adjacent to source rocks [1]. Shale oil resources in China are predominantly located within five major basins, such as Ordos, Songliao, Junggar, Sichuan, and Bohai Bay, and eight smaller basins, including Qaidam, Jianghan, and Subei [2]. These reservoirs possess substantial reserves; however, they exhibit significant heterogeneity, complex lithological compositions, slenderness in reservoir layers, and significant anisotropy. Additionally, it has characteristics of low porosity, low permeability, and low hydrocarbon abundance [3,4,5]. Currently, in the development of shale oil and gas reservoirs, low-permeability formations are primarily enhanced through fracturing or acidizing technologies. These methods aim to create fractures with high conductivity and adequate length, thereby improving the formation of oil conductivity, expanding the drainage area, enhancing permeability, and ultimately increasing oil recovery rates and achieving substantial production increases [6].
Nevertheless, there remains a lack of global consensus regarding the multifaceted social and environmental consequences of hydraulic fracturing, a pivotal technology in the natural gas revolution [7]. This is evidenced by varying policy approaches, from pro-fracking legislation in Pennsylvania to moratoriums in the Netherlands, Quebec, and Scotland, and a complete ban on fracking in France. This issue can primarily be attributed to three factors: first, air pollution. High-power, long-term stable construction skid-mounted fracturing pump trucks, large-scale continuous mixing devices, and sand transportation equipment emit substantial amounts of exhaust gases. Additionally, volatile organic compounds from crude oil during the production process are also released into the atmosphere through evaporation, potentially generating toxic and harmful pollutants [8]. Secondly, hydraulic fracturing may be associated with an increased incidence of seismic activity. Ellsworth et al. [9] shows that the Midwest region of the United States experienced as many as 300 earthquakes of magnitude 3 or greater from 2010 to 2012. This number is equivalent to the total count of such earthquakes recorded over the preceding 21-year period from 1967 to 2000. It is well established that this region is abundant in oil resources and has a higher density of oil wells. The high-pressure water injection process used in hydraulic fracturing could potentially deepen pre-existing geological fractures, thereby increasing both the frequency and intensity of seismic events. Ultimately, the most critical concern is severe water pollution; hydraulic fracturing necessitates millions of liters of water and generates substantial volumes of liquid effluent with varying compositions and flow rates. Cooper et al. [10] and Vasi et al. [11] have highlighted that the natural gas industry must prioritize water pollution issues. Ellsworth analyzed the frequency and magnitude of seismic activities in regions adjacent to oil wells located near river systems. Furthermore, Hand [12] demonstrated that during oil production, wastewater injection can significantly increase seismic activity when it reaches a certain threshold. Consequently, there is an urgent need to develop new extraction technologies that not only enhance oil recovery but also ensure environmental sustainability.
Explosive fracturing technology involves the detonation of explosives to generate a large number of shock waves, forming high-energy gas fractures in underground oil and gas reservoirs. This method is not constrained by low-level acid or alkali conditions and can rapidly produce high-pressure gas to create an intricate fracture network independent of in situ stress. Consequently, bottom shear displacement forms self-supporting fractures without the need for proppant, facilitating smoother hydrocarbon flow and achieving optimal production. Additionally, this technique causes minimal damage to the reservoir and simplifies construction processes. Guo et al. [13] investigated the feasibility of substituting hydraulic fracturing with blasting fracturing in liquid-rich shale formations. Their research indicates that explosive fracturing is more suitable and cost-effective for certain specific applications compared to hydraulic fracturing. However, rock blasting tests are both expensive and time-consuming [12], and theoretical research and numerical simulations are efficient methods to elucidate the mechanisms of rock blasting crack propagation [9,14,15,16]. These approaches facilitate a deeper understanding of the microscopic physical and chemical properties associated with explosive fracturing. Wang et al. [17] introduced an explosive fracturing technique for enhancing shale gas reservoir stimulation. By incorporating the effects of stress wave shock and gas drive from detonation fracturing, utilized numerical simulations to elucidate the propagation mechanisms of fracture initiation. The studies indicated that explosive fracturing can effectively alleviate stress concentration and generate complex fracture networks. Peng et al. [18] conducted a simulation study on low-permeability reservoirs to investigate fracture propagation induced by explosive fracturing. The fractal characteristics of cracks were analyzed, and the fractal dimensions of fractures were examined by fractal geometry theory, which are influenced by the quantity of explosives and confining pressure. The authors recommended that in field operations, the explosive charge should be appropriately matched with confining pressure, employing axial coupling and radial decoupling charge configurations.
The magnitude and scope of explosion injuries are largely dictated by the properties of the explosives [19]. The explosion process is fundamentally characterized by an extremely rapid and intense redox reaction between the combustible and oxidizing components [20]. Based on the quantity of oxygen in the explosive, the oxygen balance can be categorized into three distinct scenarios: zero oxygen balance, positive oxygen balance, and negative oxygen balance. The impact of these conditions on formation is primarily reflected in the explosion efficiency, energy release, and environmental safety.
To sum up, the development of shale oil reservoirs faces significant technical challenges, including low efficiency in fracture network construction and insufficient reservoir reconstruction. There is an urgent need to explore a new and efficient development technology system. As a promising physical transformation method, explosive fracturing technology offers substantial mechanistic advantages for constructing three-dimensional fracture networks in reservoirs through controlled detonation energy. However, three core issues remain to be addressed. First, compared to traditional hydraulic fracturing, research on the dynamic response of explosive fracturing lags behind, and a comprehensive theoretical model has yet to be established. Second, the variety of explosives and their differing properties result in significant variability in crack propagation patterns. Most importantly, the impact of explosives extends beyond the explosion effect, their environmental impact remains uncertain. Therefore, establishing a detonation fracturing model based on reservoir geology and developing an optimal design methodology for explosive fracturing will be crucial research directions to promote the industrial application of this technology.
Based on the geological characteristics of the Qianjiang Depression and utilizing existing three-dimensional seismic data, this study employs the nonlinear finite element program ANSYS LS-DYNA to establish a detonation fracturing model for shale oil reservoirs under explosive loading. Through theoretical analysis and numerical simulation, the dynamic response of explosive action on the rock structure within shale oil reservoirs is investigated. The study further analyzes the damage mechanism induced by explosive shock waves on the reservoir structure, summarizes the impact of damage extent on diversion capacity, and explores the correlation between diversion capacity and well stimulation effectiveness. Additionally, DFT is used to simulate the transition state of the reaction between explosive and reservoir in order to analyze the degradation mechanism of both explosive and reservoir, evaluating its environmental safety impact. It can offer theoretical support for experimental research and field application of explosive fracturing technology.
2. Computational Methods
Modeling methods commonly employed for simulating the fracturing of brittle rock materials under dynamic loads encompass the finite element method [21], discrete element method [22], near-field method [23], phase-field method [24], and non-local method [25]. Among these approaches, the finite element method implemented via the nonlinear finite element software ANSYS LS-DYNA 19.0 is selected for the current simulation. This choice is driven by its versatility, widespread adoption, and the advanced constitutive models available within ANSYS LS-DYNA 19.0. The Holmquist–Johnson–Cook (HJC) constitutive model implemented in ANSYS LS-DYNA 19.0 [26] is capable of capturing the dynamic response of brittle materials under conditions of large strain, high strain rates, and high confining pressures. It also accounts for material damage and failure due to impact loading while maintaining simplicity and accuracy for large-scale computations. However, the HJC model is incapable of accurately describing the propagation of tensile cracks within fracture zones. Therefore, it is necessary to couple the HJC model with an additional failure criterion by incorporating the keyword *MAT_ADD_EROSION. When the compressive strength in the model attains the predefined threshold, it is automatically removed [27].
With the rapid advancement of computer technology, numerical simulation has emerged as a crucial tool for researchers investigating reservoir rock blasting. This approach holds significant importance for optimizing blasting parameters and elucidating the mechanisms of rock blasting [28,29]. In ANSYS LS-DYNA 19.0, explosives are typically modeled as uniform continuous media, utilizing the MAT_HIGH_EXPLOSIVE_BURN model and the Jones–Wilkins–Lee (JWL) equation of state to characterize the relationship between the pressure generated by the blasting load and the volume of the explosive product [30]. The formula elucidates the constitutive relationship between detonation pressure and the expansion dynamics of detonation products.
where denotes the detonation pressure, represents the relative volume, and , , , , and are dimensionless constants, and signifies the internal energy per unit of initial volume.
In numerical simulations, air is modeled as a fluid. The ANSYS LS-DYNA 19.0 program characterizes air using two fundamental approaches: the equation of state and the constitutive equation. The equation of state expresses the relationship between pressure and volume, whereas the constitutive equation delineates the flow properties of materials by examining the interdependencies among stress, strain, and time [27].
In this paper, the MAT_NULL model and the LINEAR_POLYNOMIAL equation of state (2) are employed for air materials. The pertinent parameters are detailed in Table 1.

Table 1.
Air material parameters.
In the formula, represent constants; , where denotes the relative volume; and represents the internal energy per unit of initial volume.
Using the Gaussian 16 (A.03) software package, the transition states (TSs) in the vicinity were identified in the gas phase at the B3LYP/6-311+G(d,p) level of theory, and the geometries as well as the activation barriers of the reactants and products were computed. The reaction pathway was characterized using intrinsic reaction coordinate (IRC) analysis, which links the optimized structures of the reactants and products.
3. Results and Discussion
3.1. FE Model
Based on the analysis of reservoir rocks in the Qianjiang Depression by Zhou et al. [31], the computational model is segmented into three components: reservoir rock, explosives, and air. To accurately simulate the dynamic response of rock blasting within a reservoir, a Lagrangian grid was employed to construct the reservoir rock model. An Eulerian mesh was utilized for modeling the explosives and air, with air serving as the coupling medium. The keyword ALE_MULTI-MATERIAL_GROUP was introduced to permit fluid flow within each material phase in the mesh, addressing issues of significant deformation and negative volume during explosion simulations. Ultimately, the fluid media (explosives and air) and solid media (reservoir rock) were coupled using the CONSTRAINED_LAGRANGE_IN_SOLID keyword. Based on the definition of fluid–structure interaction, it is necessary for the computational grids to overlap in two properties: the air domain and the reservoir rock domain.
The model utilizes a single-layer solid grid structure for modeling and mapping the grid to divide it. Non-reflective boundary conditions are applied at the boundaries, and all nodes are constrained to have fixed normal displacements in the Z direction. The time step for the simulation was set to 0.67 μs. Numerical calculations were conducted using the cm-g-μs unit system. The reservoir rock selected for the explosive fracturing model originated from deep formations, typically characterized by high and complex in situ stress conditions. The presence of such intricate stress environments poses significant challenges to shale oil exploitation; therefore, it is essential to incorporate the effects of in situ stress in numerical simulations. Prior to conducting the explosive fracturing simulation, a static analysis was performed to apply the initial in situ stress state (P), followed by dynamic blast analysis (Pt), as illustrated in Figure 1.
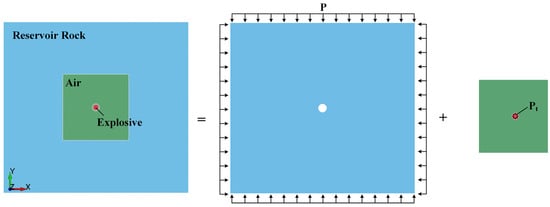
Figure 1.
Coupled modeling of dynamic and static loads (Unit: cm).
3.2. Material Model
3.2.1. Rock [32]
The primary mineral composition of the shale [31] in the reservoir examined in this chapter consists of albite (69.37%), dolomite (9.78%), illite (8.27%), and calcite (6.89%). The fundamental physical and mechanical properties of the reservoir are as follows: density = 2370 kg/m3, uniaxial compressive strength = 192.5 MPa, elastic modulus = 112.02 GPa, Poisson’s ratio = 0.29, and porosity = 15.9% [33]. The maximum tensile strength , shear modulus , and bulk modulus can be calculated using Equations (3)–(5), respectively.
Obtain = 8.602 MPa, = 4.659 GPa, = 8.465 GPa
The strength model is described by the dimensionless equivalent stress , which is formulated as:
where represents the actual equivalent stress and denotes the uniaxial compressive strength. Additionally, can be defined in terms of damage, which may be expressed as:
where represents the damage parameter, with values ranging from 0 to 1. Specifically, = 1 signifies complete failure of the rock, while = 0 indicates an undamaged state.
The parameters , , and are associated with the yield surface of the HJC model. In the absence of damage ( = 0) and without considering strain rate effects, Equation (7) can be simplified as follows:
Based on the principles of plasticity theory and without accounting for damage evolution or strain rate effects, both the HJC constitutive model and the Mohr–Coulomb constitutive model intersect at the corresponding points of pure shear and uniaxial compression on the compressive meridian plane. Consequently, the relationship between the dimensionless viscous strength coefficient , cohesion , and uniaxial compressive strength can be derived.
Based on the Mohr–Coulomb strength criterion, the cohesion can be determined using the following equation:
In the formula, and represent the maximum and minimum principal stressors at the point of static compressive failure, respectively, while denotes the angle of internal friction.
The Hoek–Brown criterion is widely recognized for its utility in assessing the strength index of rock under triaxial static compression. In scenarios where static triaxial compression test data are unavailable, Xie Xianli et al. [34] and Banadaki et al. [35] employed this criterion to calibrate parameters for the RHT model and JH-2 model, respectively, achieving satisfactory results in numerical simulations. Consequently, this study adopted this method to obtain static compressive strength data of rocks under varying confining pressure conditions using the following Hoek–Brown empirical formula:
where represents the static uniaxial compressive strength, with ; , , and denote constants, which are typically 24, 1, and 0.5, respectively, for intact rock materials.
The data presented in Table 2 were derived by applying various confining pressures in conjunction with Equation (11). Through linear regression analysis based on Equation (10), as illustrated in Figure 2, the following expression was obtained:

Table 2.
Static compressive strength of reservoir rock under different confining pressures.
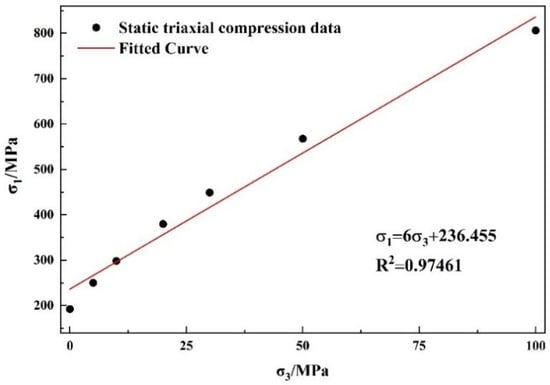
Figure 2.
Mohr–Coulomb criterion fitting.
In conjunction with Equation (10), the values = 45.585° and = 48.266 MPa can be derived from Equation (13).
From Equation (9), we derive = 0.251. Subsequently, Equation (8) can be transformed into . The standardized equivalent stress and the standardized hydrostatic pressure can be determined using the following respective formulas:
By substituting the static compressed data presented in Table 2 into Equations (14) and (15), seven sets of data listed in Table 3 can be derived. Through fitting these seven data sets with the equation , the parameters = 2.11 and = 0.894 are obtained, as illustrated in Figure 3.

Table 3.
Equivalent stress and hydrostatic pressure of reservoir rock under different confining pressures.
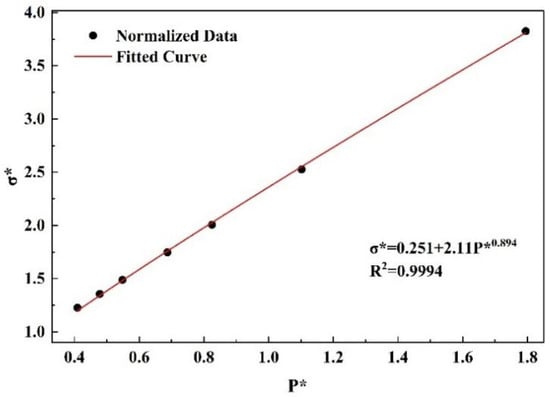
Figure 3.
Failure surface fitting.
The maximum normalized intensity signifies the critical threshold beyond which ceases to increase with further increments in . When taking the value, it is imperative that the condition is satisfied. Based on the maximum value of the second invariant of the partial stress tensor for reservoir rock under hydrostatic pressure [36], this study adopted = 6.3.
When the loading rate is within the range of 10−5/s to 10−1/s, the rock chamber test is classified as a static test. Both the triaxial compression process and the confining pressure increase process are characterized as static processes [37]. Therefore, the influence of strain rate on the test results is negligible, leading to the assumption that the strain rate coefficient .
The damage parameter can be determined using Equation (16), where , resulting in = 0.0473. The parameters and exert minimal influence on the simulation outcomes; therefore, following the literature [38], the values adopted are = 1 and = 0.01.
When the rock attains its elastic limit, the crushing pressure and the crushing volume strain can be determined using Equations (17) and (18).
Obtain = 64.167 MPa, = 0.00758.
represents the volumetric strain at the compaction limit state, which can be determined using the following equations:
In these equations, represents the real-time density of the material under pressure; denotes the initial porosity of the rock, with = 15.9%.
By applying Equations (19) and (20), we obtain = 0.189.
For conventional rock materials, in the absence of Hugoniot experimental data, an empirical formula can be derived as follows:
In the formula, represents the initial density of the rock, with a value of 2370 kg/m3. and are empirical parameters. For the selection of these parameters, Meyers provides values for and for various materials in Table 5.1 of the literature [39]. For albite, which constitutes the highest content in shale reservoirs, it primarily consists of SiO2 (68.8%), Al2O3 (19.4%) and Na2O (11.8%) [40]. The and values for the mixture can be determined using the following formula:
where represents the percentage of the element. From Equation (22), we determine that = 4291.92 m/s and = 1.273.
The pressure constants , , and can be utilized to fit Equation (21) to a cubic polynomial as described in Equation (23).
The final fitting yielded a set of parameters, which are presented in Figure 4. From this, the values obtained are = 45 GPa, = 58 GPa, and = 55 GPa.
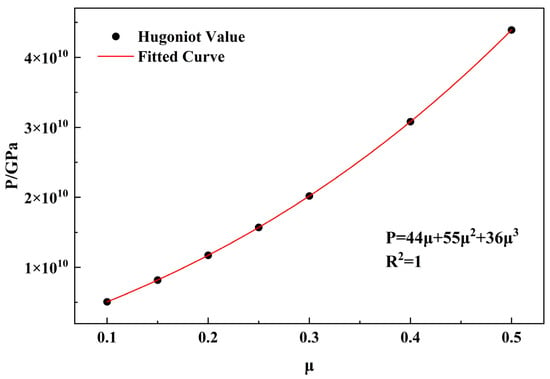
Figure 4.
Fitting of pressure parameters.
The value represents the longitudinal coordinate at the intersection of the fitting curves corresponding to the plastic and compact stages in the equation of state. Due to insufficient experimental data in the plastic stage, the relationship between the modified volumetric strain and the axial static pressure P under varying confining pressures is described by Equations (20) and (23). Consequently, we determine that = 1.452 GPa.
The failure type is utilized to govern the removal of failed material elements and is defined as follows in the ANSYS/LS-DYNA User Manual [41]:
- , failure at damage degree. When the material is under pressure, D can be defined as:
When the material is in tension, can be defined as:
- 2.
- When , invaid.
- 3.
- , failure when the equivalent plastic strain reaches .
Regarding the value of , there is a greater inclination in the academic community to accept failure strain (pressure-induced failure mode) as its intrinsic failure mechanism. Sun et al. [42] proposed several assumptions concerning the value of . They posited that represents the critical threshold of plastic strain in the HJC material model, which determines whether the material will fail under pressure . This relationship can be mathematically expressed by Equation (26).
Furthermore, when the pressure on the material under compression increases exponentially and the corresponding bulk strain change rate is less than 1% [42], the rock material attains its maximum density . Based on this premise, Lin et al. [43] proposed that the maximum density is approximately 1% greater than the compaction density , which can be simplified as . Consequently, by substituting the calculated value of from Equations (20) and (23) into Equation (26), the final factor = 0.726.
The selection of the reference strain rate has a minimal impact on the simulation outcomes. In this chapter, the final HJC constitutive parameters are determined using , as detailed in Table 4.

Table 4.
HJC constitutive parameters of reservoir rock.
In order to cause cracks caused by removal of elements when modeling with LS-DYNA finite element software, in addition to defining the rock constitutive model with failure mode, cracks caused by failure of rock materials after blasting can be controlled by adding the *MAT_ADD_EROSION option.
Given that the tangential tensile stress induced by the propagation of the detonation wave into the fracture zone exceeds the dynamic tensile strength of the rock, the rock within this zone experiences tensile failure due to the stress wave. Therefore, to control the fracture propagation following the tensile failure calculation, the minimum hydrostatic pressure failure criterion is established. This criterion can be derived from Equation (27), yielding a result of −8.195 MPa.
Furthermore, shear failure is inevitable when rock is subjected to compression failure. Therefore, the maximum shear strain failure criterion (EPSSH = 500 MPa) has been incorporated into the numerical simulation.
3.2.2. Explosive Material Model and State Equation
The positive oxygen balance explosive selected in this study was 5-nitro-3-trinitromethy-1H-1,2,4-triazole (NTNMT), the zero oxygen balance explosive was glycol dinitrate (DEGDN), and the negative oxygen balance explosive was trinitrotoluene (TNT). These three distinct oxygen balance (OB) explosives are CHON explosives with a density exceeding 1000 kg/m3. According to Shen et al. [44], an algorithm was developed to determine the parameters of the Jones–Wilkins–Lee (JWL) equation of state for detonation products of CHON explosives. We implemented that the corresponding code be developed utilizing this algorithm (see Supplementary Material S1). The JWL equation of state parameters for explosive detonation products were directly determined using the explosive’s density and detonation velocity, with the parameter values presented in Table 5 and Table 6.

Table 5.
HIGH_EXPLOSIVE_BURN parameters.

Table 6.
Dynamite JWL equation of state parameters.
3.3. Blasting Damage Simulation Process
The circumferential stress distribution within the reservoir prior to blasting can be determined through static analysis. As illustrated in Figure 5, ten monitoring points (A through J) are sequentially arranged along the x-axis of the borehole to evaluate effective stress and analyze the stress distribution on both sides of the borehole as well as its variation with respect to the borehole. To comprehensively capture the monitoring results, the points are strategically positioned as follows: Point A is located at the leftmost position on the central axis of the borehole; Point B is placed at the midpoint on the left side of the central axis; Point C is situated 4 times the borehole radius from the central axis on the left side; Point D is positioned 2 times the borehole radius from the central axis on the left side; Point E marks the starting point on the left side of the central axis. On the right side of the central axis, Point F is placed at the starting position; Point G is located 2 times the borehole radius from the central axis; Point H is situated 4 times the borehole radius from the central axis; Point I is placed at the midpoint on the right side of the central axis; and Point J is positioned at the far-right end of the central axis.

Figure 5.
Schematic diagram of measuring point locations (Unit: cm). A–J indicates the monitoring points.
Based on the position of the measurement point illustrated in Figure 5, the theta-stress curve at this point is extracted as shown in Figure 6, where negative values denote compressive stress. It is observed that during the static analysis under in-situ stress conditions, the formation pressure at the measurement point increases over time and eventually stabilizes. By examining the stress change curve at the stabilization point, it becomes evident that the theta compressive stress at equidistant points is largely consistent, with higher pressures closer to the borehole. This phenomenon is attributed to the stress concentration around the borehole, which diminishes with increasing distance from the borehole, while the far end remains unaffected by the perforation.
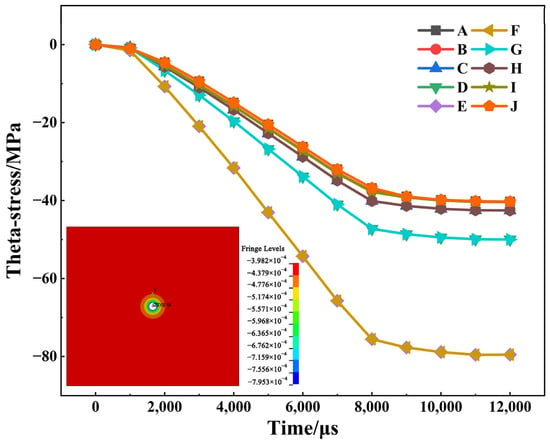
Figure 6.
Theta-stress distribution curves at various radial distances for each measurement point. A–J indicates the monitoring points.
To analyze the stress state of the reservoir region post-blasting, measurement points were strategically selected based on Figure 5 for dynamic blasting analysis. Figure 7 illustrates the temporal variation curves of Y-stress and effective stress at each measurement point following explosive detonation. As shown in the Figure 7, during the initial 0~800 μs, the shock wave generated by the explosion impacts the reservoir rock, causing it to fracture and leading to a sudden increase in effective stress. Under the influence of theta-stress, the initial stress values vary among different measurement points, with Y-stress values aligning with those under static loading conditions (Figure 6). The response time of each measurement point to the explosive stress wave increases proportionally with its distance from the blast source. For instance, measurement points E and F, located near the borehole, respond to the stress wave earlier than points A and J, which are situated at the farthest end of the borehole. Initially, all measurement points experience compressive stress, but over time, the stress state transitions to tensile stress. According to the dynamic tensile characteristics of the reservoir rock, if the peak tensile stress remains below the dynamic tensile strength of the rock, the reservoir rock will remain intact; otherwise, cracks or even fractures may develop within a certain range.
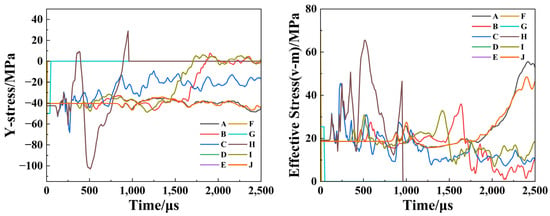
Figure 7.
Stress–time history curve. A–J indicates the monitoring points.
Compared to Y-stress and effective stress, the vibration velocity at the measuring points provides a more direct representation of the dynamic response of reservoir rock during blasting analysis. As illustrated in Figure 8, immediately following explosive initiation, each measuring point initially moves away from the explosion source. The D-G measuring point is sequentially damaged by the explosion stress wave, resulting in values dropping to zero. For other measuring points at equivalent distances from the blast hole, the waveform curves exhibit similar patterns, showing an oscillatory trend with sequential wave peaks. The amplitude decreases as the distance between the measuring points and the blast source increases, which clearly demonstrates the symmetric propagation of the explosion stress wave and aligns with the observed attenuation of vibration velocity caused by these waves.
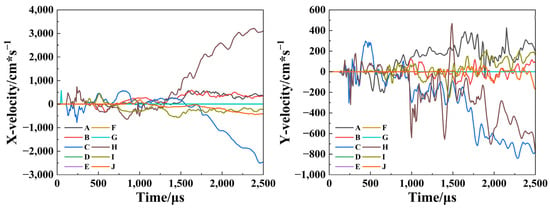
Figure 8.
Vibration velocity time history curve. A–J indicates the monitoring points.
The damage and fracture development of rock mass are the consequence of the synergistic effects of compressive stress, tensile stress, and explosive gases on reservoir rock during blasting operations. In the crushing zone, the predominant form of rock mass damage is attributed to compressive stress, whereas in the circumferential fracture zone, tensile stress plays a dominant role. As illustrated in Figure 9, the initiation, propagation, and coalescence of fractures induced by the explosive, along with the propagation of the explosion-induced stress wave through the fractured rock at various time intervals, are depicted.
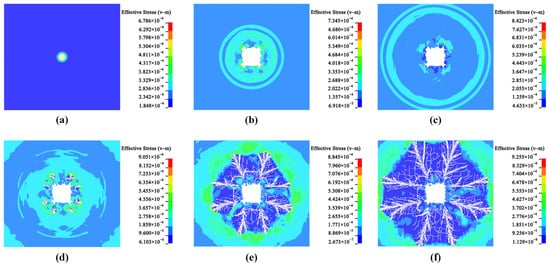
Figure 9.
Dynamic expansion of reservoir rock fractures with time. (a) t = 9.9229 μs, (b) t = 459.68 μs, (c) t = 819.81 μs, (d) t = 1219.9 μs, (e) t = 1989.3 μs, and (f) t = 2500.6 μs.
At t = 9.9229 μs (Figure 9a), immediately following explosive initiation, the generated shock wave directly impacted the borehole wall, causing localized compressive damage to the surrounding rock. Subsequently, the combined effects of compression and shear stresses led to the formation of a crush zone adjacent to the borehole wall, where the strain exceeded the predefined threshold. By t = 459.68 μs (Figure 9b), the crush zone was fully developed. At this stage, the initial shock wave had attenuated into a stress wave that continued to propagate forward. Although the stress wave’s intensity remained below the rock’s compressive strength, insufficient to cause further crushing, it induced tensile stresses that initiated radial cracking outside the crush zone, marking the onset of the crack zone. At t = 819.81 μs (Figure 9c), the crush zone ceased expanding while the main fractures began to propagate. Notably, fracture propagation lagged behind the stress wave, which had already reached the non-reflective boundary. By t = 1219.9 μs (Figure 9d), fractures around the borehole continued to extend independently, with secondary branching fractures developing within the main fracture network. At t = 1989.3 μs (Figure 9e), most cracks between blast holes coalesced, with only a few continuing to spread in irregular directions without merging. As the explosion-induced stress waves propagated, the cracks in the rock gradually extended. Finally, at t = 2500.6 μs (Figure 9f), the fractures had fully developed throughout the model, reaching their final configuration.
Through the analysis of the dynamic expansion process of the aforementioned cracks, it is evident that upon detonation of the explosive, the resultant shock wave exerts a direct force on the walls of the borehole. Due to the immense impact pressure, the reservoir rock surrounding the borehole wall undergoes immediate compressive damage and instantaneous fragmentation. The shock wave generated by the explosion progressively attenuates into a stress wave, propagating through the reservoir rock. Within a limited radius around the borehole wall, the reservoir rock experiences both compressive and shear forces, leading to gradual fragmentation. The explosion-induced stress wave propagates spherically within the model, with energy dissipation causing a gradual decrease in wave intensity during propagation. However, the induced tensile stress can generate radial cracks beyond the crushed zone, thereby continuously expanding the fracture zone.
3.4. Simulation of Different OB Explosives Explosion
During the process of explosive fracturing, the formation stress induced by fractures significantly increases. This is attributed to the substantial energy released by the explosion, which subjects the formation rocks to intense impact and compression, leading to the redistribution and escalation of formation stress. Additionally, pore pressure undergoes considerable alteration. The explosive fracturing disrupts the original structure of the formation rock, creating new fractures and pores that serve as migration pathways for fluids (such as oil, gas, and water), thereby modifying the original pore pressure distribution. Moreover, an excessive amount of explosives can lead to the generation of new fractures, potentially causing microseismic events. This occurs because crack expansion and formation deformation during explosive fracturing induce friction and shear sliding between rock layers, which may result in minor seismic activity when this sliding reaches a critical level. Although these microseismic events are of small magnitude, they can influence formation stability and well integrity.
When selecting explosives, a comprehensive evaluation must be conducted based on the specific blasting objectives, geological conditions, and safety requirements. To accurately assess the dynamic response of reservoir rocks under explosive loading, simulations of blasting damage using different types of OB explosives are performed under identical charging radii while maintaining consistent boundary conditions and constraints. The explosion effects, energy release, and damage distribution to the reservoir rocks are then analyzed.
The distribution of rock damage caused by different OB explosives at charge radii of 8 cm, 7 cm, and 6 cm is illustrated in Figure 10. As shown in the figure, both the type of explosive and the charge radius have a direct impact on the reservoir damage zone, resulting in variations in the size and shape of the formed crushing and fracture zones. As the charge radius decreases, the number of cracks and the extent of crack propagation gradually diminish. Under varying charge radii, the damage area of NTNMT can extend throughout the entire reservoir rock, forming multiple main fractures interspersed with branch fractures and micro-fractures. The fracture coverage exceeds 18.2%. Notably, when the charge radius is 7 cm, the fracture coverage reaches its peak at 18.8%. In contrast, the damage areas caused by DEGDN and TNT exhibit greater activity in the horizontal direction compared to the vertical direction. Except for a charge radius of 6 cm, where only crushing zones are observed within the reservoir, the crack percentage for DEGDN and TNT exceeds 10% under other charge radii. The volume of the void formed post-explosion varies depending on both the explosive type and charge radius. For a given explosive type, the cavity volume decreases as the charge radius decreases. When the charge radius is constant, NTNMT produces the largest cavity volume, while DEGDN yields the smallest, with a maximum difference of 0.62%.
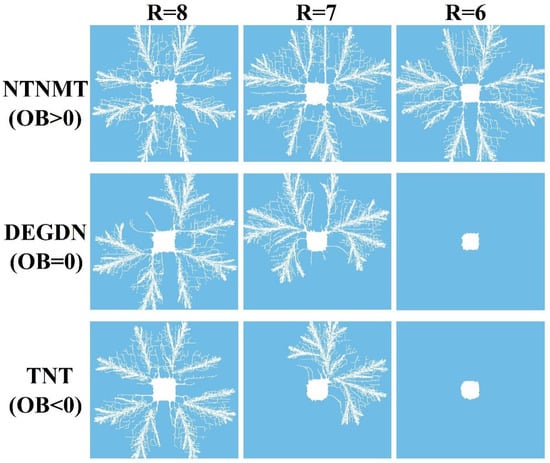
Figure 10.
Reservoir damage zones under varied explosive types and charge radii.
Following explosive initiation, the energy released by the explosion propagates through the reservoir rocks in the form of kinetic and internal energy [45], as illustrated in Figure 11. The kinetic and internal energies generated vary with different charging radii and types of OB explosives. During the stress wave impact phase, the kinetic energy rapidly increases to a peak pressure before quickly decreasing and transitioning to a secondary peak value. Compared to the first peak, the second peak attenuates by approximately 23–37%, eventually stabilizing. As the charge radius increases, a higher kinetic energy peak will be generated. The initial internal energy is derived from the explosive itself, which is rapidly released upon detonation and subsequently reduced to its minimum value. However, due to the energy impact from the explosion, the reservoir rocks absorb and store this internal energy through deformation and compression, leading to an increase and reaching a peak value. As the explosive energy gradually dissipates and further changes occur in the reservoir rocks, the internal energy begins to decrease progressively. When the reservoir rocks stabilize, the internal energy also approaches a certain value. In conjunction with the dynamic expansion of reservoir rock fractures (Figure 9), it can be observed that when the first kinetic energy peak occurs, the reservoir crushing zone starts to form, and the internal energy curve rapidly decreases to its minimum point. Upon reaching the second kinetic energy peak, the reservoir crushing zone, or cavity volume, is largely formed, and the fracture zone begins to expand, with internal energy decreasing during fracture formation. Considering the reservoir damage zones under varied explosive types and charge radii (Figure 10), the formation of cavity volume in the damaged region requires a greater expenditure of kinetic energy, whereas the development of the fracture zone is contingent upon the dissipation of internal energy. Compared with the zero oxygen balanced explosive DEGDN and the negative oxygen balanced explosive TNT, NTNMT, a positive oxygen balanced explosive, demonstrated superior performance in effectively transferring explosive energy to the reservoir rock during the blasting process, given the same charge radius. This resulted in more extensive transformation of the reservoir rock and the formation of denser fracture networks.
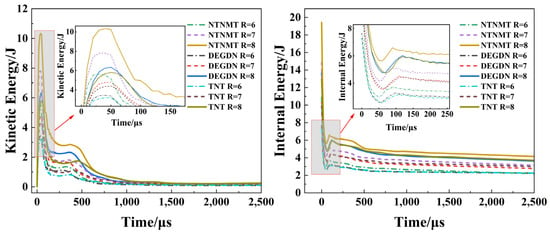
Figure 11.
Temporal evolution curves of kinetic energy and internal energy within reservoir rock.
To further investigate the impact of different OB explosives on reservoir rocks, the charge weight of NTNMT with a charge radius of 6 m is selected as the reference explosive quantity. The damage distribution caused by various OB explosives on reservoir rocks under identical mass conditions is evaluated. As illustrated in Figure 12, all explosives generate fragmentation effects and induce cracks to varying degrees. Notably, NTNMT, exhibits the smallest cavity volume and the most extensive crack propagation.
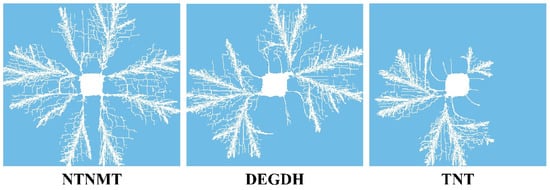
Figure 12.
Reservoir damage zones resulting from various OB explosives of identical mass.
For a more comprehensive analysis, six measurement points labeled A, B, C, D, E, and F were sequentially arranged along the x-axis of the blast hole to investigate the pressure distribution and its temporal evolution for different types of OB explosives with identical mass, as illustrated in Figure 13. To minimize the impact of the crushing zone on the monitoring results, point A was positioned at the leftmost location on the central axis of the blast hole, point B at the midpoint on the left side of the central axis, point C at a distance four times the radius of the blast hole from the central axis on the left side, and points D, E, and F correspondingly on the right side of the blast hole relative to points A, B, and C.

Figure 13.
Layout diagram of measurement points for various OB explosives with identical mass (Unit: cm). A–F indicates the monitoring points.
Based on the location of the measuring points illustrated in Figure 13, the pressure curves for these points were extracted as shown in Figure 14. The pressure curves indicate that after detonation, the stress wave propagates rapidly through the reservoir rock, with peak pressures appearing sequentially at each measuring point. Under identical hole distances, different measuring points exhibit similar simulation curves. Initially, the pressure at each measuring point rises sharply, reaching a peak before gradually decreasing through oscillations and eventually stabilizing. This behavior clearly demonstrates the symmetric propagation of the explosion-induced stress wave. However, as the distance from the measuring point to the blast hole increases, the time to reach peak pressure also increases, while the peak pressure value decreases. This phenomenon is an inevitable consequence of the attenuation of the stress wave during its propagation through the reservoir rock. Overall, the peak pressure of NTNMT remains consistently lower than that of DEGDN and TNT. While DEGDN and TNT exhibit comparable peak pressures, TNT shows a larger shock amplitude compared to DEGDN. Generally, when the shock wave and high-temperature, high-pressure gas generated by explosive detonation primarily affect the reservoir crushing zone, the cavity volume becomes excessively large, resulting in a relatively smaller fracture zone, which is detrimental to the flow and recovery of hydrocarbons. Conversely, if the charge radius is too small, although the cavity formed is smaller, the energy produced is insufficient to induce fractures in the reservoir rock, thereby failing to enhance oil recovery. Therefore, selecting appropriate explosive types and charge radii is crucial for effective formation transformation.

Figure 14.
Pressure curve. A–F indicates the monitoring points.
Among various OB explosives, the positive oxygen balance explosive NTNMT exhibits superior explosion performance, releasing a greater amount of explosive energy into the reservoir rocks and inducing more extensive damage distribution within these formations. Compared to TNT, which has a negative oxygen balance, the zero oxygen balance explosive DEGDN demonstrates a slightly better fragmentation effect, as evidenced by an increased number of cracks.
3.5. Degradation Reaction of Explosive in a Reservoir
By employing IRC path analysis in conjunction with DFT theory and the B3LYP/6-311++G(2d,p) basis set, and using reactants as a reference point, the energy changes at each station along the reaction pathway between various OB explosives and SiO2, the primary component of reservoir rock, directly elucidate the degradation mechanisms of these reactions. Through theoretical analysis, the environmental impact is also evaluated.
As illustrated in Figure 15, under the influence of SiO2, the C-NO2 bonds in NTNMT and the O-NO2 bonds in DEGDN exhibit a tendency to separate from each other and gradually break (with average bond distances of 1.46 Å and 1.44 Å, respectively [46,47]). Post-fracture, -NO2 groups tend to approach SiO2, although the bond distance remains insufficient for bonding (the average Si-O bond distance is 1.63 Å [48]), while other atomic spacing changes are minimal. According to the half-life formula, when the energy barrier for a bimolecular reaction is below 94.9768 kJ/mol, the degradation reaction between molecules becomes more likely. Compared to the zero-oxygen balanced explosive DEGDN, NTNMT, and TNT have lower energy barriers, suggesting that both reactions could occur based on energy barrier theory alone. However, given the lower energy barrier for NTNMT, it is more likely to react with reservoir rocks than TNT. This indicates that NTNMT poses a lesser risk of contaminating the reservoir.
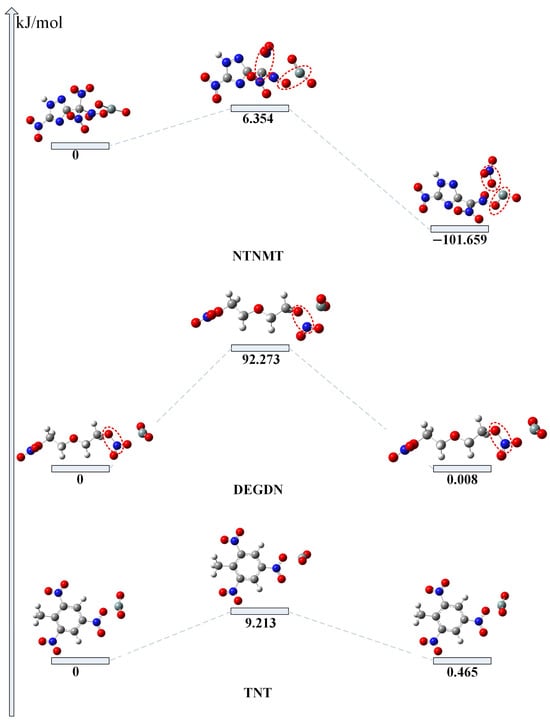
Figure 15.
Relative energy of various OB explosives in reaction with SiO2 (Unit: kJ/mol). The circles highlight the chemical bonds that have changed.
It is evident from the figure that the NTNMT reaction is exothermic. The DEGDN and TNT energy barrier tendency exhibit similarity, indicating symmetrical curves from the transition state to both the product and reactant. This symmetry arises because the structures of the reactant and product are similar, with the stable reactant transitioning through an unstable transition state before returning to a stable product.
Overall, NTNMT exhibits the lowest energy barrier among the compounds considered, making it the most reactive with reservoir rocks while causing minimal environmental impact. The negative heat of formation of NTNMT indicates that its degradation reaction is exothermic.
4. Conclusions
This study investigates energy attenuation, reservoir rock fracturing, and pressure variations through model testing. As fracture propagation increases under different oxygen balance explosives, both kinetic and internal energy in the reservoir rock decrease. Compared to zero oxygen balance explosive DEGDN and negative oxygen balance explosive TNT, the explosion of positive oxygen balance explosive NTNMT transfers a greater proportion of its energy to the reservoir rock, leading to a more effective damage distribution. When the charging radius is set to 7 cm, the crack percentage reaches its peak at 18.8%, thereby yielding optimal economic benefits. If the explosive energy is excessively high or the charge radius is improperly selected, the resulting shock waves and high-temperature, high-pressure gases can cause excessive impact on the rock near the borehole wall, forming an overly large crush zone. This not only consumes significant explosive energy but also results in a relatively smaller reservoir fracture zone, which is detrimental to hydrocarbon flow and recovery. For instance, the crack percentage of NTNMT at a charge radius of 8 cm is lower compared to that at a charge radius of 7 cm; however, the empty hole volume exhibits the opposite trend. Conversely, if the explosive energy is too low or the charge radius is insufficient, the generated energy may be inadequate to induce effective fracturing in the rock, if the charge radius is 6 cm, both DEGDN and TNT exhibit only crushing zones, thus failing to form a sufficient reservoir fracture zone and negatively impacting oilfield recovery. In addition, among the three OB explosives, NTNMT and TNT exhibit a higher propensity for degradation reactions with reservoir rocks compared to DEGDN. Notably, the degradation process of NTNMT is exothermic, suggesting that NTNMT poses less environmental contamination risk to the reservoir, and is therefore more suitable for the development of shale oil reservoirs.
Supplementary Materials
The following supporting information can be downloaded at: https://www.mdpi.com/article/10.3390/app15052612/s1, Supplementary Material S1: Calculation-code, static-analysis.k, dynamic-blast-analysis.k.
Author Contributions
J.L.: Writing—original draft, Investigation, Methodology, Data curation, Visualization, Conceptualization. R.T. and F.S.: Investigation. Y.X. and H.Y.: Formal analysis. W.Y.: Supervision. D.X.: Writing—review & editing, Funding acquisition, Methodology. All authors have read and agreed to the published version of the manuscript.
Funding
This research was funded by the Natural Science Foundation of Xinjiang Uygur Autonomous Region (Grant No. 2022D01A329) and the Provincial Science Foundation of Hubei (Grant No. 2022CFB634).
Institutional Review Board Statement
Not applicable.
Informed Consent Statement
Not applicable.
Data Availability Statement
The raw data supporting the conclusions of this article will be made available by the authors on request.
Acknowledgments
The authors would like to express their sincere gratitude for the support provided by the Natural Science Foundation of Xinjiang Uygur Autonomous Region (Grant No. 2022D01A329) and Provincial Science Foundation of Hubei (Grant No. 2022CFB634).
Conflicts of Interest
The authors declare no conflicts of interest. The funders had no role in the design of the study; in the collection, analyses, or interpretation of data; in the writing of the manuscript; or in the decision to publish the results.
Abbreviations
The following abbreviations are used in this manuscript:
| OB | Oxygen balance |
| LS-DYNA | Livermore software technology corporation’s dynamic analyzer |
| DFT | Density functional theory |
| HJC | Holmquist–Johnson–Cook |
| JWL | Jones–Wilkins–Lee |
| TSs | Transition states |
| IRC | Intrinsic reaction coordinate |
| RHT | Riedel–Hiermaier–Thoma |
| JH-2 | Johnson-Holmquist-2 |
| NTNMT | 5-nitro-3-trinitromethy-1H-1,2,4-triazole |
| DEGDN | Glycol dinitrate |
| TNT | Trinitrotoluene |
| CHON | Carbon, Hydrogen, Oxygen, Nitrogen |
References
- Hu, S.; Zhao, W.; Hou, L.; Yang, Z.; Zhu, R.; Wu, S.; Bai, B.; Jin, X. Development Potential and Technical Strategy of Continental Shale Oil in China. Pet. Explor. Dev. 2020, 47, 877–887. [Google Scholar] [CrossRef]
- Chen, S.; Wang, X.; Li, X.; Sui, J.; Yang, Y.; Yang, Q.; Li, Y.; Dai, C. Geophysical Prediction Technology for Sweet Spots of Continental Shale Oil: A Case Study of the Lianggaoshan Formation, Sichuan Basin, China. Fuel 2024, 365, 131146. [Google Scholar] [CrossRef]
- Wang, X.; Li, J.; Jiang, W.; Zhang, H.; Feng, Y.; Yang, Z. Characteristics, Current Exploration Practices, and Prospects of Continental Shale Oil in China. Adv. Geo-Energy Res. 2022, 6, 454–459. [Google Scholar] [CrossRef]
- Zhao, W.; Hu, S.; Hou, L.; Yang, T.; LI, X.; Guo, B.; Yang, Z. Types and Resource Potential of Continental Shale Oil in China and Its Boundary with Tight Oil. Pet. Explor. Dev. 2020, 47, 1–11. [Google Scholar] [CrossRef]
- Jiang, Z.; Zhang, W.; Liang, C.; Wang, Y.; Liu, H.; Chen, X. Basic Characteristics and Evaluation of Shale Oil Reservoirs. Pet. Res. 2016, 1, 149–163. [Google Scholar] [CrossRef]
- Montgomery, C.T.; Smith, M.B. Hydraulic Fracturing: History of an Enduring Technology. J. Pet. Technol. 2010, 62, 26–40. [Google Scholar] [CrossRef]
- IEA. Are We Entering a Golden Age of Gas. Spec. Rep. World Energy Outlook. 2011. Available online: https://www.iea.org/reports/weo-special-report-are-we-entering-a-golden-age (accessed on 15 January 2025).
- Estrada, J.M.; Bhamidimarri, R. A Review of the Issues and Treatment Options for Wastewater from Shale Gas Extraction by Hydraulic Fracturing. Fuel 2016, 182, 292–303. [Google Scholar] [CrossRef]
- Ellsworth, W.L. Injection-Induced Earthquakes. Science 2013, 341, 1225942. [Google Scholar] [CrossRef] [PubMed]
- Cooper, K.E.; Nisbet, E.C. Green Narratives. Sci. Commun. 2016, 38, 626–654. [Google Scholar] [CrossRef]
- Vasi, I.B.; Walker, E.T.; Johnson, J.S.; Tan, H.F. “No Fracking Way!” Documentary Film, Discursive Opportunity, and Local Opposition against Hydraulic Fracturing in the United States, 2010 to 2013. Am. Sociol. Rev. 2015, 80, 934–959. [Google Scholar] [CrossRef]
- Hand, E. Injection Wells Blamed in Oklahoma Earthquakes. Science 2014, 345, 13–14. [Google Scholar] [CrossRef]
- Guo, B.; Shan, J.; Feng, Y. Productivity of Blast-Fractured Wells in Liquid-Rich Shale Gas Formations. J. Nat. Gas Sci. Eng. 2014, 18, 360–367. [Google Scholar] [CrossRef]
- Sherwood, A.E. Explosive Stimulation of a Geothermal Steam Reservoir; Office of Scientific and Technical Information (OSTI): Oak Ridge, TN, USA, 1972.
- Grady, D.E.; Kipp, M.E.; Smith, C.S. Explosive Fracture Studies on Oil Shale. Soc. Pet. Eng. J. 1980, 20, 349–356. [Google Scholar] [CrossRef]
- Butkovich, T.R. Correlations between Measurements and Calculations of High-Explosive-Induced Fracture in a Coal Outcrop. Int. J. Rock Mech. Min. Sci. Geomech. Abstr. 1976, 13, 45–51. [Google Scholar] [CrossRef]
- Wang, J.; Guo, T.; Chen, M.; Qu, Z.; Liu, X.; Wang, X. Numerical Simulation of Deflagration Fracturing in Shale Gas Reservoirs Considering the Effect of Stress Wave Impact and Gas Drive. Int. J. Rock Mech. Min. Sci. 2023, 170, 105478. [Google Scholar] [CrossRef]
- Xu, P.; Cheng, Y.; Liu, X.; Zhang, X.; Shi, L. Explosive Fracturing Simulation Experiment for Low Permeability Reservoirs and Fractal Characteristics of Cracks Produced. Pet. Explor. Dev. 2013, 40, 682–686. [Google Scholar] [CrossRef]
- Trivino, L.F.; Mohanty, B. Assessment of Crack Initiation and Propagation in Rock from Explosion-Induced Stress Waves and Gas Expansion by Cross-Hole Seismometry and FEM–DEM Method. Int. J. Rock Mech. Min. Sci. 2015, 77, 287–299. [Google Scholar] [CrossRef]
- Nadirashvili, M.; Tsulukidze, G. Regulation of Oxygen Balance in the Process of Synthesis of Explosives. Defence Sci. 2023, 2, 29–34. [Google Scholar] [CrossRef]
- Hong, Z.; Tao, M.; Li, X.; Zhao, H.; Zhao, M. Experimental Study on the Influences of Charging Structure with Various Filling Mediums on Rock Blasting Performances. Powder Technol. 2023, 429, 118925. [Google Scholar] [CrossRef]
- Prabhu, S.; Qiu, T. Modeling of Sand Particle Crushing in Split Hopkinson Pressure Bar Tests Using the Discrete Element Method. Int. J. Impact Eng. 2021, 156, 103974. [Google Scholar] [CrossRef]
- Jenabidehkordi, A.; Fu, X.; Rabczuk, T. An Open Source Peridynamics Code for Dynamic Fracture in Homogeneous and Heterogeneous Materials. Adv. Eng. Softw. 2022, 168, 103124. [Google Scholar] [CrossRef]
- Zhuang, X.; Ren, H.; Rabczuk, T. Nonlocal Operator Method for Dynamic Brittle Fracture Based on an Explicit Phase Field Model. Eur. J. Mech. A/Solids 2021, 90, 104380. [Google Scholar] [CrossRef]
- Ren, H.; Zhuang, X.; Rabczuk, T. A Higher Order Nonlocal Operator Method for Solving Partial Differential Equations. Comput. Methods Appl. Mech. Eng. 2020, 367, 113132. [Google Scholar] [CrossRef]
- Riedel, W.; Thoma, K.; Hiermaier, S.; Schmolinske, E. Penetration Ofreinforced Concrete by BETA-B-500 Numerical Analysis Usinga New Macroscopic Concrete Model Forhydrocodes. In Proceedings of the 9th InternationalSymposium on the Effects of Munitions with Structures, Berlin-Strausberg, Germany, 3 May 1999; Volume 315. [Google Scholar]
- Wang, Z.; Wang, H.; Wang, J.; Tian, N. Finite Element Analyses of Constitutive Models Performance in the Simulation of Blast-Induced Rock Cracks. Comput. Geotech. 2021, 135, 104172. [Google Scholar] [CrossRef]
- Isayev, O.; Gorb, L.; Qasim, M.; Leszczynski, J. Ab Initio Molecular Dynamics Study on the Initial Chemical Events in Nitramines: Thermal Decomposition of CL-20. J. Phys. Chem. B 2008, 112, 11005–11013. [Google Scholar] [CrossRef] [PubMed]
- Wu, Q.; Chen, H.; Xiong, G.; Zhu, W.; Xiao, H. Decomposition of a 1,3,5-Triamino-2,4,6-Trinitrobenzene Crystal at Decomposition Temperature Coupled with Different Pressures: An Ab Initio Molecular Dynamics Study. J. Phys. Chem. C 2015, 119, 16500–16506. [Google Scholar] [CrossRef]
- Zhao, J.-J.; Zhang, Y.; Ranjith, P.G. Numerical Simulation of Blasting-Induced Fracture Expansion in Coal Masses. Int. J. Rock Mech. Min. 2017, 100, 28–39. [Google Scholar] [CrossRef]
- Zhou, J.; Wu, G.-A.; Geng, Y.-N.; Guo, Y.-T.; Chang, X.; Peng, C.-Y.; Ai, C.-Z. Laboratory Study of the Factors Affecting Hydraulic Fracturing Effect for Inter-Salt Oil Shale Layers, Qianjiang Depression, China. Petrol. Sci. 2023, 20, 1690–1706. [Google Scholar] [CrossRef]
- Du, Y.; Wei, J.; Liu, K.; Huang, D.; Lin, Q.; Yang, B. Research on Dynamic Constitutive Model of Ultra-High Performance Fiber-Reinforced Concrete. Constr. Build Mater. 2020, 234, 117386. [Google Scholar] [CrossRef]
- Li, M.; Ma, X.; Li, Z.; Jiang, Q.; Wu, S. Emerging Shale Oil Plays in Hypersaline Lacustrine Qianjiang Formation, Jianghan Basin, Central China. In Proceedings of the 6th Unconventional Resources Technology Conference, Houston, TX, USA, 23–25 July 2018; American Association of Petroleum Geologists: Tulsa, OK, USA, 2018. [Google Scholar]
- Xie, L.X.; Lu, W.B.; Zhang, Q.B.; Jiang, Q.H.; Chen, M.; Zhao, J. Analysis of Damage Mechanisms and Optimization of Cut Blasting Design under High In-Situ Stresses. Tunn. Undergr. Sp. Tech. 2017, 66, 19–33. [Google Scholar] [CrossRef]
- Dehghan Banadaki, M.M.; Mohanty, B. Numerical Simulation of Stress Wave Induced Fractures in Rock. Int. J. Impact Eng. 2012, 40–41, 16–25. [Google Scholar] [CrossRef]
- Chartagnac, P.F. Determination of Mean and Deviatoric Stresses in Shock Loaded Solids. J. Appl. Phys. 1982, 53, 948–953. [Google Scholar] [CrossRef]
- Deng, J.; Gu, D. On a Statistical Damage Constitutive Model for Rock Materials. Comput. Geosci. 2011, 37, 122–128. [Google Scholar] [CrossRef]
- Tian, X.; Tao, T.; Lou, Q.; Xie, C. Modification and Application of Limestone HJC Constitutive Model under the Impact Load. Lithosphere 2022, 2021, 6443087. [Google Scholar] [CrossRef]
- Meyers, M.A. Dynamic Behavior of Materials; John Wiley & Sons: Hoboken, NJ, USA, 1994. [Google Scholar]
- Drüppel, K.; Wirth, R. Metasomatic Replacement of Albite in Nature and Experiments. Minerals 2018, 8, 214. [Google Scholar] [CrossRef]
- LSTC. LS-DYNA Keywords User’s Manual(Version 971/Rev5); Livermore Software Technology Corporation: Livermore, CA, USA, 2010. [Google Scholar]
- Sun, Q.R.; Li, R.Y.; Zhao, Y.Y.; Sun, Y.X. Investigation on Parameters of HJC Model Applied to Simulate Perforation Experiments of Reinforced Concrete. Eng. Mech. 2016, 33, 248–256. [Google Scholar]
- Lin, C.; Xu, J.J.; Yang, J.W.; Zhang, H.L. The Failure Criterions and Parameters of HJC Model Based Perforation Simulation. J. Detect. Control 2017, 39, 100–105. [Google Scholar]
- Fei, S.; Wang, H.; Yuan, J.F. A Simple Algorithm for Determining the Parameters of JWL Equation of State. J. Vib. Shock 2014, 33, 107–110. [Google Scholar]
- Li, X.; Liu, K.; Sha, Y.; Yang, J.; Hong, Z. Experimental and Numerical Investigation on Rock Fracturing in Tunnel Contour Blasting under Initial Stress. Int. J. Impact Eng. 2024, 185, 104844. [Google Scholar] [CrossRef]
- Shao, J.; Cheng, X.; Yang, X. Calculations of the Bond Dissociation Energies for NO2 Scission in Some Nitro Compounds. Struct. Chem. 2005, 16, 457–460. [Google Scholar] [CrossRef]
- Zhang, C.; Huang, J.; Bu, R. Energetic Molecules and Energetic Single-Component Molecular Crystals. In Intrinsic Structures and Properties of Energetic Materials; Springer Nature: Singapore, 2023; pp. 115–156. [Google Scholar]
- Gibbs, G.V.; Hamil, M.M.; Louisnathan, S.J.; Bartell, L.S.; Yow, H. Correlations between Si-O Bond Length, Si-O-Si Angle and Bond Overlap Populations Calculated Using Extended Hükel Molecular Orbital Theory. Am. Mineral J. Earth Planet Mater. 1972, 57, 1578–1613. [Google Scholar]
Disclaimer/Publisher’s Note: The statements, opinions and data contained in all publications are solely those of the individual author(s) and contributor(s) and not of MDPI and/or the editor(s). MDPI and/or the editor(s) disclaim responsibility for any injury to people or property resulting from any ideas, methods, instructions or products referred to in the content. |
© 2025 by the authors. Licensee MDPI, Basel, Switzerland. This article is an open access article distributed under the terms and conditions of the Creative Commons Attribution (CC BY) license (https://creativecommons.org/licenses/by/4.0/).