Abstract
Astragalus mongholicus, an important medicinal plant species, exhibits low tolerance to high-salt environments, which restricts its growth in saline–alkaline areas. Understanding its salt-tolerance mechanisms is crucial for overcoming the technical challenges of industrialized cultivation in these regions. However, studies on the salt-tolerance mechanisms of Astragalus mongholicus are limited. This study examines two Astragalus mongholicus germplasms with distinct differences in salt tolerance (LQ: salt-tolerant, DT: salt-sensitive), and investigates their physiological adaptations and molecular mechanisms under salt stress (200 mmol/L NaCl) using an integrated analysis of morphology, physiology, metabolomics, and transcriptomics. Specifically, LQ showed smaller reductions in plant height, root length, root thickness, and fresh weight (29.0%, 5.0%, 2.8%, and 22.3%, respectively), compared to DT, which exhibited larger reductions (42.9%, 44.9%, 46.3%, and 41.4%, respectively). The results indicated that the salt-tolerant germplasm (LQ) enhanced antioxidant enzyme activities in response to salt stress, including SOD, POD, and CAT, and accumulating osmoregulatory substances. In LQ, the activities of SOD, POD, and CAT increased by 22.8%, 10.9%, and 8.8%, respectively, significantly higher than those of DT, which showed increases of 2.9%, 8.5%, and 1.4% in SOD, POD, and CAT activities, respectively. The contents of soluble sugar and protein in LQ increased by 2-fold and 16.9%, respectively, compared to 67.0% and 18.8% increases in DT. Additionally, the levels of MDA, H2O2, and OFR in LQ showed smaller increases (14.7%, 41.0%, and 13.6%, respectively), compared to the larger increases observed in DT (58.0%, 51.2%, and 18.6%), indicating a reduced level of oxidative damage in LQ and enhanced tolerance to salt stress. Combined transcriptomic and metabolomic analyses revealed that 3510 differentially expressed genes (DEGs) and 882 differentially expressed metabolites (DAMs) were identified in the leaves of salt-tolerant germplasm LQ under salt stress, whereas the sensitive germplasm DT had 1632 DEGs and 797 DAMs, respectively. Differential genes and metabolites were involved in metabolic pathways such as flavonoid biosynthesis, isoquinoline alkaloid synthesis, and phenylalanine metabolism. In particular, LQ alleviated salt stress damage and enhanced salt tolerance by increasing oxidase activities in its flavonoid and phenylalanine metabolic pathways and regulating the expression of key genes and enzymes. This study provides valuable insights and empirical data to support the selection of appropriate Astragalus mongholicus germplasms for saline regions and the development of improved cultivars.
1. Introduction
Soil salinization represents a severe abiotic stress and is one of the significant obstacles to plant growth []. More than 7% of the Earth’s land and 20% of irrigated land has already been affected by salinization globally [], and the affected area continues to expand. China possesses approximately 33 million hectares of saline soils, ranking as the third-largest globally []. The cause of soil salinization is attributed to the excessive accumulation of ions, particularly Na+ and Cl− []. Therefore, understanding crop responses to salt stress, especially NaCl stress, is critical for enhancing crop salt tolerance.
Salt stress in plants induces multiple forms of stress [,], including osmotic, ionic, oxidative, and nutrient imbalances, which leads to the accumulation of reactive oxygen species (ROS) that cause cellular damage []. To mitigate these effects, plants have developed both enzymatic and non-enzymatic antioxidant defense systems []. Enzymatic systems combat ROS by enhancing the activity of enzymes like superoxide dismutase (SOD), peroxidase (POD), and catalase (CAT) [], while non-enzymatic systems rely on antioxidants such as glutathione (GSH), phenolic compounds (PhOH), and flavonoids []. Flavonoids, in particular, play a crucial role in plant responses to salt stress by scavenging ROS and protecting cells from damage [,]. For instance, salt-tolerant soybean varieties, like FQ07, accumulate higher levels of flavonoids under salt stress, which helps mitigate oxidative damage and improves stress resistance []. Similarly, salt stress has been shown to influence the phenylpropanoid and flavonoid biosynthesis pathways in other crops such as cauliflower bean [], and in Lycium barbarum, flavonoids help alleviate ROS-induced damage, enhancing both salt tolerance and overall plant quality []. Thus, both enzymatic and non-enzymatic antioxidants are crucial for managing ROS accumulation, which is essential for maintaining healthy plant growth under stressful conditions [].
Astragalus membranaceus (Fisch.) Bge. var. mongholicus (Bge.) Hsiao is a perennial herb of the genus Astragalus in the family Leguminosae, widely utilized worldwide for its high medicinal value []. Inner Mongolia is a major producing area of A. mongholicus, but the predominance of saline soils in the region significantly restricted the development of the regional industry. Interestingly, saline soils, though generally unsuitable for plant growth, were conducive to the accumulation of medicinal components []. If saline-tolerant varieties meeting medicinal standards could be domesticated, this would address the technical bottlenecks limiting the Astragalus industry in Inner Mongolia. However, the salt tolerance mechanism of such species remained unexplored, necessitating molecular biology studies and other analytical methods. In recent years, combined metabolome and transcriptome analyses have been widely applied to investigate salt stress responses in crops such as cotton [], tamarisk [], and sorghum []. A. mongholicus exhibited some degree of salt tolerance under stress, but its underlying mechanisms required further exploration. This study employs two A. mongholicus germplasms with differing salt tolerance levels, based on the analysis of their morphological and physiological responses to salt stress. By identifying differential metabolites (DAMs) and differentially expressed genes (DEGs), this research aims to elucidate the key metabolic pathways involved in salt stress responses. The findings will not only enhance our understanding of the molecular mechanisms underlying salt tolerance in A. mongholicus but also provide a scientific foundation for its cultivation and industrial application in saline environments, addressing key challenges in the industry and facilitating the resolution of bottlenecks.
2. Materials and Methods
2.1. Plant Material and Salt Treatment
The seeds used in this study included Astragalus mongholicus NM-LQ (the most salt-tolerant germplasm, hereafter referred to as LQ) and Astragalus mongholicus NM-DT (the least salt-tolerant germplasm, hereafter referred to as DT), with their salt tolerance assessed in 2023. Details of the salt tolerance evaluation can be found in the Supplementary Materials [,]. These seeds were provided by the Research Laboratory of Medicinal Plants Breeding and Cultivation at Inner Mongolia Agricultural University.
The experiment took place in April 2024 within the solar greenhouse at Inner Mongolia Agricultural University, employing a potting method with soil cultivation. Two concentration levels were designated: 0 (CK, with no salt added) and 200 mmol/L NaCl (based on previous research from the research group [,,]), with three replicates for each treatment and 50 seeds allocated per replicate. Prior to sowing, the seeds underwent rubbing with fine sand and were soaked in distilled water for a duration of 24 h. The pots utilized were plastic, featuring drainage holes at the base, measuring 20 cm in height and 17 cm in inner diameter. Each pot was filled with a mixture of field soil and vermiculite in a 2:1 ratio, weighing 3.5 kg, and then evenly watered with distilled water before being placed in the greenhouse. Fifty seeds were planted in each pot, where they germinated at room temperature, receiving watering every two days. Sixty days post-seedling emergence, the soil substrate was irrigated three times in succession with either 0 or 200 mmol/L NaCl solution to sustain a steady salt concentration in the substrate. This treatment lasted for seven days following the irrigation, and daily supplementation of evaporated water was provided by adding 12 mL of distilled water. The materials were collected at the end of the treatment, immediately stored in liquid nitrogen, and various indices were measured separately.
2.2. Assessment of Physiological and Phenotypic Indices for Leaf Stress Resistance
Leaf samples (0.5 g) were collected and homogenized with 5 mL of phosphate-buffered saline (PBS) and quartz sand in a pre-chilled mortar. The homogenate was then centrifuged at 10,000 r/min for 15 min at 4 °C, and the supernatant was collected for enzyme assays. The activities of peroxidase (POD), superoxide dismutase (SOD), and catalase (CAT) were determined using the guaiacol-H2O2 reaction, nitroblue tetrazolium (NBT) assay, and H2O2 scavenging method, respectively. Oxygen free radical (OFR) content was measured using the hydroxylamine hydrochloride method.
To quantify hydrogen peroxide (H2O2), 2 g of leaf tissue was homogenized with 2 mL of cold acetone and quartz sand, and then centrifuged at 3000 r/min for 10 min at 4 °C. The supernatant was used to measure H2O2 content using the titanium sulfate colorimetric method. Proline (Pro) content was determined using the acid ninhydrin method, after boiling 0.5 g of leaf tissue with 5 mL of 3% sulfosalicylic acid for 10 min in a water bath.
Malondialdehyde (MDA) content was measured using the thiobarbituric acid (TBA) method. Briefly, 0.5 g of leaf sample was homogenized with 10 mL of 10% trichloroacetic acid and quartz sand, followed by centrifugation at 4000 r/min for 10 min. The MDA content was then determined by measuring absorbance at 532 nm.
Soluble sugar (SS) content was determined using the anthrone colorimetric method. Briefly, 0.1 g of leaf tissue was ground with 1 mL distilled water, then heated at 95 °C for 10 min. After cooling, the mixture was centrifuged at 8000× g for 10 min, and the supernatant was collected. The volume was adjusted with distilled water, and the solution was incubated at 95 °C for another 10 min. Absorbance at 620 nm was measured to determine soluble sugar content.
Soluble protein (SP) content was determined using the Coomassie Brilliant Blue G-250 method. Approximately 0.2 g of leaf tissue was ground with 8 mL distilled water, then centrifuged at 4000× g for 10 min. The supernatant was mixed with 5 mL Coomassie Brilliant Blue reagent, shaken, and left to stand for 2 min. Absorbance at 595 nm was measured to calculate the soluble protein content.
Plant height and root length were measured using a tape measure, root diameter was measured using a vernier caliper, and fresh weight was measured using a balance.
The experimental procedures for measuring SOD, POD, CAT, MDA, Pro, H2O2, and OFR, as well as for SS and SP determinations, followed the methods described by Liu et al. [] and Liu et al. [], respectively
2.3. RNA Extraction, cDNA Library Construction, and Transcriptome Sequencing
Total RNA was extracted from the leaves of A. mongholicus employing Trizol reagent, and the resulting RNA’s integrity and DNA contamination levels were evaluated through agarose gel electrophoresis. RNA concentration measurements were performed using a Qubit 4.0 fluorometer (Thermo Fisher Scientific, Waltham, MA, USA), while its integrity was additionally analyzed using an Qsep400 Bioanalyzer (BiOptic Inc., New Taipei City, Taiwan). The RNA samples that met quality criteria were dispatched to Wuhan Mavis Metabolism Biotechnology Co. (Wuhan, China) for subsequent processing.
The library was assembled utilizing the NEBNext® Ultra™ (New England Biolabs, Ipswich, MA, USA) RNA Library Prep Kit. Messenger RNA containing a polyA tail was enriched through Oligo (dT) beads and subsequently subjected to random fragmentation using NEB Fragmentation Buffer. The first strand of complementary DNA (cDNA) was generated via reverse transcription with random hexamer primers, employing the fragmented mRNA as a template, followed by the synthesis of the second strand using DNA polymerase I and deoxynucleotide triphosphates (dNTPs). The resulting double-stranded cDNA underwent end-repair, A-tailing, and ligation. Approximately 200 bp fragments were selected for PCR enrichment, culminating in the creation of the library. The library was quantified using both a Qubit 4.0 fluorometer (Thermo Fisher Scientific, Waltham, MA, USA) and qRT-PCR, pooled based on the desired data volume, and sequenced on the Illumina platform, producing downstream data. All sequencing reads were submitted to the National Center for Biotechnology Information.
2.4. Gene Annotation, Differential Expression Analysis, and Evaluation of Enrichment
The annotations of gene functions were derived from the Gene Ontology (GO) (http://www.geneontology.org/, accessed on 1 July 2022) and the Kyoto Encyclopedia of Genes and Genomes (KEGG) (http://www.genome.jp/kegg/, accessed on 30 June 2023) databases.
The Fastp v0.23.2 tool was utilized for filtering downstream data and producing clean reads. For the de novo assembly of clean reads, Trinity v2.13.2 software was employed using the paired-end approach, with the longest transcript designated as the unigene, while Corset v1.09 software eliminated redundant sequences to yield the final reference sequence. The bowtie2 v2.4.5 program was used to assess gene alignments, and the expression levels of genes or transcripts were quantified with FPKM. The analysis of differential expression between the two datasets was performed using DESeq2 v1.22.2, with p-values adjusted for multiple comparisons according to the Benjamini and Hochberg method.
Differentially expressed genes (DEGs) were filtered with the criteria of |log2Fold Change| ≥ 1 and FDR < 0.05. To explore gene expression patterns, hierarchical clustering analysis was performed on the DEGs. Enrichment analyses for GO and KEGG pathways related to DEGs were conducted using R software version 3.6.2 and methods based on hypergeometric distribution.
2.5. Metabolite Extraction
For preparing each sample, leaves from the salt-tolerant germplasm (LQ) and the salt-sensitive germplasm (DT) were selected after 7 days of treatment under 0 mmol/L (CK) and 200 mmol/L NaCl stress conditions, followed by the measurement of 100 mg of the resultant powdered sample. Next, 1000 μL of a pre-cooled mixture of methanol, acetonitrile, and water (in a ratio of 2:2:1, v/v/v) was introduced. The samples underwent sonication for a duration of 1 h while placed in an ice bath and were then incubated at −20 °C for an additional hour to promote protein precipitation. Following the incubation period, the samples were centrifuged at 16,000× g and 4 °C for 20 min to separate the supernatants, which were then dried using vacuum conditions. For the purpose of mass spectrometry analysis, 100 μL of an acetonitrile-to-water solution (1:1, v/v) was added to reconstitute the samples. The supernatant was collected through a centrifugation process at 14,000× g and 4 °C for 15 min. From each tube, a 150 μL aliquot of the supernatant was extracted using a crystal syringe, subsequently filtered through a 0.22 μm microporous filter, and placed into a liquid chromatography (LC) vial. The LC vials were maintained at −80 °C in preparation for liquid chromatography–mass spectrometry (LC-MS) analysis. Quality control (QC) samples were generated by combining equal volumes from all individual samples to formulate a singular mixed sample.
2.6. Preparation of Data and Statistical Evaluation
The data obtained from mass spectrometry were analyzed through the Analyst TF 1.7.1 Software (SCIEX, Concord, ON, Canada), ensuring precise qualitative and quantitative evaluations by correcting the chromatographic peaks identified for each metabolite across various samples. For multivariate statistical analysis of the metabolites, we employed orthogonal partial least squares discriminant analysis (OPLS-DA) alongside the variable importance in projection (VIP) scores, which were derived from the first principal component of the OPLS-DA model. To preliminarily identify variations in metabolite accumulation between the comparative groups, a two-criteria screening method using independent samples t-test was applied. In the analysis involving two groups, differential metabolites (DAMs) were determined based on VIP criteria (VIP ≥ 1) and fold-change thresholds (fold change ≥ 2 and fold change ≤ 0.5). Quasi-screening was utilized to identify differential metabolites among the groups, followed by functional annotations and pathway analysis of these metabolites through KEGG database enrichment analysis.
Statistical analysis was performed using Microsoft Excel 2010 (Microsoft, Inc., Redmond, WA, USA). For analysis, one-way analysis of variance (ANOVA) using SPSS v21 (IBM Inc., Armonk, NY, USA). Tukeys’ test was applied to compare the mean at p < 0.05. Figures were created using Origin 2024 (OriginLab Inc., Northampton, MA, USA).
2.7. Analysis of Quantitative Real-Time Polymerase Chain Reaction (qRT-PCR)
In order to assess the reliability of the differentially expressed genes (DEGs) obtained from sequencing, this experiment focused on five DEGs relevant to the pathways of flavonoid biosynthesis, phenylalanine biosynthesis, and isoquinoline biosynthesis. Table 1 contains a list of the specific primers employed, while the gene elongation factor 1-alpha (EF-1-alpha) was utilized as a reference internal control. The RNA underwent reverse transcription into complementary DNA (cDNA) utilizing the Evo M-MLV RT Mix Kit with gDNA Clean specifically for qPCR (Reverse Transcription Kit). The qRT-PCR procedures were conducted on an ABI9700 system via a dye-based approach. Details of the reaction system can be found in Appendix A Table A1. The procedure was executed under the following parameters: initially at 94 °C for 30 s; followed by 40 cycles of 94 °C lasting 5 s; and then 60 °C for 30 s. The temperature was gradually increased from 60 °C to 97 °C, during which fluorescence signals were captured five times per degree Celsius. Each sample underwent three replicates, with sterile water serving as the control. The relative gene expression results were calculated using the 2−∆∆Ct method.

Table 1.
qRT-PCR primer sequence information.
3. Results
3.1. Phenotypes
After 7 days of salt stress treatment, LQ-CK grew normally, while LQ-Treat showed obvious growth inhibition. DT-CK grew healthily, but DT-Treat showed significant wilting, indicating that the DT germplasm is less tolerant to salt stress (Figure 1).
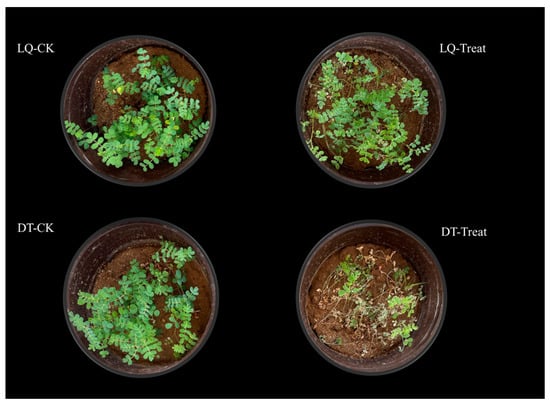
Figure 1.
Phenotypes of A. mongholicus leaves.
3.2. Physiological and Phenotype Analysis
The physiological and phenotypic analyses are presented in Figure 2. The results indicated that salt stress significantly influenced the antioxidant enzyme activities and osmoregulatory substance content in the two A. mongholicus varieties, with variations in the intensity of their responses. The H2O2 and OFR contents in ‘LQ’ increased by 41.0% and 13.6%, respectively, which were significantly lower than those in the ‘DT’ (51.2% and 18.6%) under salt stress. ‘LQ’ exhibited reduced accumulation of reactive oxygen species (ROS) under salt stress compared to ‘DT’, indicating a stronger ROS scavenging capacity, which mitigated oxidative stress-induced damage. Additionally, the activities of SOD, POD, and CAT in ‘LQ’ increased by 22.8%, 10.9%, and 8.8%, respectively, which were significantly higher than ‘DT’ (2.9%, 8.5%, and 1.4%). The soluble sugar and protein contents in both varieties significantly increased under salt stress, by 2-fold and 16.9% in ‘LQ’ and by 67.0% and 18.8% in the ‘DT’, respectively. Furthermore, salt stress induced the peroxidation of membrane lipids, causing cell membrane damage, with the MDA content in ‘LQ’ showing an increase of only 14.7%, significantly lower than the 58.0% increase observed in the ‘DT’.
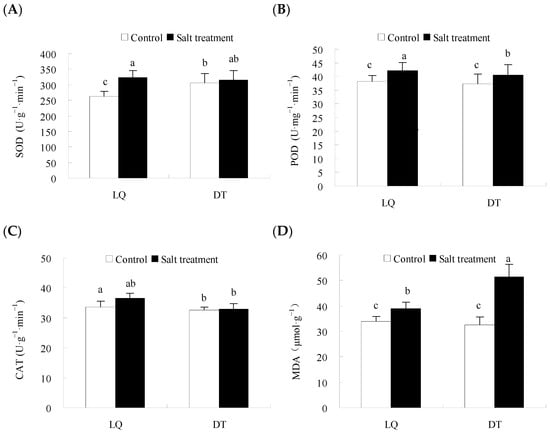
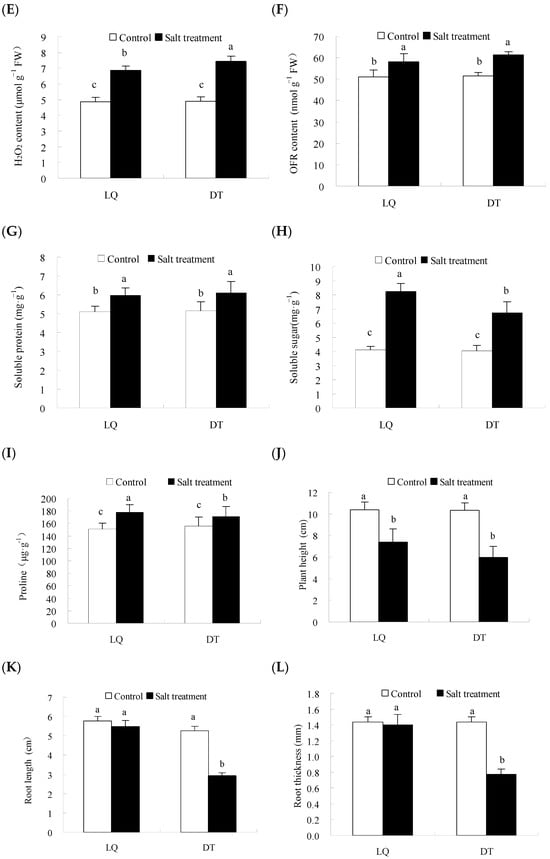
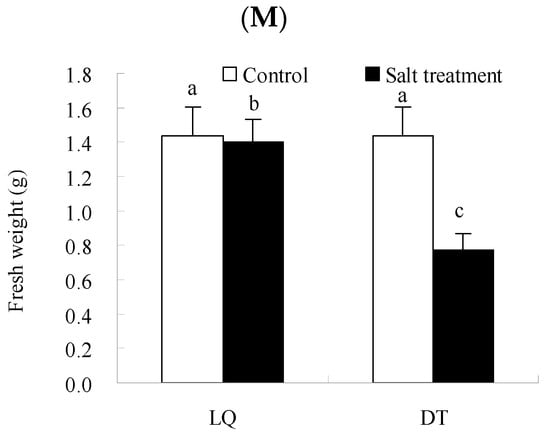
Figure 2.
Physiological and biochemical changes in ‘LQ’ and ‘DT’ A. mongholicus under salt stress. Note: (A) SOD, (B) POD, (C) CAT, (D) MDA, (E) H2O2, (F) OFR, (G) Soluble protein, (H) Soluble sugar, (I) Proline, (J) Plant height, (K) Root length, (L) Root thickness, and (M) Fresh weight. SOD: superoxide dismutase; POD: peroxidase; CAT: catalase; MDA: malondialdehyde; H2O2: hydrogen peroxide; OFR: oxidized free radicals; different lower-case letters in the graphs indicate significant differences (p < 0.05).
In terms of morphological indicators, the results indicated that salt stress significantly influenced plant height, root length, root thickness, and fresh weight in the two A. mongholicus germplasms. In LQ, plant height decreased by 29.0%, whereas DT showed a larger reduction of 42.9%. Root length in LQ decreased by 5.0%, compared to a 44.9% reduction in DT. Root thickness in LQ showed a slight decrease of 2.8%, while DT experienced a more significant decrease of 46.3%. Fresh weight decreased by 22.3% in LQ and 41.4% in DT, indicating that LQ demonstrated better resilience to salt stress.
3.3. Effect of Salt Stress on the Transcriptome of A. mongholicus Leaves
3.3.1. Transcriptome Sequencing Analysis
Transcriptome sequencing of four biological replicates of leaf samples subjected to the treatments DT-CK, DT-Treat, LQ-CK, and LQ-Treat was conducted. The twelve samples generated a total of 80.63 Gb of clean data, with each sample yielding at least 6 Gb. The GC content of all samples exceeded 42%, and the percentage of Q30 bases was at least 94%, indicating high-quality bases suitable for subsequent research.
Using the screening criteria for DEGs (|log2Fold Change| ≥ 1 and FDR < 0.05), this study identified 3237 downregulated and 3363 upregulated genes in DT-Treat_vs_DT-CK, as well as 5693 downregulated and 3562 upregulated genes in LQ-Treat_vs_LQ-CK. Comparison of the differentially expressed genes in DT-Treat_vs_DT-CK and LQ-Treat_vs_LQ-CK revealed that more genes were upregulated in the LQ, suggesting that ‘LQ’ exhibited a stronger response to salt stress. Among the differentially expressed genes analyzed across subgroups, 166 genes were shared in all combinations. ‘LQ’ exhibited 3510 unique differentially expressed genes after salt stress treatment, whereas ‘DT’ exhibited 1632. Additionally, 2515 differentially expressed genes were identified between ‘LQ’ and ‘DT’ under salt stress conditions. Future analyses will focus on these three categories of genes (Figure 3).
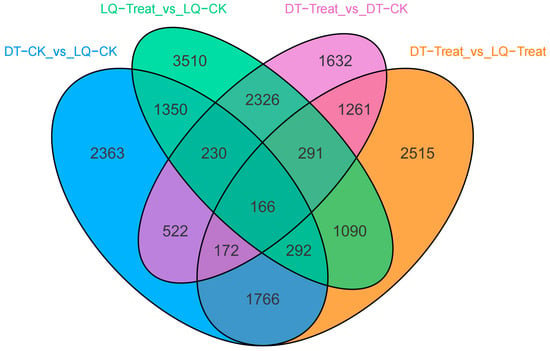
Figure 3.
Venn diagram showing differentially expressed genes.
3.3.2. GO and KEGG Enrichment of DEGs
In the GO functional analysis of all comparison groups (screening conditions: FDR < 0.05 and |log2(Fold Change)| > 1), the differential gene enrichment was as follows: in the DT-Treat_vs_DT-CK group, 6600 differential genes were identified, and 42 GO terms were significantly enriched, including 22, 2, and 18 terms enriched in the BP, CC, and MF categories, respectively. Biological processes were primarily associated with cellular processes, metabolic pathways, and stress responses. Protein complexes and cellular anatomical structures were significantly enriched within cellular components, whereas molecular functions were primarily related to binding and catalytic activities (Figure 4A).
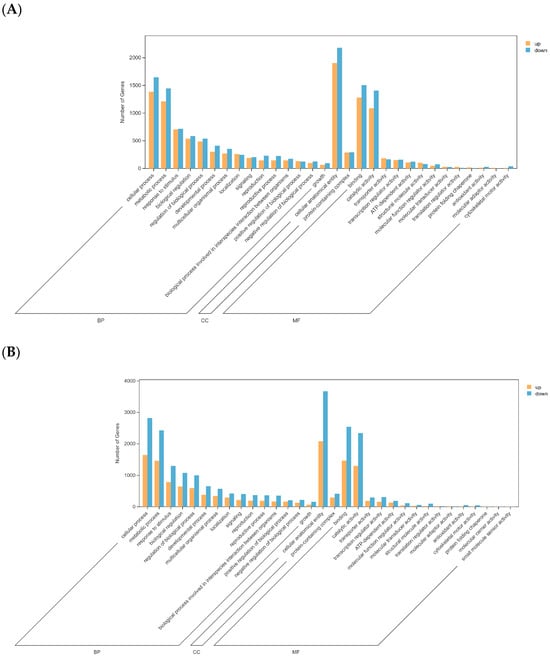
Figure 4.
GO enrichment histogram. Note: (A) DT-Treat_vs_DT-CK and (B) LQ-Treat_vs_LQ-CK.
In the LQ-Treat_vs_LQ-CK group, 9255 differential genes were identified, and 44 GO terms were significantly enriched, including 22, 2, and 20 terms enriched in the BP, CC, and MF categories, respectively. Biological processes were significantly enriched in cellular processes, metabolic pathways, and stress responses. Protein complexes and cellular anatomical structures were the primary enriched cellular components, whereas molecular functions were primarily related to binding and catalyzing activities (Figure 4B).
In the KEGG pathway annotation, the DT-Treat_vs_DT-CK group showed 5891 out of 6600 differential genes annotated to 143 pathways, with significant enrichment in pathways such as metabolic pathways (ko01100, 1134 genes), biosynthesis of secondary metabolites (ko01110, 688 genes), and starch and sucrose metabolism (ko00500, 123 genes), along with phytohormone signaling (ko04075, 139 genes) and motor protein pathways (ko04814, 87 genes) (Figure 5A).
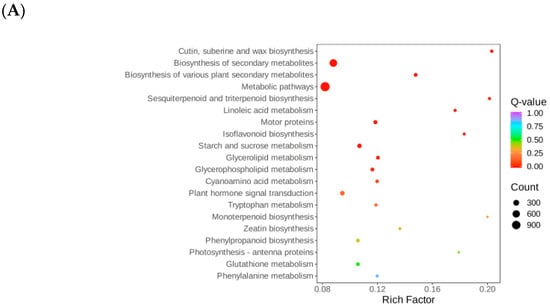
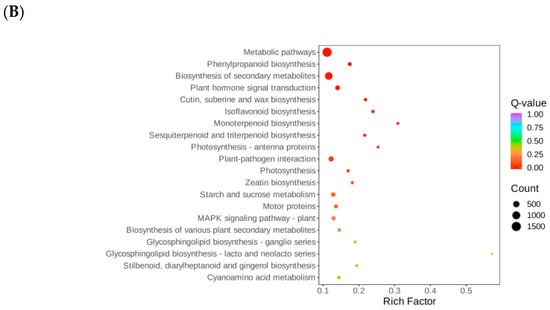
Figure 5.
KEGG enrichment bubble map. Note: (A) DT-Treat_vs_DT-CK and (B) LQ-Treat_vs_LQ-CK.
In the LQ-Treat_vs_LQ-CK group, 7887 out of 9255 differential genes were annotated to 141 pathways, with significant enrichment in pathways such as metabolic pathways (ko01100, 1541 genes), biosynthesis of secondary metabolites (ko01110, 907 genes), and starch and sucrose metabolism (ko00500, 148 genes), along with plant hormone signaling (ko04075, 207 genes) and the MAPK signaling pathway (ko04016, 130 genes), among others (Figure 5B).
3.3.3. Quantitative Real-Time PCR Analysis
To assess the reliability and stability of the RNA sequencing (RNA-seq) data for DEGs, six DEGs were chosen for qRT-PCR validation. The expression profiles of these genes were found to be largely consistent with the fragments per kilobase of transcript per million mapped reads (FPKMs) values derived from the RNA-seq data, thereby confirming the reliability of the transcriptome results (Figure 6).
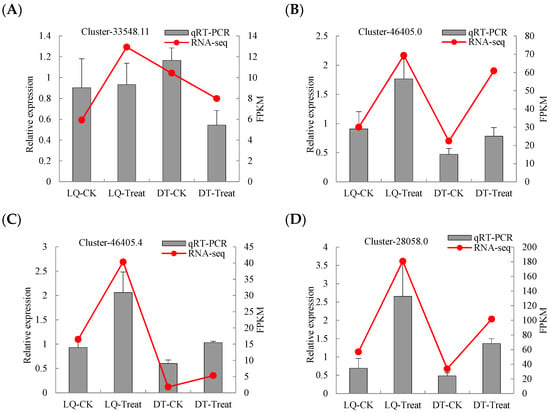
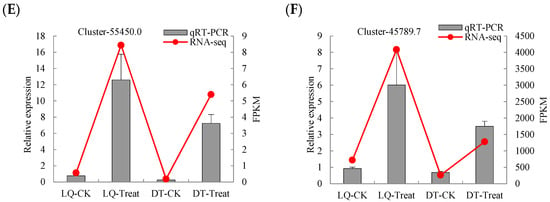
Figure 6.
qRT-PCR verification of six genes. The relative gene expression (qRT-PCR) and FPKM values for the genes (A) Cluster-33548.11, (B) Cluster-46405.0, (C) Cluster-46405.4, (D) Cluster-28058.0, (E) Cluster-55450.0, and (F) Cluster-45789.7 are compared under different treatments.
3.4. Effects of Salt Stress on the Metabolome of A. mongholicus Leaves
3.4.1. Metabolomic Analysis
The principal component analysis (PCA) model plot was generated from the PCA of the samples (including QC samples), with QC samples tightly clustered, demonstrating the stability of the instrument during the experiment (Figure 7).
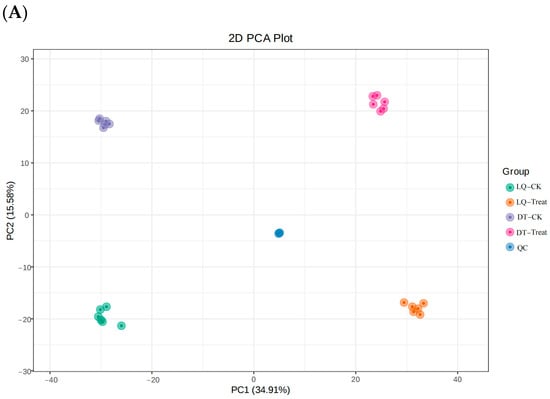
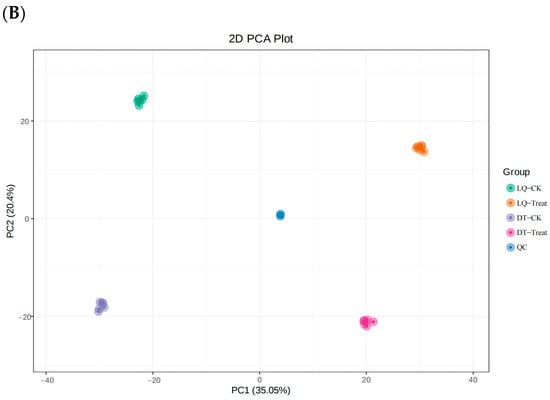
Figure 7.
Plot of PCA scores for all samples. Note: (A) Positive ion mode and (B) negative ion mode.
As illustrated in Figure 8, the OPLS-DA model effectively distinguished paired samples between the two comparison groups. The experimentally constructed OPLS-DA model exhibited R2Y and Q2 values close to 1, demonstrating its stability and reliability. These findings indicate that salt stress significantly influenced the leaf metabolism of A. mongholicus.
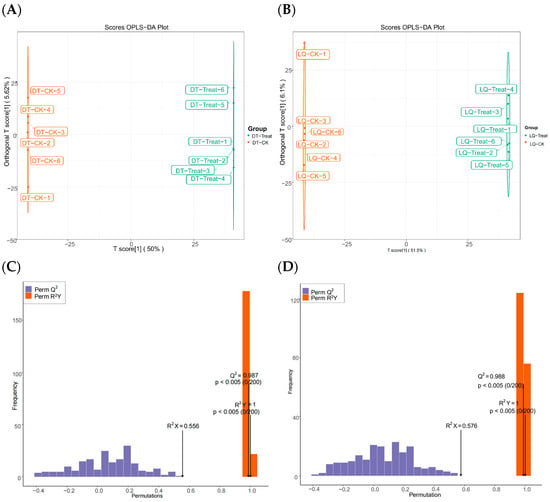
Figure 8.
Metabolite OPLS-DA scores and model validation plots between different comparison groups. Note: (A,C) are OPLS-DA scores of metabolites between DT-Treat_vs_DT-CK and LQ-Treat_vs_LQ-CK groups, respectively; (B,D) are metabolite model validation plots between DT-Treat_vs_DT-CK and LQ-Treat_vs_LQ-CK groups, respectively.
Differential metabolite screening was performed using the OPLS-DA results from the variable importance projections of the multivariate OPLS-DA model, along with the p values and fold changes from univariate analyses, based on the following criteria: fold change ≥ 1, VIP ≥ 1, and p value < 0.05. The DT-Treat_vs_DT-CK group identified 365 upregulated and 432 downregulated metabolites (Figure 9A), while the LQ-Treat_vs_LQ-CK group identified 447 upregulated and 435 downregulated metabolites (Figure 9B). A considerable number of metabolites were upregulated in the LQ salt-tolerant group, emphasizing their critical role in salt stress resistance.
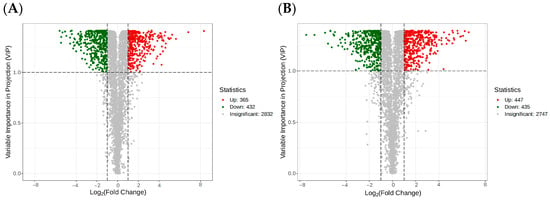
Figure 9.
Volcano plot of differential metabolites between different comparison groups. Note: (A) DT-Treat_vs_DT-CK and (B) LQ-Treat_vs_LQ-CK. The dotted line represents the selection criteria: metabolites with fold change ≥ 2 and fold change ≤ 0.5. Each point in the volcano plot represents a metabolite, with green points indicating downregulated differential metabolites, red points indicating upregulated differential metabolites, and gray points representing metabolites that were detected but not significantly different.
The differential metabolites primarily included amino acids and derivatives, benzene and substituted derivatives, alkaloids, phenolic acids, organic acids, saccharides, ketone compounds, flavones, and amines.
The clustering heat map analysis of differential metabolites from the two comparative groups revealed that the intergroup samples were distinctly segregated into two distinct clusters. The clustering of differential metabolites revealed distinct variation patterns among the samples, indicating that the differential metabolites of the two varieties of A. mongholicus were substantially altered following salt stress (Figure 10).
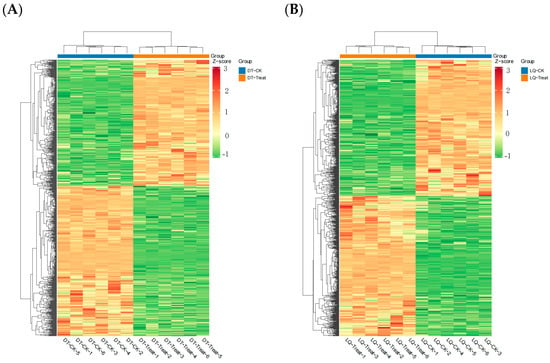
Figure 10.
Heat map of differential metabolites between different comparison groups. Note: (A) DT-Treat_vs_DT-CK and (B) LQ-Treat_vs_LQ-CK.
3.4.2. KEGG Enrichment of DAMs
As shown in Figure 11A, metabolic pathways (72 species, 78.26%), biosynthesis of secondary metabolites (40 species, 43.48%), biosynthesis of amino acids (15 species, 16.3%), biosynthesis of cofactors (13 species, 14.13%), carbon metabolism (13 species, 14.13%), and 2-oxocarboxylic acid metabolism (10 species, 10.87%) were followed by environmental information processing pathways, including ABC transporters (7 species, 7.61%). Finally, genetic information processing pathways, such as aminoacyl-tRNA biosynthesis (3 species, 3.26%), and cellular processing pathways, such as endocytosis (1 species, 1.09%), were identified.
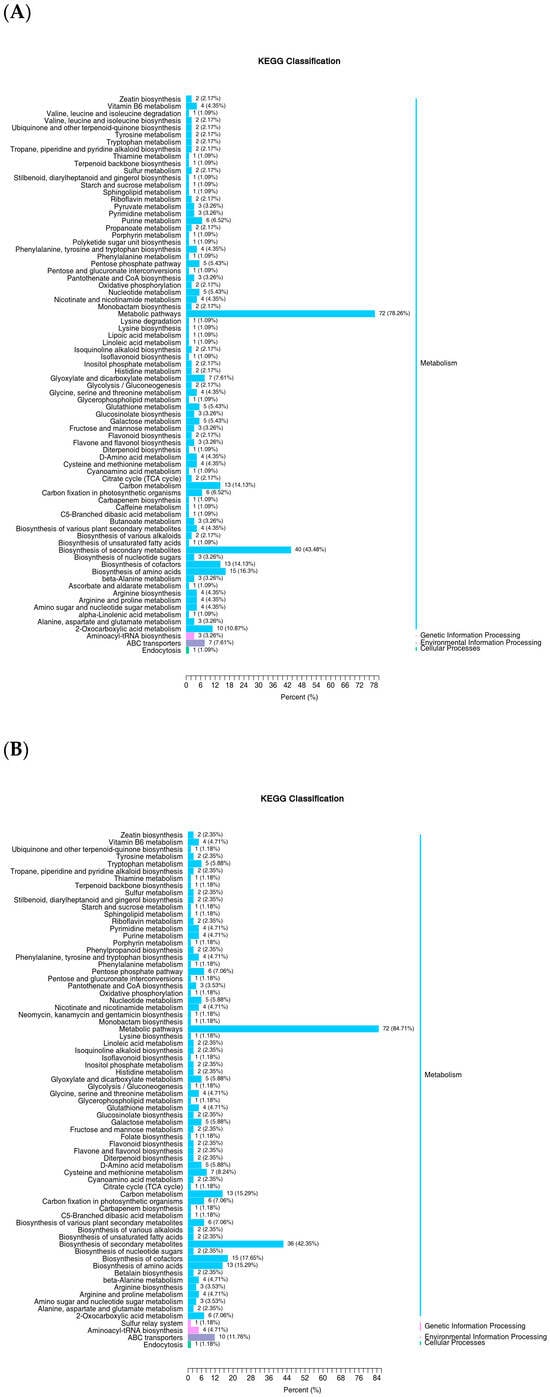
Figure 11.
KEGG classification map of differential metabolites. Note: (A) DT-Treat_vs_DT-CK and (B) LQ-Treat_vs_LQ-CK.
As shown in Figure 11B, the comparison of metabolites in LQ-Treat and LQ-CK leaves demonstrated that metabolic pathways (72 species, 84.71%), biosynthesis of secondary metabolites (36 species, 42.35%), biosynthesis of cofactors (15 species, 17.65%), carbon metabolism (13 species, 15.25%), and biosynthesis of amino acids (13 species, 15.25%) were significantly enriched. This was followed by environmental information processing pathways, such as ABC transporters (10 species, 11.76%), and genetic information processing pathways, where the highest number of differences was observed in aminoacyl-tRNA biosynthesis (4 species, 4.71%). Finally, cellular processing pathways, such as endocytosis (1 species, 1.18%), were observed.
3.5. Combined Transcriptome and Metabolome Analysis of A. mongholicus Leaves
To comprehensively investigate the mechanisms underlying salt tolerance regulation in A. mongholicus, we analyzed DEGs and DAMs to examine the dynamic patterns of differential metabolites, differentially expressed genes, and key metabolic pathways in the leaves of A. mongholicus under salt stress. For the differential genes and metabolites in the leaves of ‘LQ’ (Figure 12B) and ‘DT’ (Figure 12A) under salt stress, joint analysis revealed that ‘DT’ (DT-Treat_vs_DT-CK) was enriched in 16 pathways (p < 0.05), whereas ‘LQ’ (LQ-Treat_vs_LQ-CK) was enriched in 22 pathways (p < 0.05). Three of these pathways were actively expressed under salt stress (p < 0.05): flavonoid biosynthesis (ko00941), isoquinoline alkaloid biosynthesis (ko00950), and phenylalanine metabolism (ko00360).
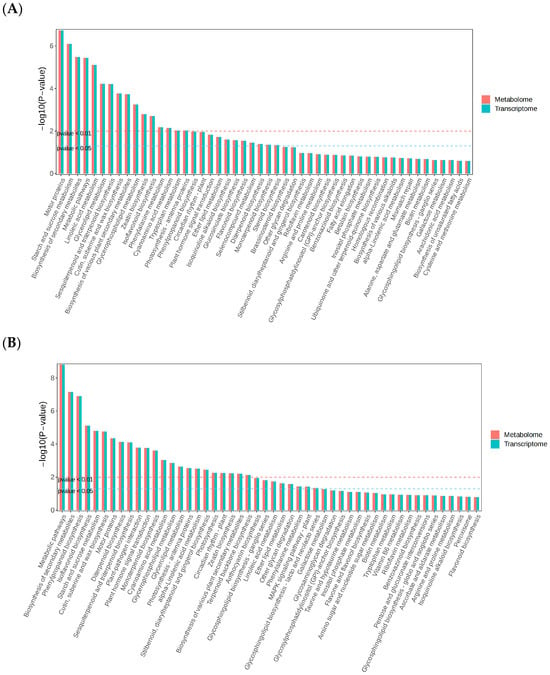
Figure 12.
Differential metabolite and differential gene co-enrichment map. Note: (A) DT-Treat_vs_DT-CK and (B) LQ-Treat_vs_LQ-CK.
In the flavonoid biosynthesis pathway (Figure 13), apigenin and neohesperidin significantly accumulated in ‘LQ’ leaves but were substantially reduced in ‘DT’ leaves. Gene expression analysis revealed that both CYP75A and F3H genes were upregulated in ‘LQ’, and seven members of the CHS gene were significantly upregulated, whereas the HCT gene exhibited complex expression patterns, with three genes upregulated and ten downregulated. In ‘DT’, both CYP75A and F3H genes were downregulated. The CHS gene exhibited a tendency to be mostly downregulated (one upregulated and seven downregulated), while ten members of the HCT gene were upregulated and three were downregulated. This difference in gene expression patterns corresponded to the trend of metabolite accumulation, suggesting that ‘LQ’ enhanced its resistance to salt stress by activating the flavonoid metabolic pathway, particularly through the antioxidant and signaling functions of key metabolites, such as apigenin and neohesperidin, which effectively alleviated oxidative damage induced by salt stress. In contrast, the metabolite and gene responses in ‘DT’ leaves were more restricted, potentially contributing to its weaker salt tolerance.
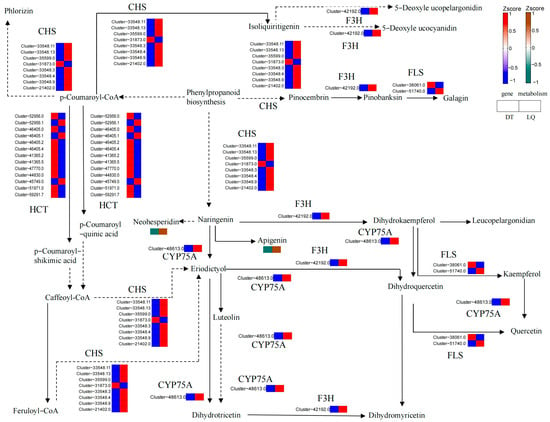
Figure 13.
Flavonoid biosynthetic pathway. Note: the boxes in the pathway diagram represent Log2FC values, where LQ stands for LQ-CK versus LQ-Treat and DT stands for DT-CK versus DT-Treat. Same as below.
In the phenylalanine metabolic pathway (Figure 14), L-phenylalanine and succinate significantly accumulated in ‘LQ’ leaves under salt stress, while their accumulation was absent in ‘DT’ leaves. Gene expression analysis revealed that the HPD, AOC3, GOT1, TAT, and MIF genes were significantly upregulated in ‘LQ’ leaves. Five members of the PAL gene were upregulated, while three were downregulated. The DDC/TDC and amiE genes exhibited a complex pattern of both up-regulation and down-regulation. In contrast, these genes were predominantly downregulated in ‘DT’ leaves.
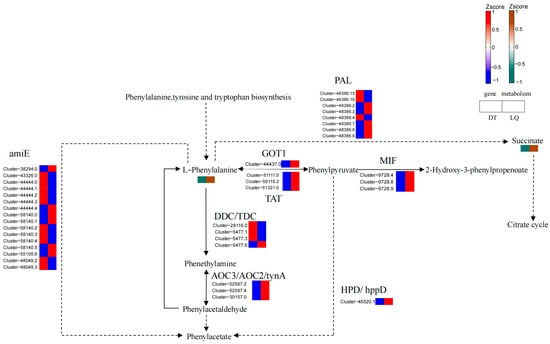
Figure 14.
Phenylalanine metabolism.
These findings suggest that ‘LQ’ activated a stronger defense response under salt stress by enhancing the phenylalanine metabolic pathway. Notably, the significant accumulation of L-phenylalanine, a key initiator of phenylpropanoid metabolism, may have enhanced stress tolerance by modulating the synthesis of antioxidants and cell wall components (e.g., lignin). Furthermore, the increased content of succinate may have provided additional energy support for the defense response. In contrast, the limited metabolite and gene responses in ‘DT’ indicated weaker salt tolerance.
In the isoquinoline alkaloid synthesis pathway (Figure 15), dopamine and 3-(4-hydroxyphenyl)pyruvate significantly accumulated in ‘LQ’ leaves under salt stress, whereas 4-hydroxycinnamic acid and narcotoline were downregulated. In contrast, dopamine and 3-(4-hydroxyphenyl)pyruvate were downregulated in ‘DT’ leaves, whereas 4-hydroxycinnamic acid and narcotoline accumulated. Gene expression analysis revealed that the AOC3, TAT, and GOT2 genes were significantly upregulated, whereas the CODM and CYP80B1 genes were downregulated in ‘LQ’, while ‘DT’ displayed the opposite trend.
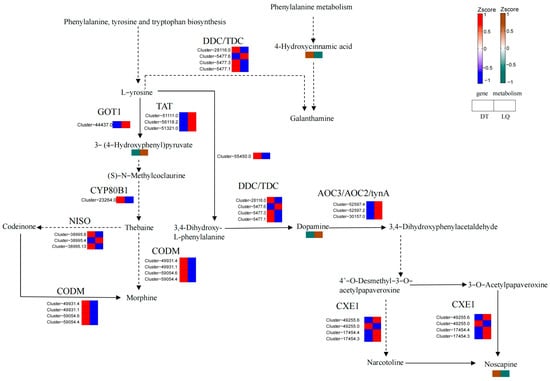
Figure 15.
Isoquinoline alkaloid synthesis pathway.
The accumulation of dopamine and the up-regulation of the AOC3 gene in ‘LQ’ may have effectively mitigated salt stress-induced injury by enhancing antioxidant and signaling capacities. Moreover, the high expression of the TAT gene may have facilitated the synthesis of secondary metabolites and enhanced salt tolerance. Conversely, the reduction of dopamine and the down-regulation of key genes in ‘DT’ reflected a weaker stress response in this pathway. Furthermore, the up-regulation of CODM and CYP80B1 may have facilitated the accumulation of specific alkaloids in ‘DT’, although the roles of these metabolites in salt tolerance require further elucidation.
4. Discussion
Salt stress exerts significant effects on plant growth and development [,]. Excessive salinity in the soil typically results in the accumulation of NaCl, which, in turn, impairs plant water uptake and nutrient absorption, ultimately leading to growth retardation and even plant death []. Under salt stress, the plant cell membrane structure becomes disrupted, leading to a dysregulation of ionic balance that triggers an excessive accumulation of reactive oxygen species (ROS) []. POD, SOD, and CAT play an essential role in maintaining cellular ROS homeostasis when ROS content increases significantly in plants, causing oxidative damage to cells []. Regarding enzyme resistance systems, POD, SOD, and CAT showed significant increases after salt stress was applied to the two A. mongholicus germplasms in this study. Notably, antioxidant enzyme activity levels in ‘LQ’ were higher than those in ‘DT’ after salt stress, indicating that the salt-tolerant germplasm exhibited strong ROS scavenging ability and mitigated ROS-induced cellular damage under salt stress conditions. Furthermore, the MDA content in ‘LQ’ was significantly lower than that in ‘DT’ under salt stress treatment. Similar results have been previously observed in spring wheat [].
In this study, the trends of proline, soluble sugars, and soluble protein contents were consistent with those of antioxidant enzyme activities, suggesting that the plants effectively maintained cellular osmotic pressure and enhanced salt tolerance by accumulating osmoregulatory substances. Both osmoregulatory substances and antioxidant enzymes alleviated salt stress toxicity in A. mongholicus seedlings to some extent, which is consistent with results from studies on marigold [], magnolia [], and sorghum [] under salt stress.
However, in addition to the role of enzymatic antioxidants, non-enzymatic antioxidant systems also play equally crucial roles in the plant’s response to salt stress in A. mongholicus species. For instance, flavonoids are key secondary metabolites that are widely implicated in the plant’s response to abiotic stress. Certain plants improve their salt tolerance by accumulating elevated levels of flavonoids []. In this study, the levels of apigenin and neohesperidin were significantly increased in ‘LQ’ following salt treatment, while several key genes involved in the flavonoid biosynthetic pathway (CHS, F3H, and CYP75A) showed significant up-regulation in expression, consistent with previous findings in Lonicera []. The trend was further validated by qRT-PCR analysis, which revealed significant up-regulation of the CHS, F3H, and CYP75A genes under salt stress, along with a consistent up-regulation trend for the Cluster-33548.11 gene in the CHS family. The ‘DT’ germplasm exhibited down-regulation of apigenin and neohesperidin, further suggesting that the spatial and temporal expression patterns of the associated genes in the flavonoid biosynthetic pathway are closely linked to the plant’s salt stress response. In recent years, several studies have confirmed the anti-salt effect of apigenin. Mekawy et al. showed that apigenin pretreatment induced an antioxidant defense system in rice seedlings, evidenced by increased activities of catalase (CAT) and ascorbate peroxidase (APX) in the root system, as well as enhanced accumulation of carotenoids and flavonoids in the shoots. Additionally, apigenin modulated the selective uptake and transport of ions by the roots, maintaining the antioxidant defense system in the root, as well as enhancing the selective uptake and translocation of ions in the roots to maintain a high K+/Na+ ratio, a crucial property for plant growth under salt stress []. This enhanced antioxidant capacity not only mitigates oxidative damage by scavenging ROS but may also enhance salt tolerance by increasing the activities of antioxidant enzymes (e.g., SOD, POD, and CAT), consistent with the results of our physiological studies. Additionally, apigenin mitigates oxidative damage by activating the antioxidant defense system. Amooaghaie et al. also showed that apigenin attenuated oxidative damage by enhancing the antioxidant properties of plant leaves and effectively scavenging ROS generated under salt stress []. Similarly, neohesperidin has been shown to enhance antioxidant activity in plants, aiding in the scavenging of reactive oxygen species produced by stress []. This enhanced antioxidant capacity is particularly important for plants under salt stress, as it significantly slows oxidative damage caused by reactive oxygen species and further improves salt tolerance. Wang Yubin et al. [] similarly showed that salt-tolerant soybeans contained higher levels of lignans, kaempferol, and butyric acid than salt-sensitive soybeans, suggesting that they accumulated more flavonoids under salt stress, thereby enhancing antioxidant capacity. Ying Wang et al. [] also showed that isoquercitrin, kaempferol, and apigenin accumulated with increasing salt concentration in mulberry seeds, suggesting that these flavonoids may be key metabolites in the response to salt stress.
In particular, phenylalanine metabolism serves as a crucial starting point for the synthesis of secondary metabolites, which is closely associated with plant stress responses and plays a key role in flavonoid biosynthesis []. Previous studies have demonstrated that NaCl stress significantly increased the levels of L-phenylalanine, cinnamic acid, and p-coumaric acid in red rice []. In the current study, we observed significant up-regulation of L-phenylalanine and succinate metabolites in ‘LQ’ leaves under salt stress, whereas ‘DT’ germplasm exhibited a down-regulation trend, suggesting that ‘LQ’ is more likely to respond to salt stress through phenylalanine metabolism. Moreover, key genes involved in phenylalanine metabolism, including HPD, AOC3, and TAT, were significantly up-regulated in ‘LQ’, whereas all of these genes were down-regulated in ‘DT’. This observation was almost consistent with the changes in metabolite content and was further confirmed through qRT-PCR analysis. qRT-PCR analysis further corroborated this result, with Cluster-52597.4 of the AOC3 family also exhibiting an up-regulation trend. Furthermore, phenylalanine deaminase (PAL), the rate-limiting enzyme in the phenylalanine metabolic pathway, plays a crucial role in mitigating various environmental stresses, including pathogen attacks, low temperatures, and heavy metals []. The present study demonstrated that the up-regulation of the PAL gene in ‘LQ’ may have driven the synthesis of cinnamic acid and its downstream secondary metabolites (e.g., flavonoids and lignans), while the PAL gene was more frequently down-regulated in ‘DT’ germplasm. This significant difference in gene expression patterns further suggested that ‘LQ’ enhanced the synthesis of secondary metabolites by strengthening the expression of genes involved in phenylalanine metabolism, thereby improving its capacity to adapt to salt stress. Furthermore, succinic acid, as a key organic acid, may have further enhanced the antioxidant capacity of ‘LQ’ by participating in energy metabolism and the organic acid cycle, thereby helping the plant mitigate the oxidative damage induced by reactive oxygen species generated under salt stress []. Similarly, LBP 1402 exhibited an earlier performance than LBP N7 in accumulating metabolites such as phenylalanine and L-tyrosine and activating related genes, demonstrating a more efficient antioxidant response capacity []. Additionally, Ismail et al. also found that salt stress induced a significant enhancement of glucose-6-phosphate dehydrogenase (G-6-PDH) and PAL activities in cauliflower bean [].
Isoquinoline alkaloid biosynthesis plays a critical role in stress tolerance, disease resistance, and environmental adaptation in plants by regulating the production of secondary metabolites [,]. Several pathways, including phenylpropane biosynthesis, isoquinoline alkaloid biosynthesis, and tyrosine metabolism, were found to be significantly enriched in differentially expressed genes (DEGs) of salt-tolerant quinoa (ST) under salt stress []. This study revealed significant differences in the regulation modes between ‘LQ’ and ‘DT’. Dopamine and 3-(4-hydroxyphenyl) pyruvate were up-regulated in ‘LQ’ leaves under salt stress, while they were down-regulated in ‘DT’. Exogenous dopamine treatment has been shown to effectively prevent cellular damage in tomato seedlings and increase plant salt tolerance, which aligns with our findings in ‘LQ’, suggesting that ‘LQ’ improved salt stress tolerance by enhancing the accumulation of these metabolites, thereby increasing its salt defense ability []. Gene expression analysis revealed that AOC3, TAT, and GOT2 were up-regulated in ‘LQ’, while these genes were down-regulated in ‘DT’, consistent with the metabolite changes, further suggesting that ‘LQ’ enhanced its defense capacity against salt stress by increasing the accumulation of these metabolites. ‘LQ’ may enhance its salt tolerance by intensifying isoquinoline alkaloid biosynthesis. Similarly, Yuan Gong et al. reported that 191 genes were differentially expressed after KLBMP5084 treatment in tomato leaves under salt stress, with the highest enrichment of genes involved in the photosynthesis–antennal protein pathway and isoquinoline alkaloid biosynthesis, suggesting that these pathways may play important roles in responding to salt stress as well [].
Although Liu et al. [] investigated the adaptation mechanisms of A. mongholicus under salt–alkali mixed stress, emphasizing the significant role of flavonoids in salt tolerance, the complexity of salt–alkali mixed stress complicates the attribution of physiological responses to individual stressors. The combined effects of NaCl and Na2CO3, which induce both osmotic stress and pH alterations, often lead to ambiguous interpretations, complicating the identification of physiological responses attributed to each factor. In contrast, this study specifically focuses on NaCl single salt stress, providing a more refined and precise framework for examining plant response mechanisms. Recent studies have further underscored the importance of studying single salt stress in more detail. Bao et al. [] found that salt and alkali stress trigger distinct physiological responses in plants, suggesting that the independent investigation of each stressor may yield more accurate insights into their respective mechanisms. Similarly, Bai et al. [] demonstrated that alkali stress exerts a more significant inhibitory effect on oat growth compared to salt stress. Furthermore, Wang et al. [] pointed out the prevalent misinterpretation in the literature where salt–alkali stress is frequently simplistically referred to as salt stress, lacking scientific rigor due to the complex interaction between salinization and alkalization processes. Therefore, focusing on single salt stress offers a simplified but more accurate system, enabling a deeper understanding of critical pathways, such as phenylalanine metabolism and flavonoid biosynthesis. This approach is critical for elucidating mechanisms of salt tolerance, particularly in alleviating oxidative stress and regulating osmotic pressure. By concentrating on short-term salt stress, this study offers an innovative and focused exploration of salt tolerance mechanisms, bridging gaps left unaddressed by mixed salt–alkali stress studies.
Overall, in this study, based on the salt stress phenotypic data of 20 A. mongholicus germplasms, salt tolerance was comprehensively evaluated using principal component analysis (PCA) and the affiliation function value, and the two germplasms with the strongest (LQ) and weakest (DT) salt tolerance were identified. The results showed that LQ significantly outperformed DT in terms of morphological development and biomass accumulation under 200 mmol/L NaCl stress. DT exhibited earlier leaf yellowing under salt stress, while LQ maintained strong growth vigor, indicating that LQ was more adaptable under salt stress. Further analysis revealed that A. mongholicus responded to the salt-stressed environment through three mechanisms: an enzyme resistance system, osmoregulatory substances, and a non-enzymatic resistance system. Notably, in the secondary metabolic pathway, the salt-tolerant germplasm accumulated significant levels of typical metabolites such as apigenin, neohesperidin, L-phenylalanine, succinic acid, dopamine, and 3-(4-hydroxyphenyl)pyruvic acid. The accumulation of these metabolites aligned with the performance of salt-tolerant varieties in the biomass data, further supporting their adaptive advantage under salt stress.
In addition, combined metabolomic and transcriptomic analyses revealed the regulation of characteristic metabolic pathways, such as the phenylalanine metabolism pathway and the isoquinoline alkaloid synthesis pathway, suggesting that these pathways could play important roles in salt tolerance. Although there was insufficient experimental verification of the antioxidant effects of L-phenylalanine and 3-(4-hydroxyphenyl)pyruvate under salt stress, these compounds, as key intermediates in the phenylalanine metabolism and isoquinoline alkaloid synthesis pathways, may indirectly enhance plant salt tolerance by regulating antioxidant enzyme activities and boosting ROS scavenging ability, among other mechanisms. L-phenylalanine, as a precursor of flavonoids and other antioxidants, may help plants respond to salt stress by enhancing their antioxidant system, while 3-(4-hydroxyphenyl)pyruvic acid may regulate the antioxidant and stress response of plants by participating in the synthesis of isoquinoline alkaloids.
By comparing two germplasms with different salt tolerance performances in this study, we further elucidated the distinct performance of A. mongholicus under salt stress. This provided foundational data for the future development of selection and breeding strategies and also enriched the transcriptomic information of A. mongholicus.
Future studies could further investigate the changes in salt tolerance mechanisms of A. mongholicus under varying salt concentrations and stress durations. Specifically, the effect of salt on plants under varying stress conditions does not follow a simple linear relationship; rather, it exhibits certain complexities. Additionally, a comprehensive analysis of phenotypes, metabolites, and gene expression in A. mongholicus germplasm under varying salt stress conditions could provide a clearer understanding of the mechanisms of flavonoid biosynthesis, phenylalanine metabolism, and isoquinoline alkaloid synthesis in response to salt stress. Future research could also investigate key genes and regulatory factors associated with salt tolerance through genomics and transcriptomics, which would provide robust support for the development of molecular markers for salt tolerance and the breeding of salt-resistant plants.
5. Conclusions
This study systematically compared the salt tolerance of Astragalus mongholicus germplasms from different regions of China and analyzed their responses to salt stress through phenotypic and physiological biochemical data. The salt-tolerant germplasm LQ demonstrated notable advantages in physiological traits such as antioxidant capacity and osmoregulatory ability. Subsequently, integrated transcriptomic and metabolomic analyses further confirmed that the salt-tolerant germplasm LQ alleviates the negative impacts of salt stress by regulating key metabolic pathways, including flavonoid biosynthesis, phenylalanine metabolism, and isoquinoline alkaloid synthesis, and modulating the expression of related genes, thus influencing metabolite accumulation. Notably, the accumulation of metabolites such as apigenin, neohesperidin, L-phenylalanine, and dopamine significantly enhanced LQ’s antioxidant and osmoregulatory abilities, thereby reducing the damage to plant growth and development caused by salt stress. This study also identified that the isoquinoline alkaloid and phenylalanine metabolism pathways play a role in A. mongholicus’ response to salt stress—mechanisms that have been relatively underexplored in previous studies on salt–alkali mixed stress in A. mongholicus. These findings not only provide novel insights into the molecular mechanisms of salt tolerance but also establish a theoretical foundation and practical basis for future strategies in metabolic regulation and gene editing aimed at improving salt tolerance in A. mongholicus and other crops.
Supplementary Materials
The following supporting information can be downloaded at https://www.mdpi.com/article/10.3390/app15052575/s1, Table S1: Distribution and classification of A.mongholicus varieties across different provinces in China; Table S2: Results of principal component analysis of various indicators of A. mongholicus germplasm at the seedling stage; Table S3: Loading and weight of each index of A. mongholicus germplasm at the seedling stage; Table S4: Membership values and comprehensive evaluation indexes of A. mongholicus germplasm seedling indicators.
Author Contributions
Conceptualization, methodology, investigation, data curation, formal analysis, project administration, and writing—original draft preparation, Y.L. and J.S.; resources, software, data curation, and validation, X.L. and J.Y.; supervision, funding acquisition, and writing—review and editing, J.S. All authors have read and agreed to the published version of the manuscript.
Funding
This work was financially supported by the China Agriculture Research System-Chinese Materia Medica (No. CARS-21), the Science and Technology Program of Inner Mongolia Autonomous Region (No. 2023YFHH0069), the Science and Technology Program of Inner Mongolia Autonomous Region (No. 2021GG0358), the Natural Science Foundation of Inner Mongolia Autonomous Region (No. 2024MS03032), and the Double First-Class Construction Funds—Discipline Construction Quality Improvement Project (No. DC2400000900).
Institutional Review Board Statement
Not applicable.
Informed Consent Statement
Not applicable.
Data Availability Statement
The transcriptome datasets in this study were stored in NCBI under the accession number PRJNA1197969.
Acknowledgments
We would like to express our heartfelt gratitude to Xiongjie Zhang and Wenjuan Wang for their valuable assistance during the research and manuscript preparation process. Their constructive feedback and technical support greatly contributed to the refinement of this work.
Conflicts of Interest
The authors declare no conflicts of interest.
Appendix A

Table A1.
Preparation of qRT-PCR reaction system.
Table A1.
Preparation of qRT-PCR reaction system.
| Component | Volume |
|---|---|
| PerfectStart® Green qPCR SuperMix (+Dye II) | 10 μL |
| Forward and reverse primers | 2 μL |
| DNA template | 2 μL |
| H2O | 6 μL |
| Total volume | 20 μl |
| PerfectStart® Green qPCR SuperMix (+Dye II) | 10 μL |
References
- Fan, C.X. Genetic mechanisms of salt stress responses in halophytes. Plant Signal. Behav. 2020, 15, 1704528. [Google Scholar] [CrossRef] [PubMed]
- Singh, A. Soil salinization management for sustainable development: A review. J. Environ. Manag. 2021, 277, 111383. [Google Scholar] [CrossRef] [PubMed]
- Li, J.; Wang, J. Integrated life cycle assessment of improving saline-sodic soil with flue gas desulfurization gypsum. J. Clean. Prod. 2018, 202, 332–341. [Google Scholar] [CrossRef]
- Kumar, A.; Mann, A.; Kumar, A.; Kumar, N.; Meena, B.L. Physiological response of diverse halophytes to high salinity through ionic accumulation and ROS scavenging. Int. J. Phytoremediation 2021, 23, 1041–1051. [Google Scholar] [CrossRef]
- Zhu, J.-K. Abiotic Stress Signaling and Responses in Plants. Cell 2016, 167, 313–324. [Google Scholar] [CrossRef]
- Ismail, A.M.; Horie, T. Genomics, Physiology, and Molecular Breeding Approaches for Improving Salt Tolerance. Annu. Rev. Plant Biol. 2017, 68, 405–434. [Google Scholar] [CrossRef]
- Hasanuzzaman, M.; Raihan, M.R.H.; Masud, A.A.C.; Rahman, K.; Nowroz, F.; Rahman, M.; Nahar, K.; Fujita, M. Regulation of Reactive Oxygen Species and Antioxidant Defense in Plants under Salinity. Int. J. Mol. Sci. 2021, 22, 9326. [Google Scholar] [CrossRef]
- Sofy, M.R.; Aboseidah, A.A.; Heneidak, S.A.; Ahmed, H.R. ACC deaminase containing endophytic bacteria ameliorate salt stress in Pisum sativum through reduced oxidative damage and induction of antioxidative defense systems. Environ. Sci. Pollut. Res. 2021, 28, 40971–40991. [Google Scholar] [CrossRef]
- Kim, J.; Lee, W.J.; Vu, T.T.; Jeong, C.Y.; Hong, S.W.; Lee, H. High accumulation of anthocyanins via the ectopic expression of AtDFR confers significant salt stress tolerance in Brassica napus L. Plant Cell Rep. 2017, 36, 1215–1224. [Google Scholar] [CrossRef]
- Shen, W.; Liu, D.; Zhang, H.; Zhu, W.; He, H.; Li, G.; Liu, J. Overexpression of β-cyanoalanine synthase of Prunus persica increases salt tolerance by modulating ROS metabolism and ion homeostasis. Environ. Exp. Bot. 2021, 186, 104431. [Google Scholar] [CrossRef]
- Ma, B.; Song, Y.; Feng, X.H.; Guo, P.; Zhou, L.X.; Jia, S.J.; Guo, Q.X.; Zhang, C.Y. Integrated Metabolome and Transcriptome Analyses Reveal the Mechanisms Regulating Flavonoid Biosynthesis in Blueberry Leaves under Salt Stress. Horticulturae 2024, 10, 1084. [Google Scholar] [CrossRef]
- Lv, X.L.; Zhu, L.; Ma, D.M.; Zhang, F.J.; Cai, Z.Y.; Bai, H.B.; Hui, J.; Li, S.H.; Xu, X.; Li, M. Integrated Metabolomics and Transcriptomics Analyses Highlight the Flavonoid Compounds Response to Alkaline Salt Stress in Glycyrrhiza uralensis Leaves. J. Agric. Food Chem. 2024, 72, 5477–5490. [Google Scholar] [CrossRef] [PubMed]
- Wang, Y.B.; Liu, W.; Li, W.; Wang, C.J.; Dai, H.Y.; Xu, R.; Zhang, Y.W.; Zhang, L.F. Integrative analysis of metabolome and transcriptome reveals regulatory mechanisms of flavonoid biosynthesis in soybean under salt stress. Front. Plant Sci. 2024, 15, 1415867. [Google Scholar] [CrossRef] [PubMed]
- Zhang, Q.; Wang, S.K.; Qin, B.; Sun, H.Y.; Yuan, X.K.; Wang, Q.; Xu, J.J.; Yin, Z.G.; Du, Y.L.; Du, J.D.; et al. Analysis of the transcriptome and metabolome reveals phenylpropanoid mechanism in common bean (Phaseolus vulgaris) responding to salt stress at sprout stage. Food Energy Secur. 2023, 12, e481. [Google Scholar] [CrossRef]
- Xu, Z.S.; Chen, X.J.; Lu, X.P.; Zhao, B.P.; Yang, Y.M.; Liu, J.H. Integrative analysis of transcriptome and metabolome reveal mechanism of tolerance to salt stress in oat (Avena sativa L.). Plant Physiol. Biochem. 2021, 160, 315–328. [Google Scholar] [CrossRef]
- Rajput, V.D.; Harish; Singh, R.K.; Verma, K.K.; Sharma, L.; Quiroz-Figueroa, F.R.; Meena, M.; Gour, V.S.; Minkina, T.; Sushkova, S.; et al. Recent Developments in Enzymatic Antioxidant Defence Mechanism in Plants with Special Reference to Abiotic Stress. Biology 2021, 10, 267. [Google Scholar] [CrossRef]
- Wang, J.M.; Wang, Z.; Wang, P.P.; Wu, J.H.; Kong, L.Y.; Ma, L.L.; Jiang, S.; Ren, W.C.; Liu, W.L.; Guo, Y.L.; et al. Genome-wide identification of YABBY gene family and its expression pattern analysis in Astragalus mongholicus. Plant Signal. Behav. 2024, 19, 2355740. [Google Scholar] [CrossRef]
- Bi, Q.; Yao, H.; Wang, F.; He, D.J.; Xu, W.B.; Xie, S.Q.; Chen, X.F.; Li, Y.X.; Liu, H.L.; Shen, H.T.; et al. Integrative analysis of the pharmaceutical active ingredient and transcriptome of the aerial parts of Glycyrrhiza uralensis under salt stress reveals liquiritin accumulation via ABA-mediated signaling. Mol. Genet. Genom. 2022, 297, 333–343. [Google Scholar] [CrossRef]
- Ren, W.; Wang, Q.; Chen, L.; Ren, Y.P. Transcriptome and Metabolome Analyses of Salt Stress Response in Cotton (Gossypium hirsutum) Seed Pretreated with NaCl. Agronomy 2022, 12, 1849. [Google Scholar] [CrossRef]
- Chen, Y.H.; Li, H.J.; Zhang, S.Y.; Du, S.F.; Wang, G.Y.; Zhang, J.C.; Jiang, J. Analysis of the Antioxidant Mechanism of Tamarix ramosissima Roots under NaCl Stress Based on Physiology, Transcriptomic and Metabolomic. Antioxidants 2022, 11, 2362. [Google Scholar] [CrossRef]
- Ren, G.Z.; Yang, P.Y.; Cui, J.H.; Gao, Y.K.; Yin, C.P.; Bai, Y.Z.; Zhao, D.T.; Chang, J.H. Multiomics Analyses of Two Sorghum Cultivars Reveal the Molecular Mechanism of Salt Tolerance. Front. Plant Sci. 2022, 13, 886805. [Google Scholar] [CrossRef] [PubMed]
- Jin, Y.; Guo, F.; Chen, Y.; Bai, G.; Yuan, H.; Liang, W. Effect of various crop residues on growth and disease resistance of Angelica sinensis seedlings in Min County. J. Acta Prataculturae Sin. 2018, 27, 69–78. [Google Scholar] [CrossRef]
- Huo, Q.-P.; Li, J.-B.; Men, X.-L.; Fan, H.-B.; Liu, Z.-P.; Ba, T.; Xu, S.-J. Identification of elite salt-tolerant barley germplasms at the seedling stage and screening for effective evaluation indexes. J. Shenyang Agric. Univ. 2022, 53, 665–676. [Google Scholar] [CrossRef]
- Liu, J.; Zhang, X.; Sheng, J. Integrative analysis of the transcriptome and metabolome reveals the mechanism of saline–alkali stress tolerance in Astragalus membranaceus (Fisch) Bge. var. mongholicus (Bge.) Hsiao. Food Qual. Saf. 2022, 6, fyac001. [Google Scholar] [CrossRef]
- Sikder, R.K.; Wang, X.; Jin, D.; Zhang, H.; Gui, H.; Dong, Q.; Pang, N.; Zhang, X.; Song, M. Screening and evaluation of reliable traits of upland cotton (Gossypium hirsutum L.) genotypes for salt tolerance at the seedling growth stage. J. Cotton Res. 2020, 3, 11. [Google Scholar] [CrossRef]
- Khalil, C.; El Houssein, B.; Hassan, B.; Fouad, M. Comparative Salt Tolerance Study of Some Acacia Species at Seed Germination Stage. Asian J. Plant Sci. 2016, 15, 66–74. [Google Scholar] [CrossRef][Green Version]
- Liu, D.; Guo, H.L.; Yan, L.P.; Gao, L.; Zhai, S.S.; Xu, Y. Physiological, Photosynthetic and Stomatal Ultrastructural Responses of Quercus acutissima Seedlings to Drought Stress and Rewatering. Forests 2024, 15, 71. [Google Scholar] [CrossRef]
- Muhammad Adnan, S.; Ali, S.; Naeem, K.; Rashad Mukhtar, B.; Shahid, A.; Lorenzo, R.; Celina, G.; Neil, S.M.; Wajid, N.; Francisco, G.S. Insights into the Physiological and Biochemical Impacts of Salt Stress on Plant Growth and Development. Agronomy 2020, 10, 938. [Google Scholar] [CrossRef]
- Liu, W.; Feng, J.P.; Ma, W.Y.; Zhou, Y.; Ma, Z.B. GhCLCg-1, a Vacuolar Chloride Channel, Contributes to Salt Tolerance by Regulating Ion Accumulation in Upland Cotton. Front. Plant Sci. 2021, 12, 765173. [Google Scholar] [CrossRef]
- Shen, J.; Chen, D.D.; Zhang, X.P.; Song, L.R.; Dong, J.; Xu, Q.J.; Hu, M.J.; Cheng, Y.Y.; Shen, F.F.; Wang, W. Mitigation of salt stress response in upland cotton (Gossypium hirsutum) by exogenous melatonin. J. Plant Res. 2021, 134, 857–871. [Google Scholar] [CrossRef]
- Laxa, M.; Liebthal, M.; Telman, W.; Chibani, K.; Dietz, K.J. The Role of the Plant Antioxidant System in Drought Tolerance. Antioxidants 2019, 8, 94. [Google Scholar] [CrossRef]
- Raza, S.H.; Athar, H.R.; Ashraf, M.; Hameed, A. Glycinebetaine-induced modulation of antioxidant enzymes activities and ion accumulation in two wheat cultivars differing in salt tolerance. Environ. Exp. Bot. 2007, 60, 368–376. [Google Scholar] [CrossRef]
- Moghaddam, M.; Farhadi, N.; Panjtandoust, M.; Ghanati, F. Seed germination, antioxidant enzymes activity and proline content in medicinal plant Tagetes minuta under salinity stress. Plant Biosyst. 2020, 154, 835–842. [Google Scholar] [CrossRef]
- Zhao, X.T.; Tian, L.; Zhu, Z.L.; Sang, Z.Y.; Ma, L.Y.; Jia, Z.K. Growth and Physiological Responses of Magnoliaceae to NaCl Stress. Plants 2024, 13, 170. [Google Scholar] [CrossRef] [PubMed]
- Nie, M.E.; Ning, N.; Liang, D.; Zhang, H.P.; Li, S.S.; Li, S.; Fan, X.Q.; Zhang, Y.Z. Seed priming with selenite enhances germination and seedling growth of Sorghum Sorghum bicolor (L.) Moench under salt stress. Acta Agric. Scand. Sect. B-Soil Plant Sci. 2023, 73, 42–53. [Google Scholar] [CrossRef]
- Dong, N.Q.; Lin, H.X. Contribution of phenylpropanoid metabolism to plant development and plant-environment interactions. J. Integr. Plant Biol. 2021, 63, 180–209. [Google Scholar] [CrossRef]
- Ben Abdallah, S.; Aung, B.; Amyot, L.; Lalin, I.; Lachâal, M.; Karray-Bouraoui, N.; Hannoufa, A. Salt stress (NaCl) affects plant growth and branch pathways of carotenoid and flavonoid biosyntheses in Solanum nigrum. Acta Physiol. Plant. 2016, 38, 72. [Google Scholar] [CrossRef]
- Mekawy, A.M.M.; Abdelaziz, M.N.; Ueda, A. Apigenin pretreatment enhances growth and salinity tolerance of rice seedlings. Plant Physiol. Biochem. 2018, 130, 94–104. [Google Scholar] [CrossRef]
- Amooaghaie, R.; Korrani, F.M.; Ghanadian, M.; Ahadi, A.; Pak, A.; Mardani, G. Hybrid Priming with He–Ne Laser and Hydrogen Peroxide Advances Phenolic Composition and Antioxidant Quality of Salvia officinalis Under Saline and Non-Saline Condition. J. Plant Growth Regul. 2023, 43, 1012–1025. [Google Scholar] [CrossRef]
- Rao, M.J.; Feng, B.; Ahmad, M.H.; Qamar, M.T.U.; Aslam, M.Z.; Khalid, M.F.; Hussain, S.; Zhong, R.; Ali, Q.; Xu, Q.; et al. LC-MS/MS-based metabolomics approach identified novel antioxidant flavonoids associated with drought tolerance in citrus species. Front. Plant Sci. 2023, 14, 1150854. [Google Scholar] [CrossRef]
- Wang, Y.; Jiang, W.; Li, C.L.; Wang, Z.J.; Lu, C.; Cheng, J.S.; Wei, S.L.; Yang, J.S.; Yang, Q. Integrated transcriptomic and metabolomic analyses elucidate the mechanism of flavonoid biosynthesis in the regulation of mulberry seed germination under salt stress. BMC Plant Biol. 2024, 24, 132. [Google Scholar] [CrossRef] [PubMed]
- Guo, H.; Lyv, Y.Y.; Zheng, W.K.; Yang, C.K.; Li, Y.F.; Wang, X.Y.; Chen, R.D.; Wang, C.; Luo, J.; Qu, L.H. Comparative Metabolomics Reveals Two Metabolic Modules Affecting Seed Germination in Rice (Oryza sativa). Metabolites 2021, 11, 880. [Google Scholar] [CrossRef] [PubMed]
- Yan, Y.X.; Luo, X.H.; Fan, M.C.; Al-Ansi, W.; Qian, H.F.; Li, Y.; Wang, L. NaCl stress enhances pigment accumulation and synthesis in red rice during the germination stage. Food Biosci. 2023, 56, 103224. [Google Scholar] [CrossRef]
- Zhang, X.B.; Liu, C.J. Multifaceted Regulations of Gateway Enzyme Phenylalanine Ammonia-Lyase in the Biosynthesis of Phenylpropanoids. Mol. Plant 2015, 8, 17–27. [Google Scholar] [CrossRef]
- Qin, X.Y.; Qin, B.B.; He, W.; Chen, Y.; Yin, Y.; Cao, Y.L.; An, W.; Mu, Z.X.; Qin, K. Metabolomic and Transcriptomic Analyses of Lycium barbarum L. under Heat Stress. Sustainability 2022, 14, 12617. [Google Scholar] [CrossRef]
- Wang, X.; Hu, Y.; Wang, Y.; Wang, Y.; Gao, S.; Zhang, T.; Guo, J.; Shi, L. Integrated metabolomic and transcriptomic strategies to reveal alkali-resistance mechanisms in wild soybean during post-germination growth stage. Planta 2023, 257, 95. [Google Scholar] [CrossRef]
- Ismail, G.S.M.; Ali, A.S.; Eldebawy, E.M.M.; Saber, N.E. Role of cellular NADP+/NADPH ratio in the acclimative mechanism of two common bean cultivars toward salt stress. J. Appl. Bot. Food Qual. 2017, 90, 43–51. [Google Scholar] [CrossRef]
- Liu, L.J.; Lin, L.D. Effect of Heat Stress on Sargassum fusiforme Leaf Metabolome. J. Plant Biol. 2020, 63, 229–241. [Google Scholar] [CrossRef]
- Liu, E.L.; Xu, L.L.; Luo, Z.Q.; Li, Z.Q.; Zhou, G.H.; Gao, H.F.; Fang, F.R.; Tang, J.; Zhao, Y.; Zhou, Z.L.; et al. Transcriptomic analysis reveals mechanisms for the different drought tolerance of sweet potatoes. Front. Plant Sci. 2023, 14, 1136709. [Google Scholar] [CrossRef]
- Shi, P.B.; Gu, M.F. Transcriptome analysis and differential gene expression profiling of two contrasting quinoa genotypes in response to salt stress. BMC Plant Biol. 2020, 20, 568. [Google Scholar] [CrossRef]
- Gong, Y.; Chen, L.J.; Pan, S.Y.; Li, X.W.; Xu, M.J.; Zhang, C.M.; Xing, K.; Qin, S. Antifungal potential evaluation and alleviation of salt stress in tomato seedlings by a halotolerant plant growth-promoting actinomycete Streptomyces sp. KLBMP5084. Rhizosphere 2020, 16, 100262. [Google Scholar] [CrossRef]
- Yildirim, E.; Ekinci, M.; Turan, M.; Yuce, M.; Ors, S.; Araz, O.; Torun, U.; Argin, S. Exogenous dopamine mitigates the effects of salinity stress in tomato seedlings by alleviating the oxidative stress and regulating phytohormones. Acta Physiol. Plant. 2024, 46, 59. [Google Scholar] [CrossRef]
- Zou, L.J.; Li, T.T.; Li, B.B.; He, J.; Liao, C.L.; Wang, L.Z.; Xue, S.Y.; Sun, T.; Ma, X.; Wu, Q.G. De novo transcriptome analysis provides insights into the salt tolerance of Podocarpus macrophyllus under salinity stress. BMC Plant Biol. 2021, 21, 489. [Google Scholar] [CrossRef] [PubMed]
- Bao, Q.; Wu, Y.; Wang, Y.; Zhang, Y. Comparative Transcriptomic Analysis Reveals Transcriptional Differences in the Response of Quinoa to Salt and Alkali Stress Responses. Agronomy 2024, 14, 1596. [Google Scholar] [CrossRef]
- Bai, J.; Lu, P.; Li, F.; Li, L.; Yin, Q. Metabolome and Transcriptome Analyses Reveal the Differences in the Molecular Mechanisms of Oat Leaves Responding to Salt and Alkali Stress Conditions. Agronomy 2023, 13, 1441. [Google Scholar] [CrossRef]
- Wang, Q.; Liu, Q.; Gao, Y.; Liu, X. Review on the mechanisms of the response to salinity-alkalinity stress in plants. Acta Ecol. Sin. 2017, 37, 5565–5577. [Google Scholar]
Disclaimer/Publisher’s Note: The statements, opinions and data contained in all publications are solely those of the individual author(s) and contributor(s) and not of MDPI and/or the editor(s). MDPI and/or the editor(s) disclaim responsibility for any injury to people or property resulting from any ideas, methods, instructions or products referred to in the content. |
© 2025 by the authors. Licensee MDPI, Basel, Switzerland. This article is an open access article distributed under the terms and conditions of the Creative Commons Attribution (CC BY) license (https://creativecommons.org/licenses/by/4.0/).