Abstract
Efficiently extracting effective information from the massive experimental data from physical mechanics and accurately identifying the premonitory failure information from coal rock are key and difficult points of intelligent research on rock mechanics. In order to reveal the deterioration characteristics and the forewarning law of fractured coal rock, the digital image correlation method and the acoustic emission technology were adopted in this study to non-destructively detect the strain field, displacement field, and acoustic emission response in time and frequency domains. Additionally, by introducing the derivative functions of the multi-source information function for quantitative analysis, a comprehensive evaluation method was proposed based on the multi-source information fusion monitoring to forewarn red sandstone failure by levels during loading. The results show that obvious premonitory failure information, such as strain concentration areas, appears on red sandstone’s surface before macro-cracks can be observed. With an increase in the inclination angle of the prefabricated crack, the macroscopic failure mode gradually transforms from tensile splitting failure to tensile-shear mixed failure. Moreover, the dominant frequency signals of high frequency–low amplitude (HF–LA), intermediate frequency–low amplitude (IF–LA) and low frequency–low amplitude (LF–LA) are denser near the stress peak. The initial crack expansion time and failure limit time measured by multi-source information fusion are 20.72% and 26.71% earlier, respectively, than those measured by direct observation, suggesting that the forewarning of red sandstone failure by levels is realized with multi-source information fusion.
1. Introduction
Coal-bearing sedimentary rock contains complex structural planes after undergoing a long geological formation process [1]. Under the disturbance resulting from underground engineering operations, stress becomes redistributed in rock. In this case, discontinuous structural planes lead to the formation, expansion, and connection of cracks, which induces the instability of the rock. Due to the complexity of the internal structures in rock, it is difficult to directly observe its internal damage deterioration from its surface. Nevertheless, the process from damage deterioration to instability failure is not isolated but is normally accompanied by variations of multi-source information, including image, sound, electricity, and magnetism. Therefore, the damage deterioration of rock can be identified based on the evolution law of physical information during the failure process [2,3]. Furthermore, analysis on the stability of surrounding rock based on multi-source physical information is also of great significance for forewarning the instability of the surrounding rock in underground engineering.
To reveal the evolution of the strain field on rock’s surface and the expansion and development of micro-cracks in rock mass, scholars worldwide have conducted extensive experimental research on the monitoring and characterization of crack expansion in fractured rock mass. Yang et al. [4] carried out uniaxial cyclic loading tests to quantify rock damage and deformation and investigate the expansion characteristics of micro-cracks in rock. In addition, they proposed an A(t) damage-index evaluation method. Yang et al. [5] conducted uniaxial compression tests on marble, using single holes to observe the characteristics of crack formation, expansion, evolution, and connection during loading and analyze the process of crack expansion in marble under different stresses.
However, the observation and analysis of the physical and mechanical parameters of rock only through theoretical calculation and experimental research cannot intuitively and effectively support the monitoring of crack expansion and the understanding of rock deformation evolution during the failure process. In view of this problem, the digital image correlation (DIC) method can be adopted to realize more comprehensive monitoring and analysis of crack expansion on rock surface. Zhong et al. [6] used the DIC method to study the failure behavior and deformation characteristics of roof rock in coal mines under dynamic–static mixed loads and explained the formation, expansion, and connection process of cracks. The results showed that rock failure is closely related to the evolution of the principal strain field in rock. Lu et al. [7] conducted cyclic-impact load tests on sandstone specimens treated with different temperatures and adopted the DIC method to characterize the mechanical behaviors of specimens and explain the evolutionary processes of crack formation and expansion in sandstone.
Acoustic emission (AE) signals are released when rocks are deformed and damaged under external force or internal stress [8]. Because AE signals contain characteristic information concerning the formation, development, and expansion of micro-cracks and the eventual formation of penetrating macro-cracks in the whole deformation and failure process, scholars used the AE technology to monitor the expansion and evolution of micro-cracks in rocks. Kong et al. [9] performed uniaxial compression tests on heat-damaged sandstone, analyzed the time and frequency domains of AE signals during loading, and established a coupling model of sandstone deformation and failure. Munoz et al. [10] monitored the variation characteristics of rising angle (RA)–average frequency (AF) value of AE signals during sandstone failure, evaluated fracture modes in rock based on the comparison of AF and RA, and explored the potential of the Ib value in distinguishing fracture modes in fracture toughness tests. Zhao et al. [11] carried out uniaxial compression tests on red sandstone, conducted time-frequency analysis on extracted AE characteristic signals, and proposed a method to extract AE characteristic signals during deformation and failure based on the difference between the AE signal duration ratio and the rise time. Niu et al. [12] monitored the distribution characteristics of the time-dependent dominant frequency and the amplitude of AE signals generated by red sandstone specimens in different cracking states under uniaxial compression. In addition, they defined four AE signal patterns and discussed the fracture mechanism in the failure process.
Overall, relevant literature all over the world provide valuable references for the monitoring of rock instability failure [13,14,15]. However, the variation characteristics and evolution law of monitoring information (e.g., displacement field, strain field, and AE) in sandstone failure should not be analyzed separately when studying the failure law of sandstone and the identification of premonitory deterioration information based on the fusion of DIC–AE multi-source information. Otherwise, the applicability, reliability, and validity of various monitoring methods are likely to be restricted. Considering this fact, the extraction, recognition, inversion, and fusion mechanisms of multi-source heterogeneous information require further research.
In this study, red sandstone specimens with prefabricated cracks of different inclination angles were taken as the research object. The displacement and strain fields in digital images and the time and frequency domains of the AE signals were synchronously monitored. Additionally, premonitory deterioration information was identified by fusing the monitored information from the digital images and AE signals. Furthermore, the relationship between the instability failure of red sandstone and the obtained digital images and AE signals was revealed, and finally, the forewarning of red sandstone failure by levels was realized.
2. DIC and AE Monitoring Experiments
2.1. Specimen Preparation
The specimens were prepared strictly in accordance with the test regulations of the rock’s physical and mechanical properties. First, red sandstone was collected and processed into experimental specimens, each with a size of 80 mm × 30 mm × 160 mm. Next, cracks that each had a size of 20 mm × 2 mm and inclination angles of 0°, 30°, 60°, and 90° were prefabricated at the center of partial specimens, respectively. In addition, there were four samples without prefabricated cracks as the control group. Afterward, the surfaces of the specimens were polished until their roughness was less than 0.02 mm, and then random speckles were painted on the specimens (Figure 1).
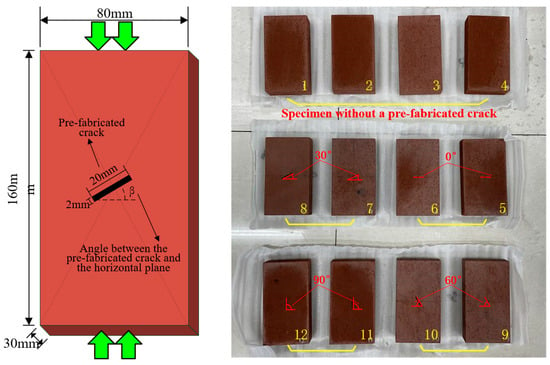
Figure 1.
Specimen preparation and processing.
2.2. Experimental Scheme and Equipment
The experiments were performed with the aid of a C64.106/1000KN electro-hydraulic servo universal testing machine. During the experiment, the AE characteristic signals of red sandstone deformation and failure were monitored and acquired by a Micro-II digital AE system (MISTRAS, Princeton Junction, NJ, USA), and the whole process of crack expansion on the red sandstone’s surface was recorded by a Nikon D7000 SLR camera in the SIC system (Figure 2).
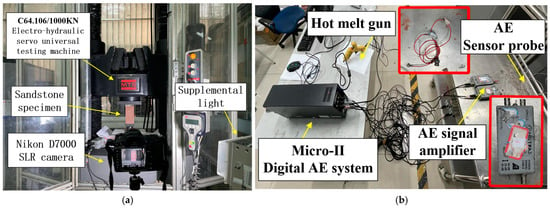
Figure 2.
Experimental equipment for the rock specimens: (a) loading system and DIC monitoring system and (b) AE monitoring system.
Four AE sensors were respectively installed on the back and side of the sample. No sensor was installed directly in front to avoid errors in image acquisition. At the beginning of the experiment, stress, AE signals and images were collected at the same time, which were used for subsequent multi-source information fusion analysis. Moreover, the kernel density estimation (KDE) method was used to identify the density regions that formed, based on the AE parameters. For a detailed introduction of the KDE method, refer to the author’s previous work [16]. The rise angle (RA) and average frequency (AF) are two important parameters in the KDE method.
The camera features a sensor size of 23.6 mm × 15.6 mm, a display resolution of 920,000 pixels, and a maximum pixel count of 16.9 million. It utilizes a CMOS photosensitive device and supports image stabilization. Video recording is available at 30 frames per second, and the image size is 3696 × 2448. The shutter type is an electronically controlled focal plane shutter. In addition to the Nikon D7000 SLR camera, auxiliary tools such as a tripod and a fill light were also used when shooting videos.
Because the speckles were randomly distributed on the red sandstone’s surface, the subregion centered at any point in the speckle field could be taken as an information carrier for the deformation and displacement change of the point. The displacement and deformation information at this point could be obtained by measuring and analyzing the deformation change in the subregion [17,18]. It was assumed that A(x0, y0) was the center of a subregion D on the surface of the measured object before it was deformed and that the size of the subregion D was m × n pixels. With these assumptions, the correlation search could be employed to find the target subregion D’ centered at A’(x’0, y’0); this was most relevant to subregion D in the image after this object was deformed. The displacement change at Point a can be defined as u = x’0 − x0, v = y’0 − y0, and the actual displacement at Point a was obtained by converting pixel units (Figure 3).
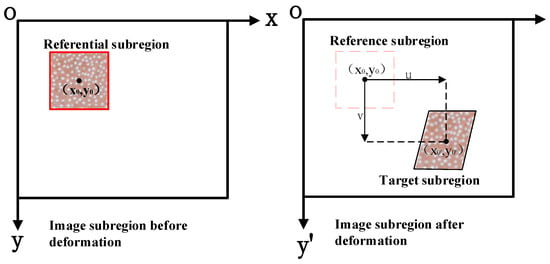
Figure 3.
Schematic diagram of the DIC method.
3. Experimental Results and Analysis
3.1. Analysis on Failure Process
Macroscopic failure modes of the fractured red sandstone specimens can be determined by observing their failure results (Figure 4). Even though physical and mechanical information, including initial location, morphology, and the opening of macro-cracks, was obtained, it is still not convincing enough to investigate the expansion process of cracks and the evolution law of red sandstone failure only by this information. Therefore, the DIC method and the AE technology were adopted for more in-depth research and analysis of the strain field on the specimen’s surface and the expansion characteristics and evolution law of the internal micro-cracks [19,20,21].
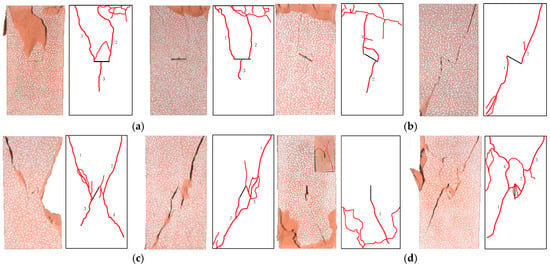
Figure 4.
Failure results of the fractured rock specimens: (a) 0°; (b) 30°; (c) 60°; (d) 90°.
Uniaxial compression experiments were performed on red sandstone specimens with 30° and 60° prefabricated cracks, and the DIC–AE information obtained during the experiments is illustrated from Figure 5, Figure 6, Figure 7 and Figure 8. Taking the specimen with a 30° prefabricated crack as an example, the deformation and failure process can be analyzed in four stages, namely, the crack closure stage I, the linear elastic deformation stage II, the crack expansion stage III, and the post-peak failure stage IV.
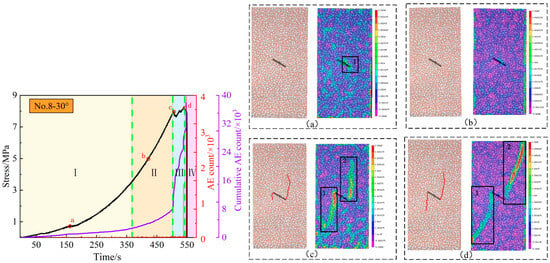
Figure 5.
Stress curves and DIC information of sandstone with a prefabricated 30° crack: (a) Point a; (b) Point b; (c) Point c; (d) Point d.
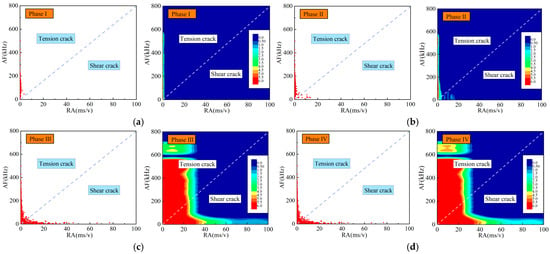
Figure 6.
Rupture modes of sandstone with a prefabricated 30° crack based on the KDE method: (a) Point a; (b) Point b; (c) Point c; (d) Point d.
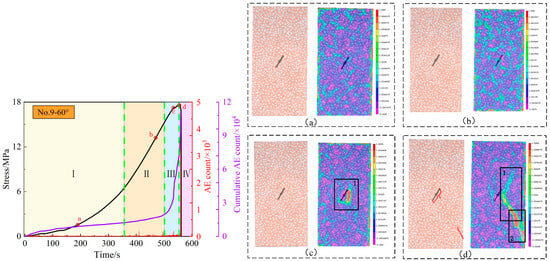
Figure 7.
Stress curves and DIC information of sandstone with a prefabricated 60° crack: (a) Point a; (b) Point b; (c) Point c; (d) Point d.
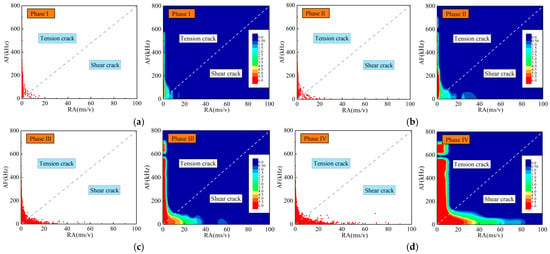
Figure 8.
Rupture modes of sandstone with a prefabricated 60° crack based on the KDE method: (a) Point a; (b) Point b; (c) Point c; (d) Point d.
In crack closure stage I, the stress curve of the specimen is relatively gentle and concave upward, which is mainly caused by the compaction and closure of the micro-cracks and pores in the rock (Point a is a typical location). Meanwhile, the AE count is of a low frequency and a low intensity, the cumulative AE count increases slowly, and only a small number of low RA–high AF signals appear. A relatively concentrated area of strain can be observed at the right end of the prefabricated crack (Region 1 in the cloud image).
In linear elastic deformation stage II, the stress curve is approximately linear. In this stage, new micro-cracks emerge and develop, local elastic deformation occurs, and internal elastic energy accumulates rapidly. Due to the interaction and friction between micro-cracks in the rock mass, the AE count becomes more frequent, the cumulative AE count begins to rise at a higher rate, and a small number of low RA–high AF AE signals and a tiny number of high RA–low AF AE signals appear. At Point b, no obvious cracks or strain changes appear in the digital image or the strain cloud image. At this moment, the specimen contains few internal cracks and is accumulating elastic energy.
In crack expansion stage III, the stress curve fluctuates violently, lasts for a short period, and eventually reaches the specimen’s peak stress. Massive micro-cracks emerge, develop, and expand continuously in the specimen, finally forming penetrating cracks until macro-cracks can be observed. Meanwhile, the AE count becomes frequent with several extremely large values, the cumulative AE count surges accordingly, and many low RA–high AF AE signals and some high RA–low AF AE signals are detected. At Point c, obvious macroscopic cracks have formed on the surface of the specimen, which expand upward and downward from the upper and lower ends of the prefabricated crack, respectively. According to strain distribution in Region 1 and Region 2 in the cloud image, it can be inferred that the two macroscopic cracks will eventually develop into a large, penetrating crack spreading to the corners. At Point d, there are only two macro-cracks that expand upward and downward from the two ends of the prefabricated crack, respectively. However, unlike the image of Point c, the lengths and openings of the macro-cracks at Point d are noticeably larger. It can be observed from the strain cloud image at Point d that the macro-cracks will eventually develop into macroscopic penetrating cracks that extend from the two ends of the prefabricated cracks to the corners.
In the post-peak failure stage IV, the stress curve falls sharply. After the load stress reaches the peak strength of the specimen, severe macroscopic deformation occurs promptly, the deformation ends after the formation of the main fracture’s surface, and the specimen rapidly loses its bearing capacity, leaving no obvious residual strength. Additionally, the AE count is small, and the cumulative AE count peaks at around the peak intensity. Few low RA–high AF AE signals and some high RA–low AF AE signals were acquired.
3.2. DIC Premonitory Information
Figure 9 depicts the principal strain cloud images obtained by the DIC method during the formation, expansion, and connection of macro-cracks on the surface of the red sandstone specimen with a prefabricated 30° crack.
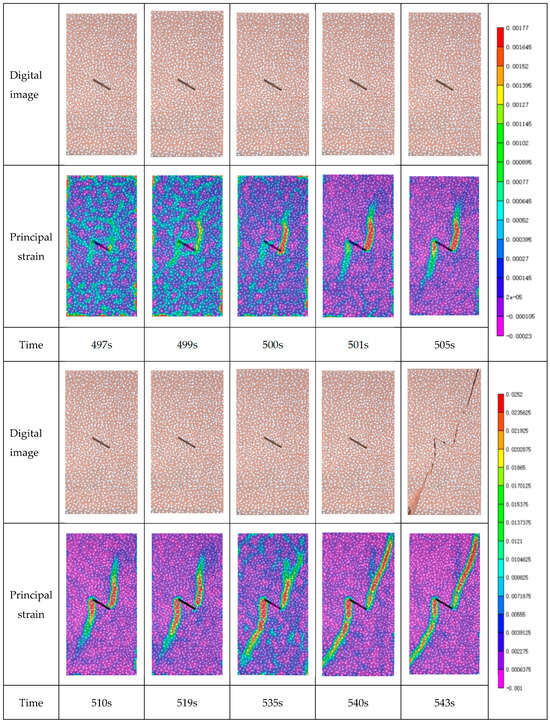
Figure 9.
Variation in the principal strain on the surface of the specimen with a prefabricated 30° crack.
From the beginning of the experiment to 497 s, no obvious cracks formed on the surface of the specimen, the surface strain was dispersed locally, micro-deformation was evenly distributed on the surface, and obvious strain concentration appeared at both ends of the prefabricated crack. At 499 s, the strain concentration at the two ends of the prefabricated crack became more noticeable, and the strain concentration area at the right end expanded to form a large strain zone. At 500 s, the overall local strain dispersion weakened, and the strain was concentrated around the prefabricated crack.
As the compression proceeded, the surface of the specimen fractured along the right end of the prefabricated crack. The specimen suffered macroscopic failure with the appearance of a macro-crack that was still developing and expanding upward. At 505 s, this macro-crack continued to expand along the right end of the prefabricated crack, and a new macro-crack emerged at the left end of the prefabricated crack and developed along the strain concentration area.
The speckle image at 535 s is similar to that at 519 s except for the local strain dispersion in it. At 540 s, the macro-cracks emerging at the two ends of the prefabricated crack continued to expand and develop. The strain field was again concentrated at the two ends of the prefabricated crack, and the smaller dispersed local strain weakened again compared with that at 535 s. The strain fields that spread along the left and right ends of the prefabricated crack to the lower left and upper right corners of the specimen basically formed an outstretched trend, and finally, a “z”-shaped fracture occurred.
Figure 10 shows the principal strain obtained by the DIC method during the formation, expansion, and connection of macro-cracks on the surface of the red sandstone specimen with a prefabricated 60° crack. The failure spread along the upper right end of the prefabricated crack to the strain concentration areas at the upper right and lower right corners of the specimen, respectively, and the overall strain field distribution was x-shaped.
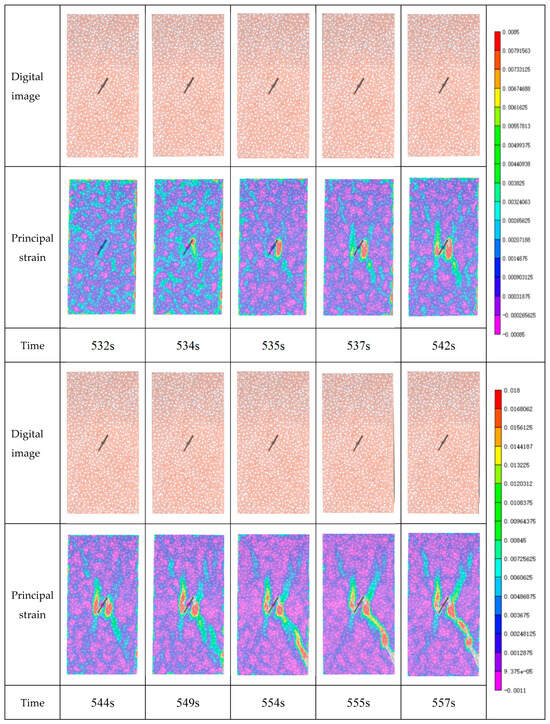
Figure 10.
Variation in the principal strain on the surface of the specimen with a prefabricated 60° crack.
According to the final failure pattern of the two specimens, six points with high correlation between the red sandstone’s surface and the cracking location (i.e., Points a–f) were selected for analysis of the loading process (Figure 11 and Table 1).

Figure 11.
Evolution curves of the principal strain at monitoring points: (a) specimen with a 30° prefabricated crack and (b) specimen with a 60° prefabricated crack.

Table 1.
Comparison of principal strains at monitoring points.
In Figure 11a, for the specimen with a 30° prefabricated crack, the principal strain curve at Point a rose more sharply from 501–510 s as compared with those of the other monitoring points, which is attributed to the emergence of a macro-crack at the corresponding time, according to the digital images and principal strain cloud images in Figure 9. From 501–543 s, this macro-crack emerged at Point a and then developed and expanded along the a–c–e path into a large penetrating crack.
In Figure 11b, for the specimen with the 60° prefabricated crack, the principal strain changed slightly at all the monitoring points before 530 s. At 531 s, the strains at different monitoring points began to present different variation characteristics. Specifically, at Point b, a crack emerged at 532 s and expanded rapidly afterward. At 537 s, the deformation no longer belonged to microscopic deformation, and the curve at Point b ended.
At Point a, a large strain began to appear at 535 s, and the formed crack expanded continuously within 535–549 s. Because the crack that did not expand sufficiently was compacted and squeezed at 549 s and the stress reached its peak at 555 s, a large macroscopic change occurred at Point a at 554 s when the strain curve ended. At Points c and e, the principal strain started to grow slowly and gently at around 535 s, and this trend continued until the final macroscopic failure of the specimen. This demonstrates that the crack, which emerged at Point a (left end of the prefabricated crack), gradually developed and expanded along the a–c–e path.
The principal strains at Points d and f changed differently from those at Points c and e. They began to rise slowly at 535 s and started to soar at around 552 s until the macroscopic failure, indicating that the principal strains at Points d and f changed slightly within 535–552 s. As the stress increased and reached the peak at 555 s, the principal strains at these two points changed notably, and large macroscopic deformation could be observed at this moment.
Overall, the surface-strain field of a typical pre-cracked specimen is dispersed in the initial stage of loading when the specimen remains in the state of elastic deformation. With the increase in load and stress, the deformation mode gradually transforms from elastic deformation to plastic deformation. At this time, strain concentration occurs at the prefabricated crack on the specimen’s surface, and macro-cracks can be observed. With the further expansion of the strain concentration area, the length and opening of the macro-cracks at the two ends of the prefabricated crack increase accordingly until the strain field expands to run through the whole specimen. Finally, penetrating cracks are formed, and tensile-shear mixed failure occurs.
3.3. Analysis on the Premonitory Information of Rock in AE Time-Dependent Dominant Frequency
In this study, parameters including AE count [22,23], RA–AF value, visual density [16], Fourier dominant frequency, and amplitude [24,25] were extracted and analyzed.
According to the relationship between the dominant frequency and the amplitude of red sandstone specimens with prefabricated cracks with different inclination angles, the dominant frequency is divided into three ranges, i.e., 330–400 KHz, 400–460 KHz, and 460–520 KHz, based on the distribution characteristics of the dominant frequencies. They are defined as low frequency (LF), intermediate frequency (IF), and high frequency (HF), respectively (Figure 12). Meanwhile, in the hope of distinguishing different types of AE-dominant frequency signals, five types of AE signals are defined, namely, low frequency–low amplitude (LF–LA), low frequency–high amplitude (LF–HA), intermediate frequency–low amplitude (IF–LA), intermediate frequency-high amplitude (IF–HA), and high frequency-low amplitude (HF–LA) AE signals.
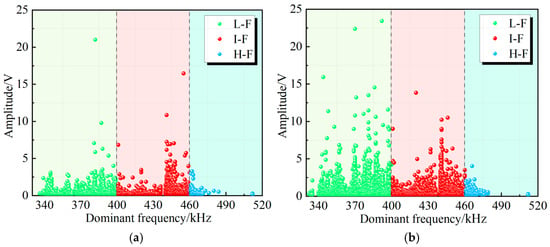
Figure 12.
Band classification of the dominant frequency for red sandstone specimens with prefabricated cracks: (a) No. 8–30° and (b) No. 9–60°.
Figure 13 and Figure 14 depict the distribution of the AE time-dependent dominant frequency and amplitude at different stages in the loading process of red sandstone specimens with 30° and 60° prefabricated cracks. At the initial stage of loading (compaction stage and elastic deformation stage), the primary micro-cracks and pores are compacted and closed, while new micro-cracks continuously emerge, develop, and expand. At this stage, the AE dominant frequency signals are distributed relatively sparsely and are mainly composed of IF–LA and LF–LA signals.
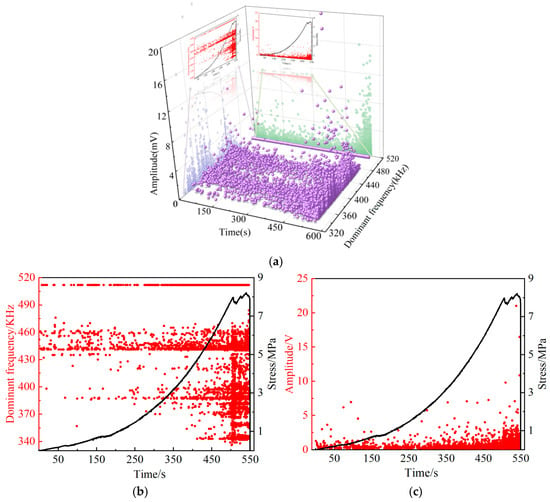
Figure 13.
Distribution of AE time-dependent dominant frequencies and amplitudes in red sandstone specimens with a 30° prefabricated crack: (a) dominant frequencies, (b) amplitude, and (c) 3D distribution points.
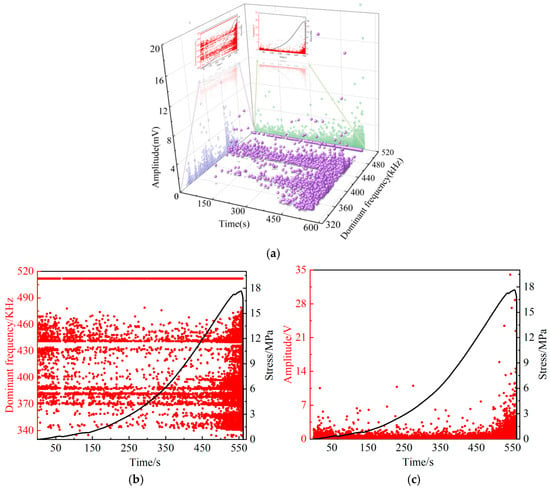
Figure 14.
Distribution of AE time-dependent dominant frequencies and amplitudes in red sandstone specimens with a 60° prefabricated crack: (a) dominant frequencies, (b) amplitude, and (c) 3D distribution points.
Figure 13a and Figure 14a mainly provide three-dimensional diagrams established based on the corresponding relationships among the dominant frequency, amplitude, and time. The dominant frequency and amplitude are frequency-domain signals converted from time-domain signals through FFT. Because frequency-domain signals do not vary with time, they appear quite similar along the time axis in Figure 13 and Figure 14. Time-domain analysis can intuitively reflect the dominant frequency and amplitude of AE signals, while frequency-domain analysis allows for a clear observation of the frequency at which the highest amplitude occurs. In Figure 13b and Figure 14b, the dominant frequency does not change over time. That is, both the high and low values of the dominant frequency occur throughout the loading process. However, high amplitudes only appear when the specimen is about to fail, which is a detail that cannot be obtained from time-domain signals.
From the yield stage to the final failure, micro-cracks in rock continuously emerge, develop, and expand. They keep squeezing each other and finally connect into macro-cracks. Resultantly, the LF, IF, and HF dominant frequency signals are all concentrated at this stage. After stress reaches its peak strength in red sandstone, massive internal cracks expand and interconnect into macro-cracks, and macroscopic damage and deformation occur, finally leading to overall failure. Additionally, this stage primarily witnesses the appearance of a small number of IF–HA and LF–HA signals.
In summary, different failure stages of red sandstone exhibit different types of AE dominant frequency signals during the cracking process. Thus, the types of AE dominant frequency signals can be taken as effective references for predicting rock instability deformation.
4. Multi-Source Monitoring Function Based on DIC–AE Fusion
Comparative analysis of the stress–strain curves, the surface strain fields from the digital images, and the AE monitoring signals during the failure process discloses that various and multi-source information is closely related to each stage of red sandstone failure, and their variations are consistent to some extent [26,27,28]. The global strain field, AE count, RA/AF value, dominant frequency, and corresponding amplitude can dynamically reflect the information on crack formation, stress concentration around cracks, surface strain localization, and the overall mechanical properties of the specimens.
4.1. Establishment of Multi-Source Monitoring Function
The failure process of red sandstone specimens is accompanied by the synergistic response of multiple sources, such as surface strain fields and AE signals. Considering different dimensions of these information parameters, the multi-source information is processed by the normalization method to eliminate the dimensional differences. After being normalized, the multi-source data are converted into dimensionless scalars, which makes it easier to comparatively analyze different units and indexes of different orders of magnitude.
In this study, max–min normalization is adopted to normalize multi-source data, as expressed by the following:
where is the normalized function value of the monitoring data, k is the ordinal number of parameters of different multi-source information, and [min, max] is the value range of the monitoring data.
For the purpose of characterizing the dynamic evolution of the multi-source information of red sandstone over time, the multi-source monitoring data in the failure process are fitted and analyzed, and a polynomial function is constructed. The fitting function is:
where i in can be 1, 2… 7, respectively; f1(x) is the standard deviation function of the horizontal strain field; f2(x) is the standard deviation function of the vertical strain field; f3(x) is the standard deviation function of the shear strain field; f4(x) is the cumulative AE count; f5(x) is the cumulative AE RA/AF value; f6(x) is the cumulative AE dominant frequency; f7(x) is the amplitude corresponding to the cumulative AE dominant frequency; and aij is the coefficient of the fitting function.
The fitted multi-source information curves are illustrated in Figure 15.
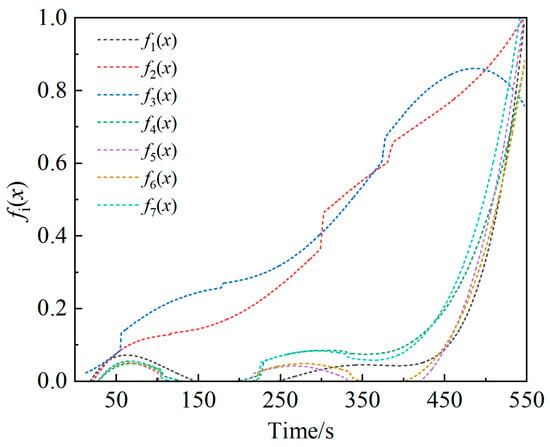
Figure 15.
Function curves of the multi-source information.
The value aij of the fitting function is:
The parameters of the fitting function for the seven multi-source information indexes are listed in Table 2, where R2 characterizes the fitting degree of the fitting function. The closer the value of R2 is to 1, the higher the fitting degree is. In Table 2, the R2 values of f1(x) − f7(x) are 0.9869, 0.9954, 0.9415, 0.9749, 0.9108, 0.9358, and 0.9693, respectively, indicating that the polynomial function has an ideal fitting degree.

Table 2.
Parameters of the fitting function.
4.2. Analysis on Premonitory Information Based on DIC–AE Fusion
During the loading and failure processes of red sandstone specimens, the fitting function values of the multi-source information change nonlinearly (Figure 16). By comparing the stress–strain curves and the multi-source information function curves during the failure process, it was found that the points at which the concavity and monotonicity of the multi-source information function curves change may be the dividing points between different failure stages.
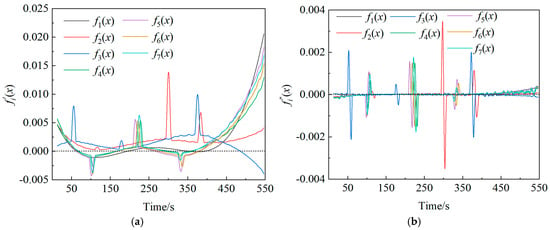
Figure 16.
Derivation curves of the multi-source information: (a) first-order derivative image and (b) second-order derivative image.
In order to further explore the change of the multi-source information function and characterize the process and law of red sandstone failure, the first-order and second-order derivatives of the function were worked out. The curves of the first-order and second-order derivative functions are presented in Figure 16. When the curves of the derivative functions intersect the X-axis, the value of the derivative function is 0. This intersection represents a stagnation point or an inflection point.
By comparing the first-order and second-order derivative functions, it can be seen that functions f1(x) − f7(x) all have extreme points and inflection points. Subsequently, the failure stages are divided according to the extreme points and inflection points in the derivation functions, and the time points were modified. The modified stage division results are listed in Table 3. The premonitory characteristics of the specimens can be divided into four stages. To be specific, Stage I witnesses the closure of primary cracks at the initial stage of loading; Stage II is the precursor to the stable development into the elastic stage; Stage III is the precursor of the transition from the elastic stage to the nonlinear development stage; and Stage IV is the precursor of the overall failure. On this basis, red sandstone failure can be forewarned by levels. In Figure 17, the divided stages are combined with the stress–strain curves of the specimens. As depicted in Figure 17, Stages II and III last relatively longer, during which the specimens experience the transition from the elastic stage to the crack expansion stage and accumulate energy for the upcoming failure. Stages I and IV occupy a smaller proportion of the time. Stage IV represents the process in which the cracks gradually develop and expand to reach the limit that the specimens can bear, leading to their rapid failure. This stage corresponds to the crack expansion and post-peak failure stages during red sandstone failure. Hence, it is of great significance to focus on the monitoring and forewarning of Stages III and IV.

Table 3.
Classification of the failure stages of specimens.
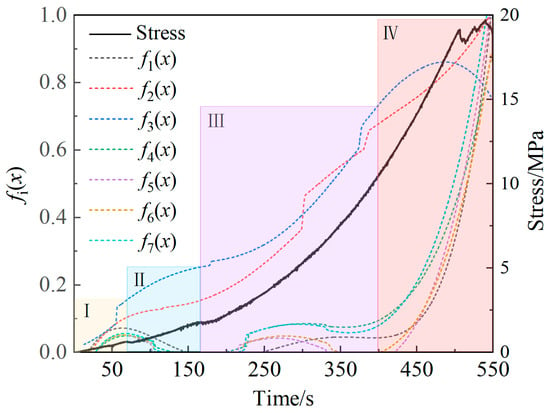
Figure 17.
Failure stages of the specimens.
According to the results of the derivative functions, it was determined that the premonitory limit time when the specimens enter the failure period (Stage IV) is 398 s. In comparison, the experimental results show that the macroscopic crack expansion appears at 502 s and that the overall failure occurs at 543 s when the bearing limit is reached (Table 4). The initial crack expansion time and failure limit time measured by the derivative functions advance by 20.72% and 26.71%, respectively. The time node obtained by multi-source information fusion monitoring, which is remarkably earlier than the time node of the actual macroscopic failure, can be utilized as the premonitory information for forewarning the specimen failure.

Table 4.
Relation between the premonitory limit and the bearing limit in the failure stages.
5. Conclusions
(1) Based on the DIC method, the failure process of red sandstone specimens with different prefabricated cracks under compression was investigated. The results reveal that obvious premonitory failure information, such as strain concentration areas, appears on the specimen surface before the macro-cracks can be observed, and the obtained premonitory failure information is consistent with the emergence and expansion morphology of the macro-cracks observed later.
(2) RA–AF signals generated during red sandstone failure indicate that as the inclination angle of the prefabricated crack in red sandstone increases, the macroscopic deformation and failure mode gradually transforms from tensile splitting failure to tensile-shear mixed failure. The HF–LA, IF–LA, and LF–LA dominant frequency signals are denser around the stress peak, while the IF–HA and HF–LA dominant frequency signals only appear near the macroscopic failure of specimens.
(3) A comprehensive evaluation method based on multi-source information fusion monitoring was established. The initial crack expansion time and failure limit time obtained by the derivative function of the multi-source information function advanced by 20.72% and 26.71%, respectively, suggesting that the forewarning of red sandstone failure by levels is realized with multi-source information fusion.
Next, this study will continue to conduct DIC–AE fusion data analysis on other coal and rock specimens in the hope of achieving the graded early warning of precursor signals prior to the failure of different coal and rock masses.
Author Contributions
Conceptualization and methodology, Z.C.; experiment and validation, G.Q.; data curation, Q.Y. and X.L. supervision, All authors have read and agreed to the published version of the manuscript.
Funding
This paper was funded by the Key Research and Development Program of Xuzhou (KC23292) and the Open Fund of the Key Laboratory of Deep Earth Science and Engineering (Sichuan University) (DUSE202306).
Institutional Review Board Statement
Not applicable.
Informed Consent Statement
Not applicable.
Data Availability Statement
The original contributions presented in this study are included in the article. Further inquiries can be directed to the corresponding author.
Conflicts of Interest
The authors declare no conflicts of interest.
References
- Xu, J.; Zhou, R.; Song, D.; Li, N.; Zhang, K.; Xi, D. Deformation and damage dynamic characteristics of coal–rock materials in deep coal mines. Int. J. Damage Mech. 2017, 28, 58–78. [Google Scholar] [CrossRef]
- Zhang, Q.; Zheng, T.; Wang, X.; Fang, Z. Multi-Source Information Monitoring Test of Fractured Rock Mass Destruction Characteristics and Sensitivity Analysis of Precursor Phenomena. Energies 2022, 15, 538. [Google Scholar] [CrossRef]
- Qin, L.; Zhai, C.; Liu, S.; Xu, J. Mechanical behavior and fracture spatial propagation of coal injected with liquid nitrogen under triaxial stress applied for coalbed methane recovery. Eng. Geol. 2018, 233, 1–10. [Google Scholar] [CrossRef]
- Yang, S.-Q.; Jing, H.-W. Strength failure and crack coalescence behavior of brittle sandstone samples containing a single fissure under uniaxial compression. Int. J. Fract. 2010, 168, 227–250. [Google Scholar] [CrossRef]
- Yang, S.; Zhao, H.; Qu, T. Microscopic test and simulation of crack growth in marble with single cavity. J. China Univ. Min. Technol. 2009, 38, 774–781. [Google Scholar]
- Zhong, K.; Zhao, W.; Qin, C.; Gao, H.; Chen, W. Mechanical Properties of Roof Rocks under Superimposed Static and Dynamic Loads with Medium Strain Rates in Coal Mines. Appl. Sci. 2021, 11, 8973. [Google Scholar] [CrossRef]
- Lu, H.; Chen, Q.; Ma, X. Investigation into Dynamic Behaviors of High-Temperature Sandstone under Cyclic Impact Loading Using DIC Technology. Appl. Sci. 2022, 12, 9247. [Google Scholar] [CrossRef]
- Zhao, X.G.; Cai, M.; Wang, J.; Li, P.F.; Ma, L.K. Objective Determination of Crack Initiation Stress of Brittle Rocks Under Compression Using AE Measurement. Rock Mech. Rock Eng. 2015, 48, 2473–2484. [Google Scholar] [CrossRef]
- Kong, B.; Wang, E.; Li, Z.; Wang, X.; Liu, J.; Li, N. Fracture Mechanical Behavior of Sandstone Subjected to High-Temperature Treatment and Its Acoustic Emission Characteristics Under Uniaxial Compression Conditions. Rock Mech. Rock Eng. 2016, 49, 4911–4918. [Google Scholar] [CrossRef]
- Muñoz-Ibáñez, A.; Delgado-Martín, J.; Grande-García, E. Acoustic emission processes occurring during high-pressure sand compaction. Geophys. Prospect. 2018, 67, 761–783. [Google Scholar] [CrossRef]
- Zhao, K.; Yang, D.; Gong, C.; Zhuo, Y.; Wang, X.; Zhong, W. Evaluation of internal microcrack evolution in red sandstone based on time–frequency domain characteristics of acoustic emission signals. Constr. Build. Mater. 2020, 260, 120435. [Google Scholar] [CrossRef]
- Niu, Y.; Zhou, X.-P.; Berto, F. Temporal dominant frequency evolution characteristics during the fracture process of flawed red sandstone. Theor. Appl. Fract. Mech. 2020, 110, 102838. [Google Scholar] [CrossRef]
- Chen, G.; Zhang, Y.; Li, Y. The information chain of thermal-acoustic precursors of rock failure under true triaxial loading. Chin. J. Rock Mech. Eng. 2021, 40, 1764–1776. [Google Scholar]
- Tao, Z.; Zhu, C.; He, M.; Karakus, M. A physical modeling-based study on the control mechanisms of Negative Poisson’s ratio anchor cable on the stratified toppling deformation of anti-inclined slopes. Int. J. Rock Mech. Min. Sci. 2021, 138, 104632. [Google Scholar] [CrossRef]
- Zhang, C.; Yuan, L.; Fang, Z.; Ma, Y.; Yang, Y.; Li, L. Failure law and early warning method of rocklike materials with fractures based on multivariate monitoring information fusion. J. Min. Saf. Eng. 2022, 39, 797–807. [Google Scholar]
- Chong, Z.; Yao, Q.; Li, X.; Yan, L.; Su, F. Effects of cyclic freeze-thaw by liquid nitrogen on the coal breakage properties and fragment size distribution. Int. J. Damage Mech. 2022, 31, 999–1026. [Google Scholar] [CrossRef]
- Munoz, H.; Taheri, A.; Chanda, E.K. Pre-Peak and Post-Peak Rock Strain Characteristics During Uniaxial Compression by 3D Digital Image Correlation. Rock Mech. Rock Eng. 2016, 49, 2541–2554. [Google Scholar] [CrossRef]
- Shirole, D.; Hedayat, A.; Walton, G. Damage monitoring in rock specimens with pre-existing flaws by non-linear ultrasonic waves and digital image correlation. Int. J. Rock Mech. Min. Sci. 2021, 142, 104758. [Google Scholar] [CrossRef]
- Liu, C.; Yao, D.; Zhang, P.; Ou, Y.; Lin, J.; Tian, Y.; Xu, X. Deformation and Damage Characteristics of Deep Rock Specimens Based on 3D-DIC and FBG. Lithosphere 2022, 2022, 4329713. [Google Scholar] [CrossRef]
- Li, Y.-P.; Chen, L.-Z.; Wang, Y.-H. Experimental research on pre-cracked marble under compression. Int. J. Solids Struct. 2005, 42, 2505–2516. [Google Scholar] [CrossRef]
- Moradian, Z.; Einstein, H.H.; Ballivy, G. Detection of Cracking Levels in Brittle Rocks by Parametric Analysis of the Acoustic Emission Signals. Rock Mech. Rock Eng. 2015, 49, 785–800. [Google Scholar] [CrossRef]
- Wang, G.; Zhang, Y.; Jiang, Y.; Liu, P.; Guo, Y.; Liu, J.; Wang, S. Shear Behaviour and Acoustic Emission Characteristics of Bolted Rock Joints with Different Roughnesses. Rock Mech. Rock Eng. 2018, 51, 1885–1906. [Google Scholar] [CrossRef]
- Li, D.; Wang, E.; Kong, X.; Jia, H.; Wang, D.; Muhammad, A. Damage precursor of construction rocks under uniaxial cyclic loading tests analyzed by acoustic emission. Constr. Build. Mater. 2019, 206, 169–178. [Google Scholar]
- Du, K.; Li, X.; Tao, M.; Wang, S. Experimental study on acoustic emission (AE) characteristics and crack classification during rock fracture in several basic lab tests. Int. J. Rock Mech. Min. Sci. 2020, 133, 104411. [Google Scholar] [CrossRef]
- Zhang, Z.-H.; Deng, J.-H.; Zhu, J.-B.; Li, L.-R. An Experimental Investigation of the Failure Mechanisms of Jointed and Intact Marble under Compression Based on Quantitative Analysis of Acoustic Emission Waveforms. Rock Mech. Rock Eng. 2018, 51, 2299–2307. [Google Scholar] [CrossRef]
- Shen, R.; Li, H.; Wang, E.; Chen, T.; Li, T.; Tian, H.; Hou, Z. Infrared radiation characteristics and fracture precursor information extraction of loaded sandstone samples with varying moisture contents. Int. J. Rock Mech. Min. Sci. 2020, 130, 104344. [Google Scholar] [CrossRef]
- Feng, X.; Ding, Z.; Ju, Y.; Zhang, Q.; Ali, M. “Double Peak” of Dynamic Strengths and Acoustic Emission Responses of Coal Masses Under Dynamic Loading. Nat. Resour. Res. 2022, 31, 1705–1720. [Google Scholar] [CrossRef]
- Wang, Y.; Han, J.; Xia, Y.; Long, D. New insights into the fracture evolution and instability warning predication for fissure-contained hollow-cylinder granite with different hole diameter under multi-stage cyclic loads. Theor. Appl. Fract. Mech. 2022, 119, 103363. [Google Scholar] [CrossRef]
Disclaimer/Publisher’s Note: The statements, opinions and data contained in all publications are solely those of the individual author(s) and contributor(s) and not of MDPI and/or the editor(s). MDPI and/or the editor(s) disclaim responsibility for any injury to people or property resulting from any ideas, methods, instructions or products referred to in the content. |
© 2025 by the authors. Licensee MDPI, Basel, Switzerland. This article is an open access article distributed under the terms and conditions of the Creative Commons Attribution (CC BY) license (https://creativecommons.org/licenses/by/4.0/).