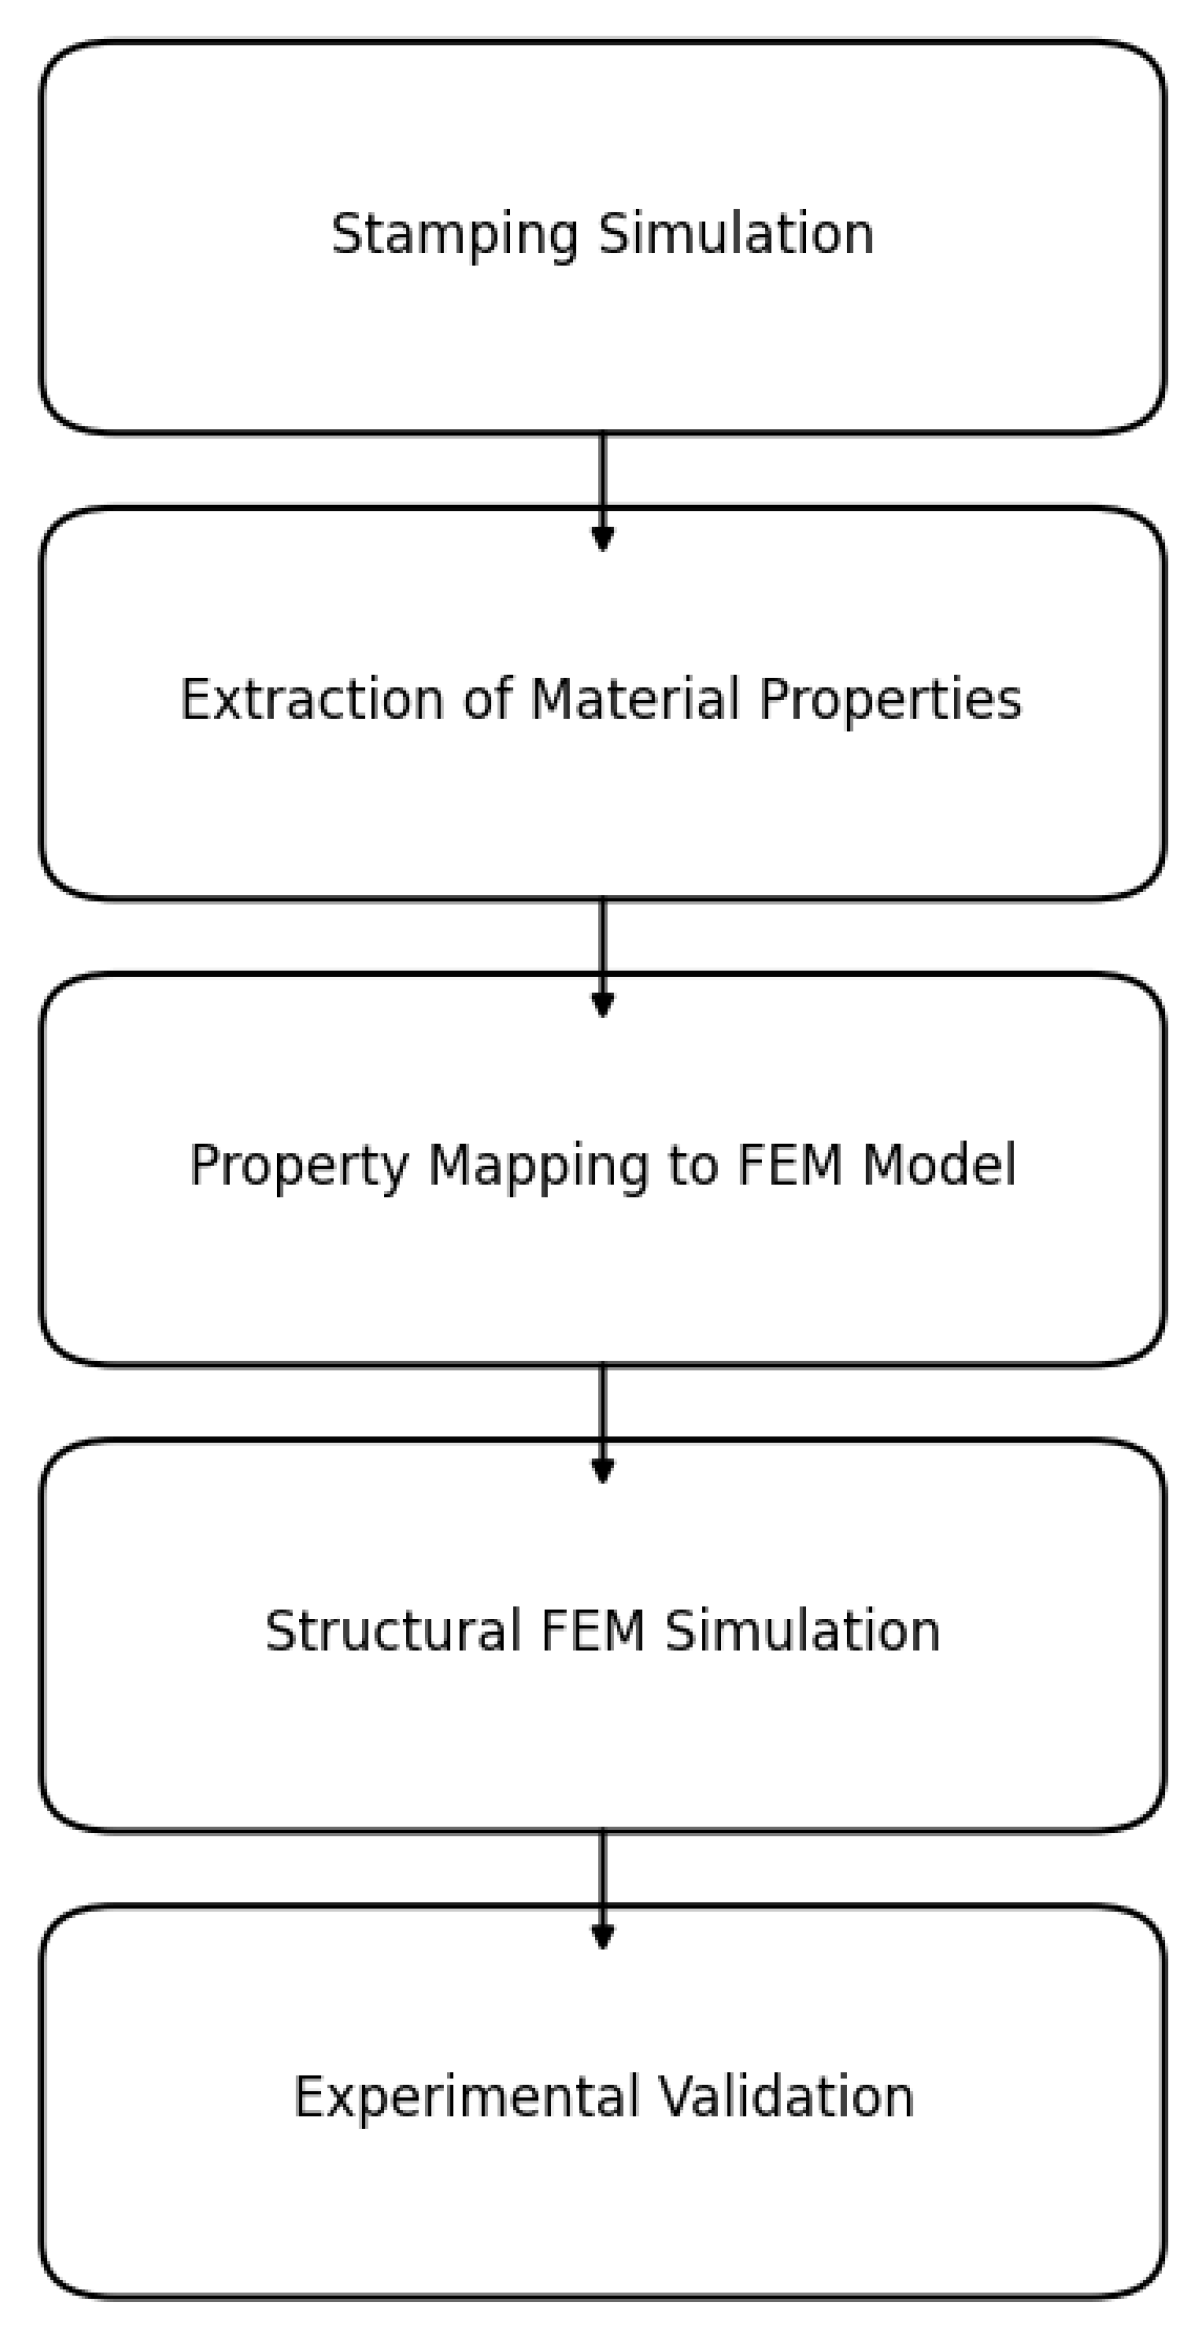
4.1. Simulation
Based on the seat geometry and material property distribution obtained from the stamping forming in
Section 3, a structural FEM model was developed to conduct a virtual verification of structural performance and simulate the static and dynamic tests required by the AFNOR NF F 31-119 and EN 12663-1 standards [
24,
27]. The AFNOR NF F 31-119 standard defines the test conditions for approving both passenger and driver seats, applying conventional loads at specific points on the seat. Conversely, the EN 12663-1 standard provides guidelines for additional equipment and their fixation, with loads applied at the center of gravity and scaled proportionally to the total weight of the seat, including the occupant. For the tests focusing solely on the sheet-metal part, the AFNOR NF F 31-119 standard was used as the primary reference.
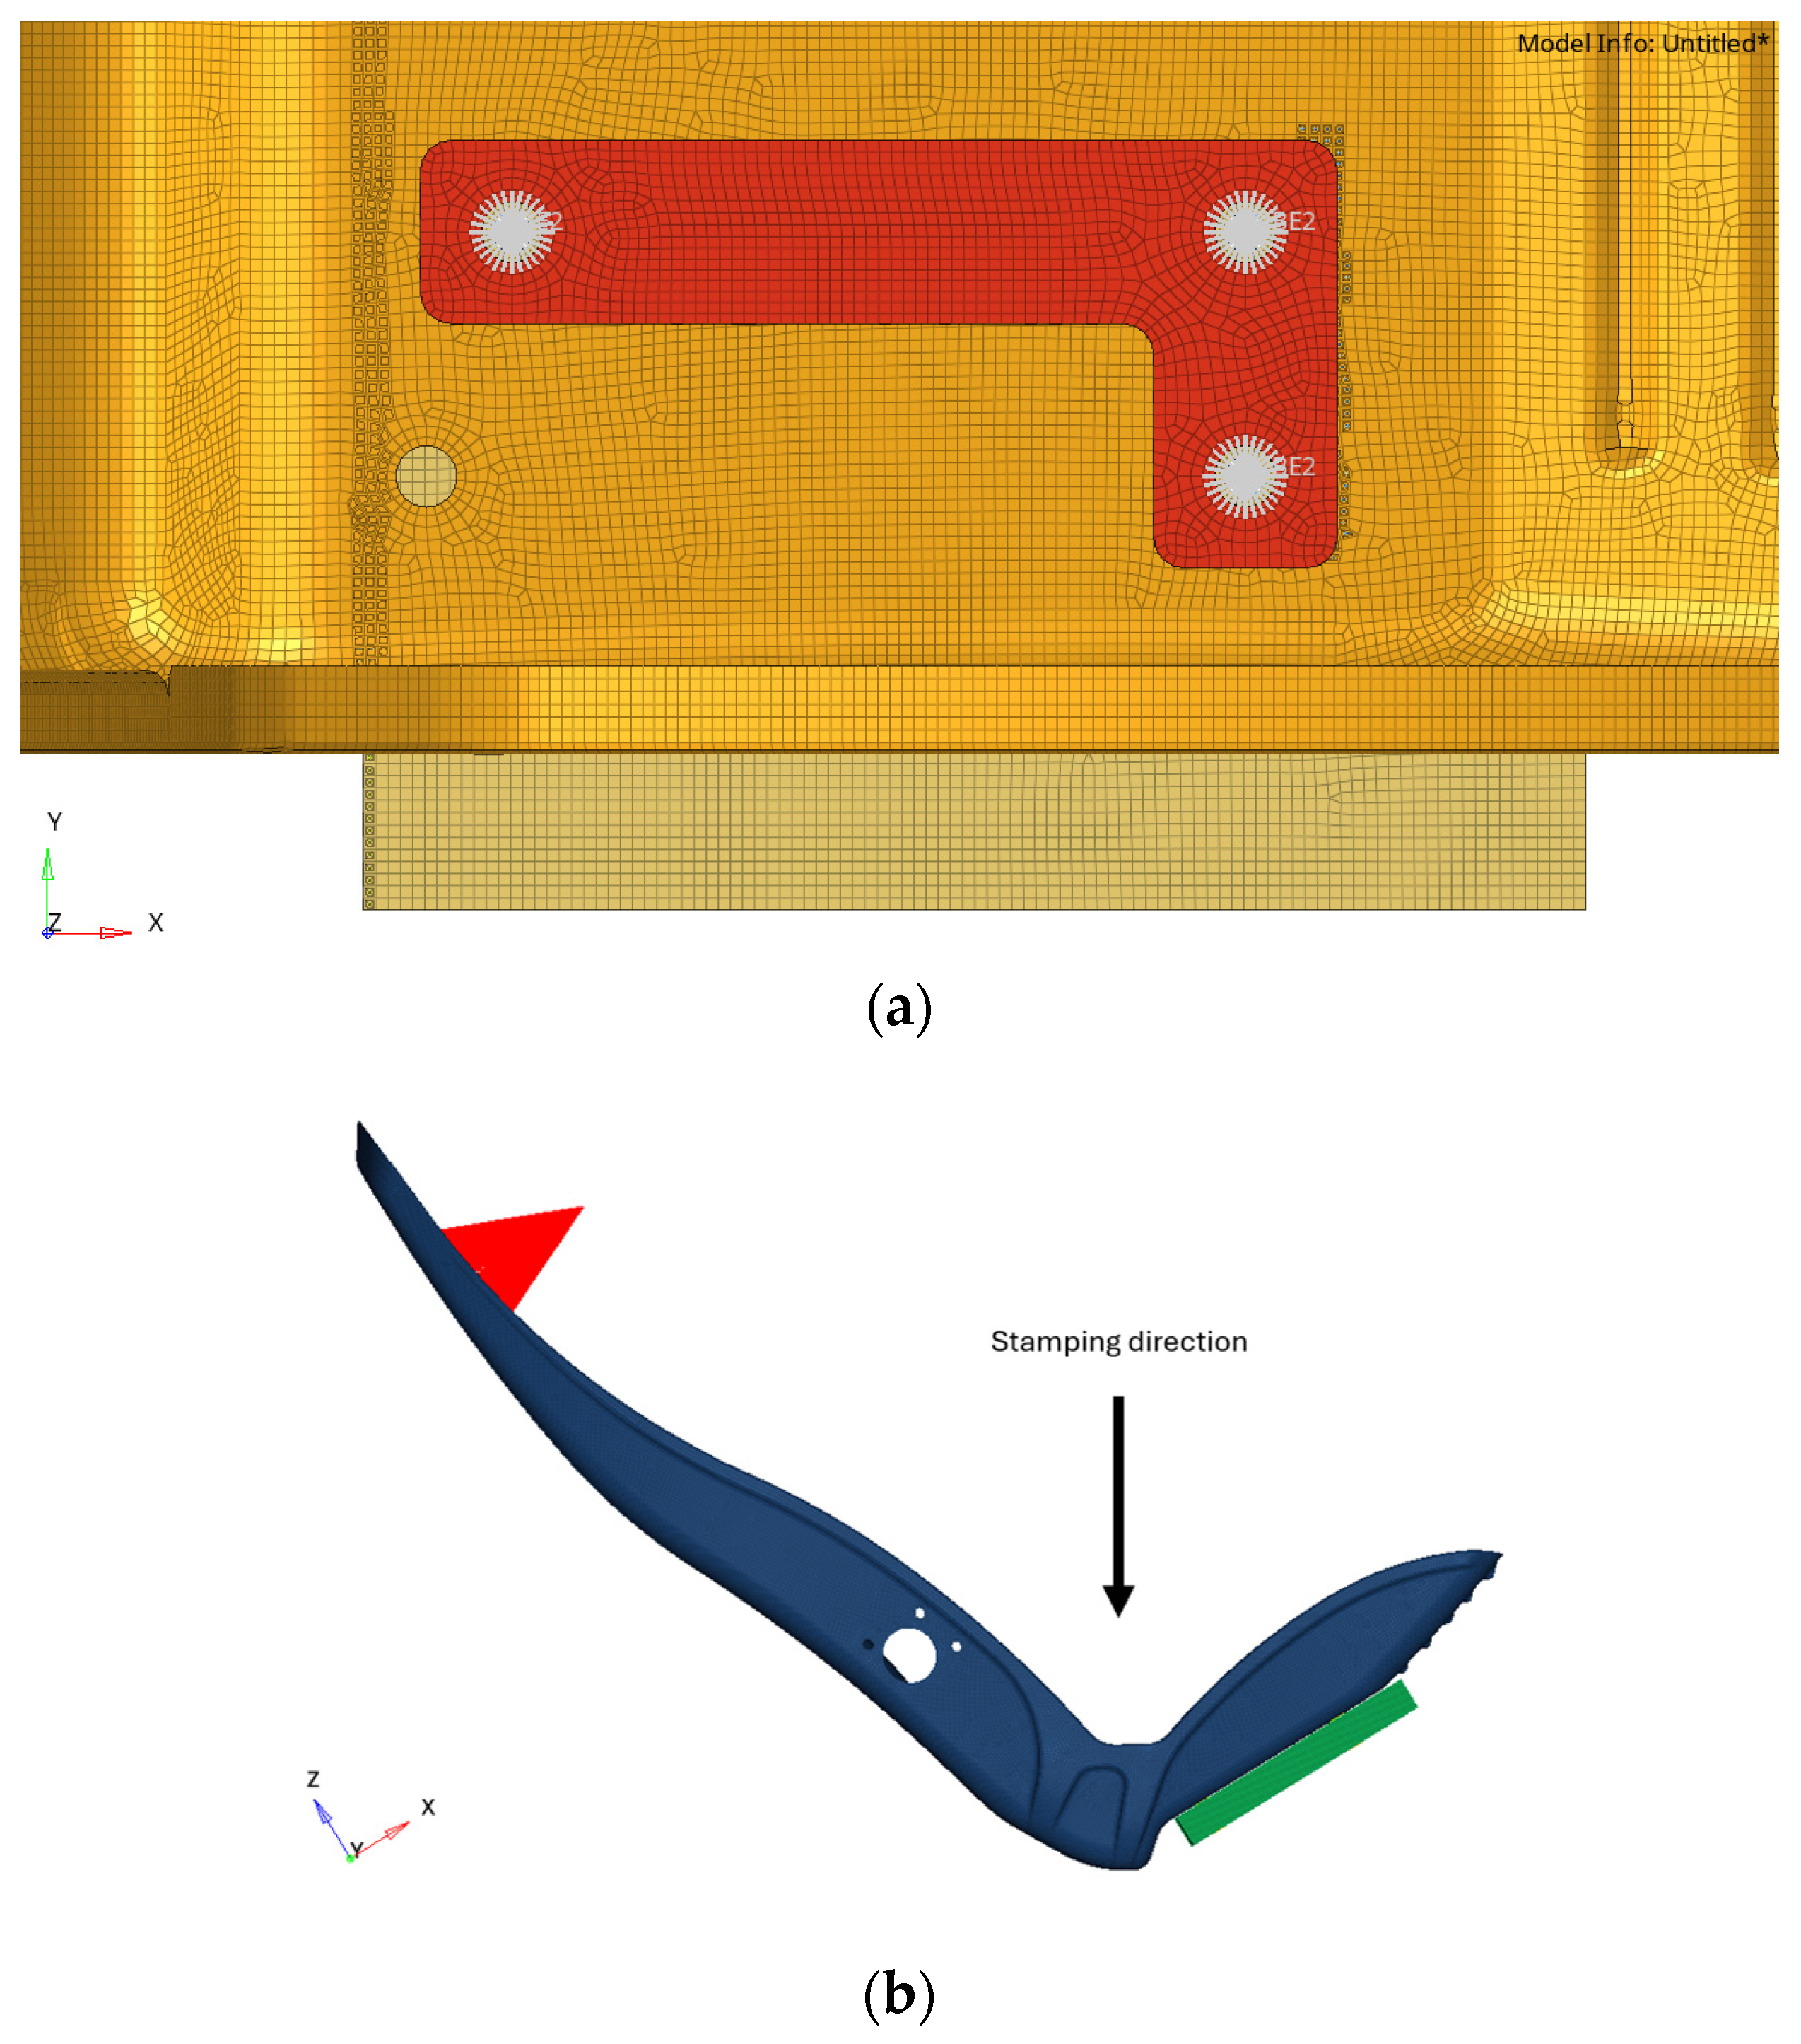
The test procedure defined by the AFNOR NF F 31-119 standard involves applying a constant force of 1500 N to the center of the upper backrest in a front-to-back direction, as shown in
Figure 8. The yellow sheet-metal seat is bolted to the red base floor of the test room using six virtual screws, while vertical movements are restricted by purple L-plates connected to the base. The load is applied via a blue pad, simulating realistic loading conditions. This setup tests the unreinforced sheet-metal part under particularly high forces, pushing it to the limits of its structural integrity. In the stamping simulation, the holes in the component remain unfilled, as these regions are critical for capturing stress concentrations and serve as interfaces for connections or constraints. Around these holes, elements are thickened to form washers, enhancing local stiffness and accommodating increased stress. The meshing process begins with a two-dimensional (2D) mesh created on one face of the component. Using the Solidmap tool, this mesh is extruded into a 3D hexahedral (brick) element mesh, providing precise geometric representation and ensuring accurate stress and deformation analysis during simulation.
Table 3 summarizes the material properties and mathematical models used for different structural components, including steel sheet-metal, solid parts, and M8 screws.
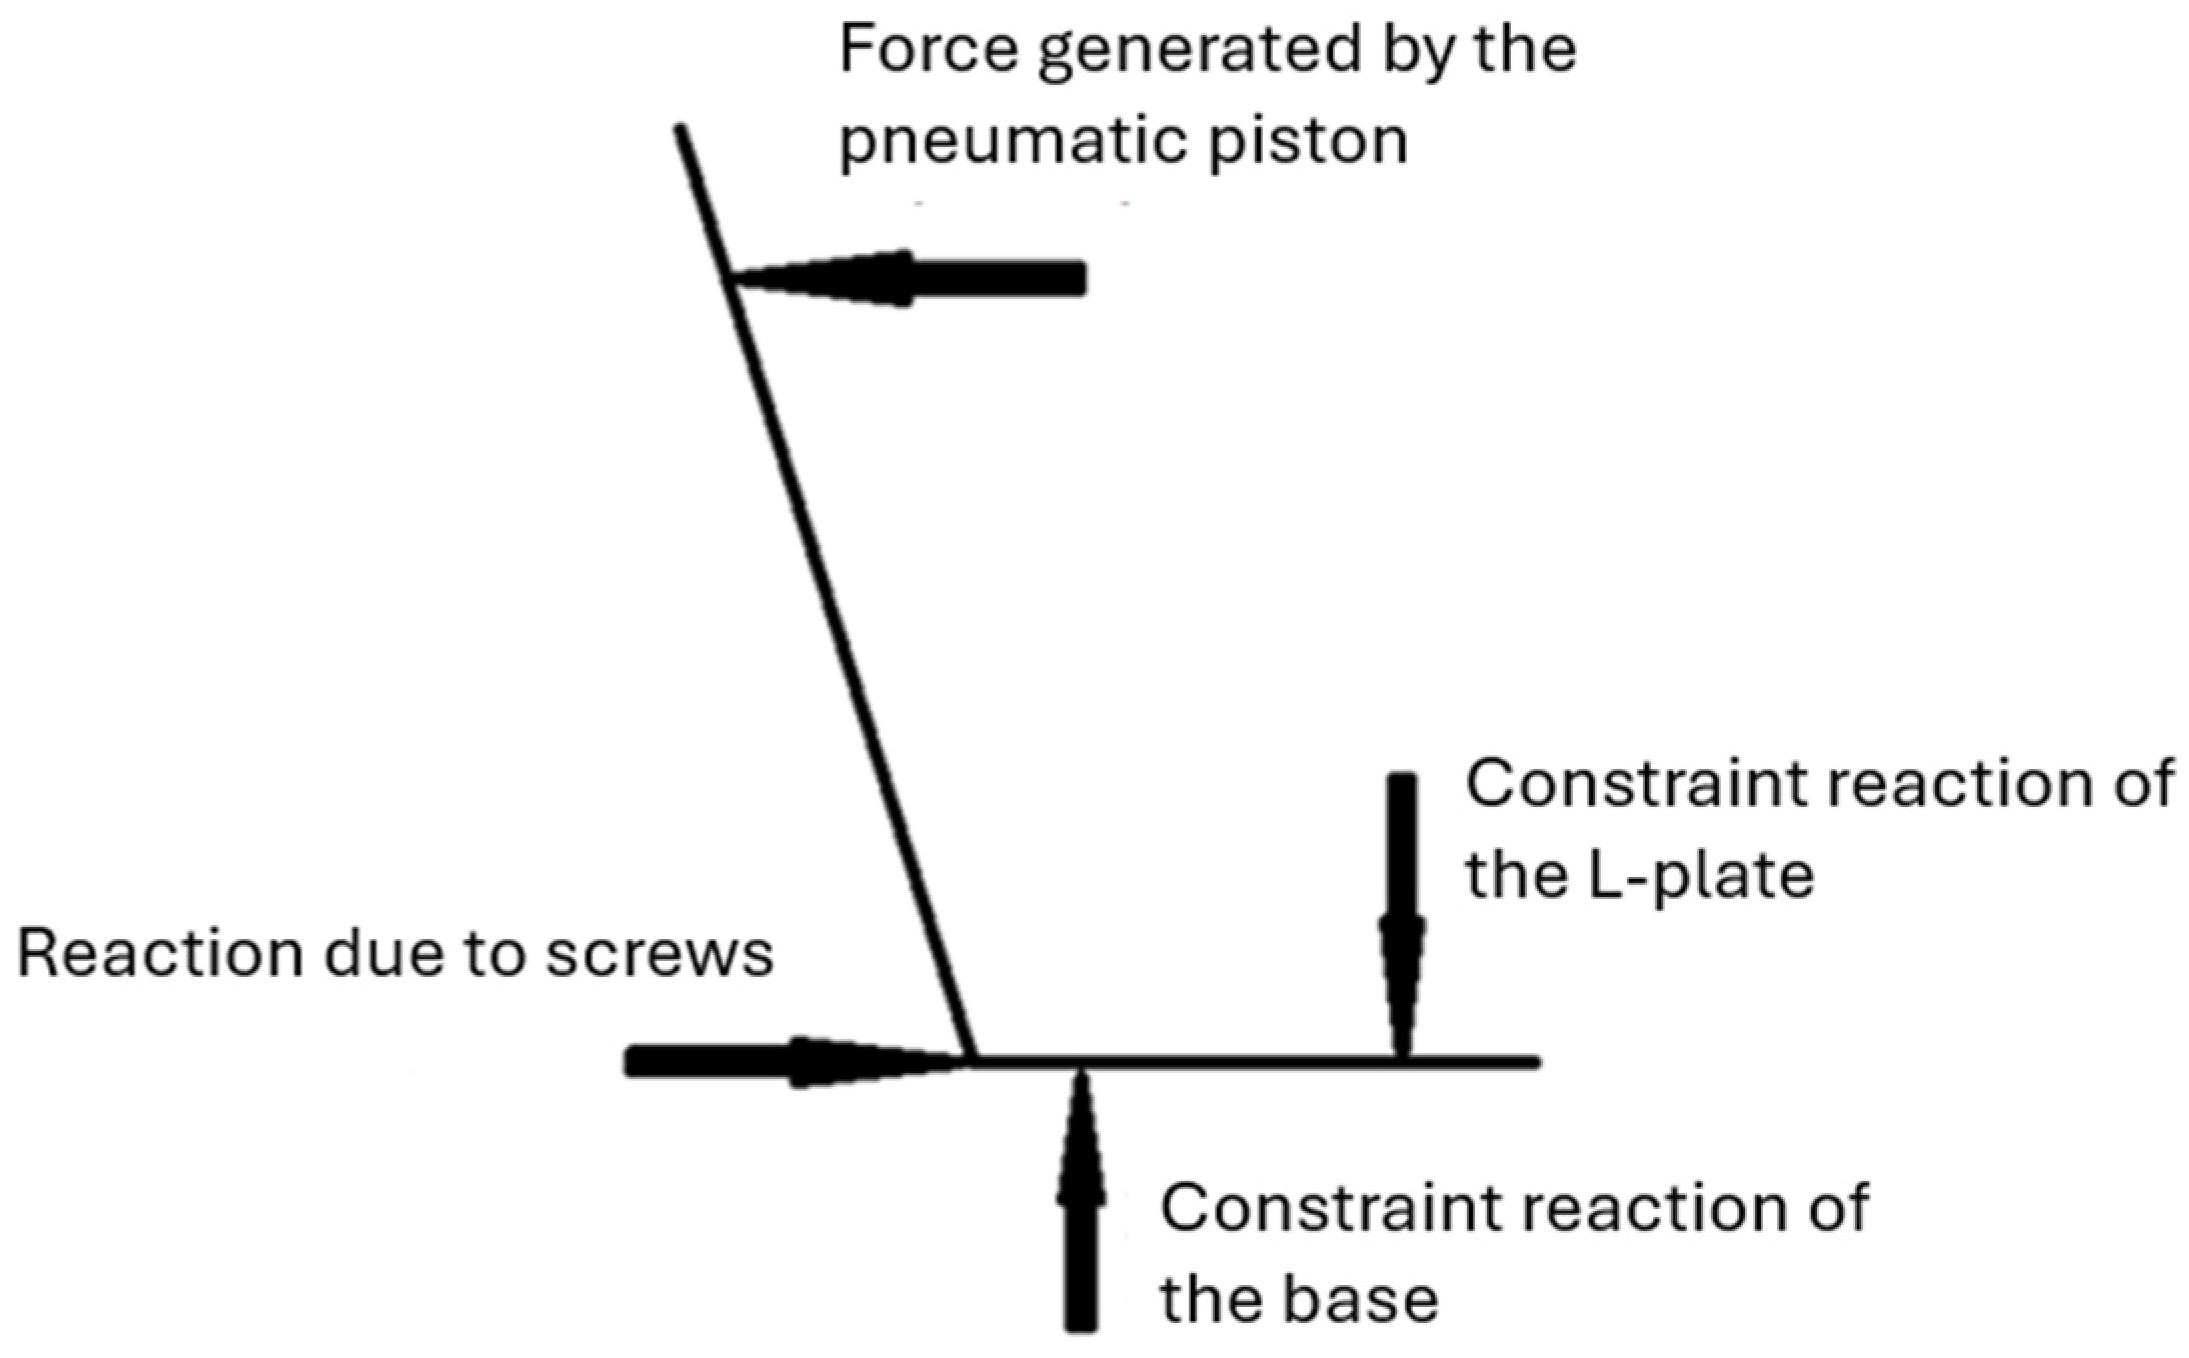
Figure 9 illustrates the balance of forces and reactions on the seat’s sheet-metal. A blocked constraint contact, simulating a welded connection between components, significantly increases stiffness, effectively treating the seat as if it were welded to the base. The base, with a thickness of 20 mm, is modeled as particularly rigid. However, this type of contact overlooks stress hot spots, especially those near the edge of the base and the L-Plate, where constraint reactions occur. In practice, the screws do not create constraint reactions but instead generate significant friction forces through tightening, which induce large reaction forces between the components. In the FEM model, relative translation along the
X-axis between the body and the L-Plate is constrained using a TIE contact. This contact is connected to the base through Beam and RBE2 elements, ensuring that it remains rigidly constrained. The nonlinear modeling captures these behaviors, providing a more realistic representation of stress distributions and yielding in critical regions.
The structural analysis involves two primary loads: a force applied along the negative X-direction and the gravitational force. The gravitational force primarily serves to simulate springback behavior in the unloaded state, ensuring that the model reflects real-world relaxation effects post-deformation. Constraints were applied to the plate by selecting all nodes on its lower surface and blocking translations in the X, Y, and Z directions, as detailed in
Table 4. This constraint setup accurately represents the physical conditions of the test, allowing the model to simulate the component’s response under applied loads while maintaining stability and structural integrity during the analysis.
Table 5 also summarizes the loading details.
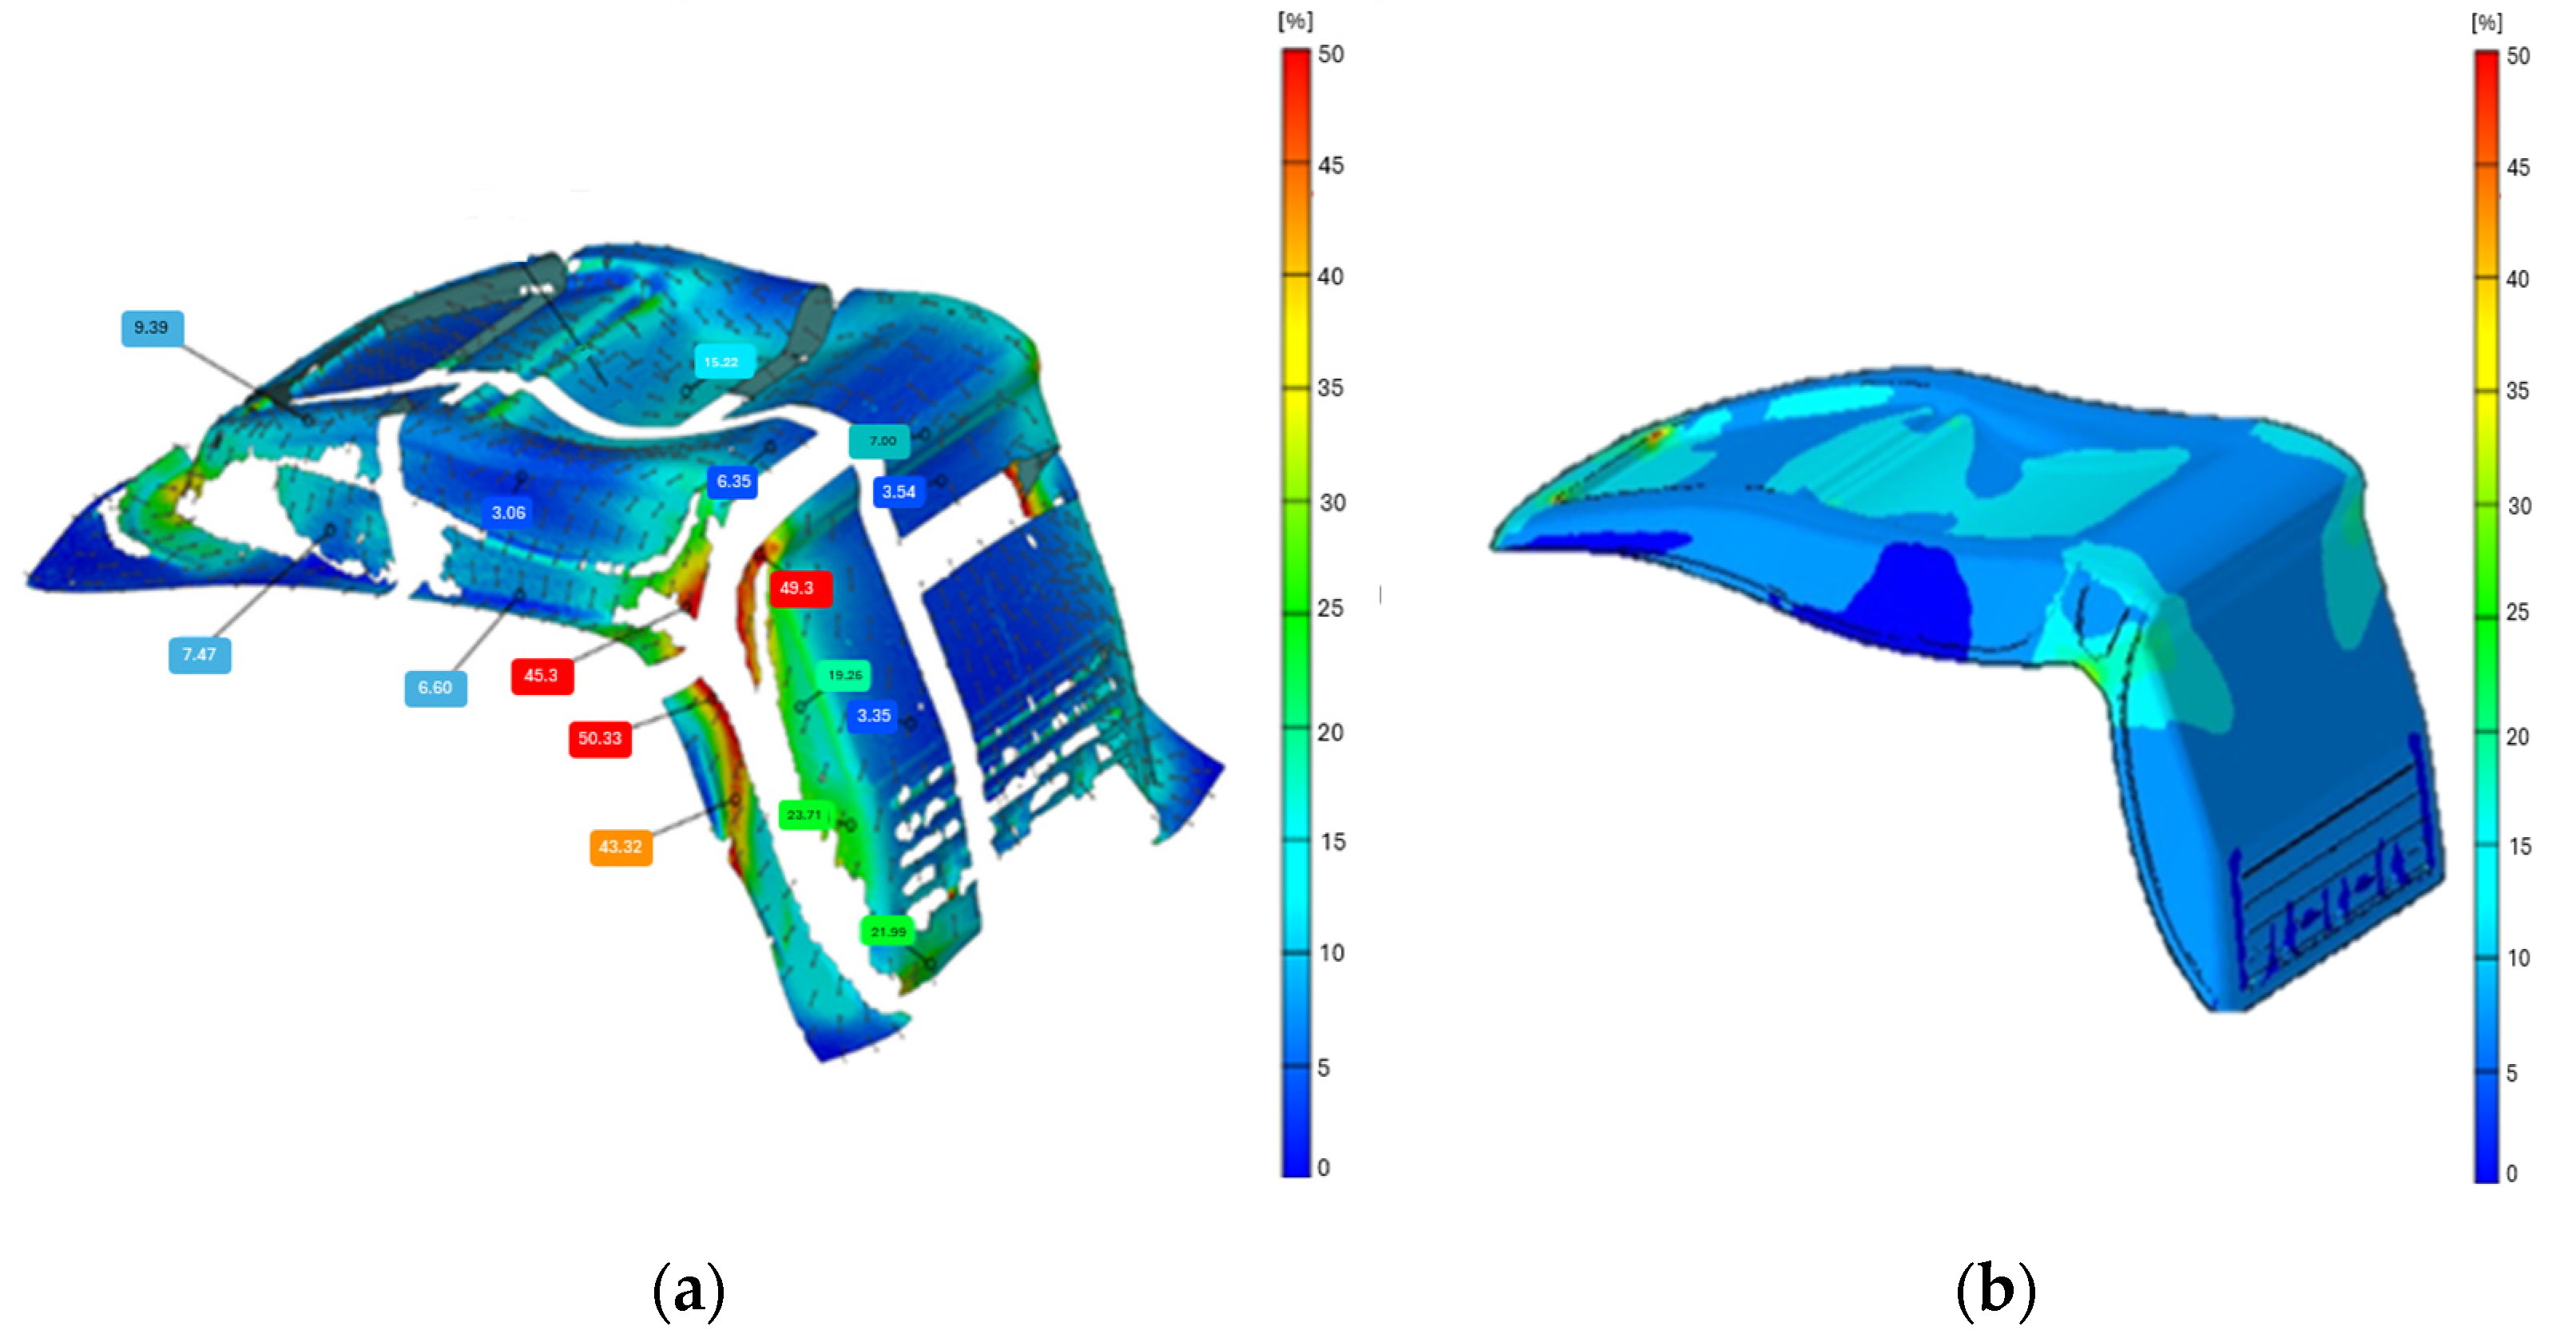
The evaluation of the structural performance of the stamped sheet-metal component was conducted using two distinct modeling approaches: linear and nonlinear models. These models were designed to investigate the impact of thickness mapping and material property definitions on the accuracy and reliability of the FEM predictions. Comparing the results of linear and nonlinear analyses provided insights into the elastic and elastoplastic behavior of the component, enabling a more comprehensive understanding of its response to applied loads. The linear models focused on the elastic range of the material, while the nonlinear models captured yielding and stress redistribution in critical areas, incorporating localized effects derived from the stamping simulation data.
Two linear models were developed to assess the influence of thickness mapping on the component’s elastic behavior. The linear simulation model used two different thickness assumptions: one assuming a uniform initial thickness of 1.2 mm, and the other incorporating thickness variations obtained from the stamping simulation, which ranged approximately from 0.92 mm to 1.72 mm in extreme cases. However, to simplify the analysis and maintain computational efficiency, only thickness variations within the range of 1.1 mm to 1.2 mm were considered in the structural FEM model. This conservative range captures the majority of the sheet’s deformation while excluding extreme thinning/thickening effects that would require additional refinement in the meshing process. Both models utilized a linear elastic material definition with identical Young’s modulus values. The loads were intentionally kept small to ensure that the material remained in the elastic range, even during physical tests. This approach was necessary due to the presence of hardened areas in the stamped component, which still contained zones with lower yield stresses. The mapped model exhibited higher compliance due to the reduced thickness in some areas, consistent with experimental observations. The exclusion of L-Plates in these models, justified by the low magnitude of the applied loads, simplified the analysis without introducing significant errors. The results highlighted the importance of incorporating thickness variations, as the mapped model provided a more accurate representation of the component’s elastic behavior.
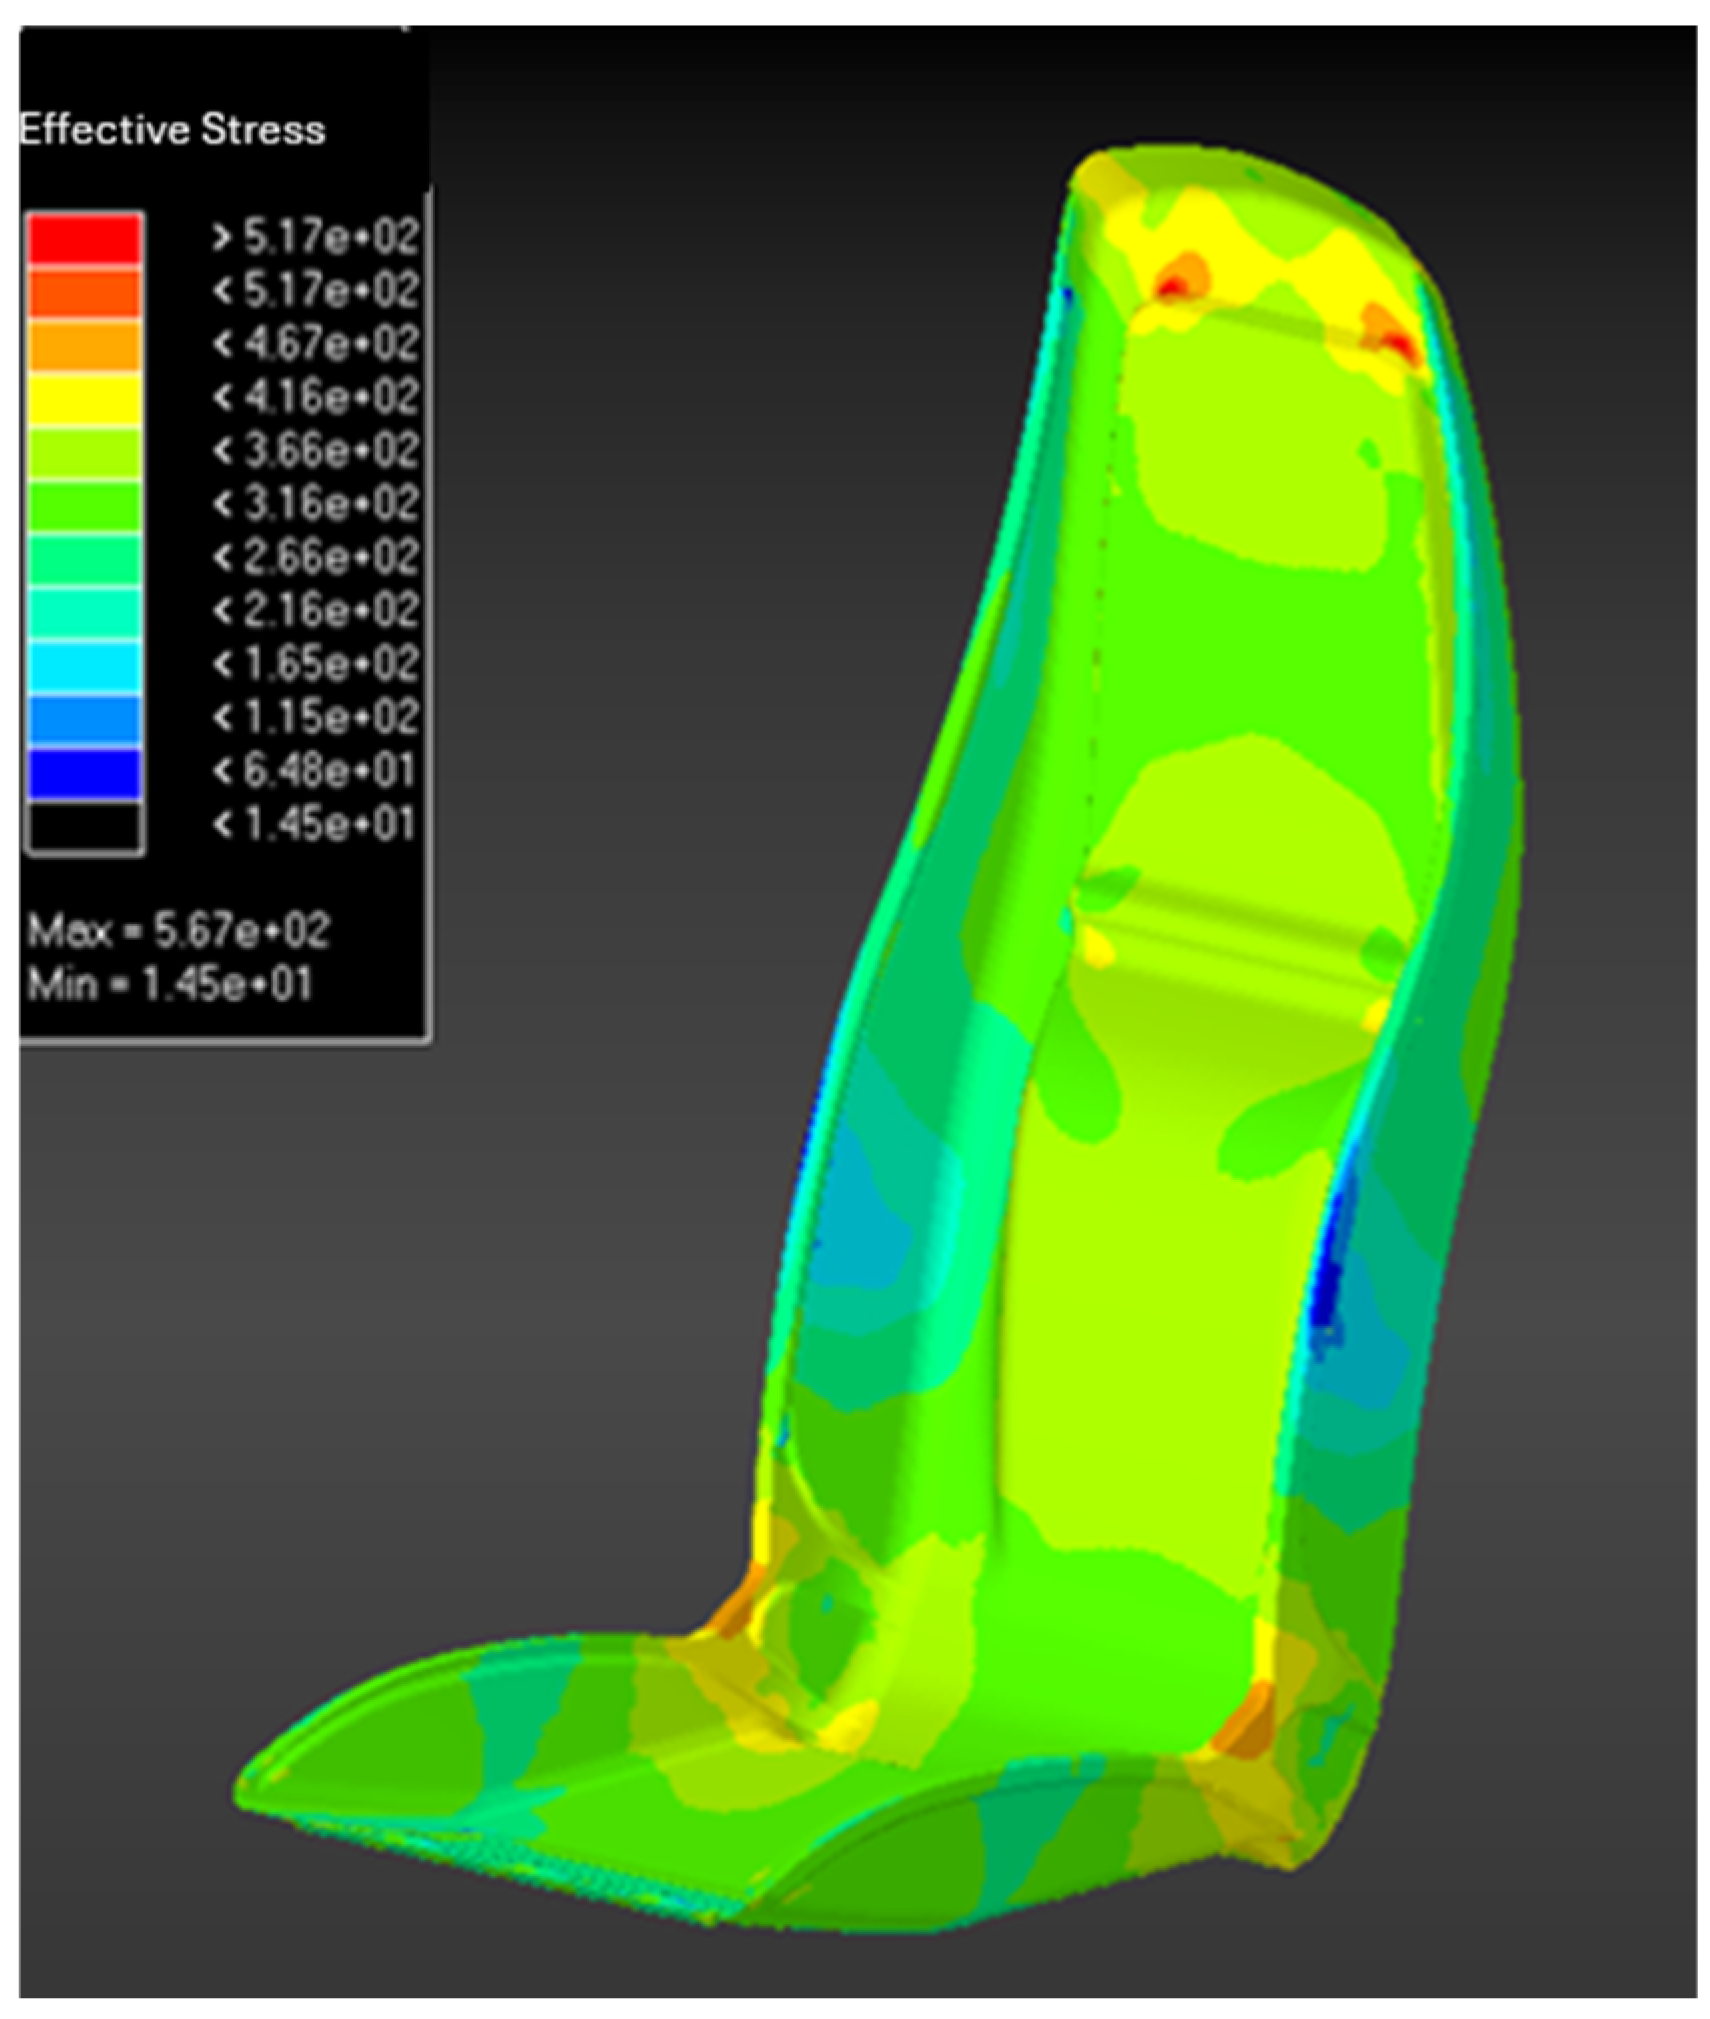
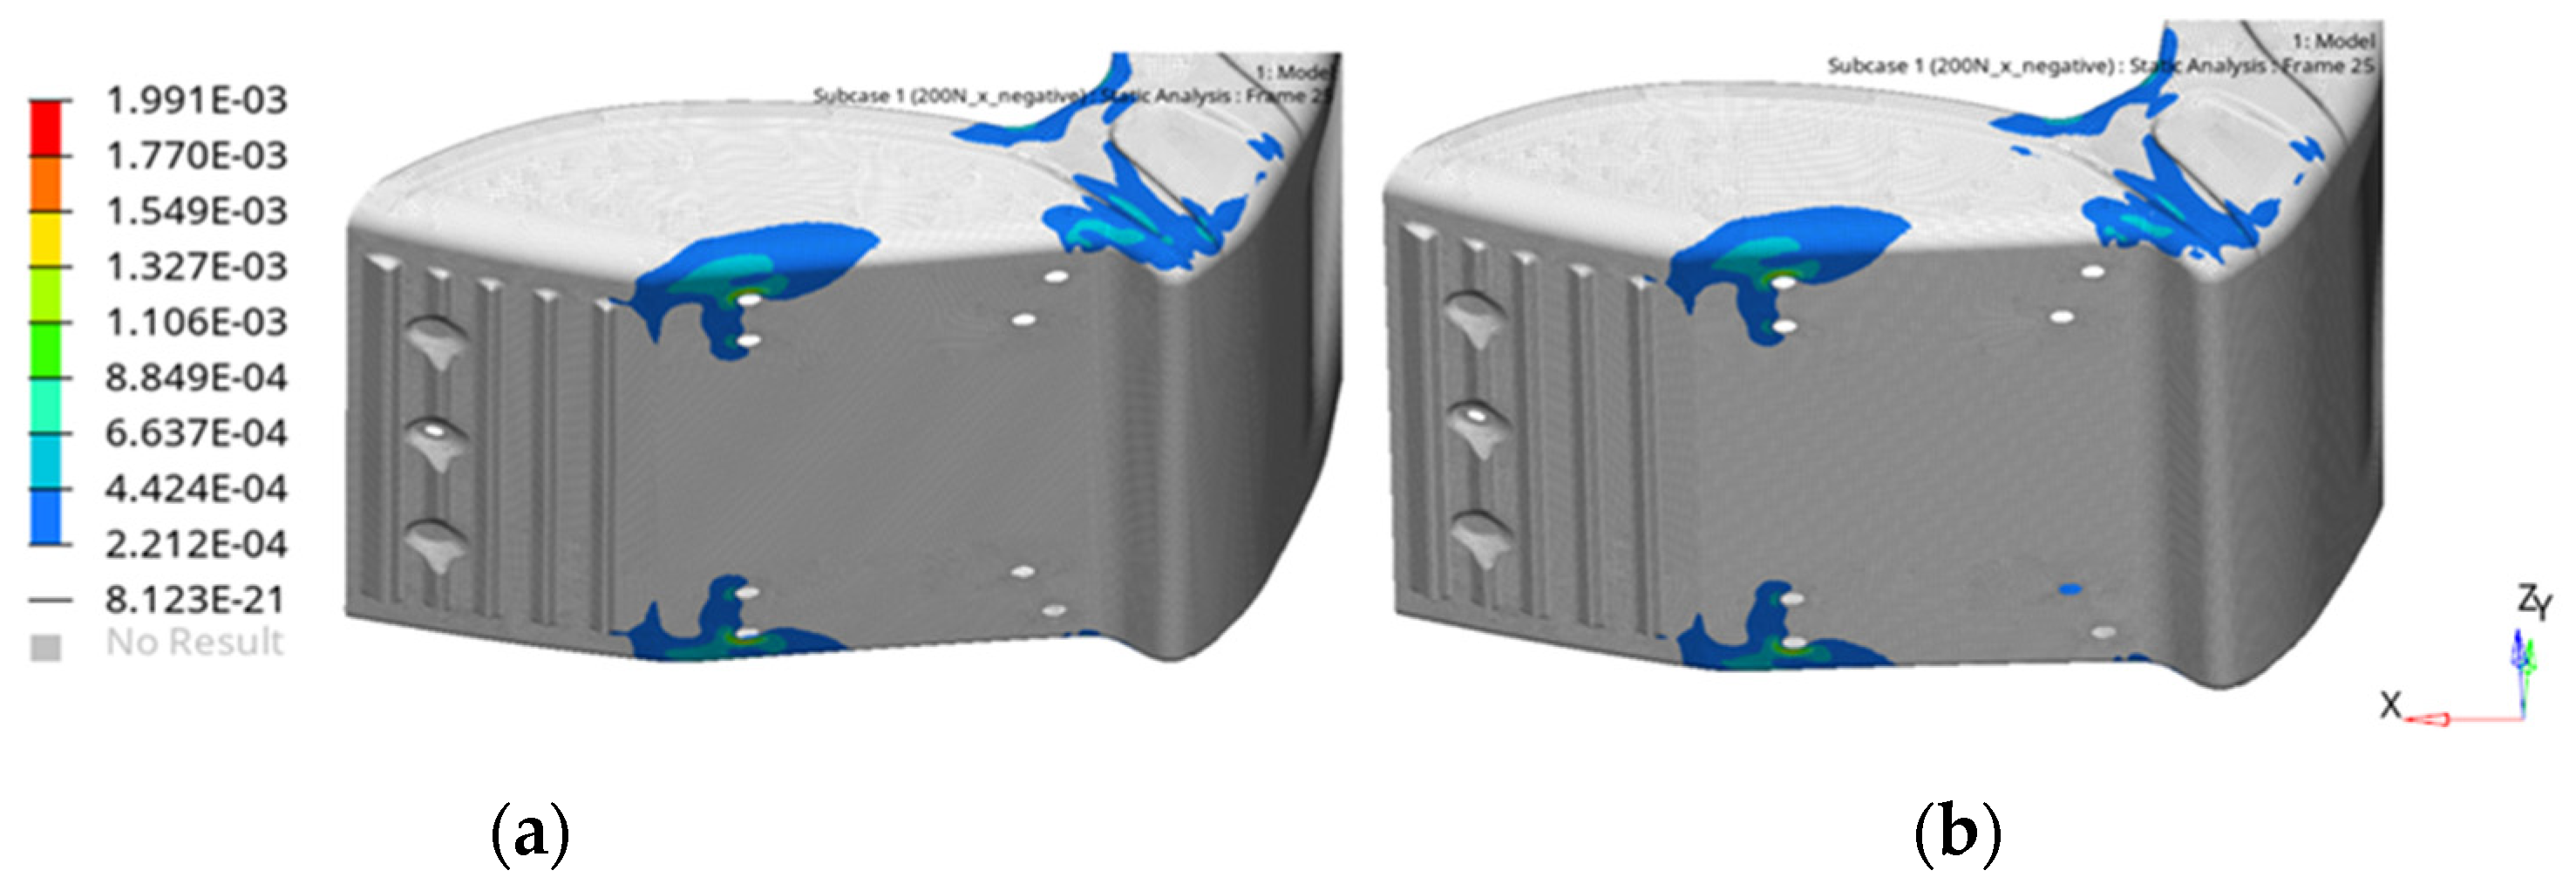
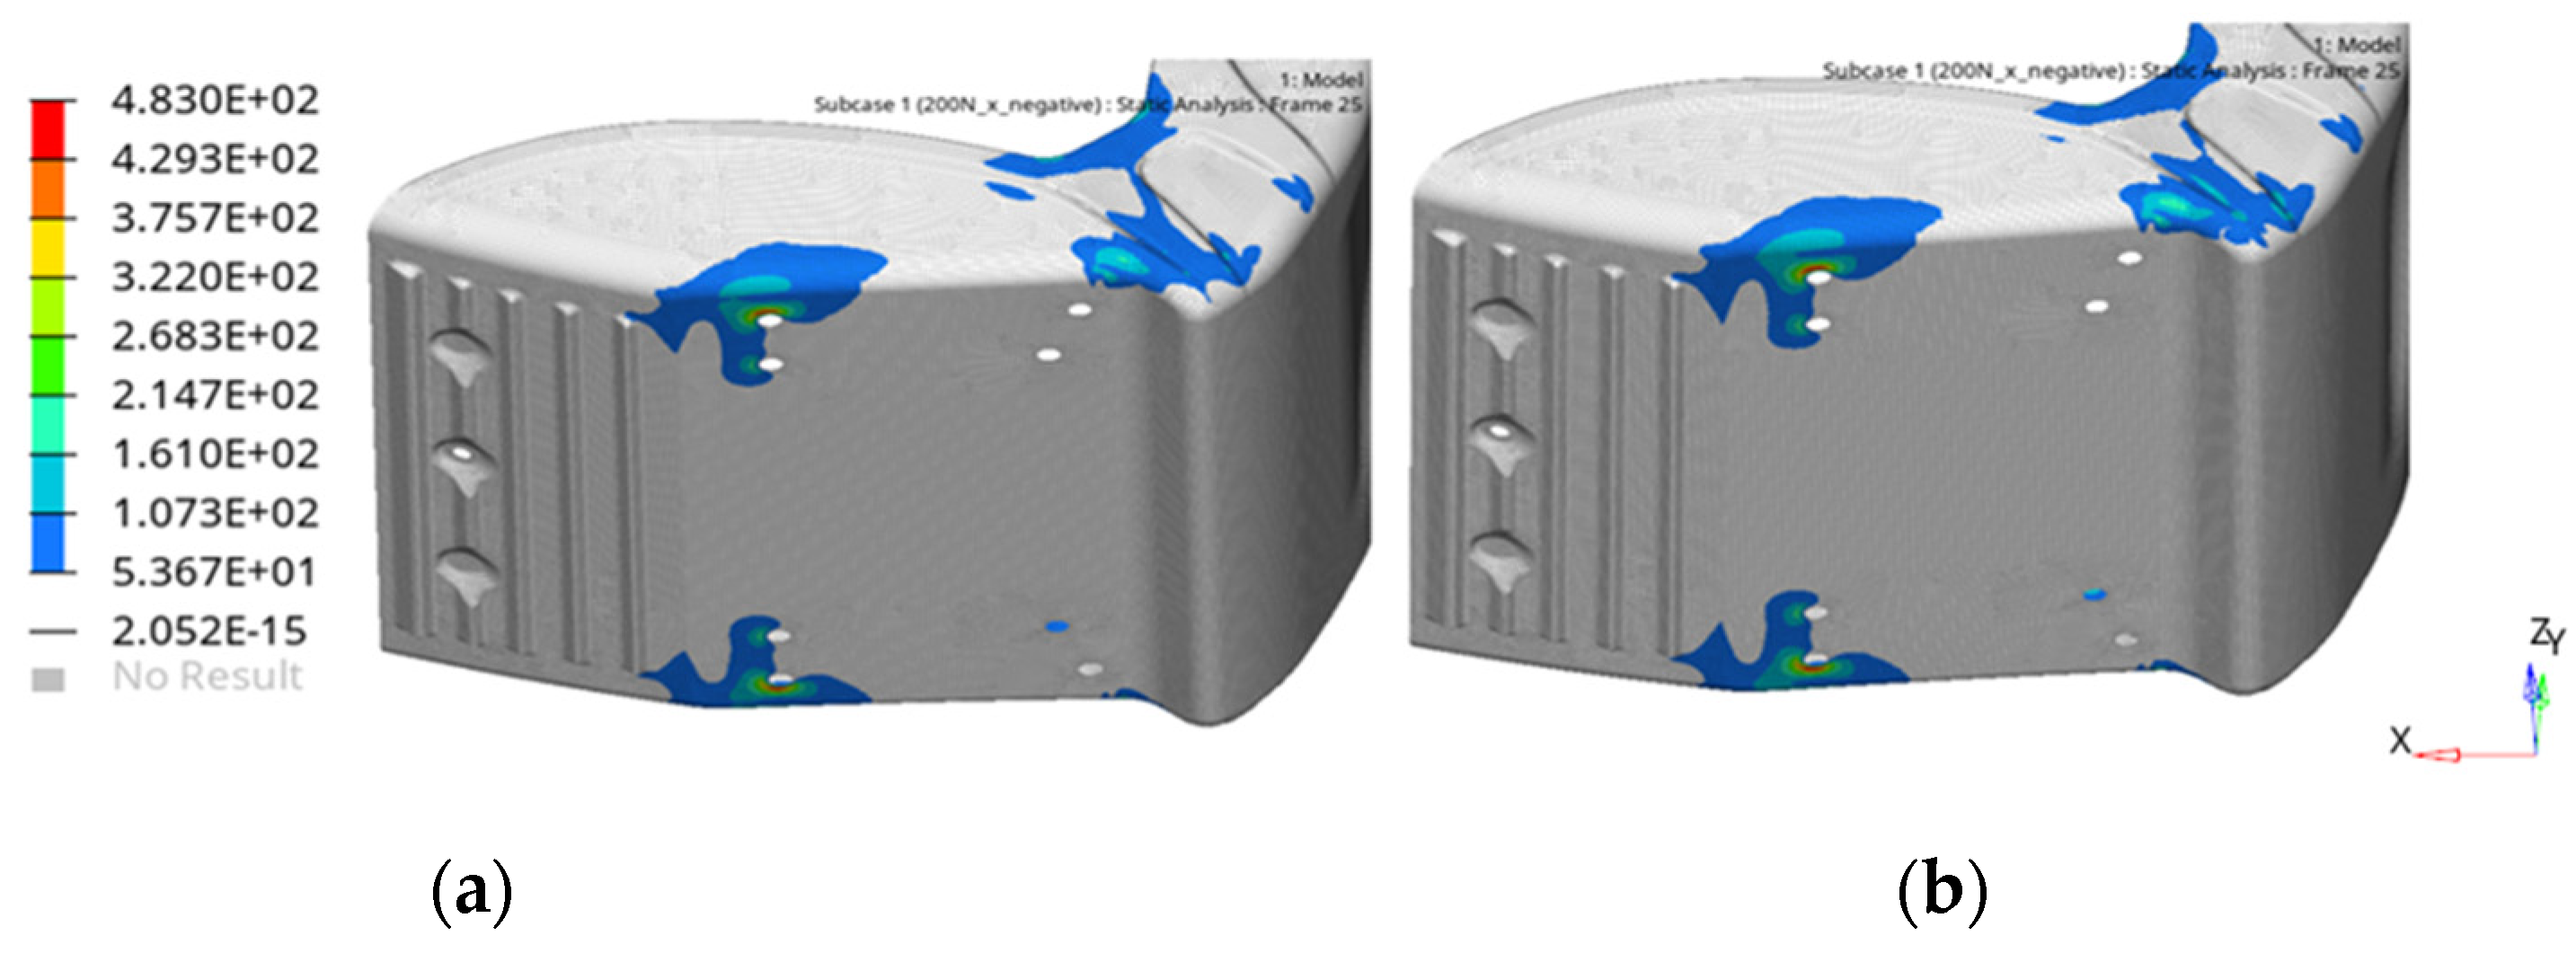
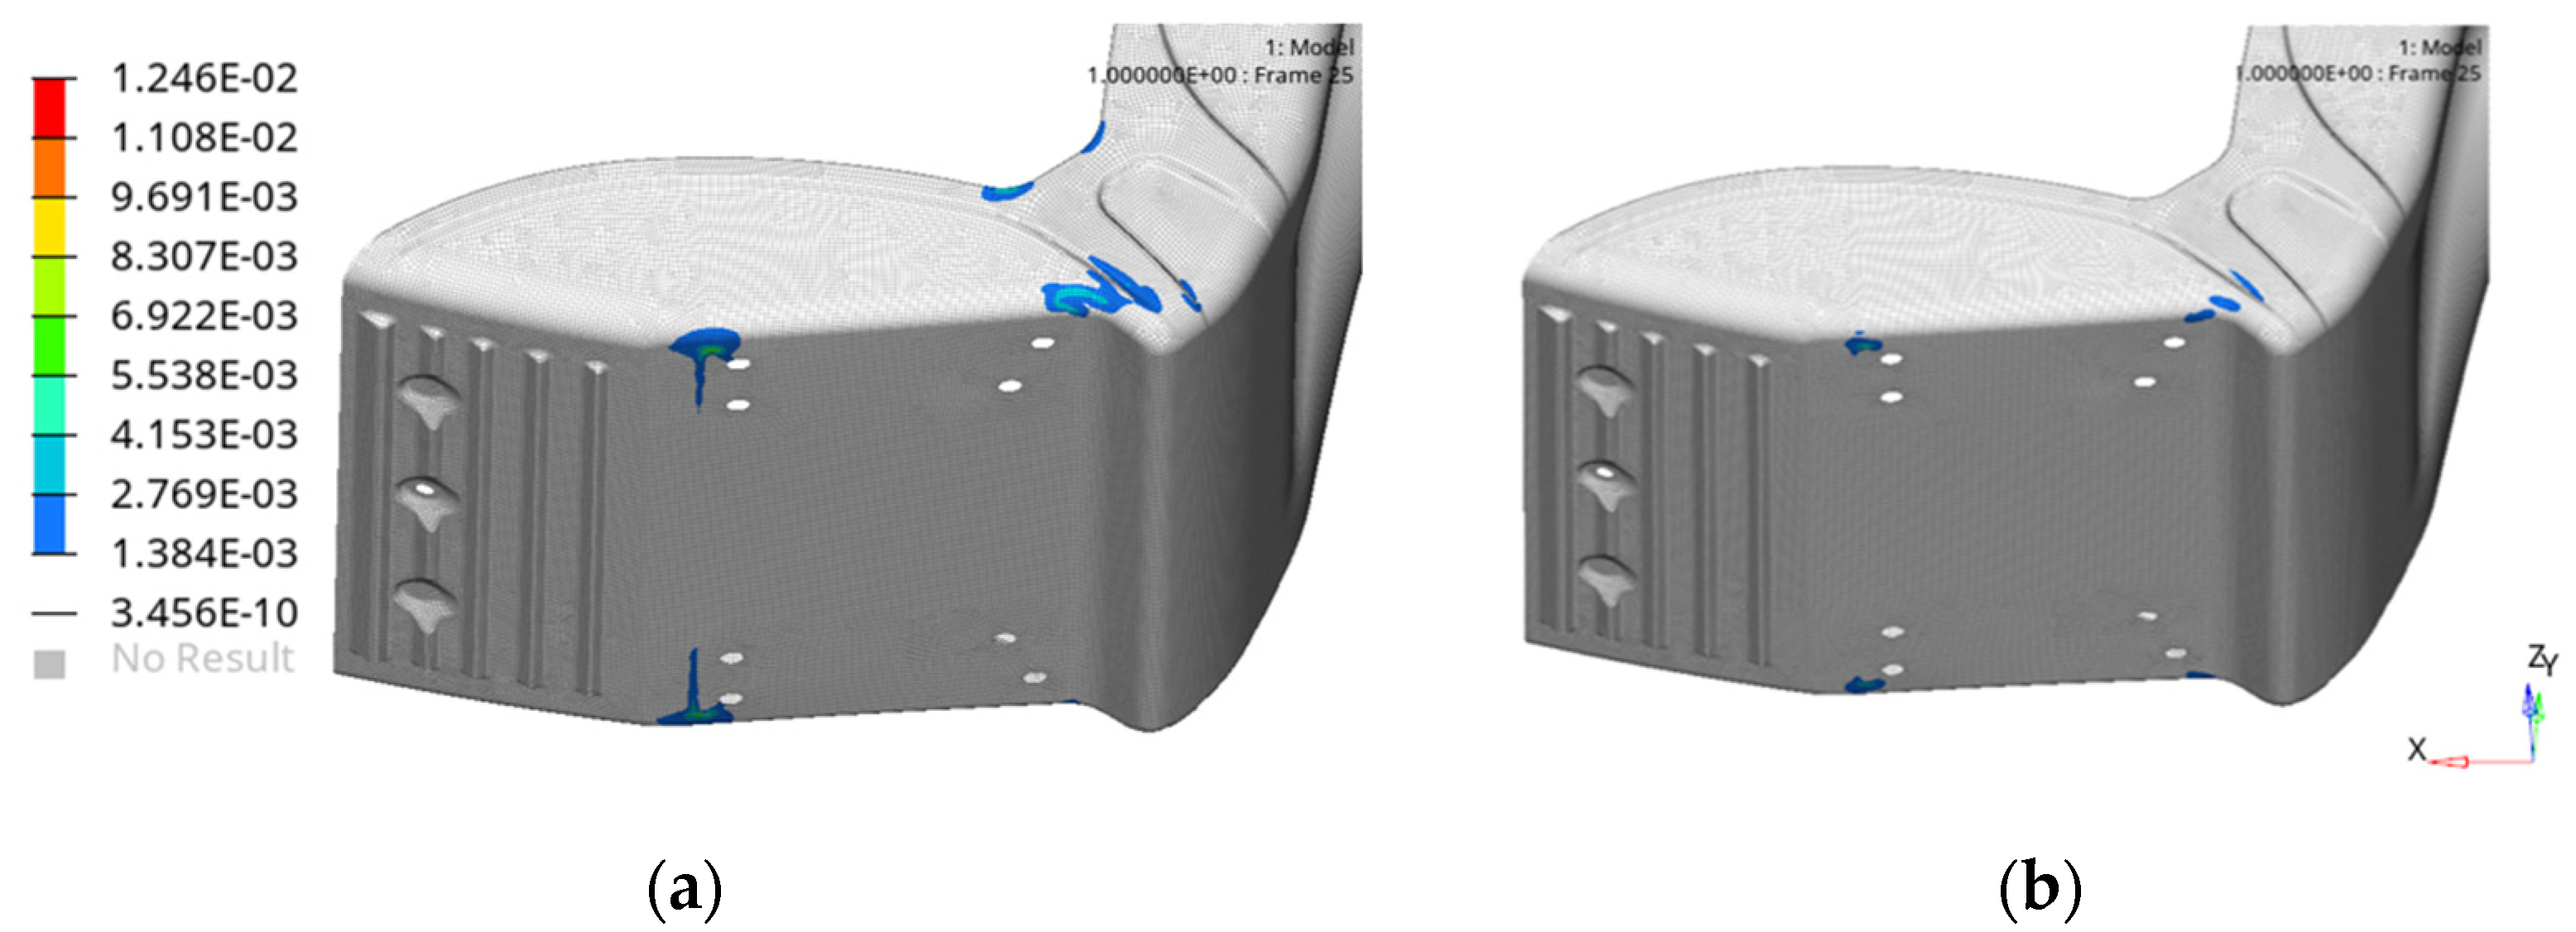
The nonlinear models extended the analysis to include material yielding and stress redistribution. The standard model utilized elastoplastic hardening properties derived from the stamping simulation but assumed a constant thickness of 1.2 mm (
Figure 10). In contrast, the mapped model employed an elastic–plastic material definition with thickness variations. In the nonlinear simulation, a conservative approximation is employed by modeling the exponential part of the stress–strain relation with a straight line. This approximation assumes perfect plastic behavior after yielding, without considering strain hardening effects. While this approach enhances numerical efficiency and stability, it does not accurately capture the progressive hardening that real materials exhibit. As a result, the simulation may underestimate the material’s resistance to further deformation in the plastic region. To improve post-yield predictions, future refinements could incorporate a more advanced hardening law, such as isotropic–kinematic hardening. Additionally, while thickness variations and local yield strength distributions from the stamping simulation were integrated into the structural FEM model, the complete deformation history was not directly transferred. This decision was primarily driven by computational limitations and challenges in ensuring compatibility between forming and structural simulations. The omission of pre-strain effects and residual stresses may introduce discrepancies in structural analysis, particularly in regions where significant strain path changes influence material response. Future efforts will explore methods to incorporate the full deformation history into FEM analyses to enhance predictive accuracy.
By explicitly acknowledging these approximations and their implications, this work aims to strike a balance between computational efficiency and predictive accuracy, while continuously improving material modeling approaches in structural FEM simulations.
The nonlinear models incorporated additional numerical controls to enhance solution accuracy, as reported in
Table 6. Key parameters included NINC, the number of load increments, typically set between 10 and 20 for quasi-static simulations, and DTMAX, the maximum time step, which ensured detailed results. The NINT parameter enabled the post-processing analysis of incremental loads, allowing evaluations of both linear and nonlinear phases. Unlike the linear models, the nonlinear setups included L-Plates to account for stress hotspots at component edges, where yielding was most likely to occur. These models provided a comprehensive understanding of structural behavior under higher loading conditions, accurately capturing critical stress and deformation patterns.
4.2. Experiments
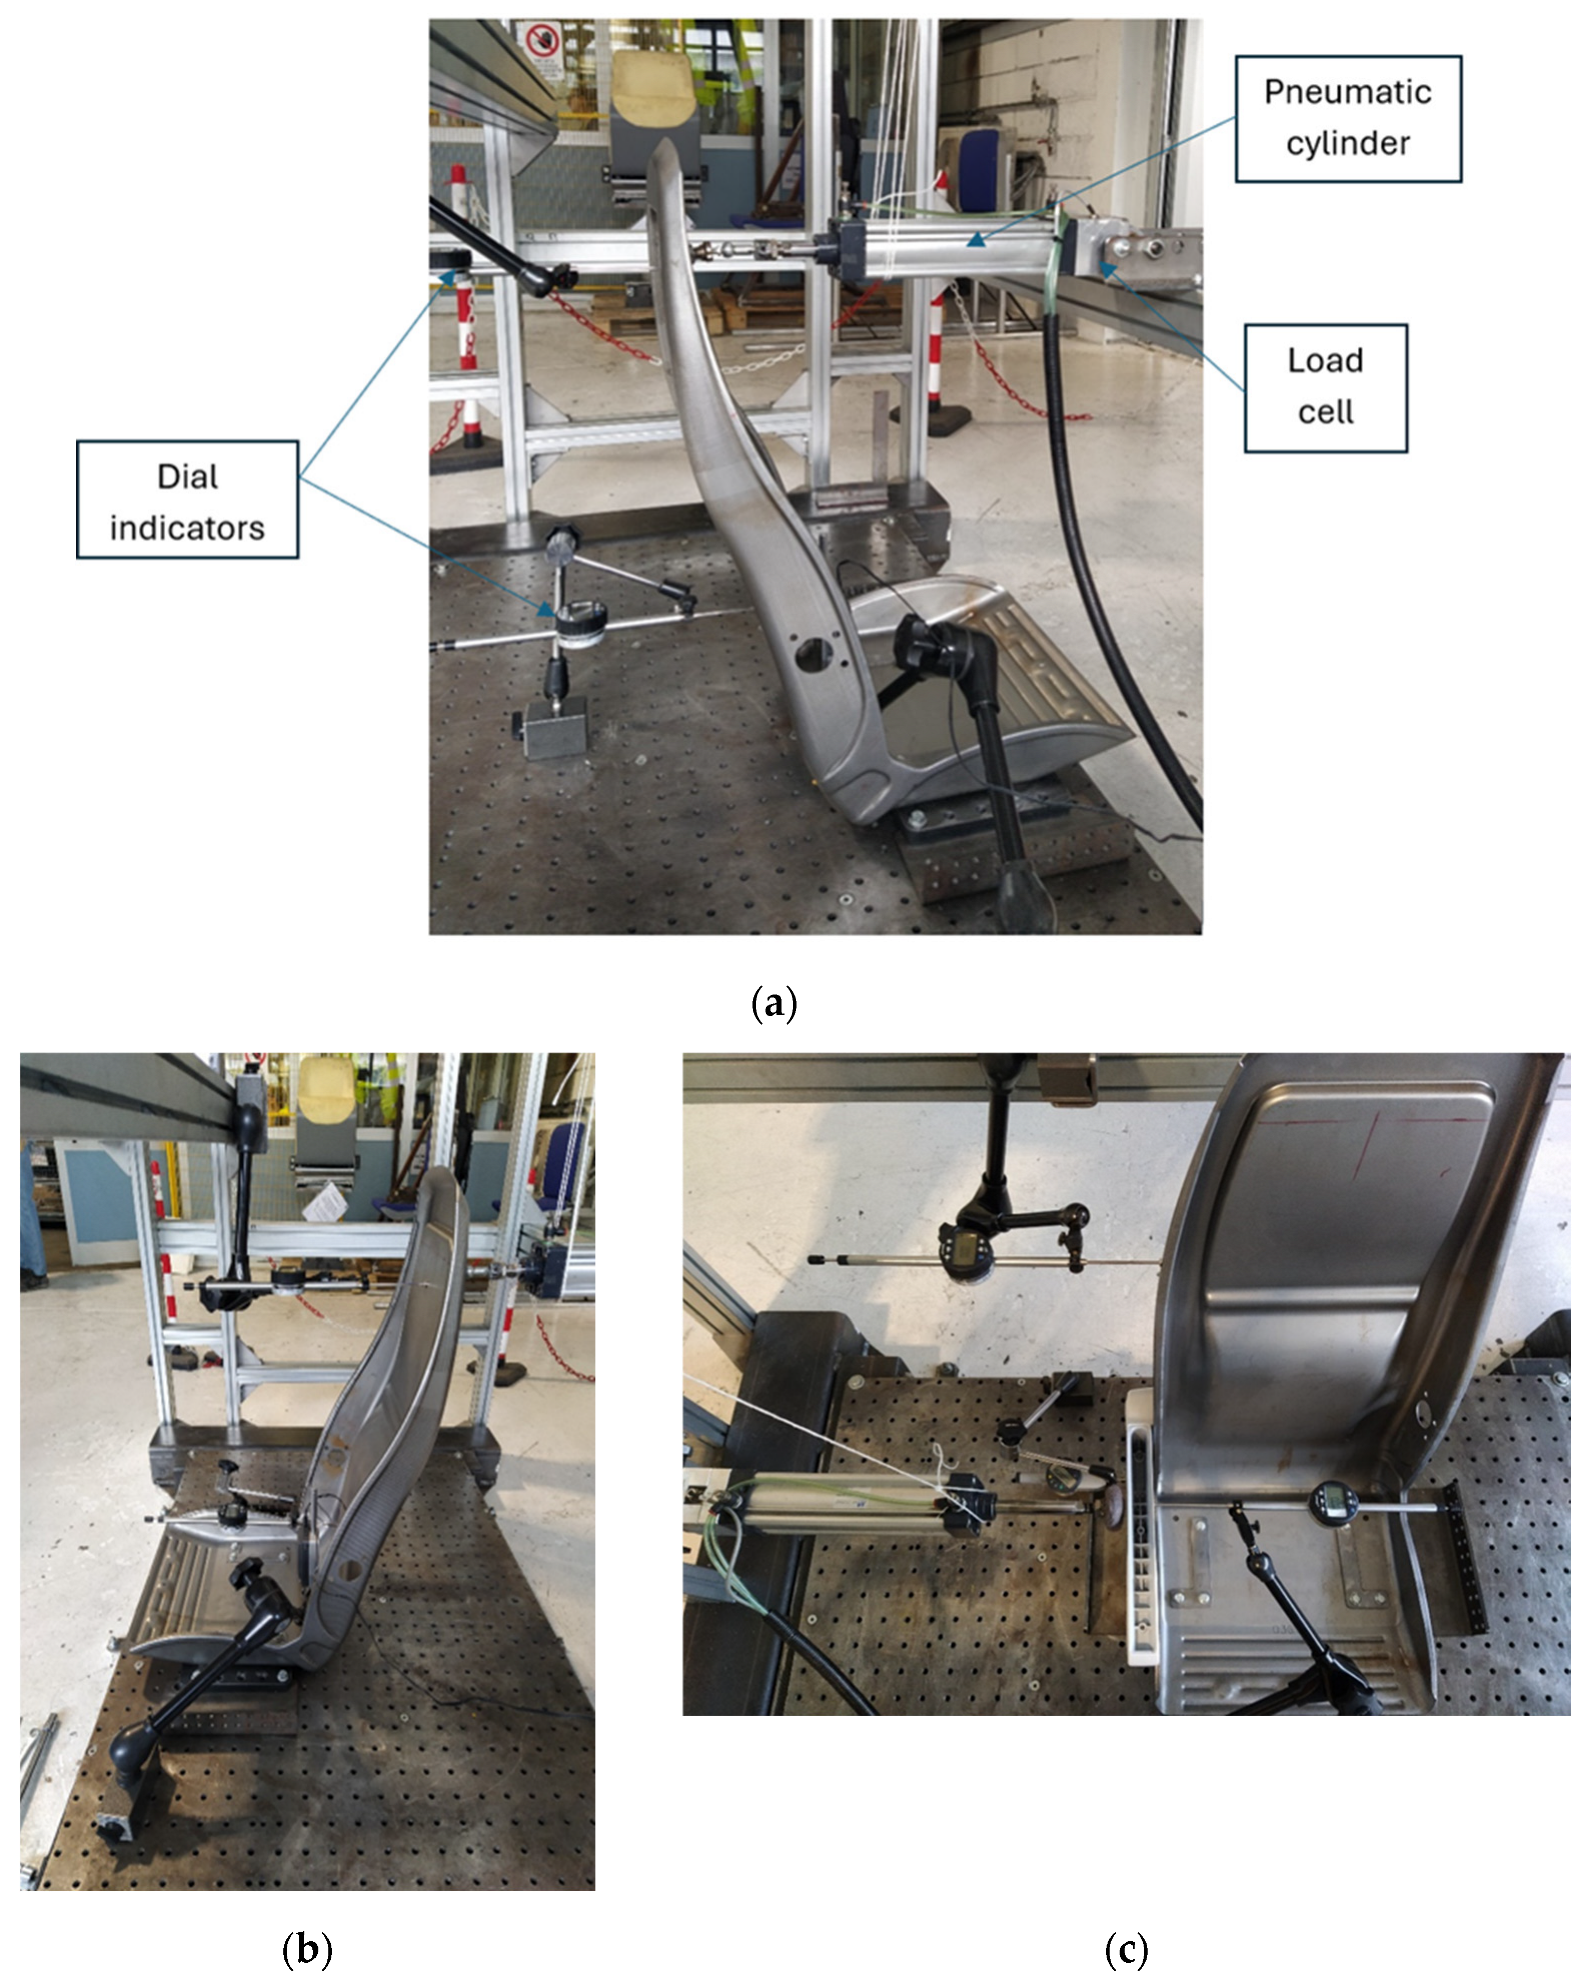
Static tests were carried out to validate the structural simulation and the complete process of mapping the material model from the stamping to the structural simulations. These tests were based on the AFNOR NF F 31-119 standard. The experimental setup, shown in
Figure 11, included two dial indicators with 0.01 mm precision and an up to 80 mm range, another dial indicator with 0.001 mm precision and an up to 80 mm range, a pneumatic cylinder, and a load cell with 0.1 kg precision and an up to 200 kg range.
The setup was organized as follows. The sheet-metal seat was fixed to the platform by the base, which was also virtually modeled, and lifted by two additional 10 mm thick plates to prevent the lower edge from touching the floor during loading. The body was tightened between the base and the L-Plates using six bolts, which provided the main anchorage. To anchor the pneumatic piston and the comparator, two beams were used, which were positioned transversely to the direction of the load.
First, several tests were carried out in the linear field before the destructive ones:
The first load case was also used for the destructive test. Loads were applied step-by-step in small units, with each step repeated three times. The force was applied slowly to avoid shocks, and sufficient resting time was allowed before reading the numbers from the dial comparators. After each step, the force was removed, and the setup was inspected to confirm its complete return to the zero position, ensuring the reliability of the instruments and the procedure.
A similar procedure was implemented for the destructive test, gradually increasing the load until the sheet-metal seat reached its breaking point. Deformations at important points were recorded as a function of the load cell values and then were compared with FEM simulation results for validation.
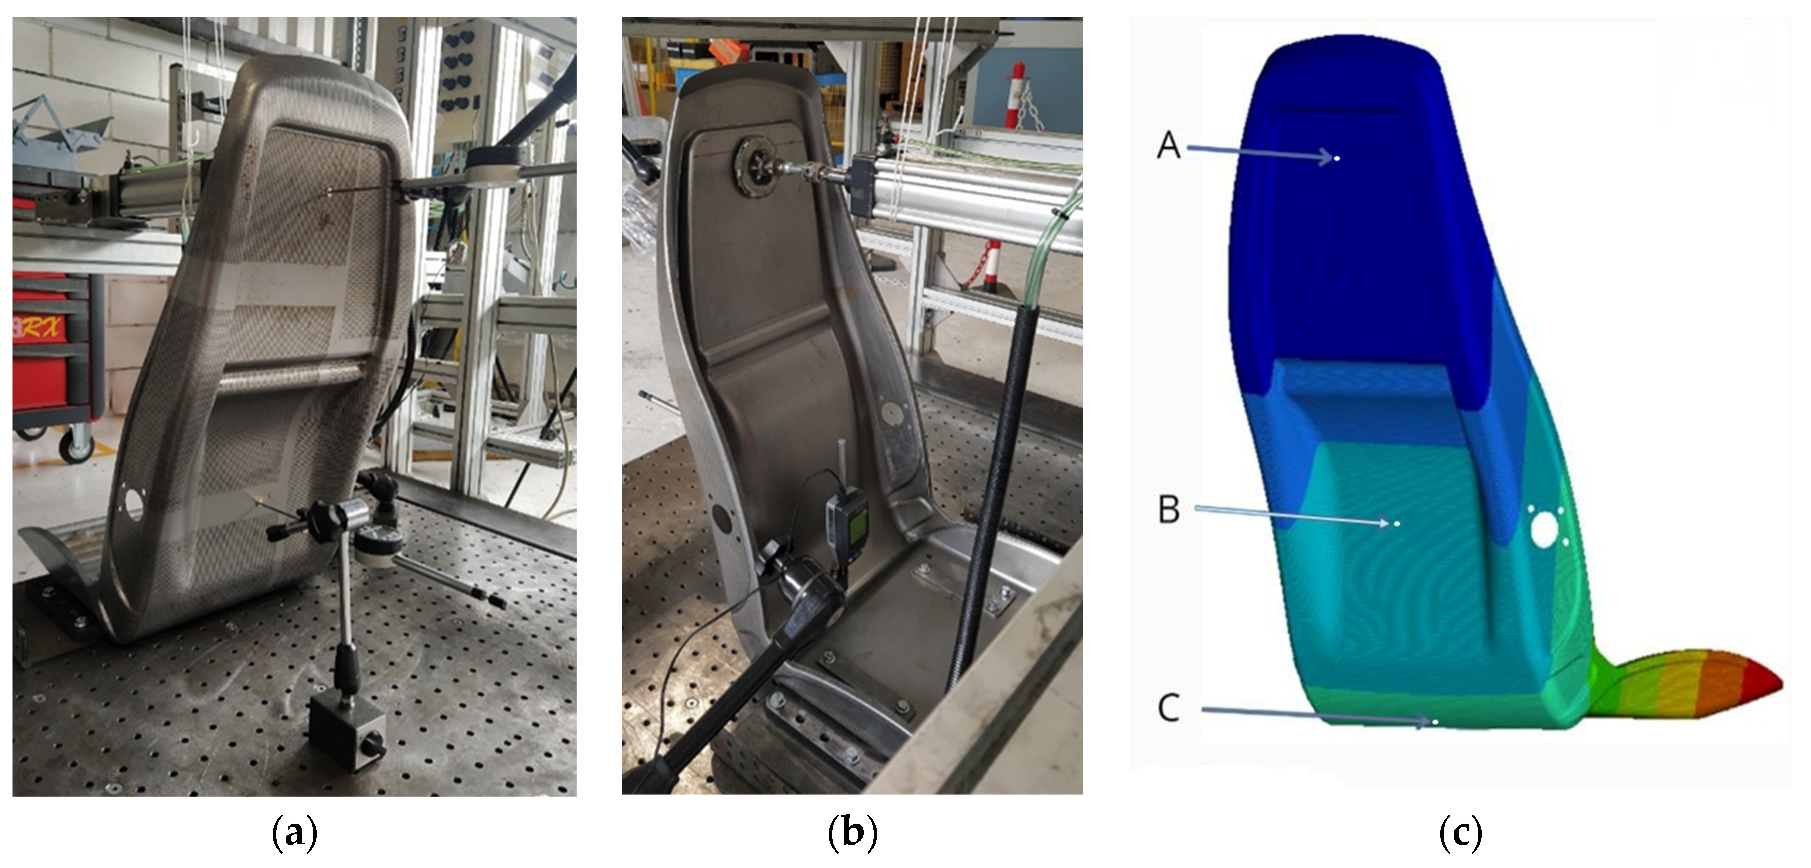
For conciseness, only the results of the initial tests are included in this paper. The validation was conducted at three primary measurement points: Point A, situated at the application point of the pneumatic cylinder at a height of 652 mm from the floor; Point B, positioned approximately halfway up the backrest at a 204 mm height; and Point C, located at the folding junction between the backrest and the seat, representing the lowest part of the backrest. Points A and B measured deformations along the
X-axis, while Point C captured deformation along the
Z-axis, as shown in
Figure 12.
As previously described, several tests were conducted, exceeding those strictly required to validate the structural simulation.
The first subtest (backrest push along the X-positive direction) is identical to the test described in previous subchapters, except for the opposite direction of the load application. The workstation setup remained unchanged; the body was simply rotated 180°, and the instrumentation was repositioned while maintaining the comparator heights. The first loading is always regarded as “invalid” as it allows the body to settle into position. Following this initial step, the comparators are reset, and the official measurements commence. The test results are presented in
Table 7.
In this test, the loads were kept lower than those applied along the negative X direction, as the body exhibited greater compliance. The observed residual deformations were relatively “high,” potentially indicating a failure risk. However, in the elastic range, residual deformations should theoretically return to zero after the spring back phase. According to the AFNOR NF F 31-119 standard, the residual deformations must remain below 5% of the maximum deformation under load. The standard explicitly states the following: “The residual deformation must always be negligible”, i.e., at most, 5% of the maximum deformation in the presence of stress reached at the moment of the application of the forces.
Table 8 outlines the threshold values specified by the AFNOR regulation, demonstrating that the maximum residual deformations observed during testing remain well below the allowable limits. This confirms the validity of the measurements for the body test.
The second and third tests follow a similar procedure, differing only in the direction of the applied force and the corresponding positioning of the comparators. These tests involve loading the armrest in both positive and negative directions along the
Y-axis, while the reference system remains consistent with the automotive coordinate system. Due to the change in test configuration, the sampling points differ from those specified in previous tests (as shown in
Figure 12). Point A, located near the pneumatic piston’s application area, remains conceptually unchanged. However, Points B and C are now positioned along the external edge of the body in decreasing order of height. Specifically, Point C is located at the center of the ribs in the lower part of the seat, where the seat cushion and backrest meet.
Table 9 and
Table 10 show the measurements taken during the tests for Y-positive armrest push and Y-negative armrest push, respectively.
Table 8,
Table 11 and
Table 12 validate the accuracy and reliability of the measurements performed during the tests. However, from the other tables, it can be seen that the residual deformation measurements are not exactly increasing. This irregularity is attributed to settlement “bumps”, which occurred due to the lifting of the probe shaft using the lifting knob. The data clearly indicates when these settlement bumps began, a phenomenon that was not anticipated in earlier tests. Despite this, the overall measures remain consistent and within acceptable thresholds, confirming the validity of the testing process.


 ,
, 


