Article

Comparative Analysis of Urban and Rural Ecosystems in the Context of Suitability for Honeybees

by
Dariusz Gerula
*,
Paweł Węgrzynowicz
and
Zbigniew Kołtowski
Apiculture Division, The National Institute of Horticultural Research, 24-100 Pulawy, Poland
*
Author to whom correspondence should be addressed.
Appl. Sci. 2025, 15(5), 2431; https://doi.org/10.3390/app15052431
Submission received: 15 January 2025 / Revised: 17 February 2025 / Accepted: 20 February 2025 / Published: 24 February 2025
(This article belongs to the Special Issue Advances in Honeybee and Their Biological and Environmental Threats)

Abstract

:
The present study set out to compare the performance of honeybees maintained in urban and agricultural environments across various regions in Poland. A range of measurements and observations were used to assess overwintering, development, strength, swarming behaviour, honey yield, and Varroa destructor infestation in bee colonies in five towns and five surrounding villages. The rural apiaries were located 4.5–39.5 km away from the urban apiaries. The colonies were kept in wooden Dadant hives and were led by Apis mellifera carnica queens. The brood count and colony strength were assessed based on the Liebefeld method, while Varroa destructor infestation levels in the colonies were determined using icing sugar at the end of July. The urban apiaries exhibited significantly higher brood-rearing dynamics. Consequently, an increase in brood count in spring resulted in a significant increase in Varroa infestation levels in summer. In certain regions, urban apiaries exhibited higher honey production, though this was influenced by geographic location and the availability of bee forage. The significant variation in most traits, including honey production, was observed depending on the region. Variations between years in the study were observed in bee colonies overwintering, brood numbers in the pre-spring period, and bee population in summer. This may suggest the presence of differing weather conditions.

1. Introduction

In Poland, the number of bee colonies has reached 2.35 million [1], marking a 100% increase over the past two decades. This growth is accompanied by a 100% increase in the average density of colonies per unit area, which currently stands at 7.7 colonies/km2. In comparison, the average density in the 27 EU countries is 4.8 colonies per square kilometer, which is higher than in China (approximately 1.3 colonies/km2 if we consider only Apis mellifera) [2]. The density calculation for China considered the fact that 52% of China’s area is covered by mountains [3], where bees are not used. In certain EU countries, the density of colonies per km2 is higher than in Poland: Hungary (10.6), Greece (16.8), and Malta (19.2). Turkey, the third largest honey producer in the world after China and the EU, also has a high density of 11.1 colonies per km2. All the above calculations are based on [4,5].
It is a commonly held belief that the primary purpose of keeping honeybees is to produce honey. However, it is estimated that the benefits to humanity from bee pollination are significantly greater [6,7,8,9]. In certain regions of the world, notably those engaging in intensive agricultural practices, bees face progressively challenging living conditions [10,11]. In these regions, a decline in honeybee colonies has been observed for approximately two decades, necessitating continuous reproduction to maintain the population levels of the colonies at a sustainable level [6,12,13,14]. Intensively farmed appear to be increasingly less hostile to honeybees due to large-scale monocultures of crops that do not provide benefit to bees [14,15,16,17], as well as a significant increase in the amount of insecticides used in agriculture for crop protection [14]. The occurrence of acute pesticide poisoning clearly demonstrates the negative impact of agriculture on bees. Research has demonstrated that bees exhibit resistance to low to moderate levels of pesticides present in their food [18,19]. However, it remains challenging to discern sublethal effects in bees, particularly given that the Varroa destructor mites are the primary determinant of bee health and longevity [19].
The high densities of bee colonies in some European countries, as well as the threats from the chemicalization of agriculture, mean that an increasing number of bee colonies are being kept in urban areas, where conditions are conducive to the survival of pollinators [20,21]. Urban areas are characterised by a high diversity of nectar- and pollen-bearing plants, which bloom for extended periods, thereby providing food sources for insects. They have a warmer climate zone, which has been demonstrated to be conducive to the production of large quantities of nectar. An example of this phenomenon in Poland is Robinia pseudoacacia L., whose flowers frequently undergo frost damage or fail to produce nectar. In the villages, aside from the cultivation of nectariferous crops, there is an absence of initiative to expand the forage base. Conversely, there has been a decline in bee forage, particularly those that start later in the season. Old roadside lime trees are being removed, and in forestry settings, Robinia is being felled. Foresters regard this species as an invasive tree that is not conducive to effective forest management. The population of heather shrubs is declining, and these plants are reaching old age and producing low yields of nectar. This is largely due to restrictions on shrub regeneration management, such as through burning and cutting.
The process of chemisation in agriculture has resulted in the potential risks associated with beekeeping in certain areas. In urban areas, there is either a complete prohibition on the use of pesticides or a significantly reduced scale of their application when compared with rural areas. In addition to their conventional commercial applications, urban apiaries also possess significant educational value. Demonstration apiaries are organised to welcome children and young people to classes and workshops, allowing them to get to know the bees, learn about their lives, and taste the products. In Poland, urban apiaries are subject to the same regulations as other apiaries. These apiaries are typically either private enterprises or funded by local governments or companies as part of a broader marketing strategy.
The issue of whether the development of civilisation, urbanisation, and industrialisation are having a detrimental effect on pollinating insects is a matter of considerable debate. Research to date has focused predominantly on solitary bees. A comparison has been made of bee species richness according to the degree of urbanisation. In urban environments, there is a high abundance of bee species, but social species are more numerous, including polylectic species [22]. The honeybee is an eminently polylectic species, raising concerns that it may dominate these areas, displacing other insects (Apoidea) [23,24]. The adaptability of social insects has been identified as a key factor in their increasing dominance in urban environments. It is notable that the honeybee is well-suited to urban environments, exhibiting adaptability through its ability to fly over long distances and forage for food with greater efficiency compared to other wild bees [25]. Several studies have reported that the honeybee poses a threat to wild bees [26,27,28,29,30]. Conversely, other studies showed either no impact or inconclusive results [31].
The most famous urban apiary is the one founded in 1980 in Paris, located on the roof of the Opera Garnier. This apiary gave rise to the urban beekeeping industry, and today, there are more than 3000 bee colonies. Paris bee colonies produce an average of 50 kg of honey per year, with peaks of up to 80 kg in seasons where forage is particularly abundant. In contrast, in the rural environment colonies typically yield 30 kg [32]. In the United States, urban beekeeping was not permitted until the 1950s, when regulations began to liberalise. Bans on urban beekeeping are usually motivated by concerns for public safety [33]. A notable increase in the number of urban beekeepers was observed in the US around 2008, likely driven by media attention attracted by reports of ‘colony collapse disorder (CCD)’ that started in 2006 [34]. As a result, New York City and Los Angeles officially removed restrictions on urban beekeeping in 2010, establishing a significant precedent for cities and municipalities nationwide. This progressive shift was subsequently adopted by Milwaukee, Wisconsin, and Washington, DC, in 2012. The movement toward more supportive regulations continued with Boston in 2013 and Los Angeles again in 2015.
Bee densities in large cities are higher than in agricultural landscapes. For instance, the average colony density in Paris per km2 is 6.5; colonies that exceed that of the rest of the country are −2.5; in London, it is −10; and in Brussels, it is −15 [35]. Urban beekeeping has also become an increasingly prevalent practice in other European countries, including Germany and Poland. Most of these colonies are managed, whereas feral colonies are comparatively rare. The average wild colony density in Europe is 0.26/km2, which is 25 times lower than in Latin America and Africa [36].
The aim of this study is to compare the rate of development and performance of bees kept in urban and agricultural environments across various regions in Poland.

2. Materials and Methods

2.1. Experimental Setup

The study was conducted in five regions of Poland in 2021 and 2022 (see Table 1 and Figure 1). In each region, we located an experimental apiary in the largest city or most urbanised area (Urban) and control apiaries in agricultural areas at varying distances from experimental apiaries, depending on the region, between 4.5 and 39.5 km (Rural). Tychy was only included in 2021, and Cracow only in 2022. The regions are characterised by a relatively low elevation, with altitudes ranging from 101 to 277 m above sea level. The mean annual precipitation in Poland is approximately 608.8 mm. Poland is located within a temperate climate zone, with an average summer temperature of approximately 18 °C and an average winter temperature in winter −1.5 °C. The selected sites have been identified as those which exhibit minimal variation in terms of climate.
We added open-mated sister queens belonging to the Apis mellifera carnica subspecies, born in 2020, to the bee colonies. This subspecies is native to southeastern Poland. If any queen died during the experiment, a new one was introduced, unless it was another young queen because of supersedure. The establishment of colonies commenced in June, with the utilization of approximately 1.5 kg of packed bees. During the broodless period, treatment against Varroa mites was implemented using amitraz. In subsequent years, treatment with amitraz strips was scheduled to commence in August. The bees were kept in wooden Dadant hives with a frame size of 300 mm in height and 435 mm in width. The urban apiary in Lublin was located on the rooftop of a five-floor building, while the others were located on the ground level. In 2021, 84 colonies were tested (40 in the city and 44 in the countryside), and in 2022, 92 colonies were tested (49 in the city and 43 in the countryside).

2.2. Measurements and Observations

The state of the bee colonies was monitored regularly. Several measurements and observations were made to assess bee colonies’ performance and vital parameters. Overwintering of bee colonies was assessed by the difference in fully occupied combs of bees before (B1) and after wintering (B2). This difference was called the overwintering index (OIndex); a higher index means that the strength of the colony is lower in the spring. Brood count (BC) and colony strength (SC) were assessed based on the Liebefeld method [37]. BC was made four times during the beekeeping season, twice in spring (BC0 and BC1), in full summer (BC2), and before overwintering (BC3). We conducted the first spring brood survey at the start of the goat willow’s flowering period (Salix caprea L.) and the second three weeks later. This approach facilitated a comprehensive assessment of the dynamics of brood growth (BGD) within bee colonies. Honey yield from each colony was assessed by weighing the honey super before and after centrifugation (HY). Prior to the main parasite control of Varroa (at the end of July), the infestation of bees (VInf.) was evaluated in colonies using icing sugar to detach the mites from their host, which was then collected in a jar [38]. The mite counts were converted into units per 10 g of bees. Swarming susceptibility (SB) was evaluated using a scoring system ranging from 0 to 3. We did not give any points to families that were swarmed. We gave three points to families that were not swarming and one or two points to families that were in a mood, depending on the level of sophistication. We took a total of fourteen measurements, which reflected the bees’ degree of adaptation to the conditions and, at the same time, the suitability of these conditions for the bees’ development and productivity.

2.3. Statistical Analysis

The analysis considers three independent variables. The impact of the type of location (urban vs. rural), the location (Warsaw vs. Lublin vs. Pulawy vs. Cracow vs. Tychy), and the year of research (2021 vs. 2022) on fourteen dependent variables was analysed. The data related to traits, with the exception of the amount of brood in the spring and summer, have a non-normal distribution. The data of bee infestation with Varroa were transformed according to the log (x + 1) formula. This variable was analysed using the non-parametric Kruskal–Wallis and Mann–Whitney U tests. The data of BC0, BC1, and BC2 for the variable type of location and year of the survey were analysed using a student t-test and its modification with Welch’s t-test. The data for the variable location were analysed using ANOVA and its modification of Hartley’s test for non-homogeneous variances. The identification of homogeneous groups was conducted through the Tukey test (HSD for various N). To present the differences between locations in the individual characteristics of bee colonies graphically, cluster analysis was performed. Spearman’s rank correlation coefficients were calculated to identify the relationship between features. A multivariate principal component analysis (PCA) was also conducted, given the presence of significant intercorrelations among the measured variables. All statistical calculations and figures were prepared using Statistica 13 [39].

3. Results

3.1. Effect of Urban vs. Rural Locations on the Functional and Biological Characteristics of Bee Colonies

The traits that differentiated the type of location and showed significantly higher values in urban apiaries were brood count in spring BC1 (p ≤ 0.01) and brood grow dynamics BGD (p ≤ 0.01). It is probably true that the consequence of a higher brood count in spring in urban apiaries was a significantly higher infestation of colonies with the Varroa in summer (median, respectively, 0.1 and 0.0), as evidenced by the Mann–Whitney U test (p ≤ 0.01), as demonstrated in Table 2 and Supplementary Figure S1. The other characteristics did not differ significantly between apiary types, including honey production, although it was 6.1 kg higher in urban apiaries.

3.2. The Impact of Geographic Location on the Functional and Biological Characteristics of Bee Colonies

Most traits of bee colonies, as many as 12, varied significantly between locations, with the exception of Varroa infestation VInf., and the occurrence of swarming mood SB. Lublin was the most outlier in terms of positive measurement of characteristics, where as many as six parameters were significantly higher compared to other locations. These were mainly developmental indices, the number of brood and bees: B1, B2, BC0, BC1, SC1, SC3, OIndex, and production indicator HY (Table 3, Supplementary Figure S2). The greatest honey harvest was in the Warsaw region, with a yield of 68.3 kg per colony, which is significantly higher than in the other locations. In addition, the Warsaw region demonstrated the most marked discrepancy in honey yield between urban and rural apiaries, with a value of 20.7 kg (Figure 2) (p ≤ 0.01). In the Lublin region, honey yield was also found to be higher in urban apiaries, although the differences were smaller but statistically significant (p = 0.01). Tychy stands as a unique case where rural apiaries exhibited higher honey production compared to urban apiaries (Figure 2), but the differences were not significant (p = 0.32).

3.3. Influence of the Year of Study on the Functional and Biological Characteristics of Bee Colonies

As demonstrated in Table 4, the environmental conditions present in each year of the study had a significant impact on various developmental and biological parameters of bee colonies. A total of 10 traits differed significantly between years, with 6 traits manifesting at higher levels in 2022: B2, OIndex, BC0, BC1, SC1, and SC3 (Table 4). The only higher values in 2021 were those for SC2 and SB. The remaining characteristics demonstrated negligible fluctuations from year to year.

3.4. Correlation Between Individual Traits

The highest positive correlation coefficient (0.77) was observed between SC1 and BC1, indicating a relationship between the brood quantity and the number of workers in spring. Meanwhile, the highest negative correlation was identified between BC0 and BGD, suggesting a link between the number of broods in early spring and the growth dynamics of the bee population (Table 5). This coefficient indicates that bee colonies with lower brood numbers in the post-winter period revealed a greater increase in multiplication compared to those with higher brood counts in spring (Table 6). Bees’ infestation by V. destructor mites was found to be correlated with the spring brood population. Honey yield throughout the season was positively correlated with brood area and worker numbers during the entire season and negatively correlated with the number of combs in bee colonies during winter and early spring.

3.5. Multivariate Correlation by Means of PCA

The first principal component (PC1) explains 28.3% of the total variance, while the second component (PC2) accounts for 13.8%. The PCA revealed five principal components (PCs), which collectively explained 71.4% of the observed variance. The variables B1, B2, BC0, BC1, and SC1 exhibited strong positive loadings on PC1, indicating their significant contribution to this component. OIndex and HY exhibited strong positive loadings on PC2, suggesting that they play a key role in distinguishing variance along this dimension. Some variables (e.g., BC1, SC3) contributed to both PC1 and PC2, indicating that they influence multiple aspects of variance in the dataset (Figure 3 and Supplementary Figure S4).
Clustering was performed using the K-Means method with five clusters and convex hulls. The average silhouette score was 0.39, indicating slightly better cluster separation compared to the previous three-cluster partitioning (Figure 4). The variables that most effectively differentiate the clusters using the Random Forest classifier have been identified. The most significant features have been ranked according to their contribution to cluster differentiation (see Table 7).
In addition to the numerical values, the cluster results were significantly influenced by the independent variables Year (χ2(3, 200) = 14.28, p < 0.001) and Location (χ2(6, 68) = 163.27, p < 0.001). These findings suggest that there is a statistically significant relationship between year, location, and cluster formation. However, no statistically significant association was observed between the type of location and cluster division (χ2(2, 68) = 8.77, p = 0.067).

4. Discussion

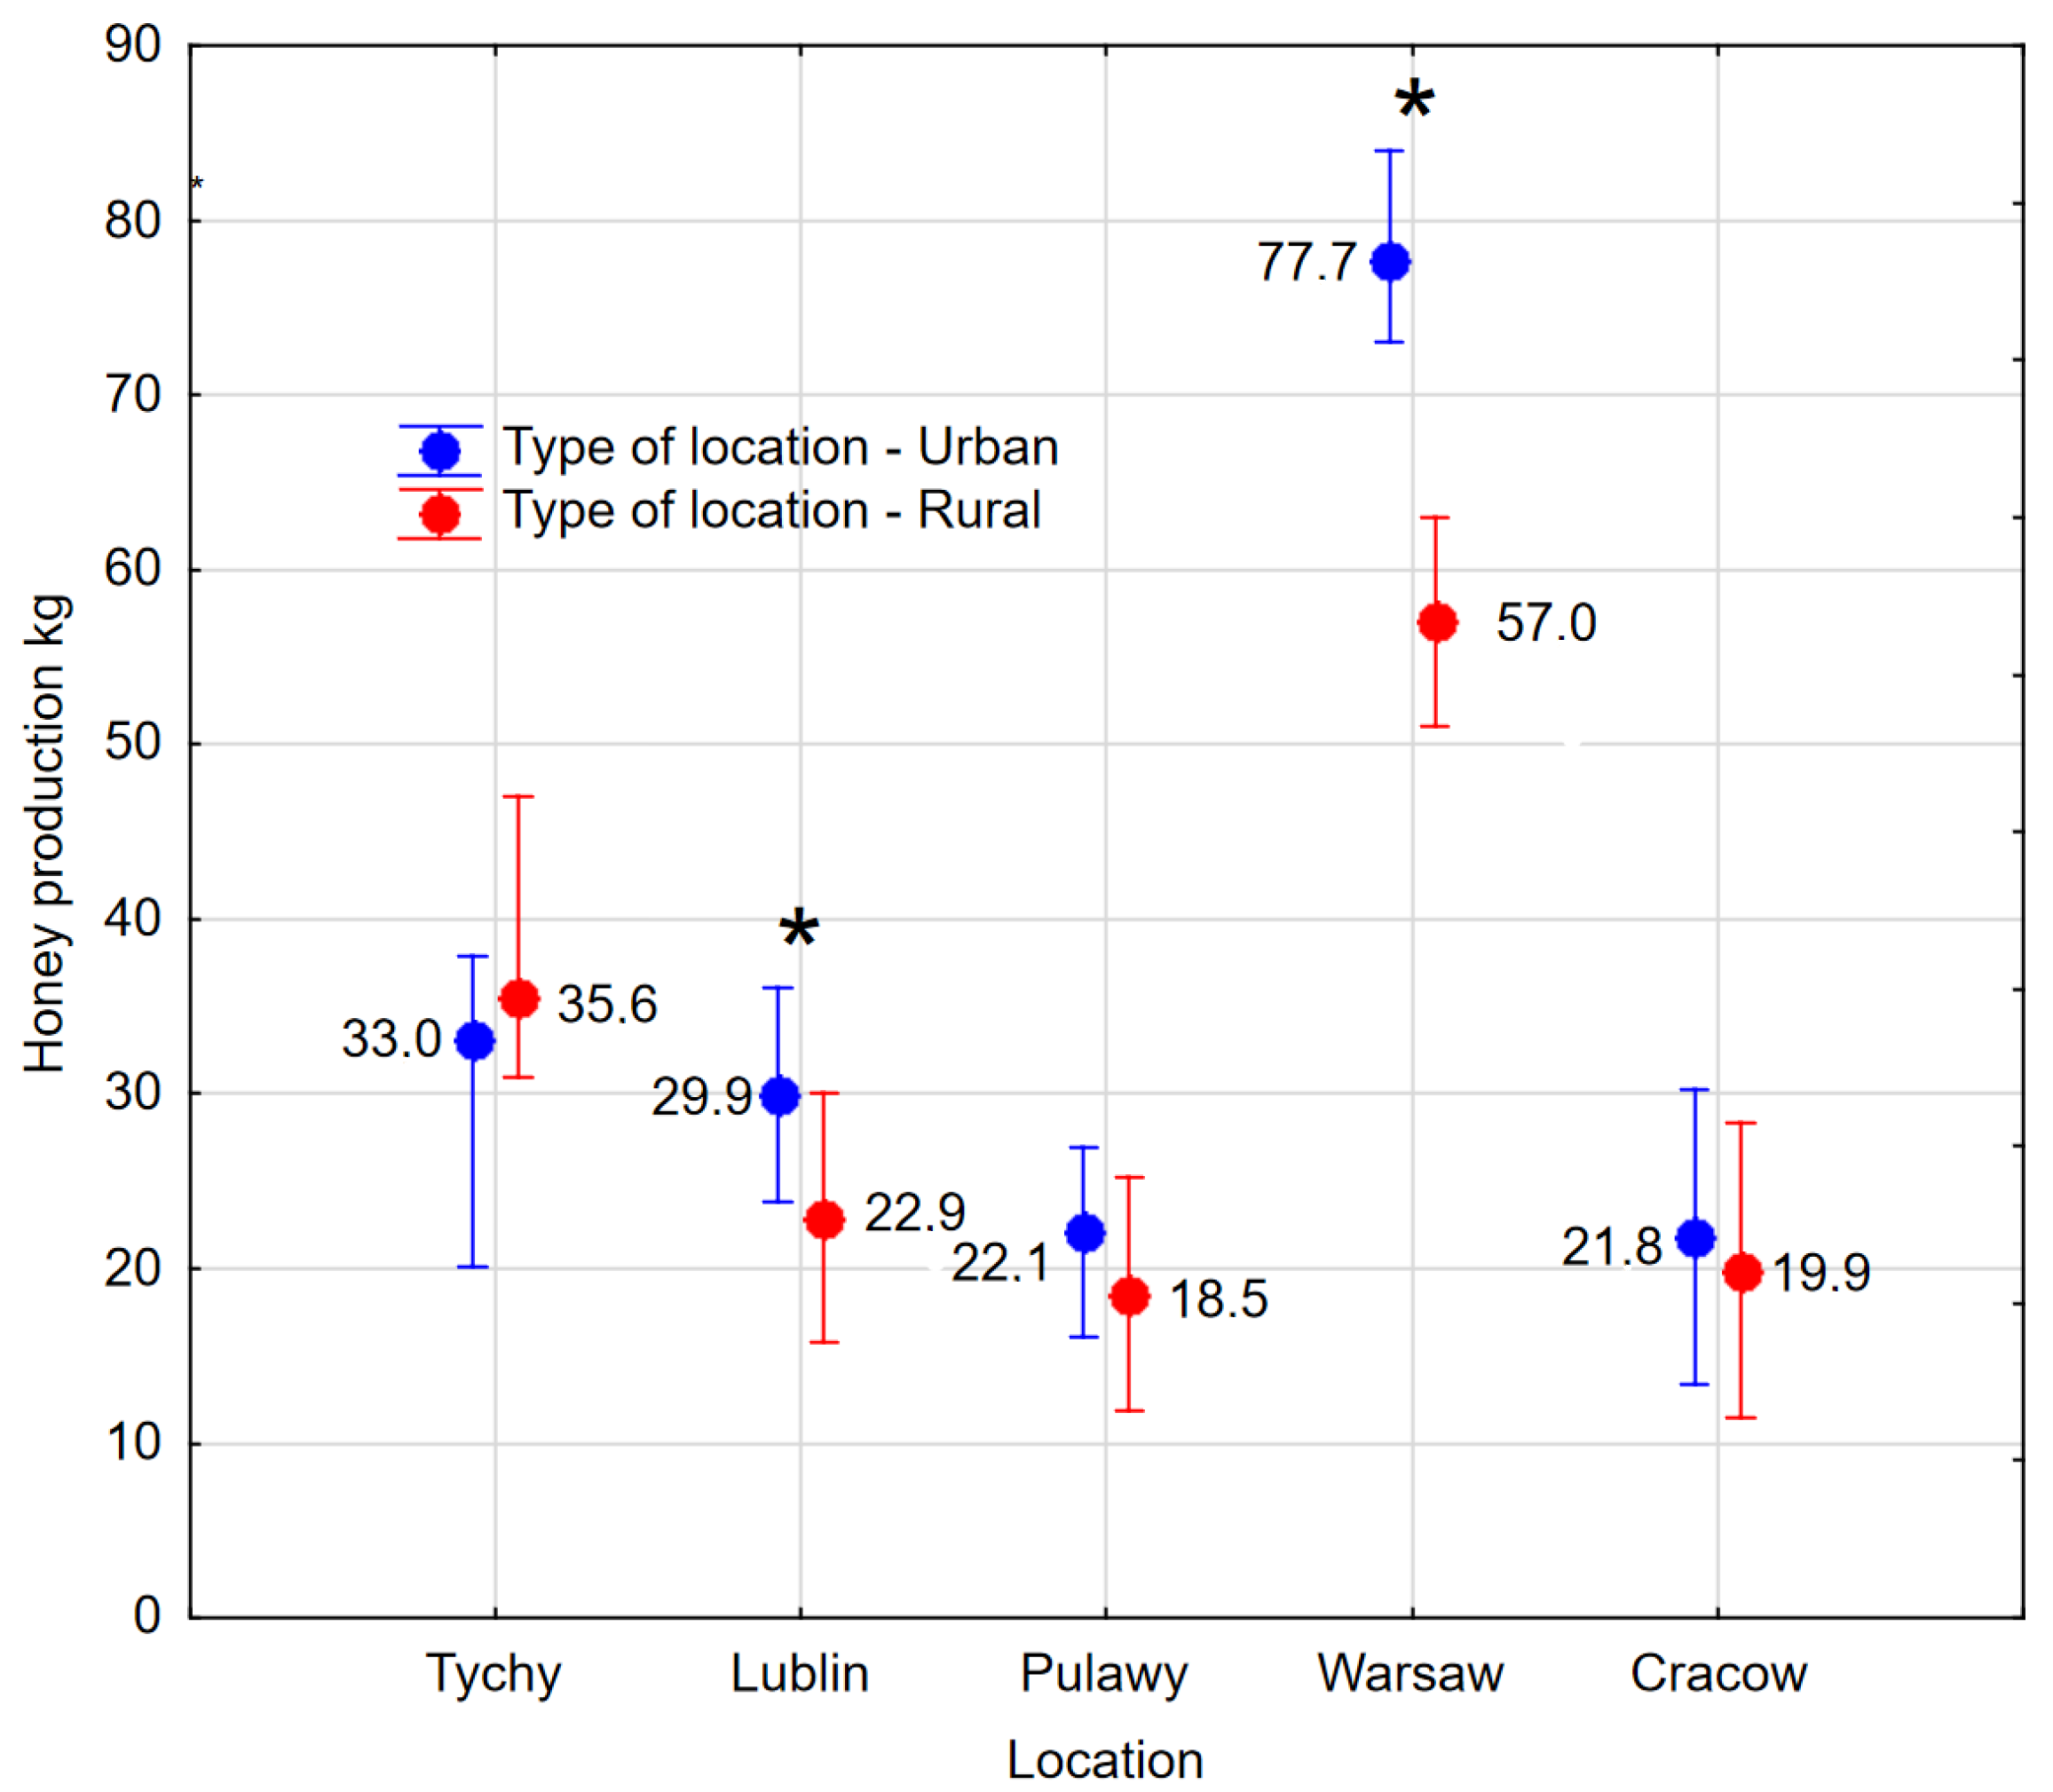
A study was conducted to ascertain the distinguishing characteristics of apiaries located in urban and agricultural areas. It was found that the distinguishing parameter is the number of broods in spring BC1, brood growth rate BGD, and bee infestation with Varroa mites VInf. The results demonstrated that urban apiaries exhibited higher values for these parameters (Table 2). This suggests that in urban environments, at the beginning of the season, bee colonies experience accelerated development. This finding has been corroborated in other studies [18,20,21,40,41,42]. In four out of five regions, higher honey yields were reported in urban areas, although this was statistically proven in only two locations. These outcomes have been corroborated by other research studies (see references [21,43,44]. In the Tychy region, honey production was dominated by rural apiaries due to favourable foraging conditions. However, it should be noted that in this study, data were collected over only one season. In addition, oilseed rape was grown in that area. That contributed to a good harvest because the area received the most rainfall, and nectar was abundant. A lack of rainfall is less likely to reduce the nectar production of trees and shrubs because of the root system. This is why the yield is higher in urban areas, where the most important honeys do not come from annual plants.
In Poland, the honey production season is short, namely 3–4 months, and the most important parameter influencing the use of beneficial insects is the intensity of spring development. The number of bees in colonies in summer was slightly lower in rural apiaries.
Intensive colony development in urban apiaries led to higher levels of Varroa mite infestation during the summer months. The spread of the parasite is favoured by colony development, as has been described in other studies [45,46,47,48]. However, infestation levels in urban apiaries have not exceeded colony-threatening values of 3/10 g bees [49,50], although some studies already consider 1/10 g bees as a critical level [51,52]. In urban areas, infestation levels were found to be higher, though not to a sufficient extent to necessitate a modification in the control strategy. However, under certain conditions, the critical level of infestation may be exceeded, particularly when the onset of spring occurs earlier than is customary. In such cases, it is recommended that bee infestation be monitored and that summer treatment be applied. Given the temporal proximity to harvest, biotechnical methods are deemed most suitable or in combination with treatments that have a short withdrawal period, such as organic acids.
Several factors have been identified as potentially contributing to low honey yields, with adverse effects on the condition of bees. In rural areas, where agricultural intensification can lead to a reduction in biodiversity, bees often face a lack of sufficient food resources, especially during periods of drought. In addition, the presence of pesticides, herbicides, and other chemicals used in agriculture can significantly reduce the ability of bees to collect nectar and produce honey. Consequently, in such instances, the quality of the soil and the diversity of the vegetation can be constrained, resulting in diminished floral availability and reduced yields. The contrasting factors observed in both urban and rural areas underscore the notion that honey yields are influenced not only by the environmental type but also by the specific characteristics of the immediate environment.
However, the 14 developmental, biological, and productivity parameters of the bee colonies were found to be most dependent on the different geographical parameters. The existence of geographical variation in living conditions for bees is not a novel finding, as evidenced by other publications [53,54,55,56]. In most cases, 12 parameters showed significant variation between geographical locations (Table 3). The apiary in Warsaw demonstrated the highest honey yield; this was a noteworthy achievement that outperformed both other regions and the rural control apiary. The average yield in Warsaw was 20.7 kg higher than in the rural apiary, a discrepancy that can be explained by the urban heat island effect, which is a term used to describe the phenomenon by which urban areas are found to be warmer than the surrounding countryside. It has been demonstrated that species which are more demanding in relation to temperature produce more nectar than those which inhabit areas outside the city, where other weather parameters are similar, e.g., insolation or amount of rainfall. The apiary in Warsaw exhibited the lowest overwintering strength while simultaneously achieving the highest honey yield among all the locations studied. This phenomenon may be attributed to the excessive workload placed on the bees. The practical advice to be derived from this experience is that, in areas where temperatures are higher and bees develop more rapidly during the spring months, it is possible to overwinter them in a state of reduced strength and yet still expect them to demonstrate high levels of productivity.
The urban apiary in Lublin demonstrated exceptional performance in the majority of the 14 parameters under consideration. It was characterised by notably dynamic colony development during the spring period and the presence of stronger colonies throughout the season. This phenomenon may be attributed to the specific location of the apiary, which was the sole facility situated on the roof of a five-storey building. This particular location provides effective protection from wind while also ensuring optimal sun exposure. The distinctiveness of this region is reflected in Figure S5.
The climatic conditions at the macro- and micro-scale and forage conditions in which the experimental colonies were tested had a very significant effect on the parameters of the bee colonies. The existence of a factorial interaction was confirmed by means of a principal component analysis (PCA). Figure 2 and Figures S1–S3 demonstrate additionally that an interaction of factors of location and year of testing occurs.
In the temperate climate zones, seasonal variation in bee traits plays a crucial role. This assertion is corroborated by studies [25,57,58]. This finding is consistent with the results of the present study, which demonstrated that climatic conditions in each year significantly influenced bee overwintering B1, OIndex, spring colony development BC0, BC1, and honey yield. In 2022, the values of the key traits of colony development were higher than in 2021. These fluctuations can be attributed to various bee responses to weather conditions, such as the number of flightless days when bees are unable to forage, as well as the presence of forage plants that do not produce nectar during cold weather, such as R. pseudoacacia, which flowers briefly [57].
The environmental impact on bees was so significant in the experiment that the correlation between brood and bee numbers and honey production was low at 0.2 and 0.26, respectively. Much higher correlation coefficients were obtained by other researchers, but they kept their apiaries in one place. The correlation coefficients for brood and honey production were 0.73 [59], 0.55–0.62 [60], and 0.96 [61]. However, the correlation coefficients between the number of bees and honey production were 0.71 [59], 0.54–0.64 [60], and 0.96 [61]. In the context of urban apiculture, the conservation of wild pollinating insects should be a paramount consideration. While the majority of studies do not corroborate the competitive impact of honey bees on other Apoidea, green area planners must be cognizant of the fact that certain plant species are less attractive to honey bees but are favoured by certain bee species.

5. Conclusions

A comparative analysis of urban and rural apiaries revealed significant disparities in key parameters. These included brood numbers, colony populations, and, regrettably, V. destructor infestation level. These parameters exhibited higher values in urban apiaries, indicating a potentially accelerated development of urban bee colonies. Urban apiaries were distinguished by higher honey yields in four out of five cities, although in only two cases, the results were statistically significant. Tychy region was distinguished by its superior honey production in rural apiaries; however, it should be noted that the study was conducted over a single season, which could have influenced the results. Despite the substantial growth of colonies in urban areas, the infestation levels of the Varroa mite did not exceed levels that would threaten colony collapse, suggesting good bee health. Geographical location had the greatest impact on the 14 parameters studied. The highest honey yield was recorded in Warsaw, despite the bees being weaker there in winter. Seasonal changes in the weather, microclimatic conditions and the availability of forage had a significant impact on bee development and population numbers of colonies. Climatic conditions in different years had a substantial impact on the overwintering of bees and their spring development. It is recommended that future research efforts be focused on conducting a comprehensive analysis of the relationship between vegetation cover and its impact on bee health, nectar yield, and colony productivity. The issue will be addressed in part during the ensuing publication.

Supplementary Materials

The following supporting information can be downloaded at: www.mdpi.com/article/10.3390/app15052431/s1, Figure S1: Cluster analysis refers to the process of grouping standardised features based on their values in various types of locations. Explanations of the abbreviations: B1—Number of bees ob-served in the previous autumn. B2: Number of bees observed in the early spring. OIndex—Over-wintering index. BC0—Brood combs observed in the spring, corresponding to the flowering time of the goat willow. BC1—Brood combs observed three weeks after BC0. BGD—Brood grown dynamics. BC2—Brood combs observed in the full summer, following the main honey flow. BC3—brood combs after feeding before winter. SC1—strength of colonies in spring during BC1. SC2—strength of col-onies in full summer after the main honey flow. SC3—strength of colonies in autumn after feeding before winter. VInf.—Varroa infestation. SB—swarming behaviour. HY—honey yield. Figure S2: Cluster analysis refers to the process of grouping standardised features based on their values in various locations (regions). Figure S1 provides an explanation of the abbreviations used. Figure S3: Cluster analysis, which groups standardized features based on their values over a two years period, is presented here. Figure S1 provides an explanation of the abbreviations used. Figure S4: Heatmap of principal component loadings showing the contributions of each variable to PCA components. Red and blue indicate strong positive and negative correlations, respectively. Figure S1 provides an explanation of the abbreviations used. Figure S5: Cluster analysis: Grouping of regions based on standardized data from 14 measurements. The dendrogram shows Euclidean distance determined by Ward’s method.

Author Contributions

Conceptualization, Z.K. and D.G.; methodology, D.G.; software, D.G.; validation, D.G.; formal analysis, D.G.; investigation; P.W., data curation, P.W., writing—original draft preparation, D.G.; writing—review and editing, D.G. and Z.K.; visualization, D.G.; supervision, Z.K.; project administration, Z.K.; founding acquisition, Z.K. and D.G. All authors have read and agreed to the published version of the manuscript.

Funding

The present study received financial support in the form of a basic subsidy from the Ministry of Science and Higher Education. Research number ZP/5/20208.5.20.

Institutional Review Board Statement

Not applicable.

Informed Consent Statement

Not applicable.

Data Availability Statement

The raw data supporting the conclusions of this article will be made available by the authors upon request.

Acknowledgments

The authors would like to thank Przemysław Szeliga, Monika Leleń (Academy of Beekeeping in Cracow), Jakub Gąbka, Zbigniew Kamiński (Warsaw University of Life Sciences), and Marcin Sudziński (Center for the Meeting of Cultures in Lublin) for their invaluable technical assistance in conducting the study.

Conflicts of Interest

The authors declare no conflicts of interest.

References

  1. Semkiw, P. Preparation of a Report on the State of Beekeeping in Poland and Analysis of the Quality (Authenticity/Contamination and/or Adulteration) of Honey Imported from Ukraine. 2023. Available online: https://www.inhort.pl/wp-content/uploads/2024/01/11.3_2023_Streszczenie.pdf (accessed on 24 March 2024).
  2. Zheng, H.; Cao, L.; Huang, S.; Neumann, P.; Hu, F. Current Status of the Beekeeping Industry in China. In Asian Beekeeping in the 21st Century; Chantawannakul, P., Williams, G., Neumann, P., Eds.; Springer: Singapore, 2018. [Google Scholar] [CrossRef]
  3. Huddleston, B.; Ataman, E.; d’Ostiani, L.F. Towards a GIS-Based Analysis of Mountain Environments and Population; Working Paper No 10, Environment and Natural Resources; Food and Agriculture Organization of the United Nations: Rome, Italy, 2003. Available online: http://www.fao.org/3/y4558e/y4558e.pdf (accessed on 24 March 2024).
  4. FAOSTAT-Food and Agriculture Data. Available online: https://www.fao.org/faostat/en/#home (accessed on 10 September 2024).
  5. The World Factbook. Available online: https://www.cia.gov/the-world-factbook/ (accessed on 24 March 2024).
  6. Breeze, T.D.; Bailey, A.P.; Balcombe, K.G.; Potts, S.G. Pollination services in the UK: How important are honeybees? Agric. Ecosyst. Environ. 2011, 142, 137–143. [Google Scholar] [CrossRef]
  7. Breeze, T.D.; Vaissière, B.E.; Bommarco, R.; Petanidou, T.; Seraphides, N.; Kozák, L.; Scheper, J.; Biesmeijer, J.C.; Kleijn, D.; Gyldenkærne, S.; et al. Agricultural Policies Exacerbate Honeybee Pollination Service Supply-Demand Mismatches Across Europe. PLoS ONE 2014, 9, e82996. [Google Scholar] [CrossRef] [PubMed]
  8. Vanengelsdorp, D.; Meixner, M.D. A historical review of managed honey bee populations in Europe and the United States and the factors that may affect them. J. Invertebr. Pathol. 2010, 103, S80–S95. [Google Scholar] [CrossRef] [PubMed]
  9. Kluser, S.; Chauzat, M.P.; Pettis, J.S. UNEP Emerging Issues: Global Honey Bee Colony Disorder and Other Threats to Insect Pollinators; United Nations Environment Program: Nairobi, Kenya, 2010. [Google Scholar]
  10. Lin, Z.; Shen, S.; Wang, K.; Ji, T. Biotic and abiotic stresses on honeybee health. Integr. Zool. 2024, 19, 442–457. [Google Scholar] [CrossRef] [PubMed]
  11. El-Seedi, H.R.; Ahmed, H.R.; El-Wahed, A.A.A.; Saeed, A.; Algethami, A.F.; Attia, N.F.; Guo, Z.; Musharraf, S.G.; Khatib, A.; Alsharif, S.M.; et al. Bee Stressors from an Immunological Perspective and Strategies to Improve Bee Health. Vet. Sci. 2022, 9, 199. [Google Scholar] [CrossRef] [PubMed]
  12. Staveley, J.P.; Law, S.A.; Fairbrother, A.; Menzie, C.A. A Causal Analysis of Observed Declines in Managed Honey Bees (Apis mellifera). Hum. Ecol. Risk Assess. 2014, 20, 566–591. [Google Scholar] [CrossRef] [PubMed]
  13. Potts, S.G.; Biesmeijer, J.C.; Kremen, C.; Neumann, P.; Schweiger, O.; Kunin, W.E. Global pollinator declines: Trends, impacts and drivers. Trends Ecol. Evol. 2010, 25, 345–353. [Google Scholar] [CrossRef] [PubMed]
  14. Rosenkranz, P.; Aumeier, P.; Ziegelmann, B. Biology and control of Varroa destructor. J. Invertebr. Pathol. 2010, 103 (Suppl. S1), S96–S119. [Google Scholar] [CrossRef] [PubMed]
  15. Dixon, D.J.; Zheng, H.; Otto, C.R.V. Land conversion and pesticide use degrade forage areas for honey bees in America’s beekeeping epicenter. PLoS ONE 2021, 16, e0251043. [Google Scholar] [CrossRef] [PubMed] [PubMed Central]
  16. Otto, C.R.V.; Roth, C.L.; Carlson, B.L.; Smart, M.D. Land-use change reduces habitat suitability for supporting managed honey bee colonies in the Northern Great Plains. Proc. Natl. Acad. Sci. USA 2016, 113, 10430–10435. [Google Scholar] [CrossRef] [PubMed]
  17. Otto, C.R.V.; Zheng, H.; Gallant, A.L.; Iovanna, R.; Carlson, B.L.; Smart, M.D.; Hyberg, S. Past role and future outlook of the Conservation Reserve Program for supporting honey bees in the Great Plains. Proc. Natl. Acad. Sci. USA 2018, 115, 7629–7634, Erratum in Proc. Natl. Acad. Sci. USA 2018, 115, E7651. [Google Scholar] [CrossRef] [PubMed] [PubMed Central]
  18. Zawislak, J.; Adamczyk, J.; Johnson, D.R.; Lorenz, G.; Black, J.; Hornsby, Q.; Stewart, S.D.; Joshi, N. Comprehensive Survey of Area-Wide Agricultural Pesticide Use in Southern United States Row Crops and Potential Impact on Honey Bee Colonies. Insects 2019, 10, 280. [Google Scholar] [CrossRef] [PubMed] [PubMed Central]
  19. Rinkevich, F.D.; Danka, R.G.; Rinderer, T.E.; Margotta, J.W.; Bartlett, L.J.; Healy, K.B. Relative impacts of Varroa destructor (Mesostigmata: Varroidae) infestation and pesticide exposure on honey bee colony health and survival in a high-intensity corn and soybean producing region in northern Iowa. J. Insect Sci. 2024, 24, 18. [Google Scholar] [CrossRef] [PubMed] [PubMed Central]
  20. Fortel, L.; Henry, M.; Guilbaud, L.; Guirao, A.L.; Kuhlmann, M.; Mouret, H.; Rollin, O.; Vaissière, B.E. Decreasing Abundance, Increasing Diversity and Changing Structure of the Wild Bee Community (Hymenoptera: Anthophila) along an Urbanization Gradient. PLoS ONE 2014, 9, e104679. [Google Scholar] [CrossRef]
  21. Harrison, T.; Winfree, R. Urban drivers of plant-pollinator interactions. Funct. Ecol. 2015, 29, 879–888. [Google Scholar] [CrossRef]
  22. Banaszak-Cibicka, W.; Żmihorski, M. Wild bees along an urban gradient: Winners and losers. J. Insect Conserv. 2012, 16, 331–343. [Google Scholar] [CrossRef]
  23. Cane, J.H. Pollination potential of the bee Osmia aglaia for cultivated red raspberries and blackberries (Rubus: Rosaceae). Hortic. Sci. 2005, 40, 1705–1708. [Google Scholar] [CrossRef]
  24. Chapman, R.E.; Bourke, A.F.G. The influence of sociality on the conservation biology of social insects. Ecol. Lett. 2001, 4, 650–662. [Google Scholar] [CrossRef]
  25. Birdshire, K.R.; Carper, A.L.; Briles, C.E. Bee community response to local and landscape factors along an urban-rural gradient. Urban Ecosyst. 2020, 23, 689–702. [Google Scholar] [CrossRef]
  26. Ropars, L.; Dajoz, I.; Fontaine, C.; Muratet, A.; Geslin, B. Wild pollinator activity negatively related to honey bee colony densities in urban context. PLoS ONE 2019, 14, e0222316. [Google Scholar] [CrossRef] [PubMed]
  27. Geldmann, J.; Gonza’lez-Varo, J.P. Conserving honey bees does not help wildlife. Science 2018, 359, 392–393. [Google Scholar] [CrossRef]
  28. Colla, S.R.; MacIvor, J.S. Questioning public perception, conservation policy, and recovery actions for honeybees in North America. Conserv. Biol. 2017, 31, 1202–1204. [Google Scholar] [CrossRef] [PubMed]
  29. Geslin, B.; Gauzens, B.; Baude, M.; Dajoz, I.; Fontaine, C.; Henry, M.; Ropars, L.; Rollin, O.; Thebault, E.; Vereecken, N.J. Massively Introduced Managed Species and Their Consequences for Plant–Pollinator Interactions. Adv. Ecol. Res. 2017, 57, 1–53. [Google Scholar] [CrossRef]
  30. Mallinger, R.E.; Gaines-Day, H.R.; Gratton, C. Do managed bees have negative effects on wild bees?: A systematic review of the literature. PLoS ONE 2017, 12, e0189268. [Google Scholar] [CrossRef]
  31. Wojcik, V.A.; Morandin, L.A.; Davies Adams, L.; Rourke, K.E. Floral Resource Competition Between Honey Bees and Wild Bees: Is There Clear Evidence and Can We Guide Management and Conservation? Environ. Entomol. 2018, 47, 822–833. [Google Scholar] [CrossRef] [PubMed]
  32. Schofield, H. Paris fast becoming queen bee of the urban apiary world: BBC. 2010. Available online: http://www.bbc.co.uk/news/world-europe-10942618 (accessed on 7 May 2024).
  33. Kosut, M.; Moore, L. Buzz: Urban Beekeeping and the Power of the Bee; New York University Press: New York, NY, USA, 2013; p. 251. [Google Scholar] [CrossRef]
  34. Vanengelsdorp, D.; Evans, J.D.; Saegerman, C.; Mullin, C.; Haubruge, E.; Nguyen, B.K.; Frazier, M.; Frazier, J.; Cox-Foster, D.; Chen, Y.; et al. Colony collapse disorder: A descriptive study. PLoS ONE 2009, 4, e6481. [Google Scholar] [CrossRef]
  35. Chauzat, M.-P.; Cauquil, L.; Roy, L.; Franco, S.; Hendrikx, P.; Ribière-Chabert, M. Demographics of the European Apicultural Industry. PLoS ONE 2013, 8, e79018. [Google Scholar] [CrossRef] [PubMed]
  36. Visick, O.D.; Ratnieks, F.L.W. Density of wild honey bee, Apis mellifera, colonies worldwide. Ecol. Evol. 2023, 13, e10609. [Google Scholar] [CrossRef] [PubMed]
  37. Imdorf, A.; Bühlmann, G.; Gerig, L.; Kilchenmann, V.; Wille, H. Überprüfung der Schätzmethode zur Ermittlung der Brutfläche und der Anzahl Arbeiterinnen in freifliegenden Bienenvölkern. Apidologie 1987, 18, 137–146. [Google Scholar] [CrossRef]
  38. Dietemann, V.; Nazzi, F.; Martin, S.J.; Anderson, D.L.; Locke, B.; Delaplane, K.S.; Wauquiez, Q.; Tannahill, C.; Frey, E.; Ziegelmann, B.; et al. Standard methods for Varroa research. J. Apic. Res. 2013, 52, 1–54. [Google Scholar] [CrossRef]
  39. TIBCO Software Inc. Statistica, 2017, version 13; Data Analysis Software System; TIBCO Software Inc.: Palo Alto, CA, USA, 2017. [Google Scholar]
  40. Abella, J.C.; Leimbgruber, M.; Müller, S.; Selva, S.; Frey, D.; Moretti, M. For a Sustainable Coexistence Between Honeybees and Wild Bees in Cities; City4Bees. Final report; Swiss Federal Research Institute WSL: Birmensdorf, Switzerland, 2023. [Google Scholar]
  41. Remmers, R.; Frantzeskaki, N. Bees in the city: Findings from a scoping review and recommendations for urban planning. Ambio 2024, 53, 1281–1295. [Google Scholar] [CrossRef] [PubMed]
  42. Wilson, C.J.; Jamieson, M.A. The effects of urbanization on bee communities depends on floral resource availability and bee functional traits. PLoS ONE 2019, 14, e0225852. [Google Scholar] [CrossRef] [PubMed]
  43. Lecocq, A.; Kryger, P.; Vejsnæs, F.; Bruun Jensen, A. Weight Watching and the Effect of Landscape on Honeybee Colony Productivity: Investigating the Value of Colony Weight Monitoring for the Beekeeping Industry. PLoS ONE 2015, 10, e0132473. [Google Scholar] [CrossRef] [PubMed]
  44. Baldock, K.C.R.; Goddard, M.A.; Hicks, D.M.; Kunin, W.E.; Mitschunas, N.; Osgathorpe, L.M.; Potts, S.G.; Robertson, K.M.; Scott, A.V.; Stone, G.N. Where is the UK’s pollinator biodiversity? The importance of urban areas for flower-visiting insects. Proc. R. Soc. B 2015, 282, 20142849. [Google Scholar] [CrossRef]
  45. Gąbka, J. Correlations between the strength, amount of brood, and honey production of the honey bee colony. Med. Weter. 2014, 70, 754–756. [Google Scholar]
  46. Calderón, R.A.; Lin, H. Reproduction of Varroa destructor in worker and drone brood cells of the honey bee in Costa Rica. J. Apic. Res. 2021, 60, 183–191. [Google Scholar]
  47. Amdam, G.V.; Hartfelder, K.; Norberg, K.; Hagen, A.; Omholt, S.W. Altered physiology in worker honey bees (Hymenoptera: Apidae) infested with the parasitic mite Varroa destructor. Open Biol. J. 2004, 3, 30–38. [Google Scholar] [CrossRef]
  48. Strange, J.P.; Sheppard, W.S. Use of pulsed-field gel electrophoresis to identify non-Mendelian inheritance of mitochondrial DNA in honey bees (Apis mellifera L.). J. Apic. Res. 2001, 40, 3–7. [Google Scholar]
  49. Floris, I.; Pusceddu, M.; Satta, A. How the Infestation Level of Varroa destructor Affects the Distribution Pattern of Multi-Infested Cells in Worker Brood of Apis mellifera. Vet. Sci. 2020, 7, 136. [Google Scholar] [CrossRef] [PubMed]
  50. Gregorc, A.; Sampson, B. Diagnosis of Varroa Mite (Varroa destructor) and Sustainable Control in Honey Bee (Apis mellifera) Colonies—A Review. Diversity 2019, 11, 243. [Google Scholar] [CrossRef]
  51. Anguiano-Baez, R.; Guzman-Novoa, E.; Hamiduzzaman, M.; Espinosa-Montaño, L.G.; Correa-Benítez, A. Varroa destructor (Mesostigmata: Varroidae) Parasitism and Climate Differentially Influence the Prevalence, Levels, and Overt Infections of Deformed Wing Virus in Honey Bees (Hymenoptera: Apidae). J. Insect Sci. 2016, 16, 44. [Google Scholar] [CrossRef] [PubMed]
  52. Morfin, N.; Foster, L.J.; Guzman-Novoa, E.; Van Westendorp, P.; Currie, R.W.; Higo, H. Varroa destructor economic injury levels and pathogens associated with colony losses in Western Canada. Front. Bee Sci. 2024, 2, 1355401. [Google Scholar] [CrossRef]
  53. Gounari, S.; Proutsos, N.; Goras, G. How does weather impact on beehive productivity in a Mediterranean island? Ital. J. Agrometeorol. 2022, 1, 65–81. [Google Scholar] [CrossRef]
  54. Mahankuda, B.; Tiwari, R. Impact of Climate Change on Honeybees and Crop Production. In Adapting to Climate Change in Agriculture-Theories and Practices; Sheraz Mahdi, S., Singh, R., Dhekale, B., Eds.; Springer: Cham, Switzerland, 2024. [Google Scholar] [CrossRef]
  55. Moeller, F.E. Managing Colonies for High-Honey Yields. In Agriculture Handbook; USDA: Washington, DC, USA, 1980. [Google Scholar]
  56. Schweitzer, P.; Nombré, I.; Boussim, J.I. Honey Production for Assessing the Impact of Climatic Changes on Vegetation. Tropicultura 2013, 31, 98–102. [Google Scholar]
  57. Masaka, K. Yearly Fluctuations in Honey Production in Hokkaido, Northern Japan, with Special Reference to Weather Conditions and Masting Behavior. Int. J. Food Agric. Nat. Resour. 2023, 4, 62–68. [Google Scholar] [CrossRef]
  58. Ayers, A.C.; Rehan, S.M. Bee–plant interaction and community response along an urbanization gradient. J. Urban Ecol. 2023, 9, juad006. [Google Scholar] [CrossRef]
  59. EL-Kazafy, A.T.; Al-Kahtani, S.N. Relationship between Population Size and Productivity of Honey Bee Colonies. J. Entomol. 2013, 10, 163–169. [Google Scholar] [CrossRef]
  60. Jevtić, G.; Mladenović, M.; Anđelković, B.; Nedić, N.; Sokolović, D.; Štrbanović, R. The Correlation Between Colony Strength, Food Supply, and Honey Yield in Honey Bee Colonies. Biotechnol. Anim. Husb. 2009, 25, 1141–1147. [Google Scholar]
  61. Bhusal, S.J.; Thapa, R.B. Response of colony strength to honey production: Regression and correlation analysis. J. Inst. Agric. Anim. Sci. 2006, 27, 133–137. [Google Scholar] [CrossRef]
Figure 1. Location of experimental apiaries on a map of Poland. The location numbers are the same as those in Table 1.
Applsci 15 02431 g001
Figure 2. Geographic distribution of honey harvest, distinguishing between urban and rural locations. The vertical bars represent 95% confidence intervals. * Significant differences between urban and rural apiaries within a specified region.
Applsci 15 02431 g002
Figure 3. The PCA loadings plot demonstrates the contribution of individual variables to the first two principal components (PC1 and PC2). The direction and magnitude of each variable’s influence on these components is indicated by the arrows.
Applsci 15 02431 g003
Figure 4. K-Means clustering with five clusters and convex hulls.
Applsci 15 02431 g004
Table 1. The locations and coordinates of urban experimental apiaries and the distance from them of control apiaries located in a rural area.
No. of ApiaryLocation of the Urban Apiary (City)Coordinates of Urban ApiaryDistance (km) and Direction to the Control Apiary (Rural)The Mean Annual Temperature (°C)The Mean Annual Rainfall (mm)
1Warsaw52°17′05.0″ N 20°55′52.0″ E39.5 km, S8.5530
2Lublin51°14′48.6″ N 22°32′54.7″ E22.4 km W8.3560
3Pulawy51°24′35.7″ N 21°58′44.2″ E4.5 km, SW8.4590
4Cracow49°59′42.6″ N 19°59′23.2″ E17.2 km, E8.7670
5Tychy50°6′10.8″ N 19°2′7.098″ E35.8 km, SE8.2700
Table 2. Effects of urban and rural apiary locations on utility and biological characteristics of bee colonies.
Traits or Measurements *Type of LocationStatistical Test **p-Value
Urban (Mean ± SE)Rural (Mean ± SE)
B15.9 ± 0.125.8 ± 0.15U = 3269, N1 = 87, N2 = 760.90
B25.1 ± 0.125.0 ± 0.17U = 3195, N1 = 87, N2 = 740.93
OIndex0.82 ± 0.110.91 ± 0.12U = 3195, N1 = 89, N2 = 850.51
BC0 (dm2)28.10 ± 1.4230.02 ± 1.80t = −0.82, df = 159, N1 = 87, N2 = 740.40
BC1 (dm2)62.8 ± 2.1853.9 ± 2.59t = 2.67, df = 158, N1 = 87, N2 = 73≤0.01
BGD (%)260.8 ± 13.83192.3 ± 6.90U = 2152, N1 = 87, N2 = 73≤0.01
BC2 (dm2)62.0 ± 1.7963.1 ± 2.83Welch’s t-test = −0.30, df = 119.5, N1 = 85, N2 = 700.75
BC3 (dm2)1.75 ± 0.431.78 ± 0.44U = 2956, N1 = 86, N2 = 700.84
SC1 (number)8706.4 ± 404.68626.0 ± 495.3U = 2994, N1 = 87, N2 = 730.62
SC2 (number)14,404.3 ± 580.313,231.6 ± 504.5U = 2657, N1 = 85, N2 = 700.25
SC3 (number)7074.7 ± 200.17021.0 ± 261.8U = 2847, N1 = 86, N2 = 700.56
VInf. (No/10 g of bees)0.19 ± 0.040.17 ± 0.04U = 2875, N1 = 89, N2 = 87≤0.01
SB (points 0–3)2.074 ± 0.062.6 ± 0.11U = 3101, N1 = 87, N2 = 720.87
HY (kg)36.9 ± 1.5530.8 ± 1.61U = 2685, N1 = 86, N2 = 710.11
* The following section provides explanations of the abbreviations listed in the first column. B1—Number of bees observed in the previous autumn. B2: Number of bees observed in the early spring. OIndex—Overwintering index. BC0—Brood combs observed in the spring, corresponding to the flowering time of the goat willow. BC1—Brood combs observed three weeks after BC0. BGD—Brood grown dynamics. BC2—Brood combs observed in the full summer, following the main honey flow. BC3—brood combs after feeding before winter. SC1—strength of colonies in spring during BC1. SC2—strength of colonies in full summer after the main honey flow. SC3—strength of colonies in autumn after feeding before winter. VInf.—Varroa infestation. SB—swarming behaviour. HY—honey yield. ** The following section provides explanations of the abbreviations listed in column statistical analysis. U—Mann–Whitney U test, t—Student’s t-test.
Table 3. Effects of apiary location on the utility and biological characteristics of bee colonies.
Traits or Measurements *Location ***Statistical Test **p-Value
Warsow (Mean ± SE)Lublin (Mean ± SE)Pulawy (Mean ± SE)Cracow (Mean ± SE)Tychy (Mean ± SE)
B14.8 ± 0.07 a7.4 ± 0.19 c5.8 ± 0.15 b5.9 ± 0.12 b5.7 ± 0.09 bH = 91.37, df = 4, N = 163) ≤0.01
B24.3 ± 0.17 a6.1 ± 0.22 c4.8 ± 0.20 ab5.5 ± 0.10 bc5.1 ± 0.10 bH = 45.93, df = 4, N = 161≤0.01
OIndex0.60 ± 0.11 a1.55 ± 0.24 b0.95 ± 0.15 ab0.34 ± 0.09 a0.53 ± 0.11 abH =19.06, df =4, N = 174≤0.01
BC0 (dm2)25.25 ± 1.34 a39.15 ± 2.93 b28.71 ± 2.64 a20.83 ± 1.74 a29.72 ± 1.42 abF = 7.4, df = 4≤0.01
BC1 (dm2)56.5 ± 3.02 a72.0 ± 9.98 b53.8 ± 3.33 a63.5 ± 4.93 ab48.6 ± 1.85 aF = 5.7, df = 4≤0.01
BGD (%)226.1 ± 5.98 b210.0 ± 16.67 a227.1 ± 19.80 a336.7 ± 34.32 b166.6 ± 5.95 aH = 32.02, df = 4, N = 160)≤0.01
BC2 (dm2)65.0 ± 2.87 b71.5 ± 3.28 b60.0 ± 3.25 b40.4 ± 3.70 a69.9 ± 1.31 bHartley’s = 12.22, df = 4≤0.01
BC3 (dm2)1.16 ± 0.47 ab2.79 ± 0.85 ab3.04 ± 0.76 b0.03 ± 0.02 a0.35 ± 0.37 abH = 14.19, df = 4, N = 156 ≤0.01
SC1 (number)6759.4 ± 304.2 a13,767.5 ± 873.5 c7409.1 ± 357.0 a9996.2 ± 541.2 b6162.5 ± 133.6 aH = 61.38, df = 4, N = 160≤0.01
SC2 (number)15,241.3 ± 1130.6 b14,074.1 ± 695.0 b1322.3 ± 503.9 b10,100.0 ± 373.3 a15,695.0 ± 13.2 bH = 29.97, df = 4, N = 155≤0.01
SC3 (number)5886.1 ± 204.6 a9405.0 ± 308.0 b6571.6 ± 256.6 a7871.7 ± 233.4 c5982.5 ± 341.8 aH = 29.97, df = 4, N = 155≤0.01
VInf. (No/10 g of bees)0.16 ± 0.070.21 ± 0.080.12 ± 0.030.27 ± 0.070.15 ± 0.04H = 3.24, df = 4, N = 1760.51
SB (points 0–3)2.80 ± 0.092.89 ± 0.092.52 ± 0.142.55 ± 0.152.85 ± 0.08H = 6.92, df = 4, N = 1590.14
HY (kg)68.3 ± 3.4 c27.0 ± 1.6 ab20.9 ± 0.9 a20.8 ± 0.91 a34.4 ± 2.96 bH = 92.82, df = 4, N = 157≤0.01
* Abbreviations explained in Table 1. ** The following section provides explanations of the abbreviations listed in column statistical analysis. H—Kruskal–Wallis test, F—ANOVA, analysis of variance. *** Different letters in the rows indicate significant differences between the location means after post hoc comparisons.
Table 4. The impact of year of research on the individual functional and biological characteristics of bee colonies.
Traits or Measurements *Year of ResearchStatistical Test **p-Value
2021 (Mean ± SE)2022 (Mean ± SE)
B15.8 ± 0.095.9 ± 0.19U = 3278.5, N1 = 89, N2 = 740.96
B24.7 ± 0.145.3 ± 0.14U = 2375, N1 = 87, N2 = 74≤0.01
OIndex1.02 ± 0.100.72 ± 0.12U = 2821, N1 = 84, N2 = 90≤0.01
BC0 (dm2)26.91 ± 1.7530.75 ± 1.45t = −1.7, df = 159, N1 = 87, N2 = 740.09
BC1 (dm2)53.2 ± 2.5363.4 ± 2.20t = −3.04, df = 158, N1 = 87, N2 = 73≤0.01
BGD (%)223.5 ± 12.19234.6 ± 12.02U = 3039, N1 = 87, N2 = 730.60
BC2 (dm2)65.3 ± 1.9960.1 ± 2.44Welch’s = 1.66, df = 150.4, N1 = 72, N2 = 830.09
BC3 (dm2)1.94 ± 0.451.62 ± 0.42U = 2785, N1 = 72, N2 = 840.24
SC1 (number)7790.6 ± 439.89407.3 ± 431.6U = 2170, N1 = 73, N2 = 87≤0.01
SC2 (number)15,625.8 ± 630.912,355.6 ± 426.7U = 1772.5, N1 = 72, N2 = 85≤0.01
SC3 (number)6544.3 ± 255.47484.6 ± 191.6U = 2049.5, N1 = 72, N2 = 84≤0.01
VInf. (No/10 g of bees)0.15 ± 0.040.21 ± 0.04U = 3299.5, N1 = 72, N2 = 840.07
SB (points 0–3)2.85 ± 0.062.53 ± 0.10U = 2592.5, N1 = 72, N2 = 84≤0.01
HY (kg)36.8 ± 2.7137.5 ± 2.78U = 2952, N1 = 73, N2 = 840.68
* Abbreviations explained in Table 1. ** The following section provides explanations of the abbreviations listed in column statistical analysis. U—Mann–Whitney U test, t—Student’s t-test.
Table 5. Spearman correlation coefficients between individual developmental traits and production parameters. Only significant relationships were considered.
Trait *B1B2OIndexBC0BC1BGDSC1BC2SC2HY
B20.67
OIndex0.22−0.47
BC00.410.62−0.29
BC10.380.48−0.200.60
BGD−0.20−0.32 −0.63
SC10.520.63−0.180.600.77
SC2 0.38
HY−0.39−0.19 0.19 0.200.26
VInf. −0.170.280.25
BC3 0.17
SC30.430.34 0.220.22 0.45 −0.25
SB 0.18−0.28−0.28 −0.22 0.22−0.17
* Abbreviations explained in Table 1.
Table 6. The mean values of the traits in the groups of colonies were classified according to BC0 values relative to the median BC0, which is 28.4 dm2.
Grup of ColoniesNTrait *
BC0 (dm2)BC1 (dm2)BGD (%)
BCO < Median 7917.9 48.6284
BCO > Median 8139.968.5 176
* Abbreviations explained in Table 1.
Table 7. Significance of features ranked according to their contribution to cluster differentiation. The sum of all feature importance values is 1.0 (or 100% if expressed as a percentage).
Trait *HYBC1BC0B1SC1B2OIndexSC3BGDBC2VInfSBSC2BC3
Significance0.130.120.110.110.100.080.070.060.050.030.020.020.010.01
* Abbreviations explained in Table 1.
Disclaimer/Publisher’s Note: The statements, opinions and data contained in all publications are solely those of the individual author(s) and contributor(s) and not of MDPI and/or the editor(s). MDPI and/or the editor(s) disclaim responsibility for any injury to people or property resulting from any ideas, methods, instructions or products referred to in the content.

