
Probing Petroleum Sources Using Geochemistry, Multivariate Analysis, and Basin Modeling: A Case Study from the Dibei Gas Field in the Northern Kuqa Foreland Basin, NW China


Abstract
1. Introduction
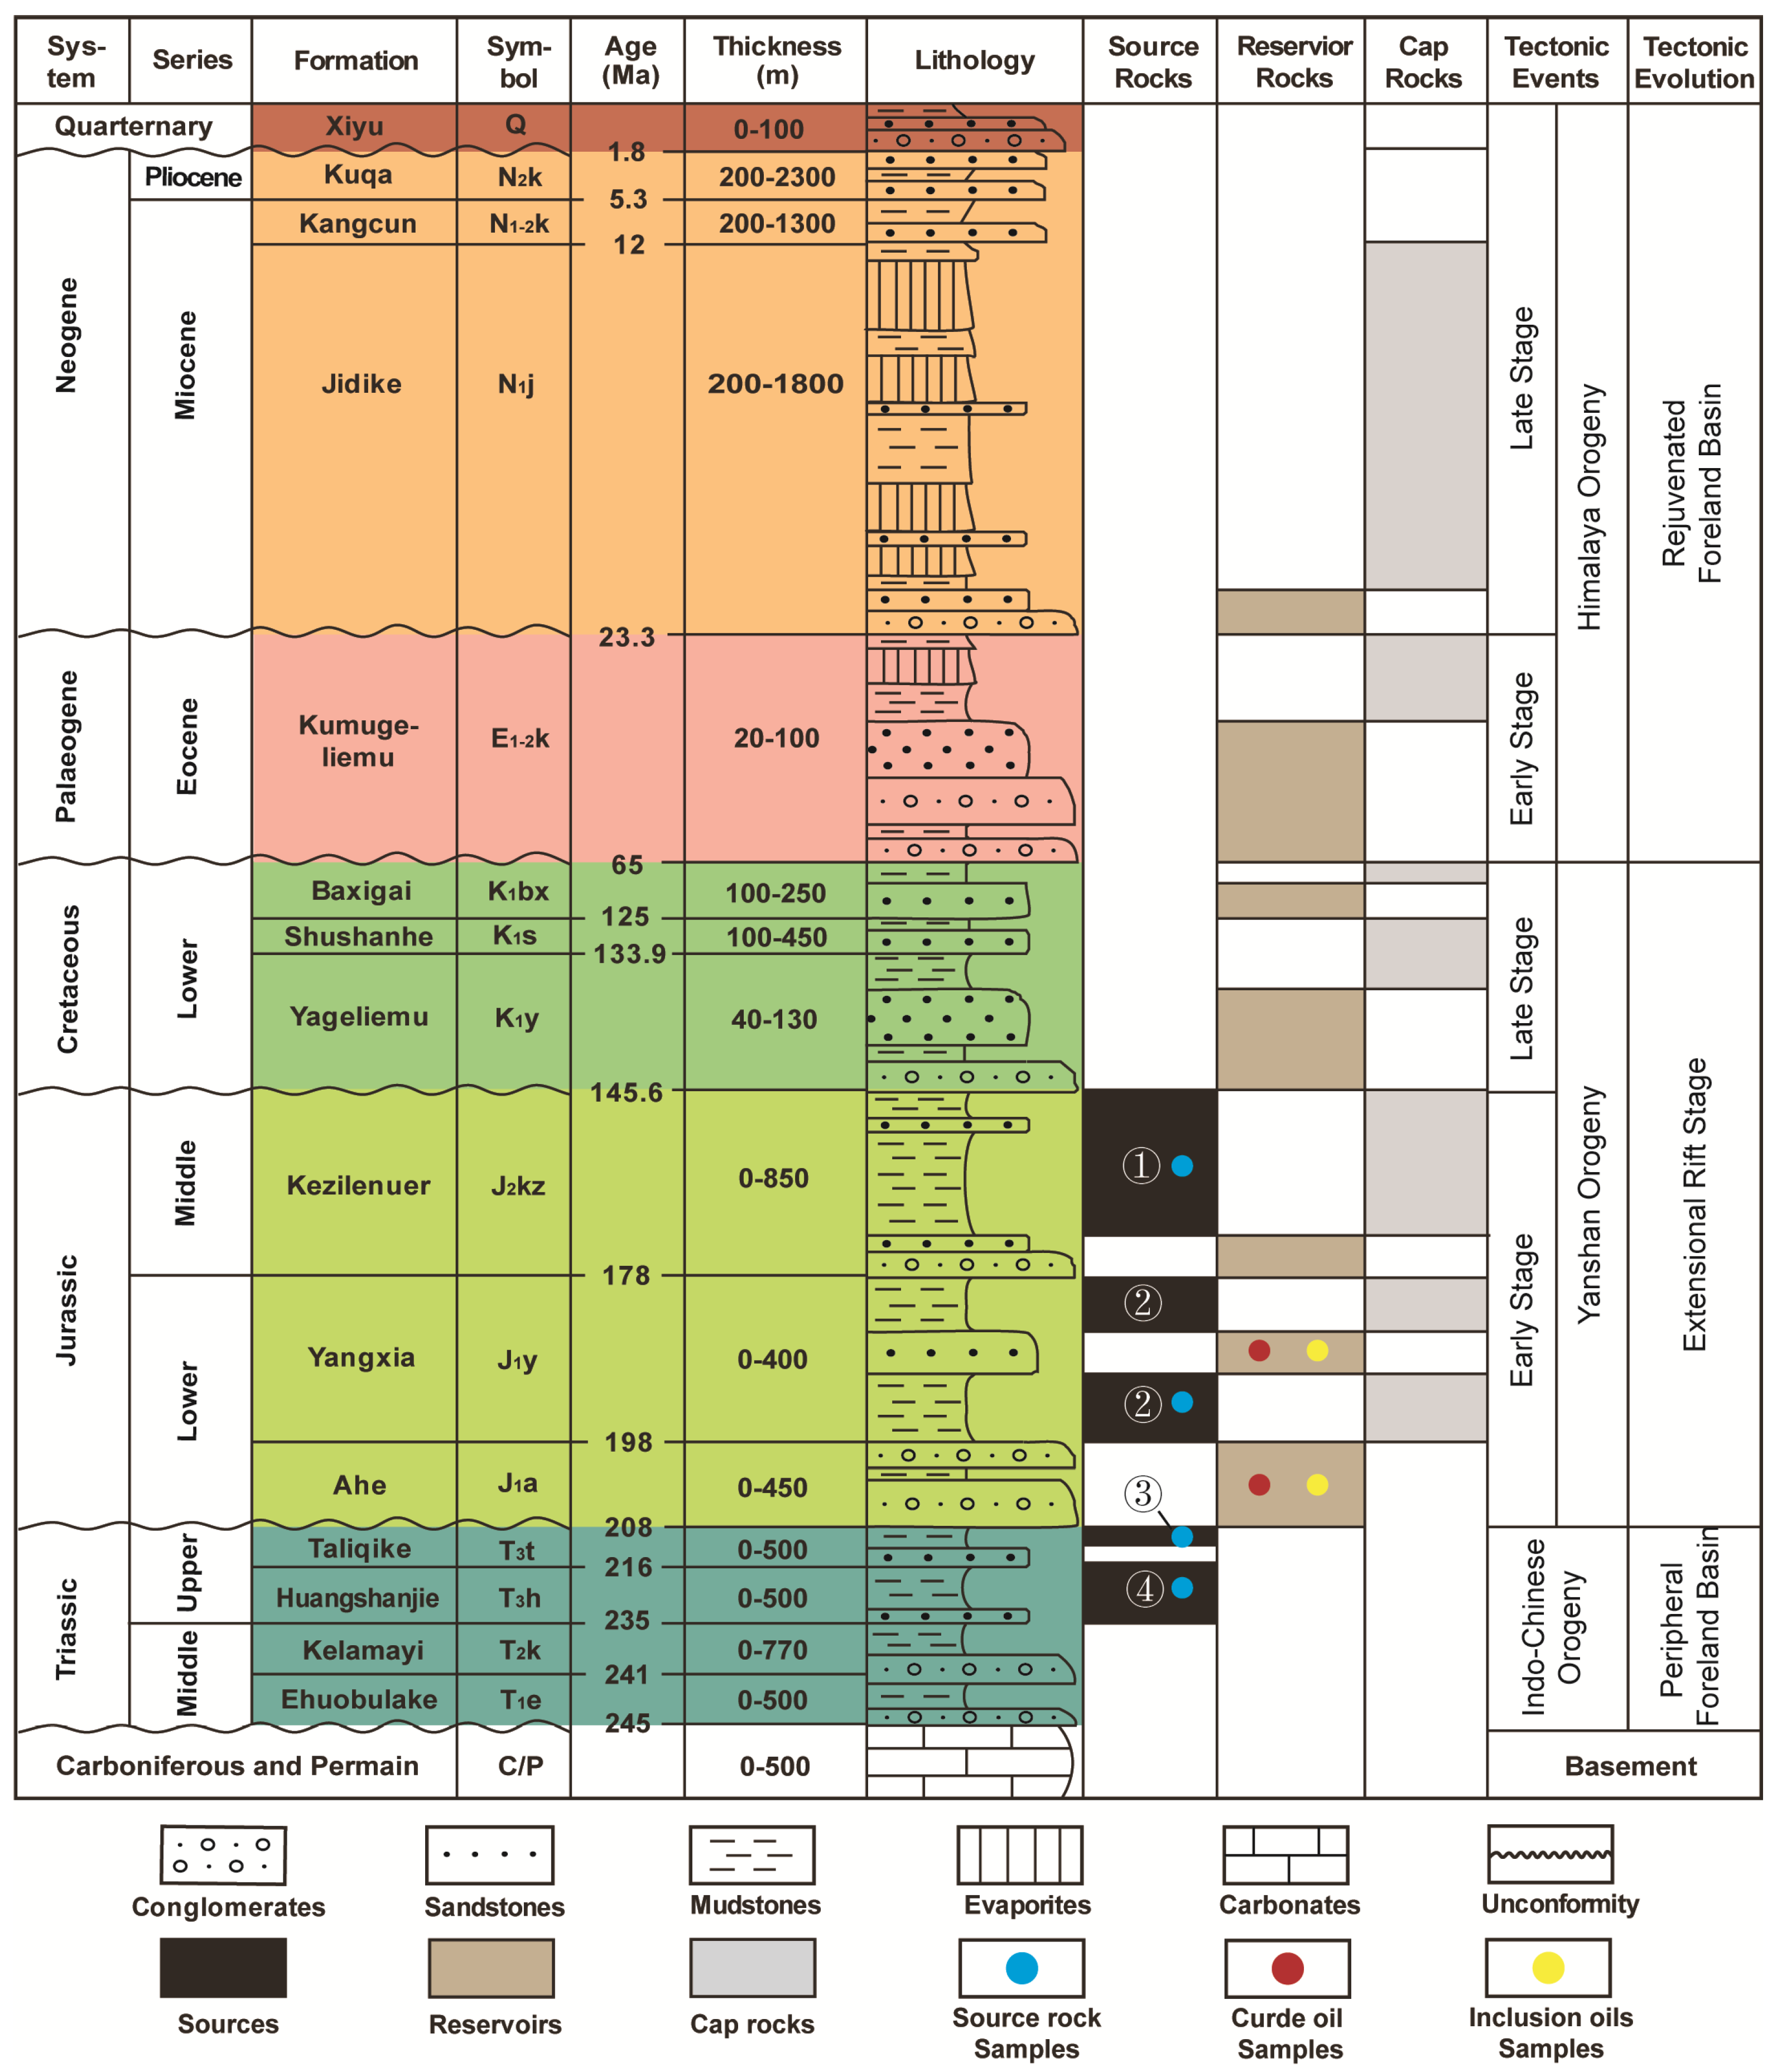
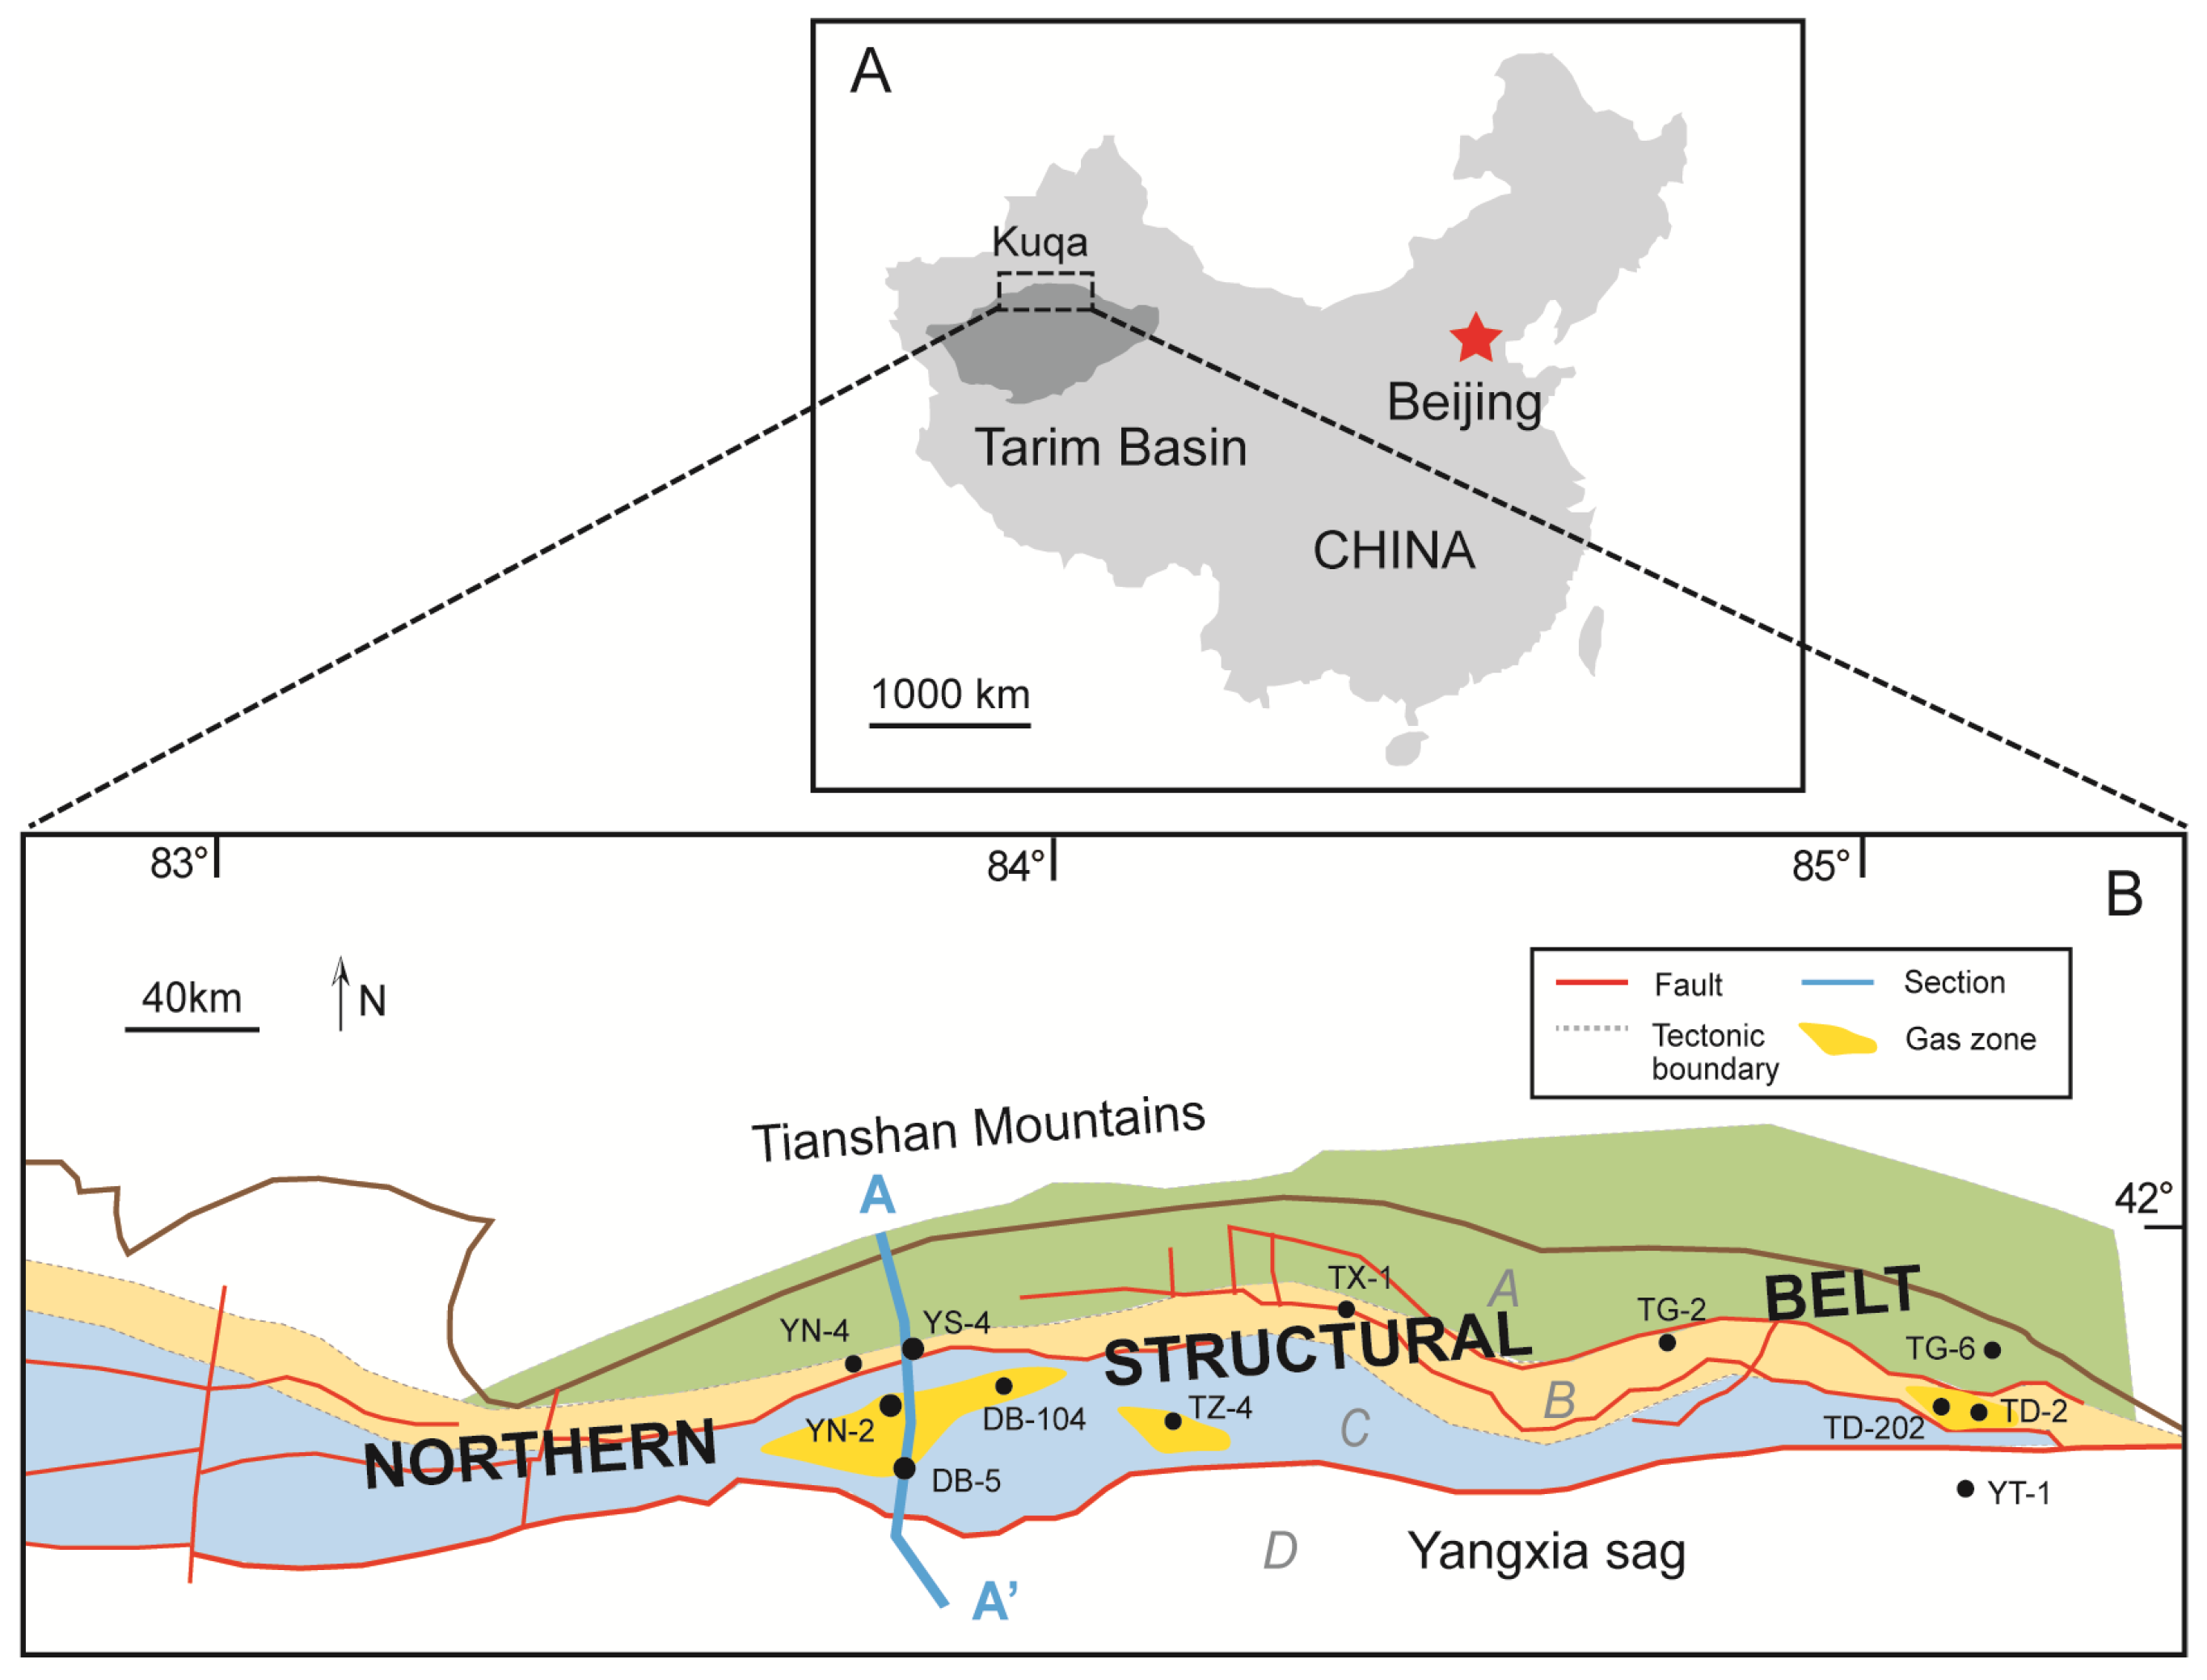
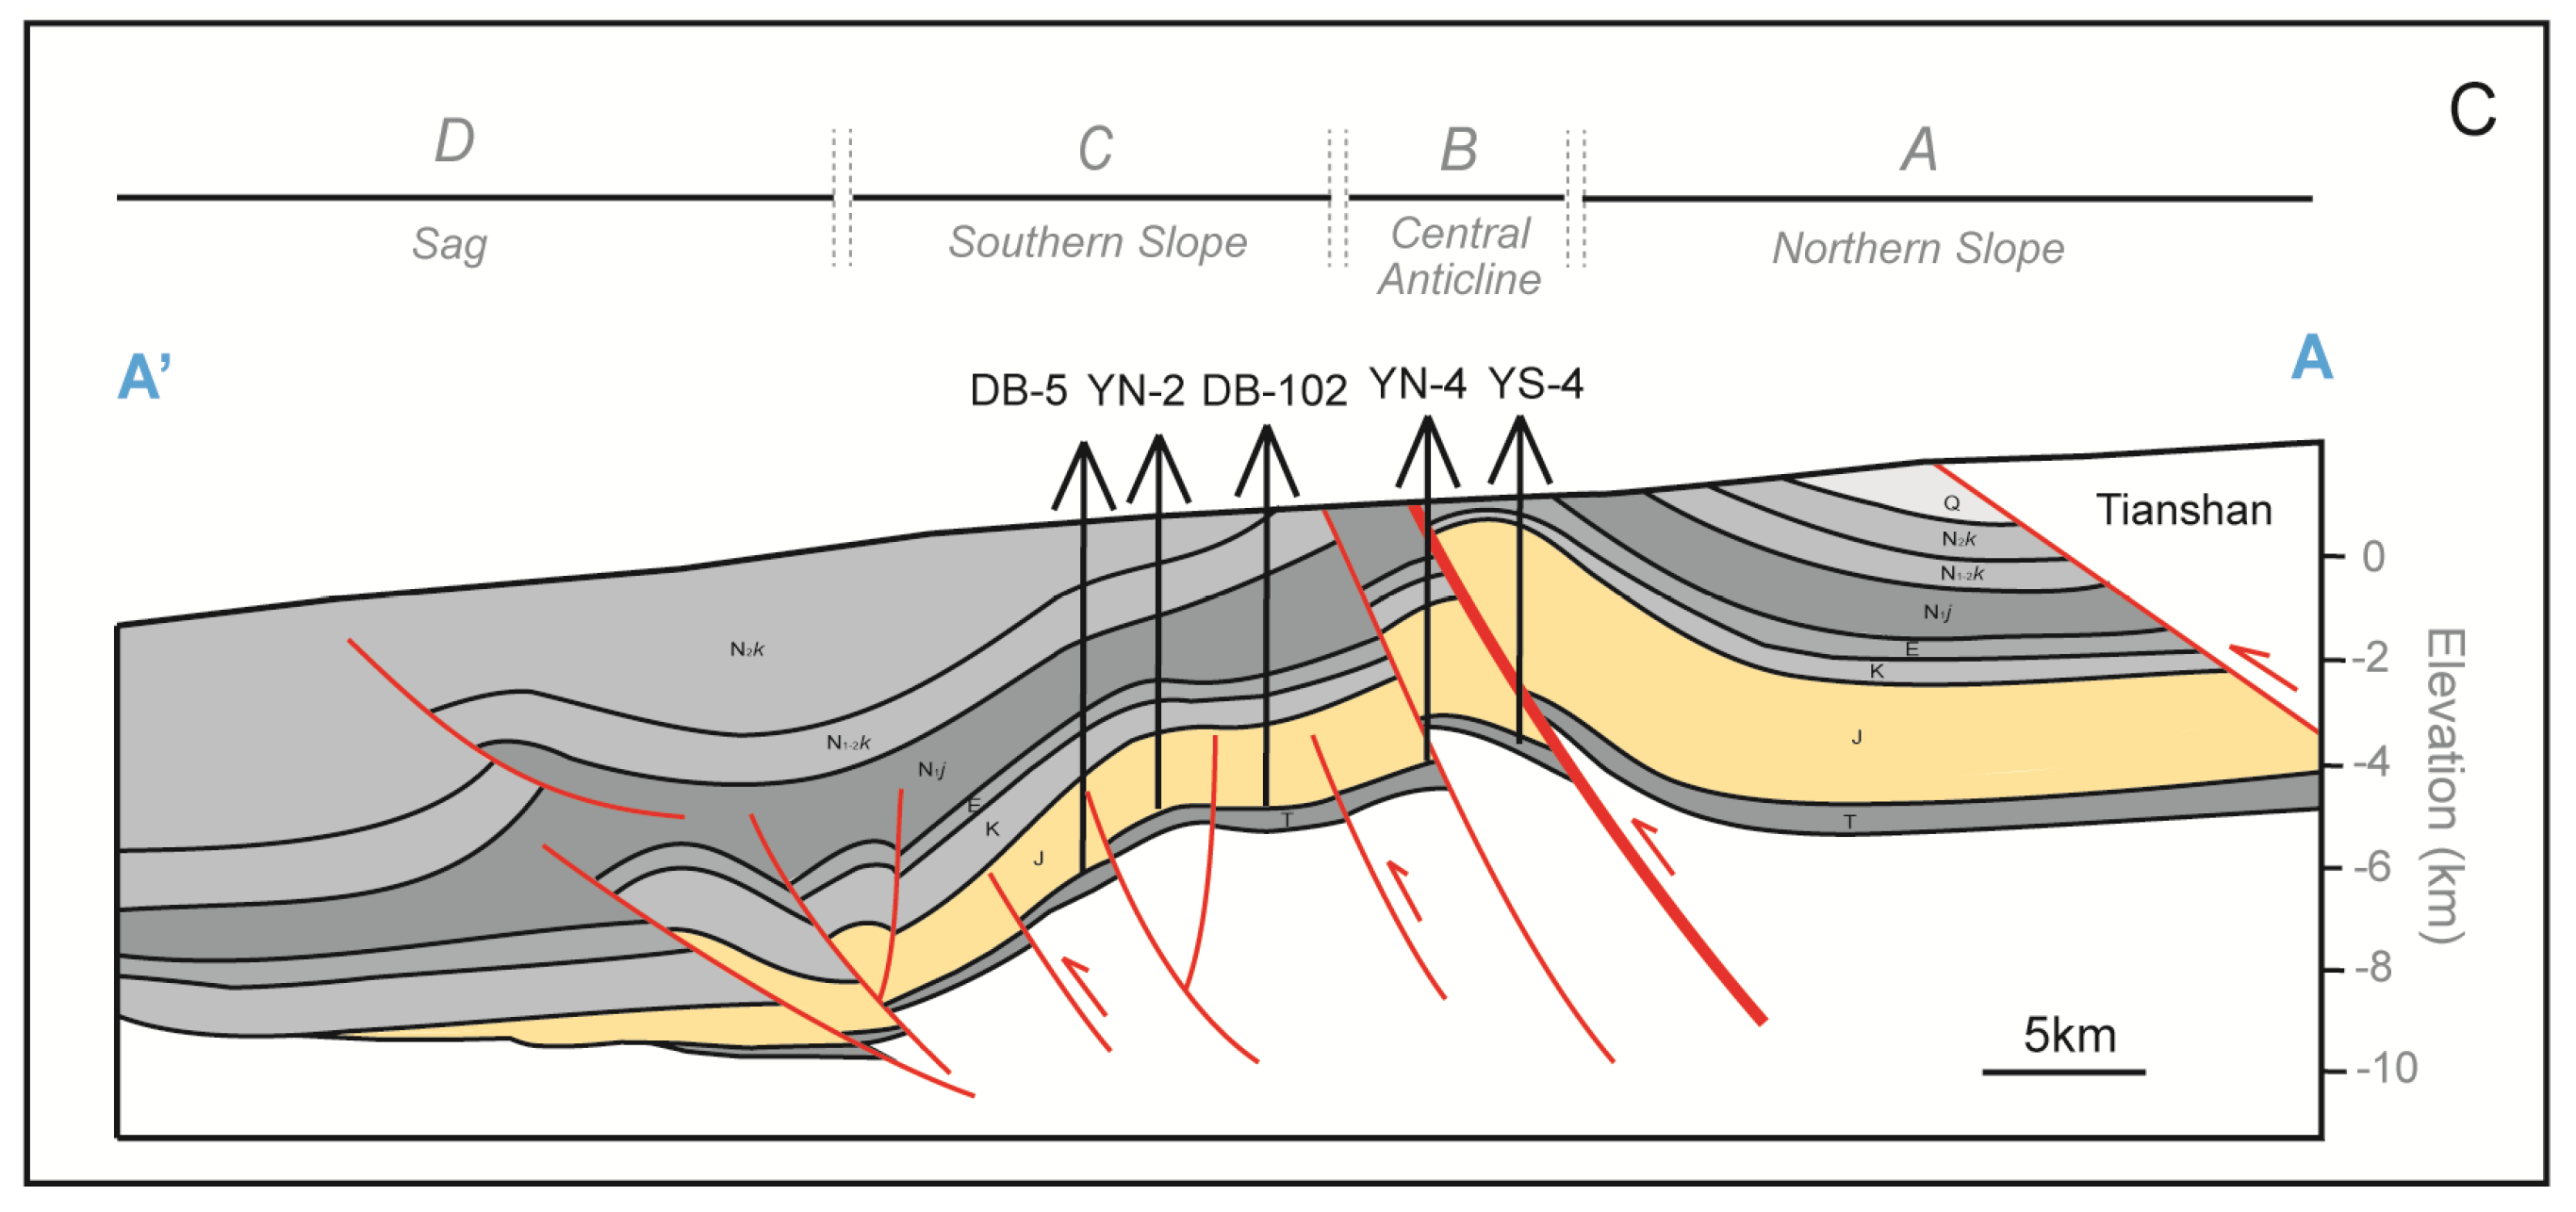
2. Geological Setting
3. Samples and Methods
3.1. Sample Preparation
3.2. Multivariate Statistical Analysis
3.2.1. Hierarchical Clustering Analysis (HCA)
3.2.2. Principal Component Analysis (PCA)
3.3. Basin and Petroleum System Modeling (BPMS)
3.3.1. Structural Restoration
3.3.2. Input Parameters
- Lithology definition;The lithofacies data (Table 3) were derived from three wells supplied by Tarim Oilfield Research Institute. The present average porosities and permeabilities of the J1a reservoirs in the three sub-structural belts, as represented by the YN-2, DB-102, and YS-4 wells, are 5.2% and 1.0 mD, 4.3% and 1.9 mD, and 9.5% and 7.4 mD, respectively. The reservoir porosity evolution curves assigned for individual structural belts (from the Slope Belt to the Anticline Belt) are based on porosity reconstruction considering the diagenetic history and stress–strain regimes among various geological periods;
- Source rock geochemistry;To depict the development of various types of source rocks, the J2kz, J1y, T3t, and T3h source rocks were divided into coal, carbonaceous mudstone, and dark mudstone in five geological sections, as reported by Wei et al. (2021) [55]. Previous studies commonly used fixed kinetics in PetroMod software based on kerogen types [78,79] but these cannot reflect the real hydrocarbon generation process in the study area. This is because of significant variations in the generative kinetics of source rocks with different organofacies (e.g., varying origins of organic matter, depositional environments, heterogeneity of sediments, geological background, etc.) [80,81]. Consequently, customized kinetics of generation for each individual source rock kerogen of different lithologies are necessary to ensure an accurate hydrocarbon generation process in the study area [81,82,83]. Kinetic models obtained from sealed gold tube pyrolysis experiments by Liu et al. (2023) [84] in the northern Kuqa Foreland Basin were employed in the modeling. Since the TOC and HI values of source rocks will decrease in the process of thermal evolution [85,86], we used the method proposed by Lu et al. (2003) [87] to calculate the original TOC and HI in the early stage of hydrocarbon generation. The restored TOC and HI values are shown in Table 3;
- Boundary conditions;Sediment–water–interface temperatures (SWIT) were determined using the global mean surface temperature based on Wygrala (1989) [88] contained in the PetroMod software. The location of the study area was set in Central Asia (latitude 41°) to automatically generate the SWIT map for the northern Kuqa Foreland Basin through time. The paleowater depth (PWD) was based on the estimation of sequence stratigraphic architecture and sedimentary facies characteristics in Kuqa Foreland Basin, defining the depth ranges for shore and shallow lacustrine (5–10 m), shallow to half deep lacustrine (10–20 m), and half deep to deep lacustrine (20–40 m) [89]. The PWDs in geological periods were calibrated from the previous studies by Guo et al. (2013) [89] and Liu et al. (2016) [63] and shown in Table 3. Heat flow data for each grid in different geological sections came from the previous studies [90,91], showing that the present heat flow in the northern Kuqa Foreland Basin is (42.5 ± 7.6) mW/m2 [91,92] and decreases from north to the south [87]. The modeling was calibrated by changing the present heat flow values until a reasonable result was achieved.
4. Results
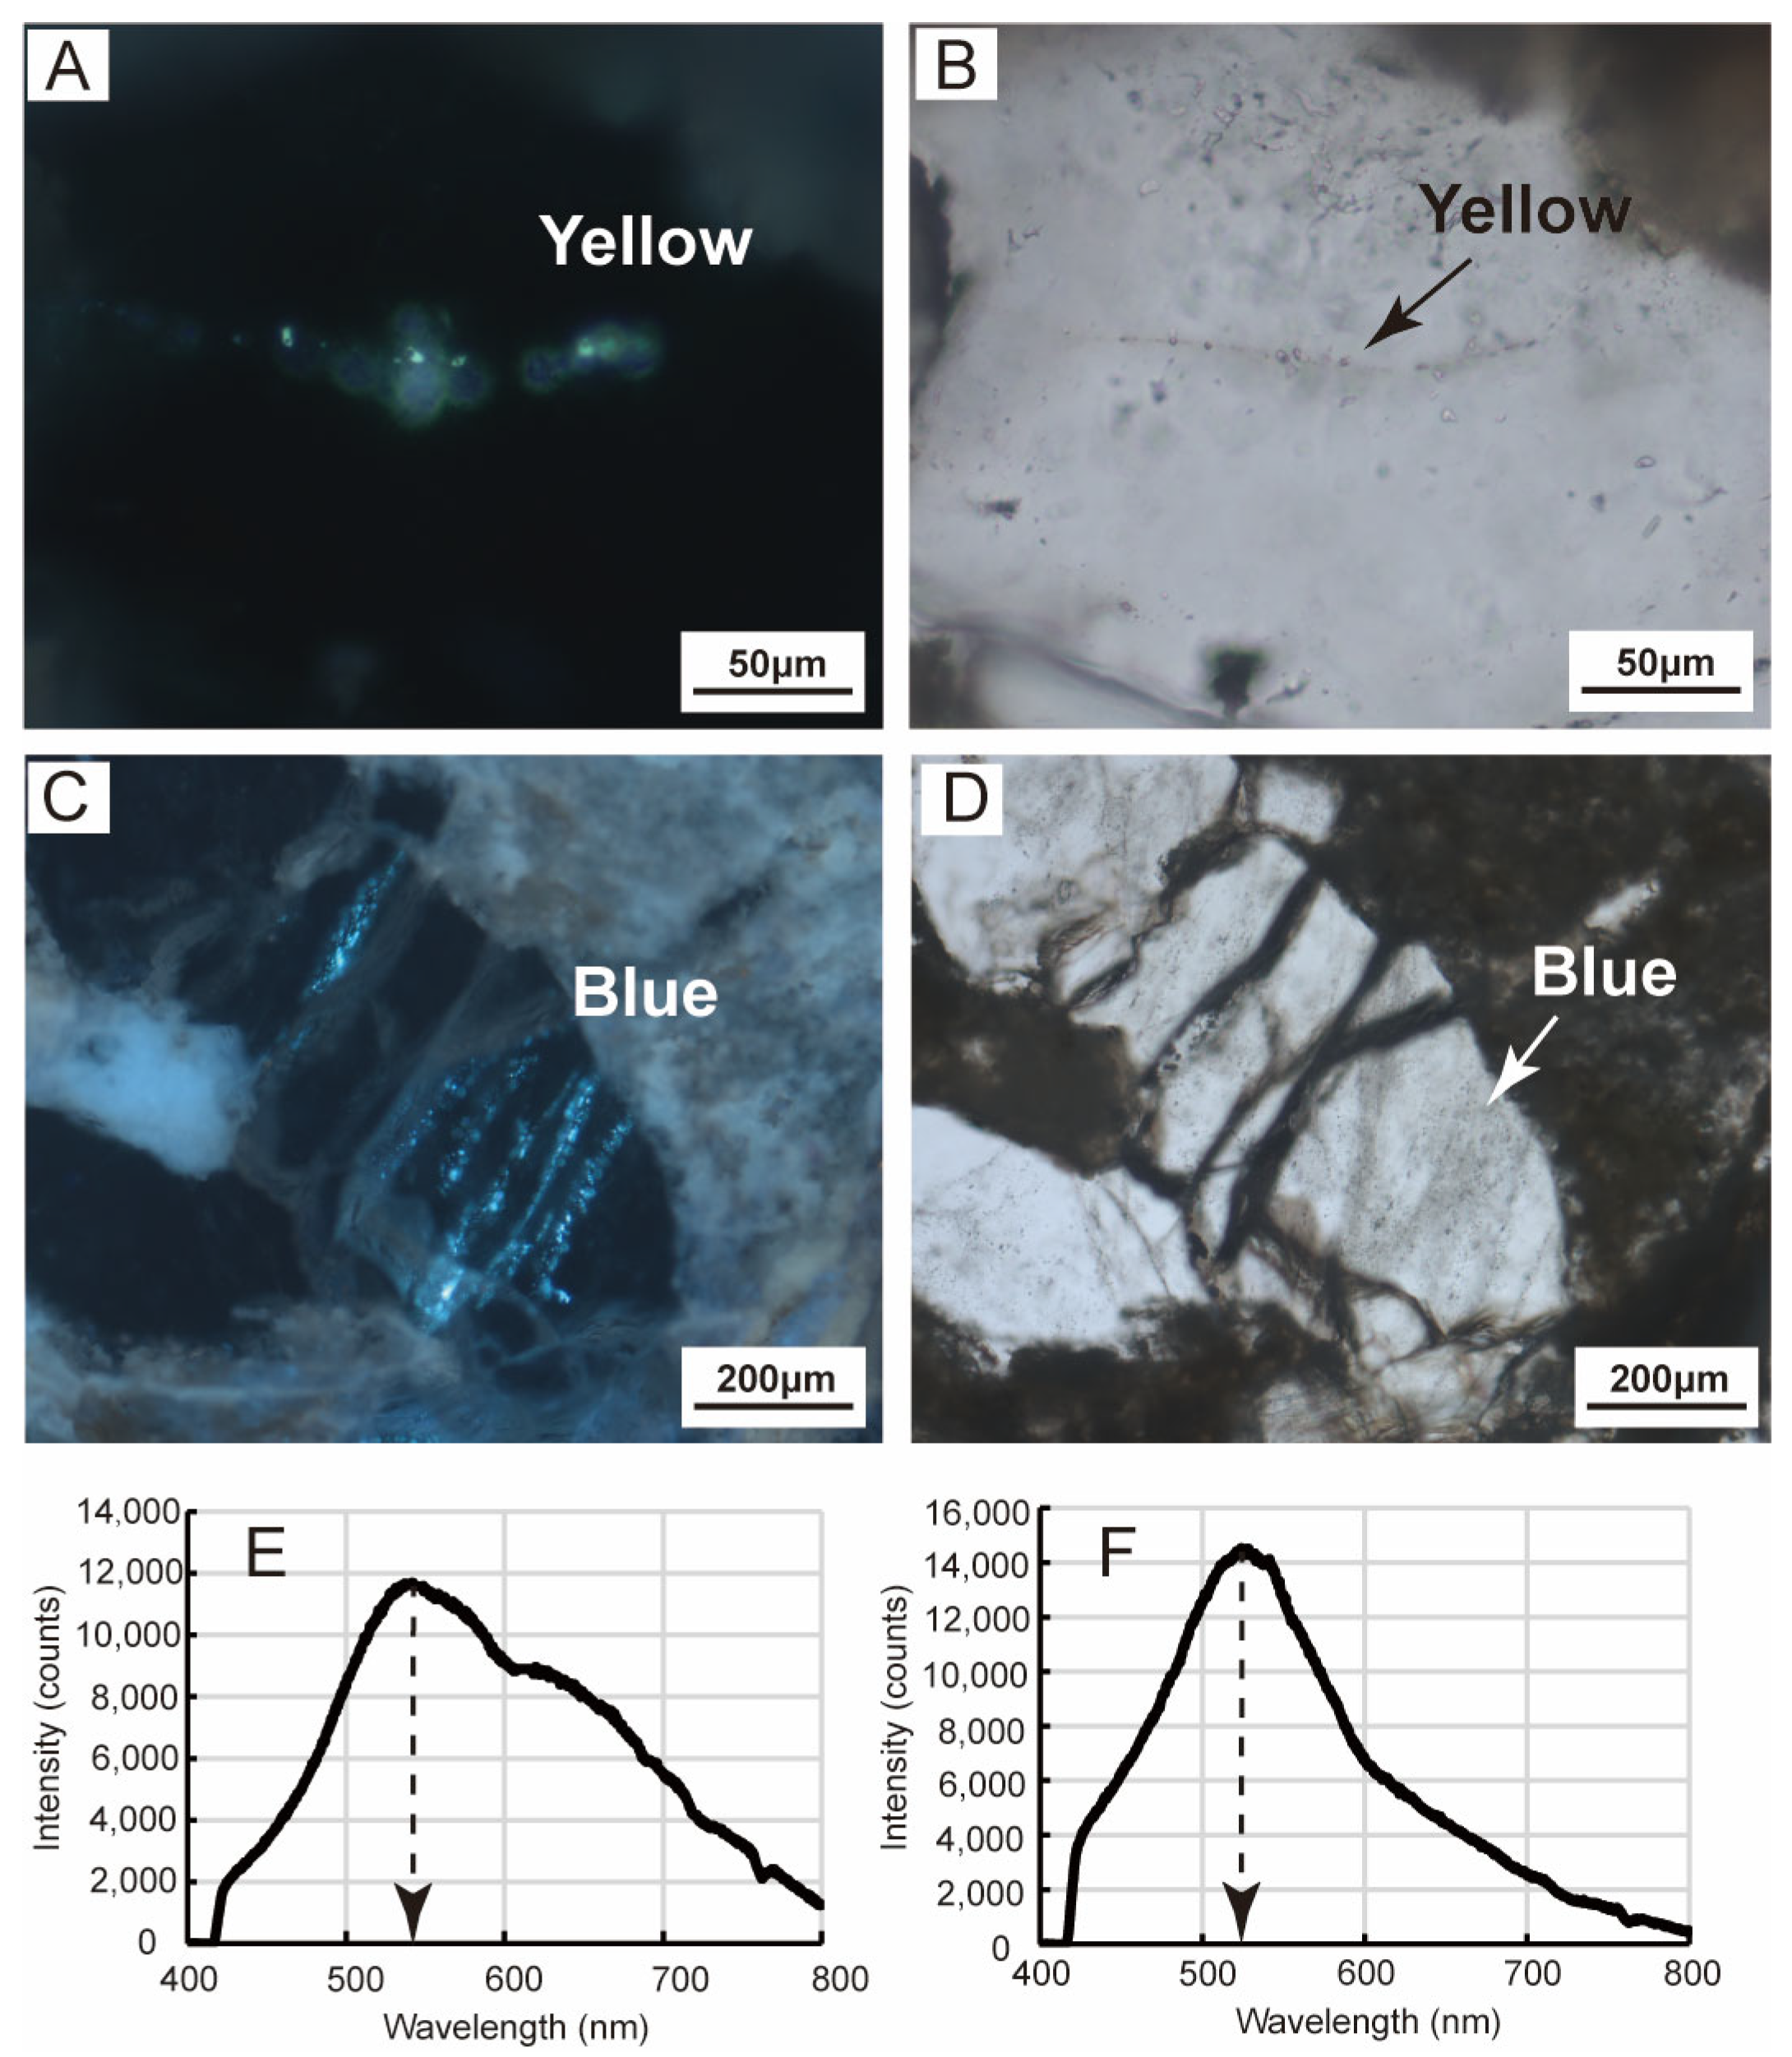
4.1. Petrography
4.2. Molecular Compositions
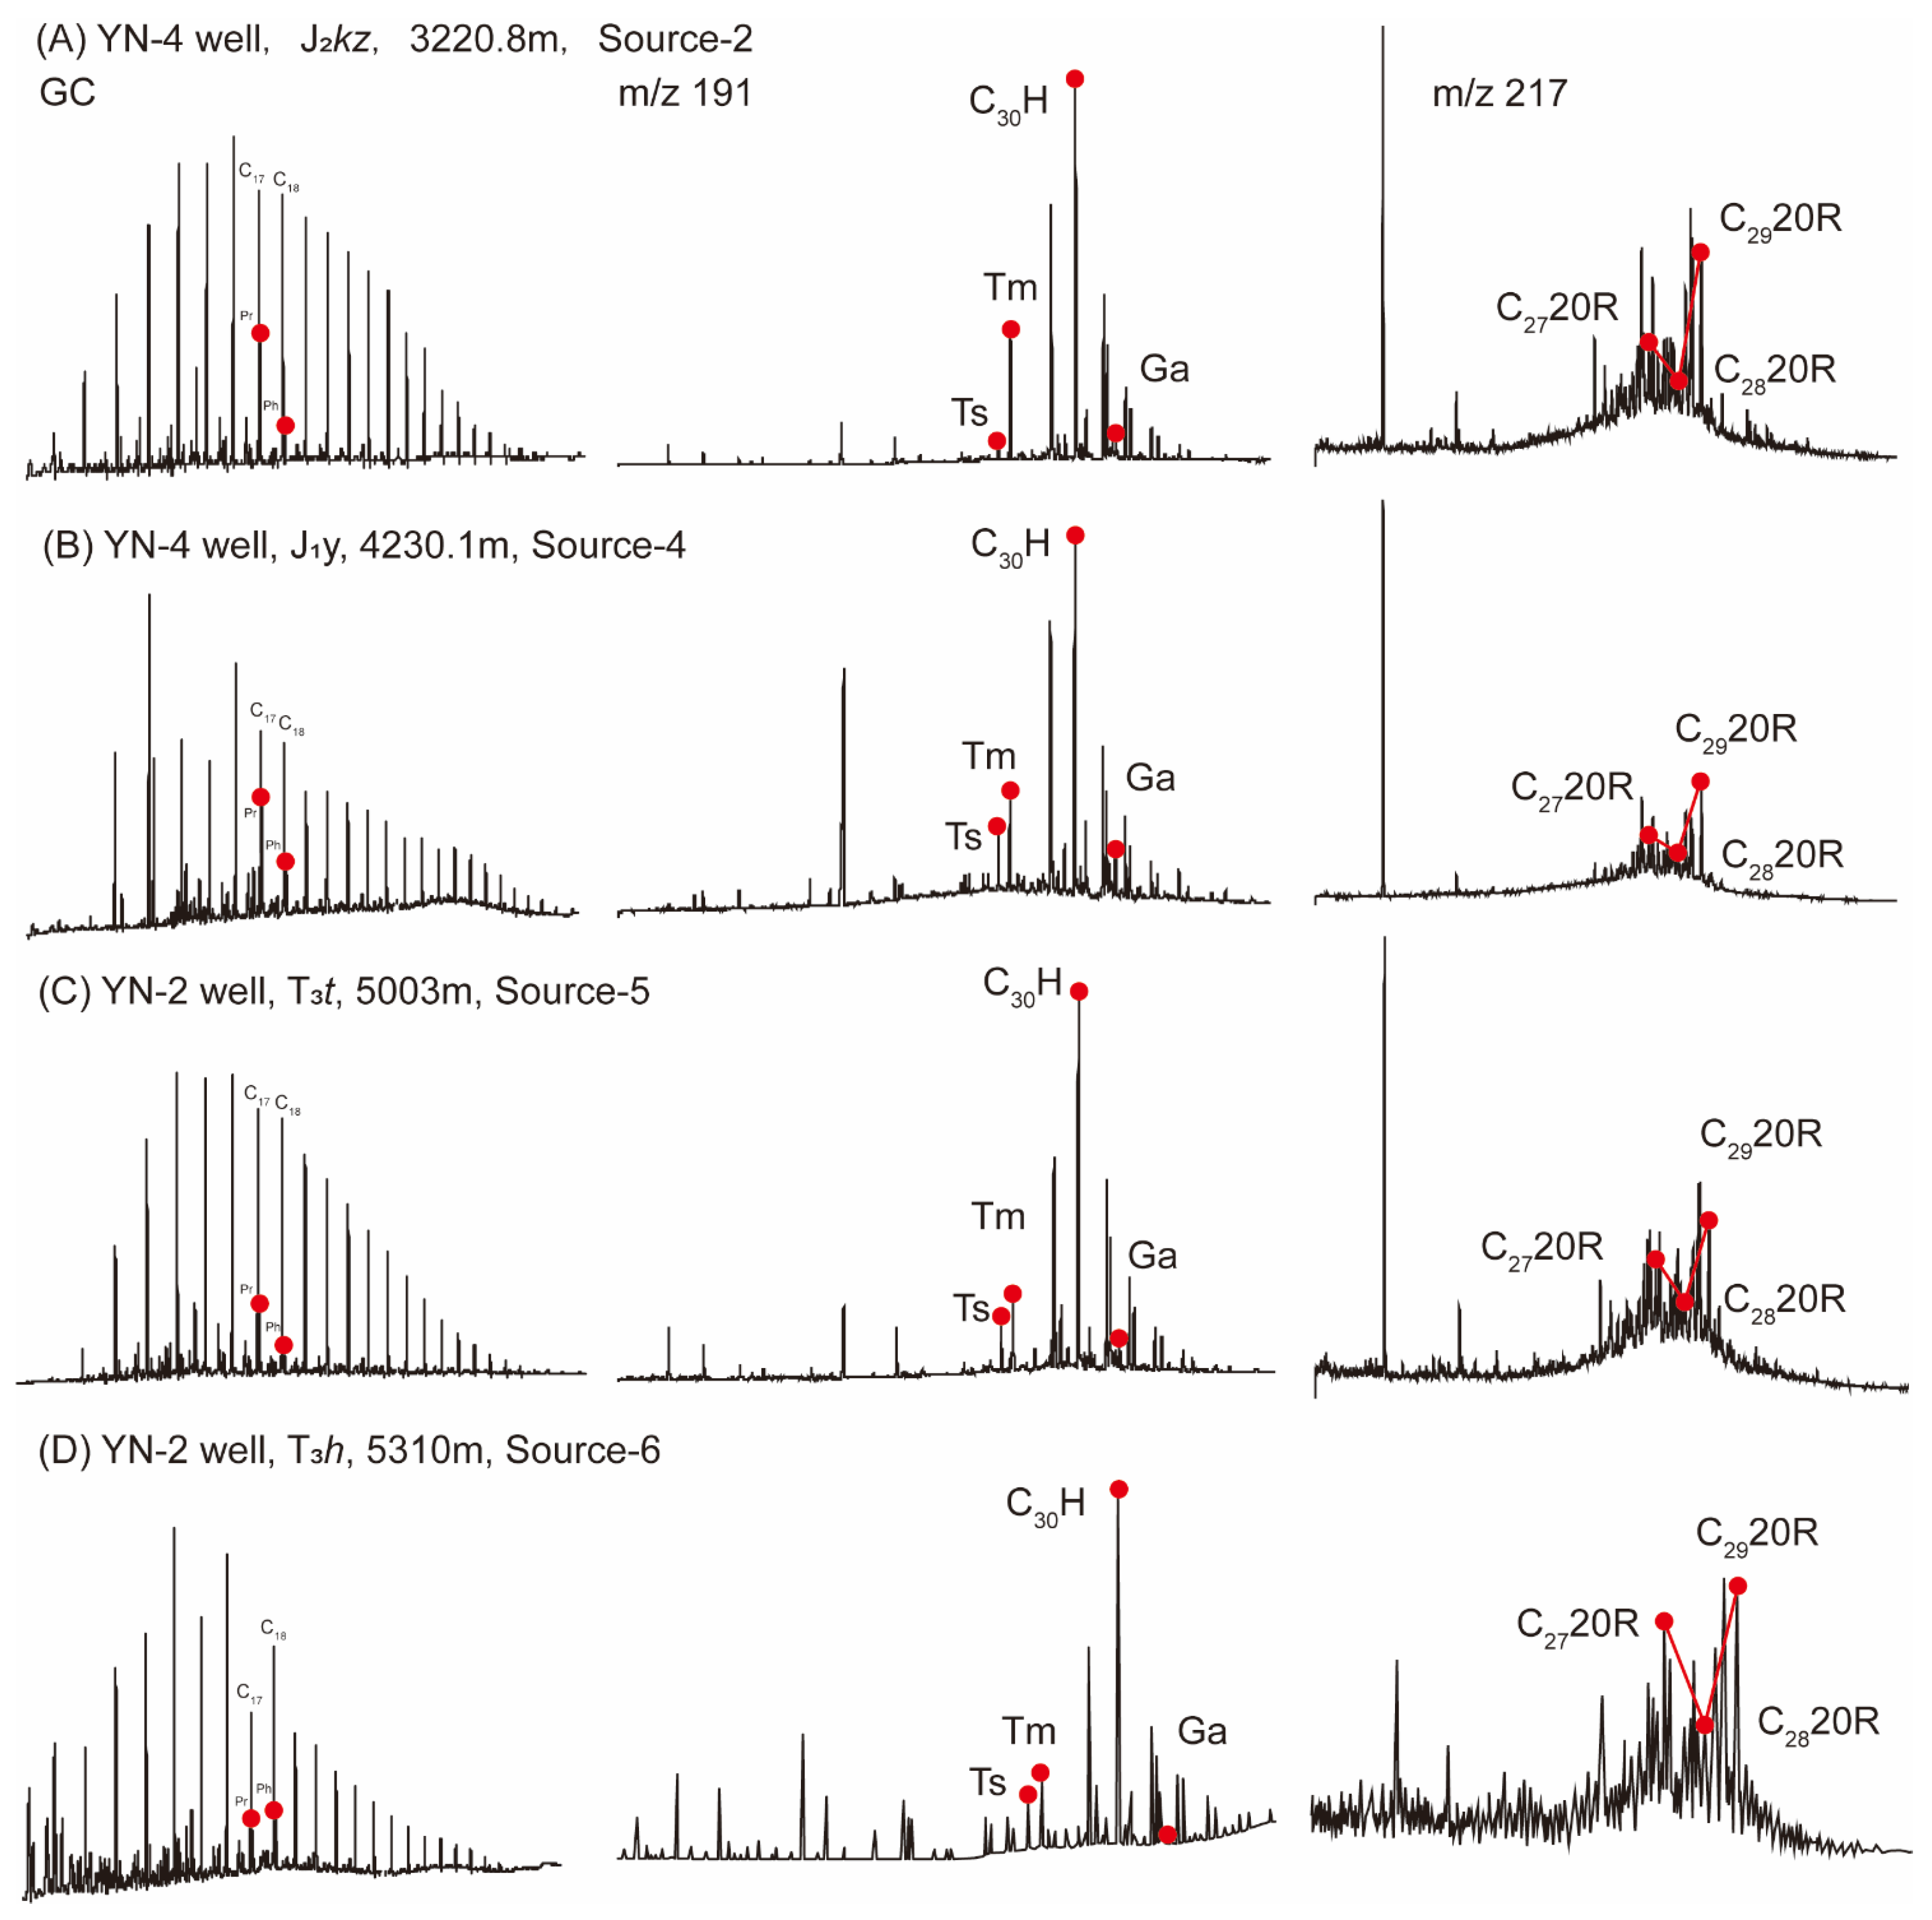
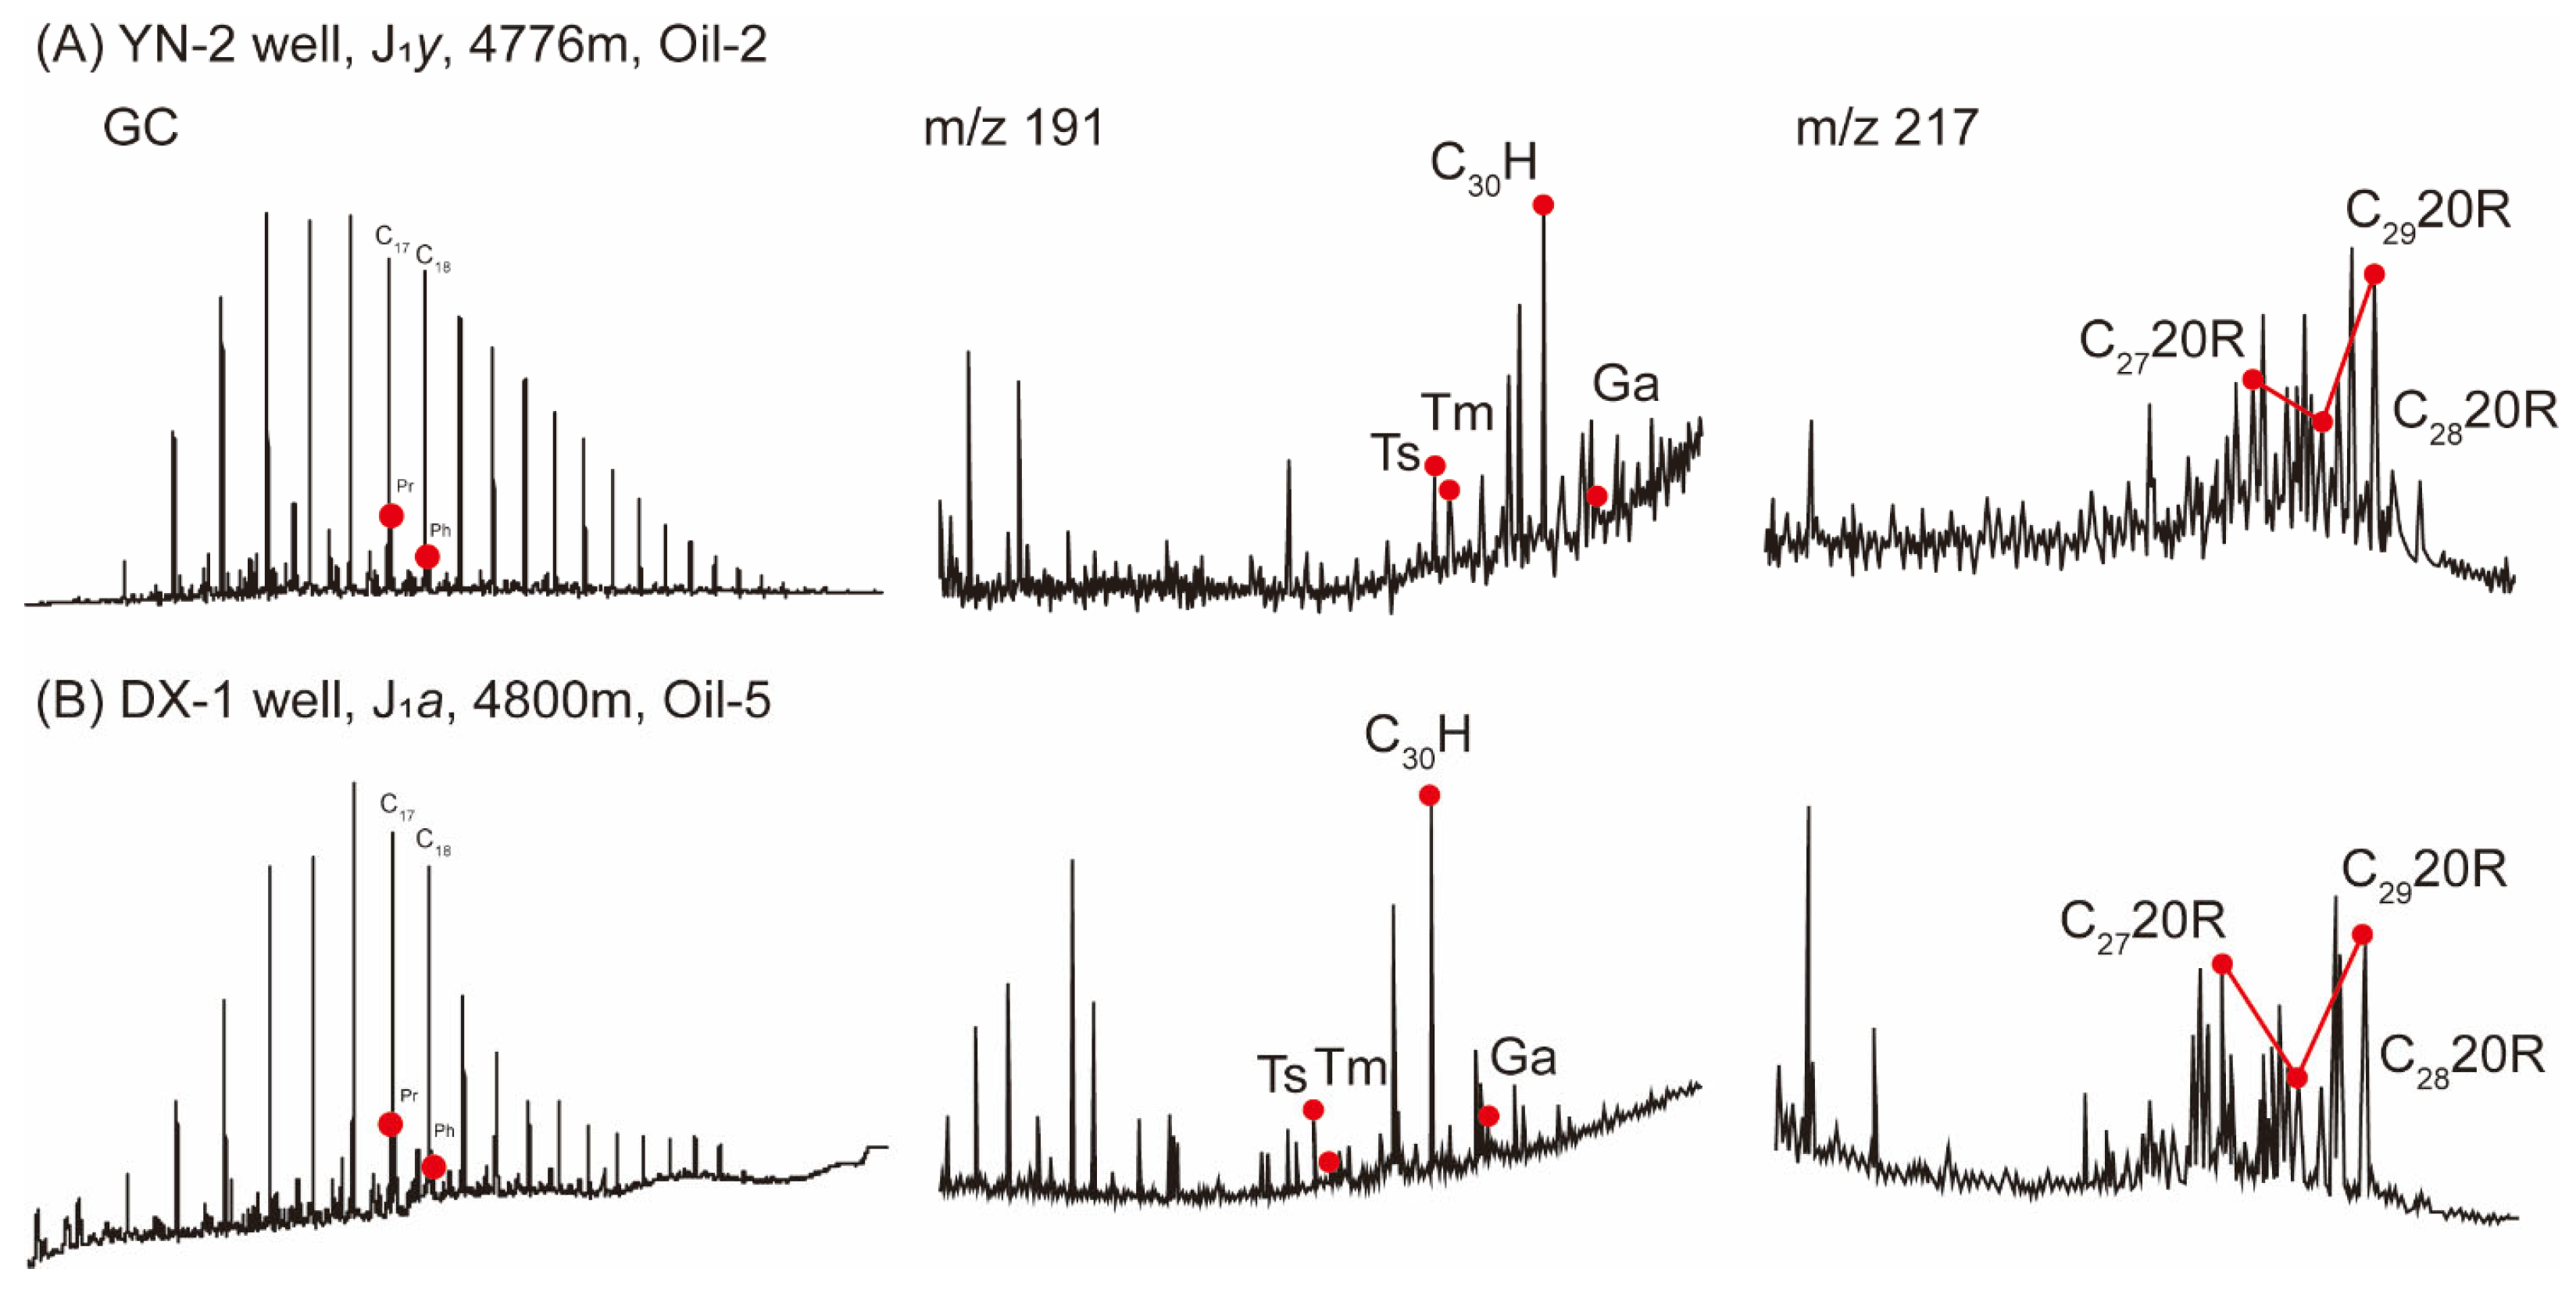
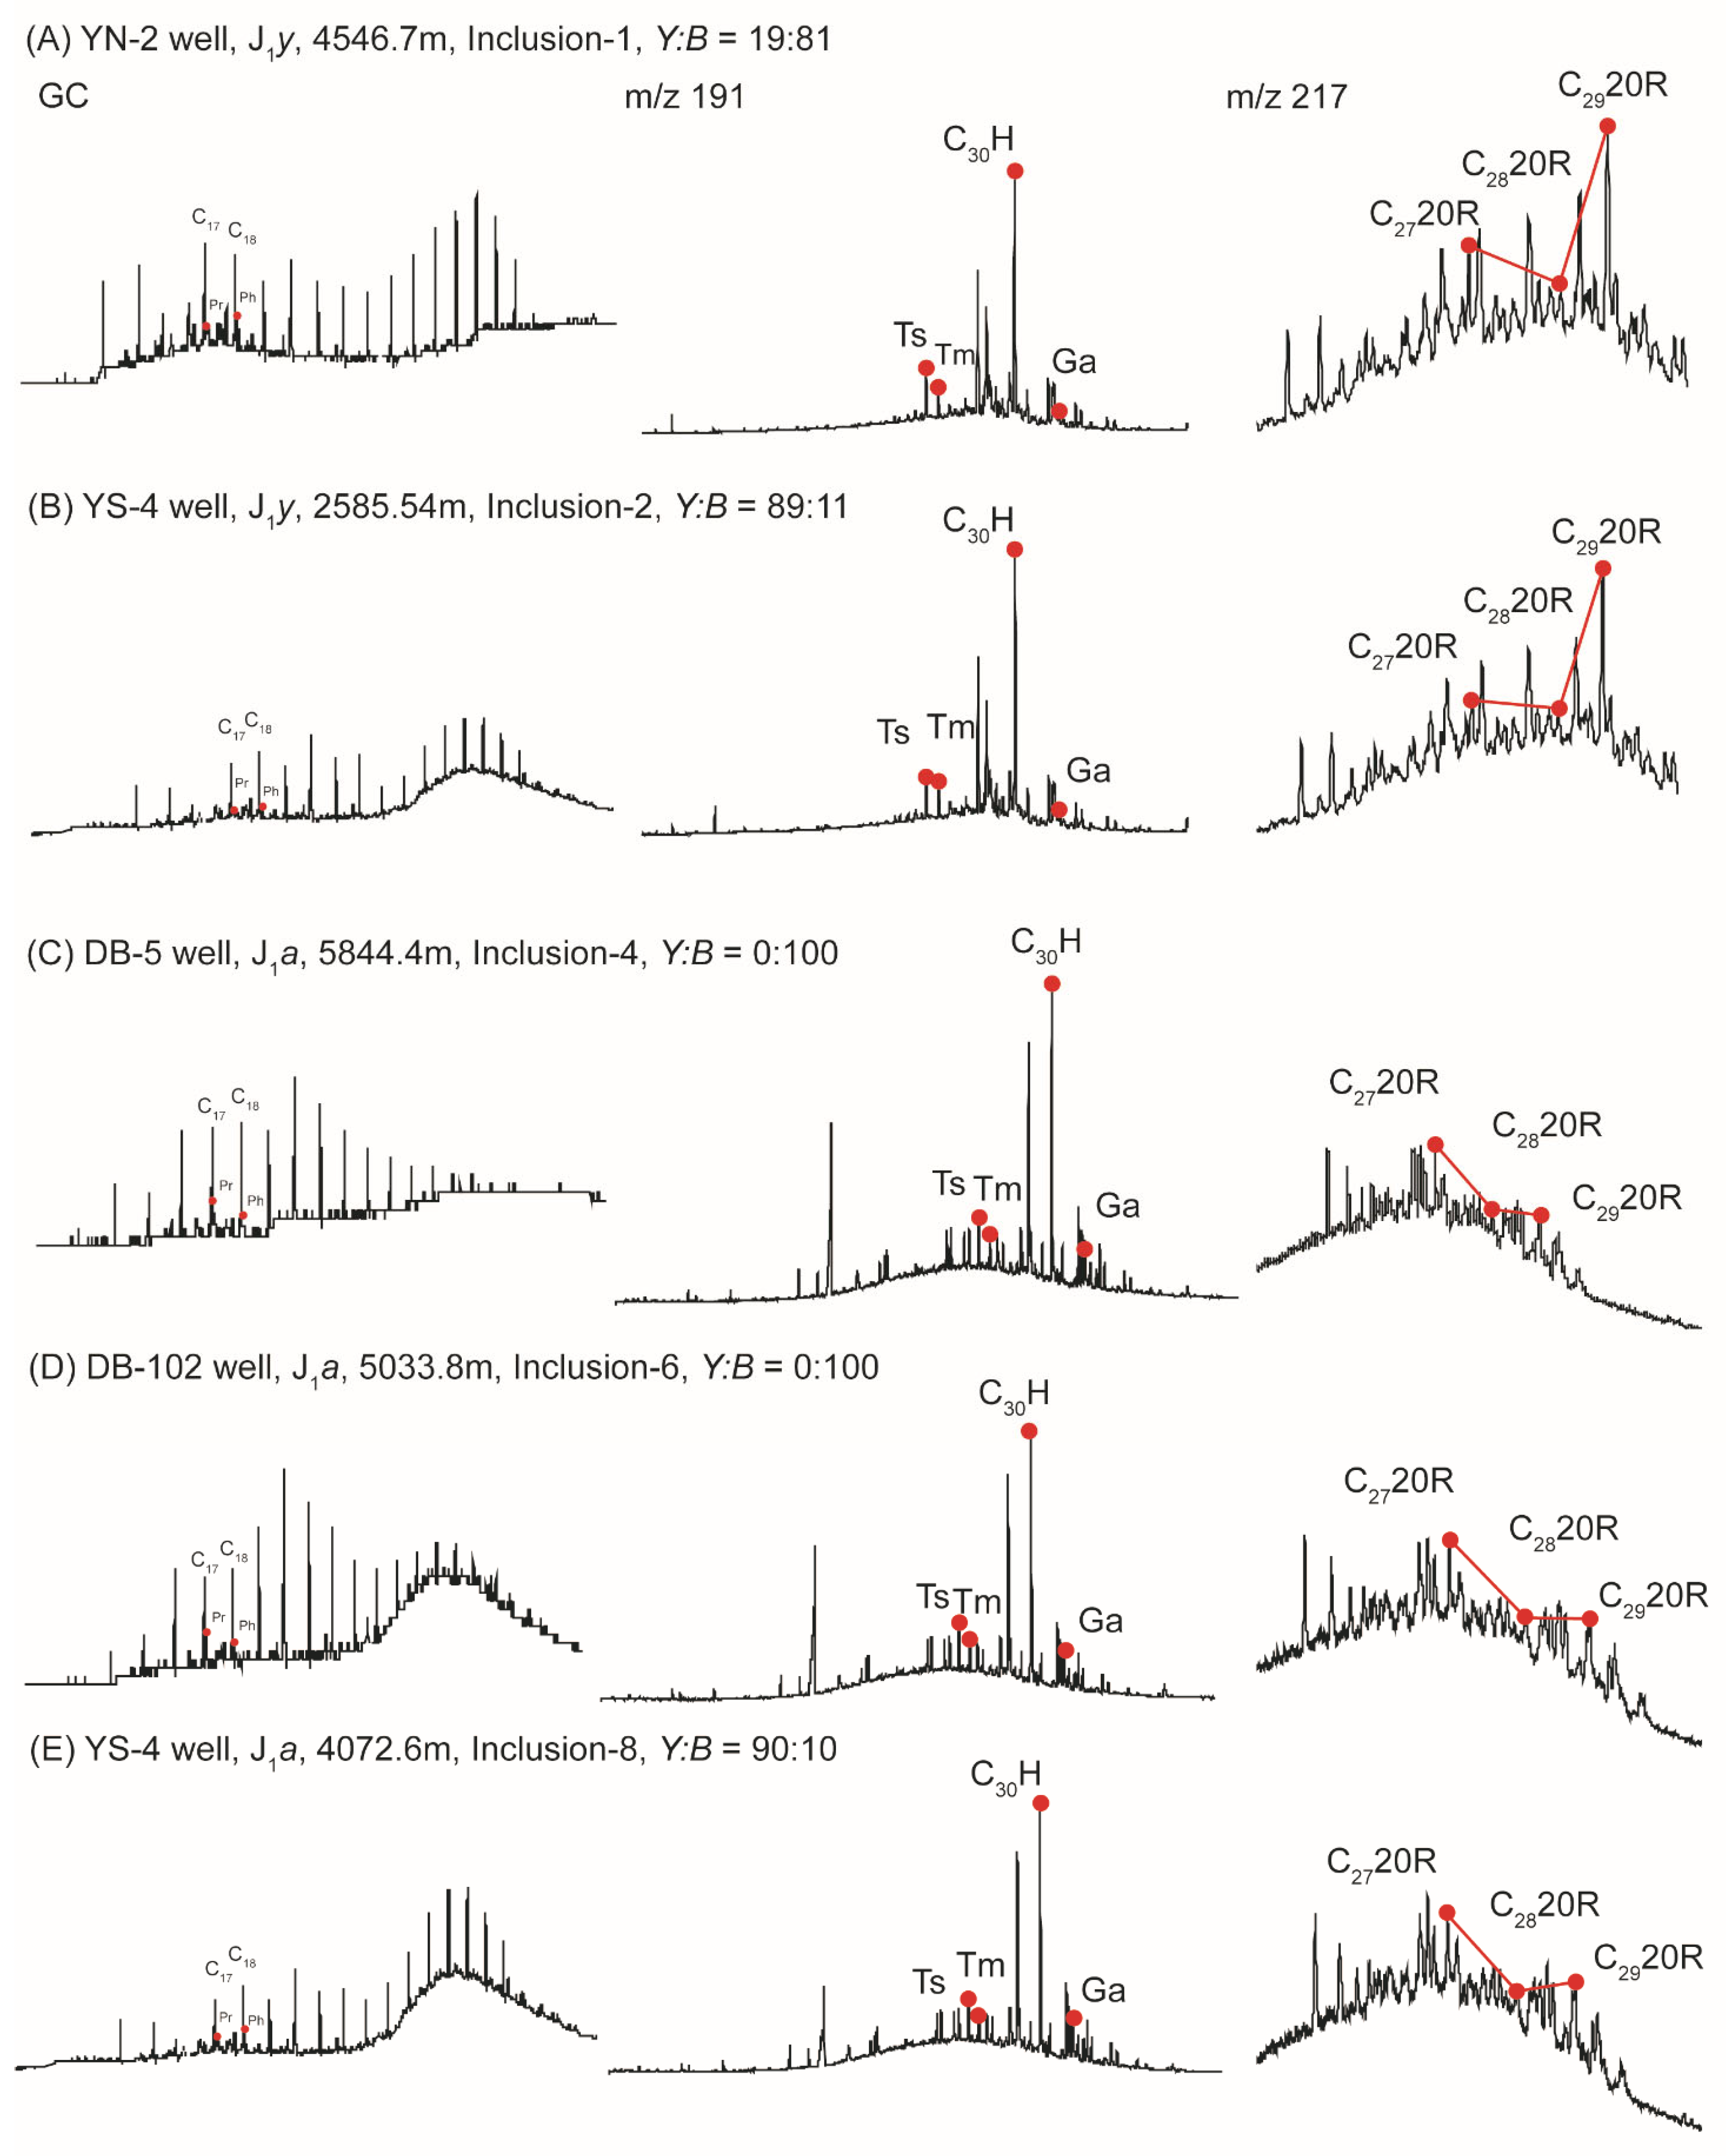
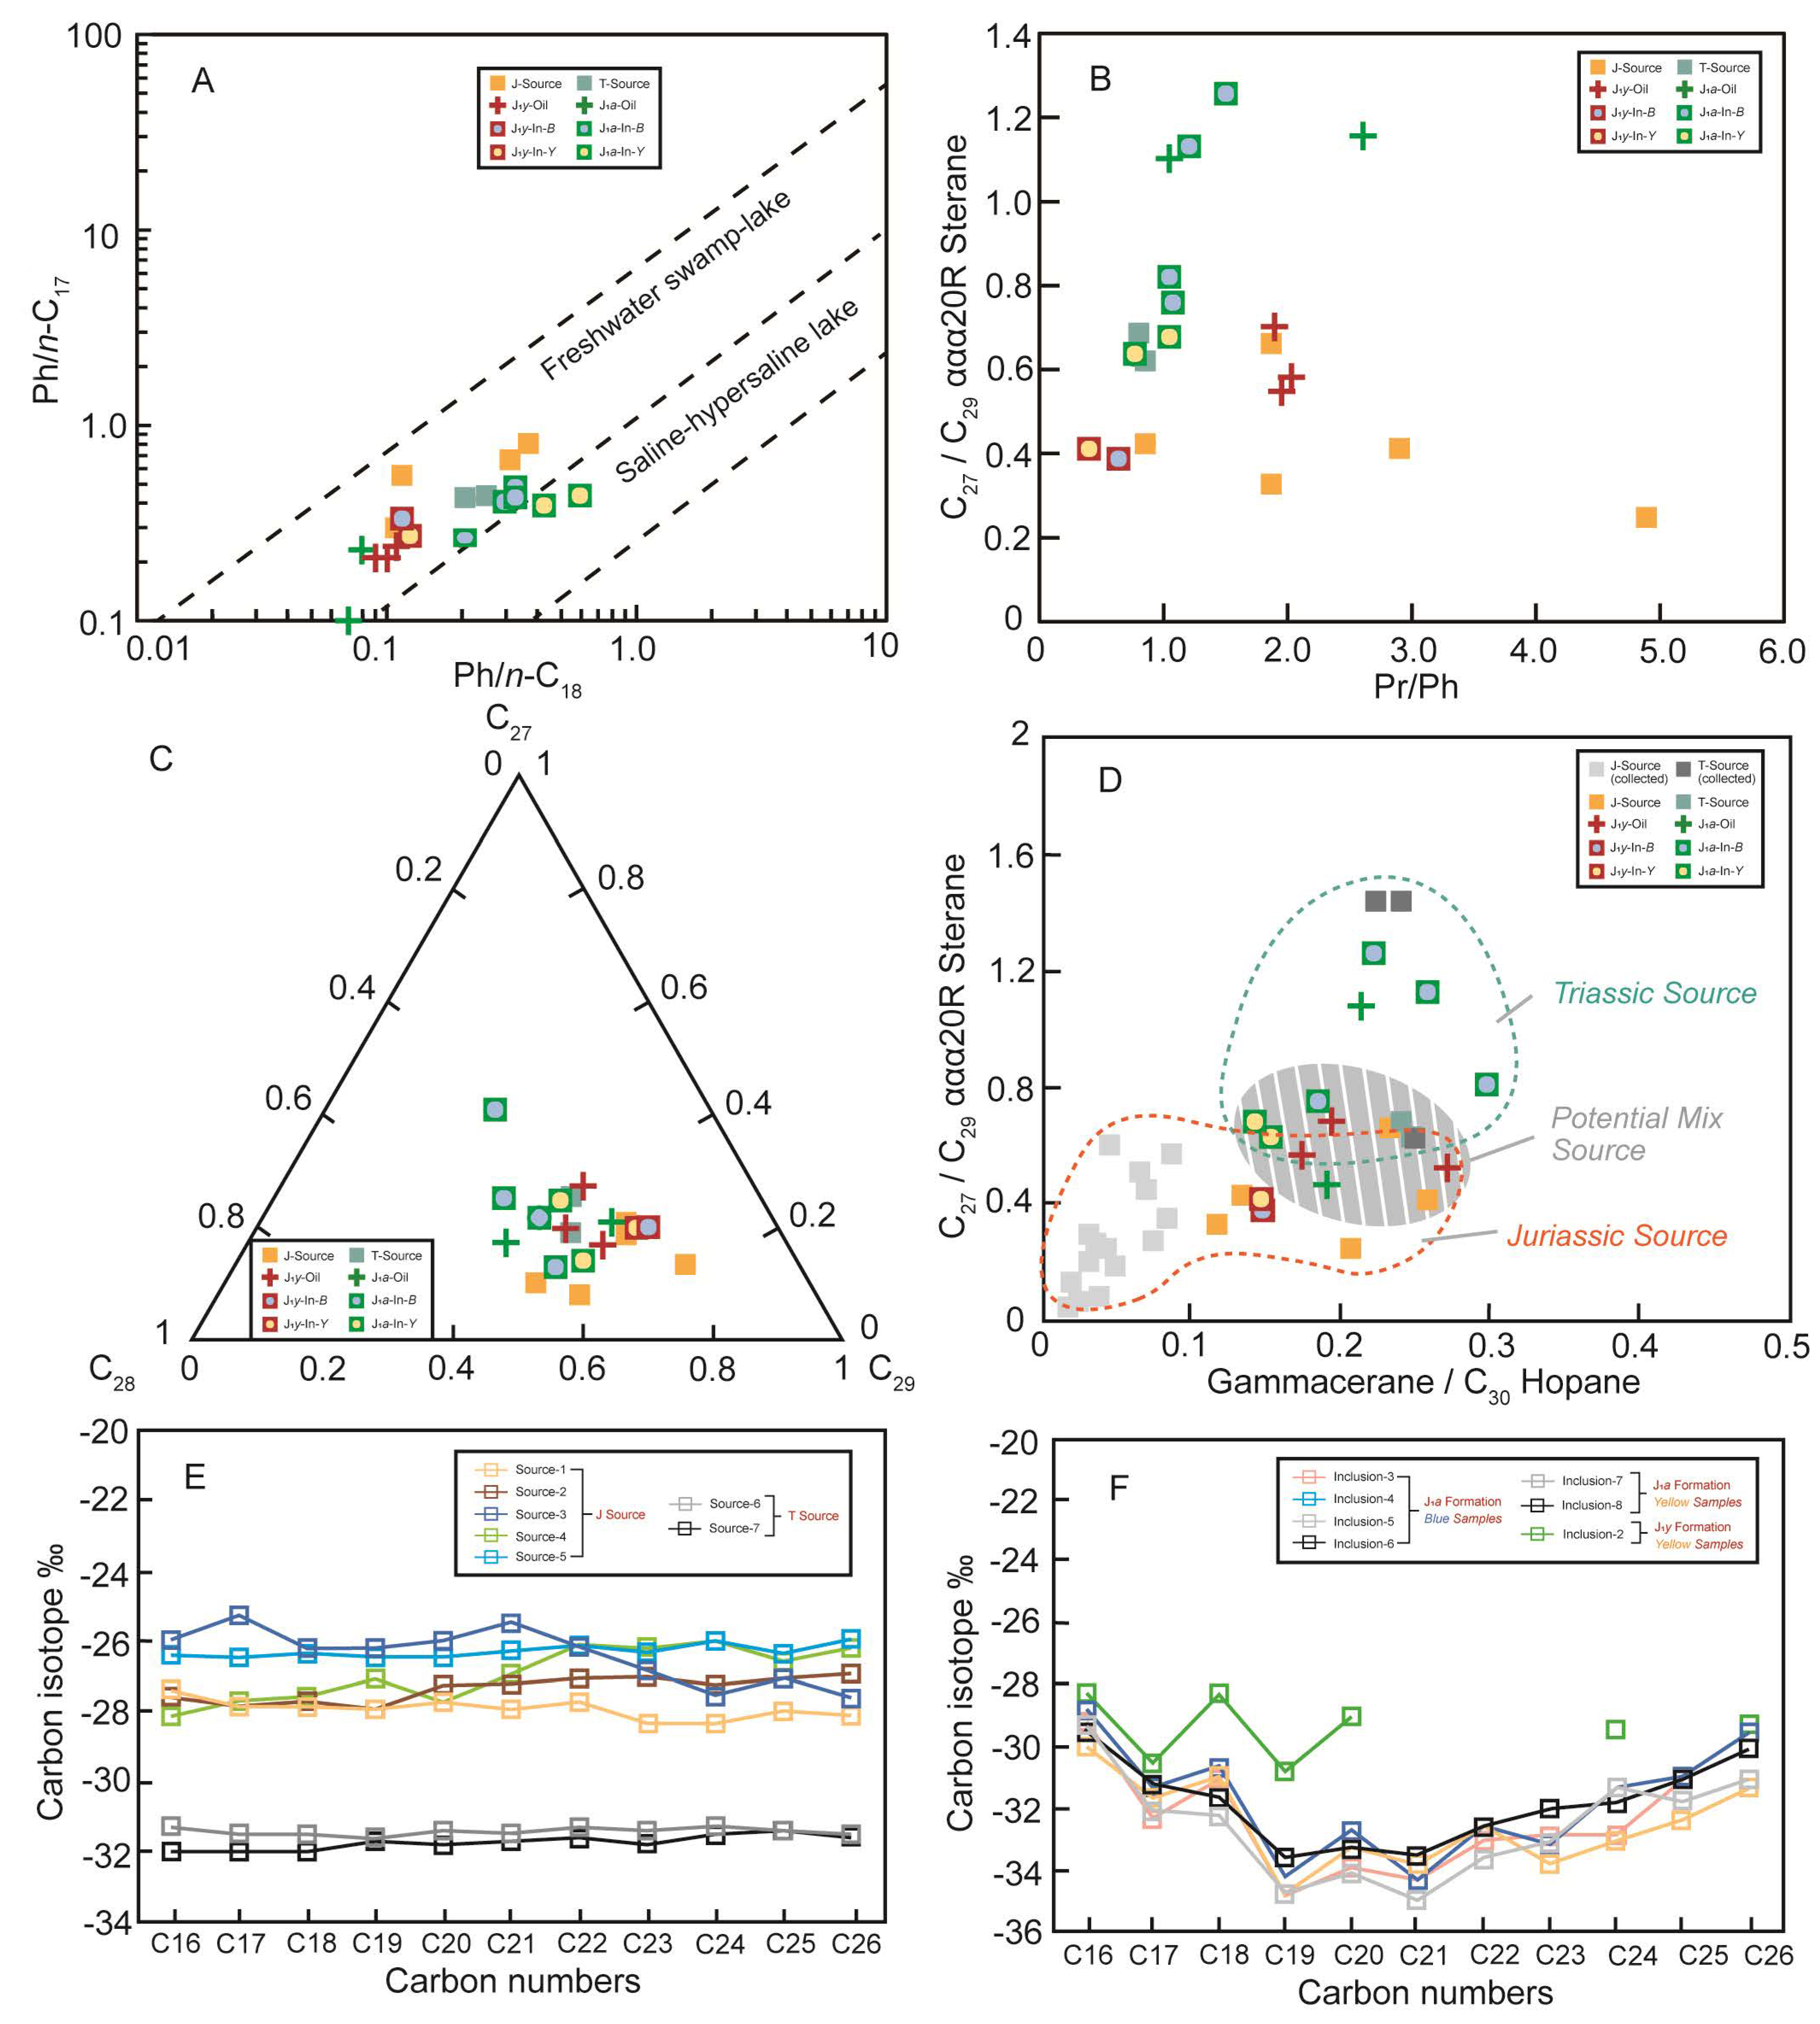
4.2.1. n-Alkanes and Isoprenoids
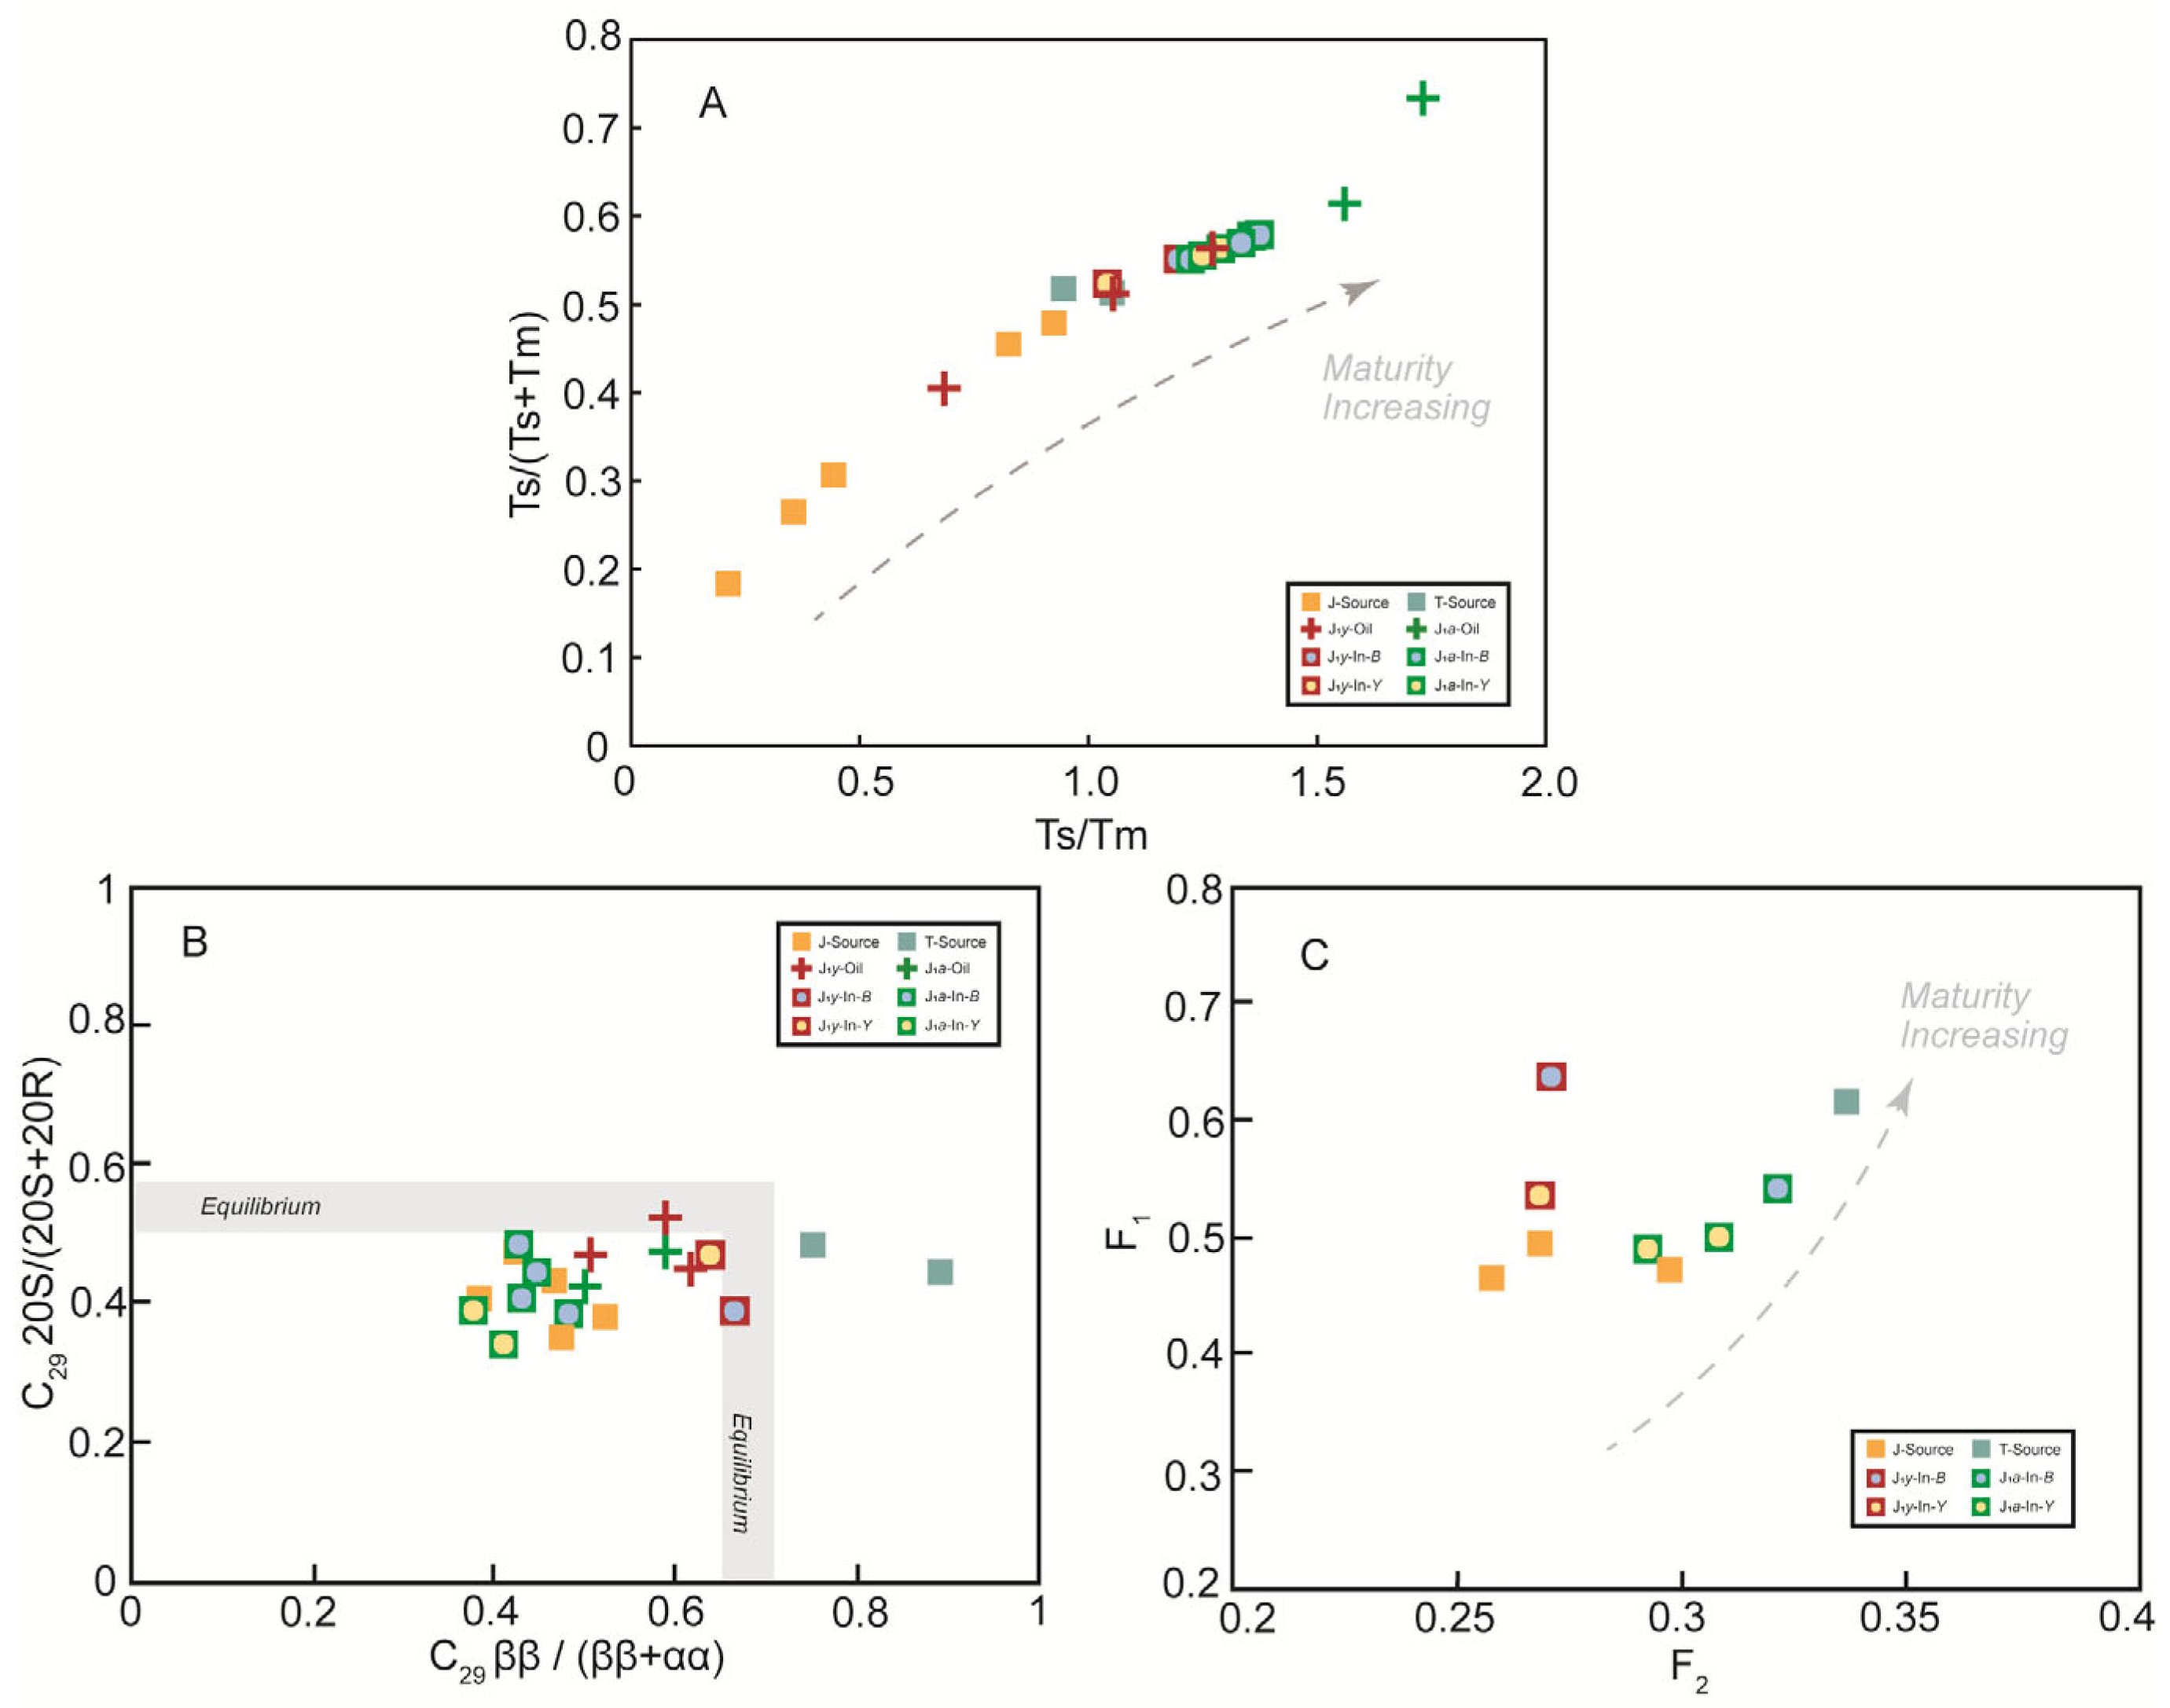
4.2.2. Steranes and Terpanes
4.2.3. Aromatic Compounds
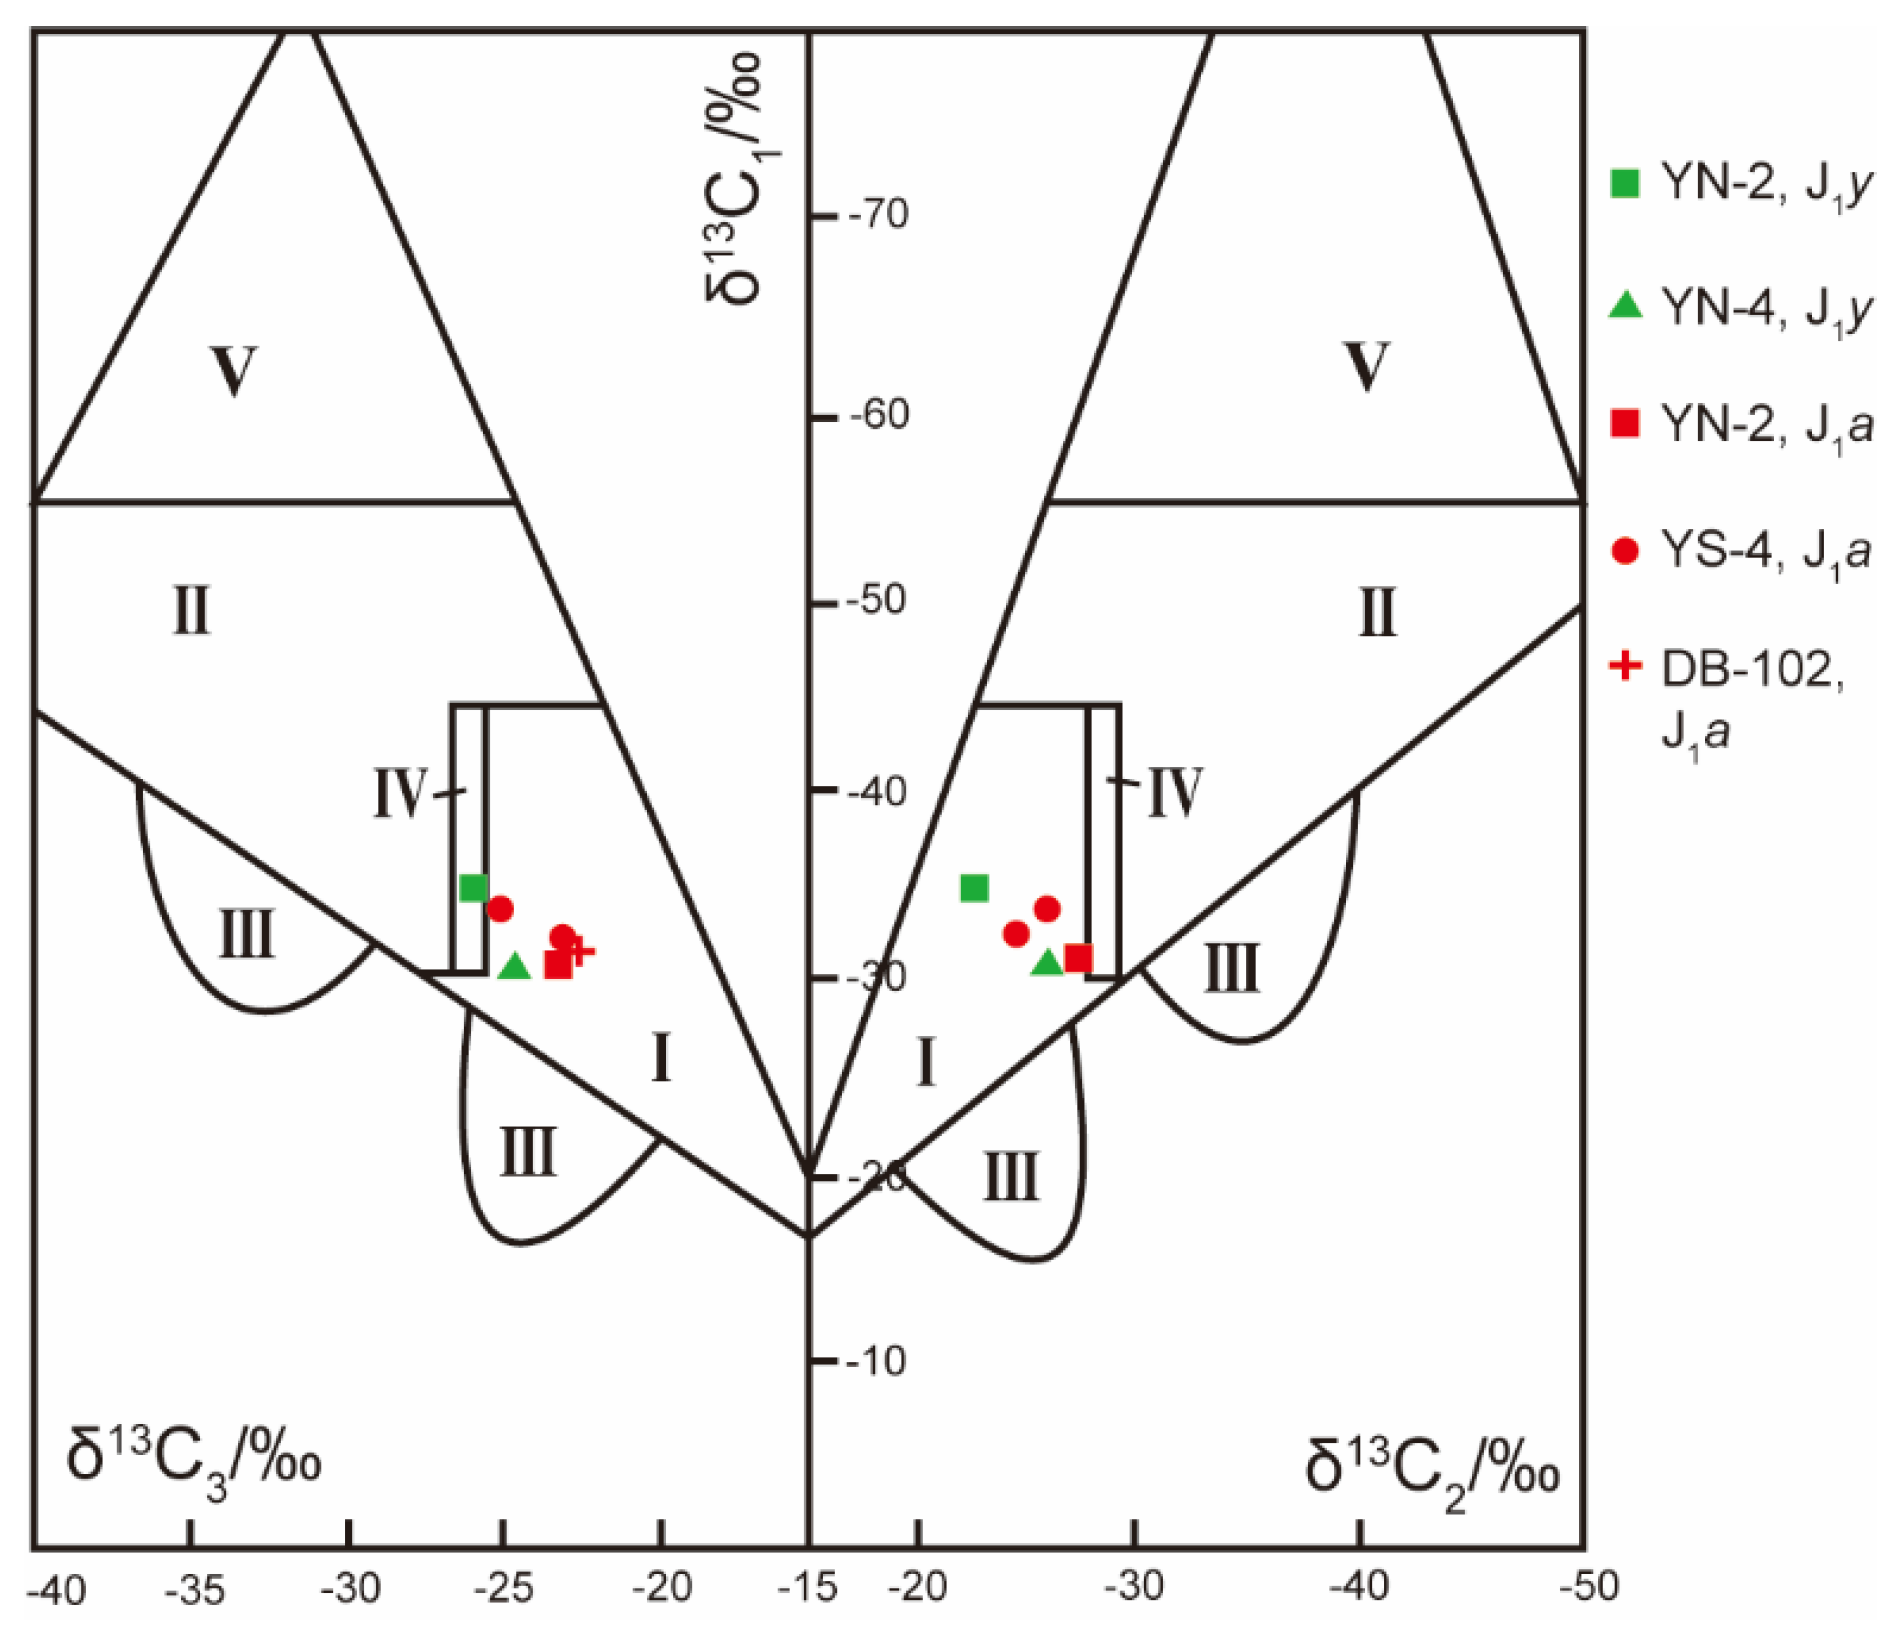
4.2.4. Carbon Isotopic Characteristics
4.3. Multivariate Statistical Results
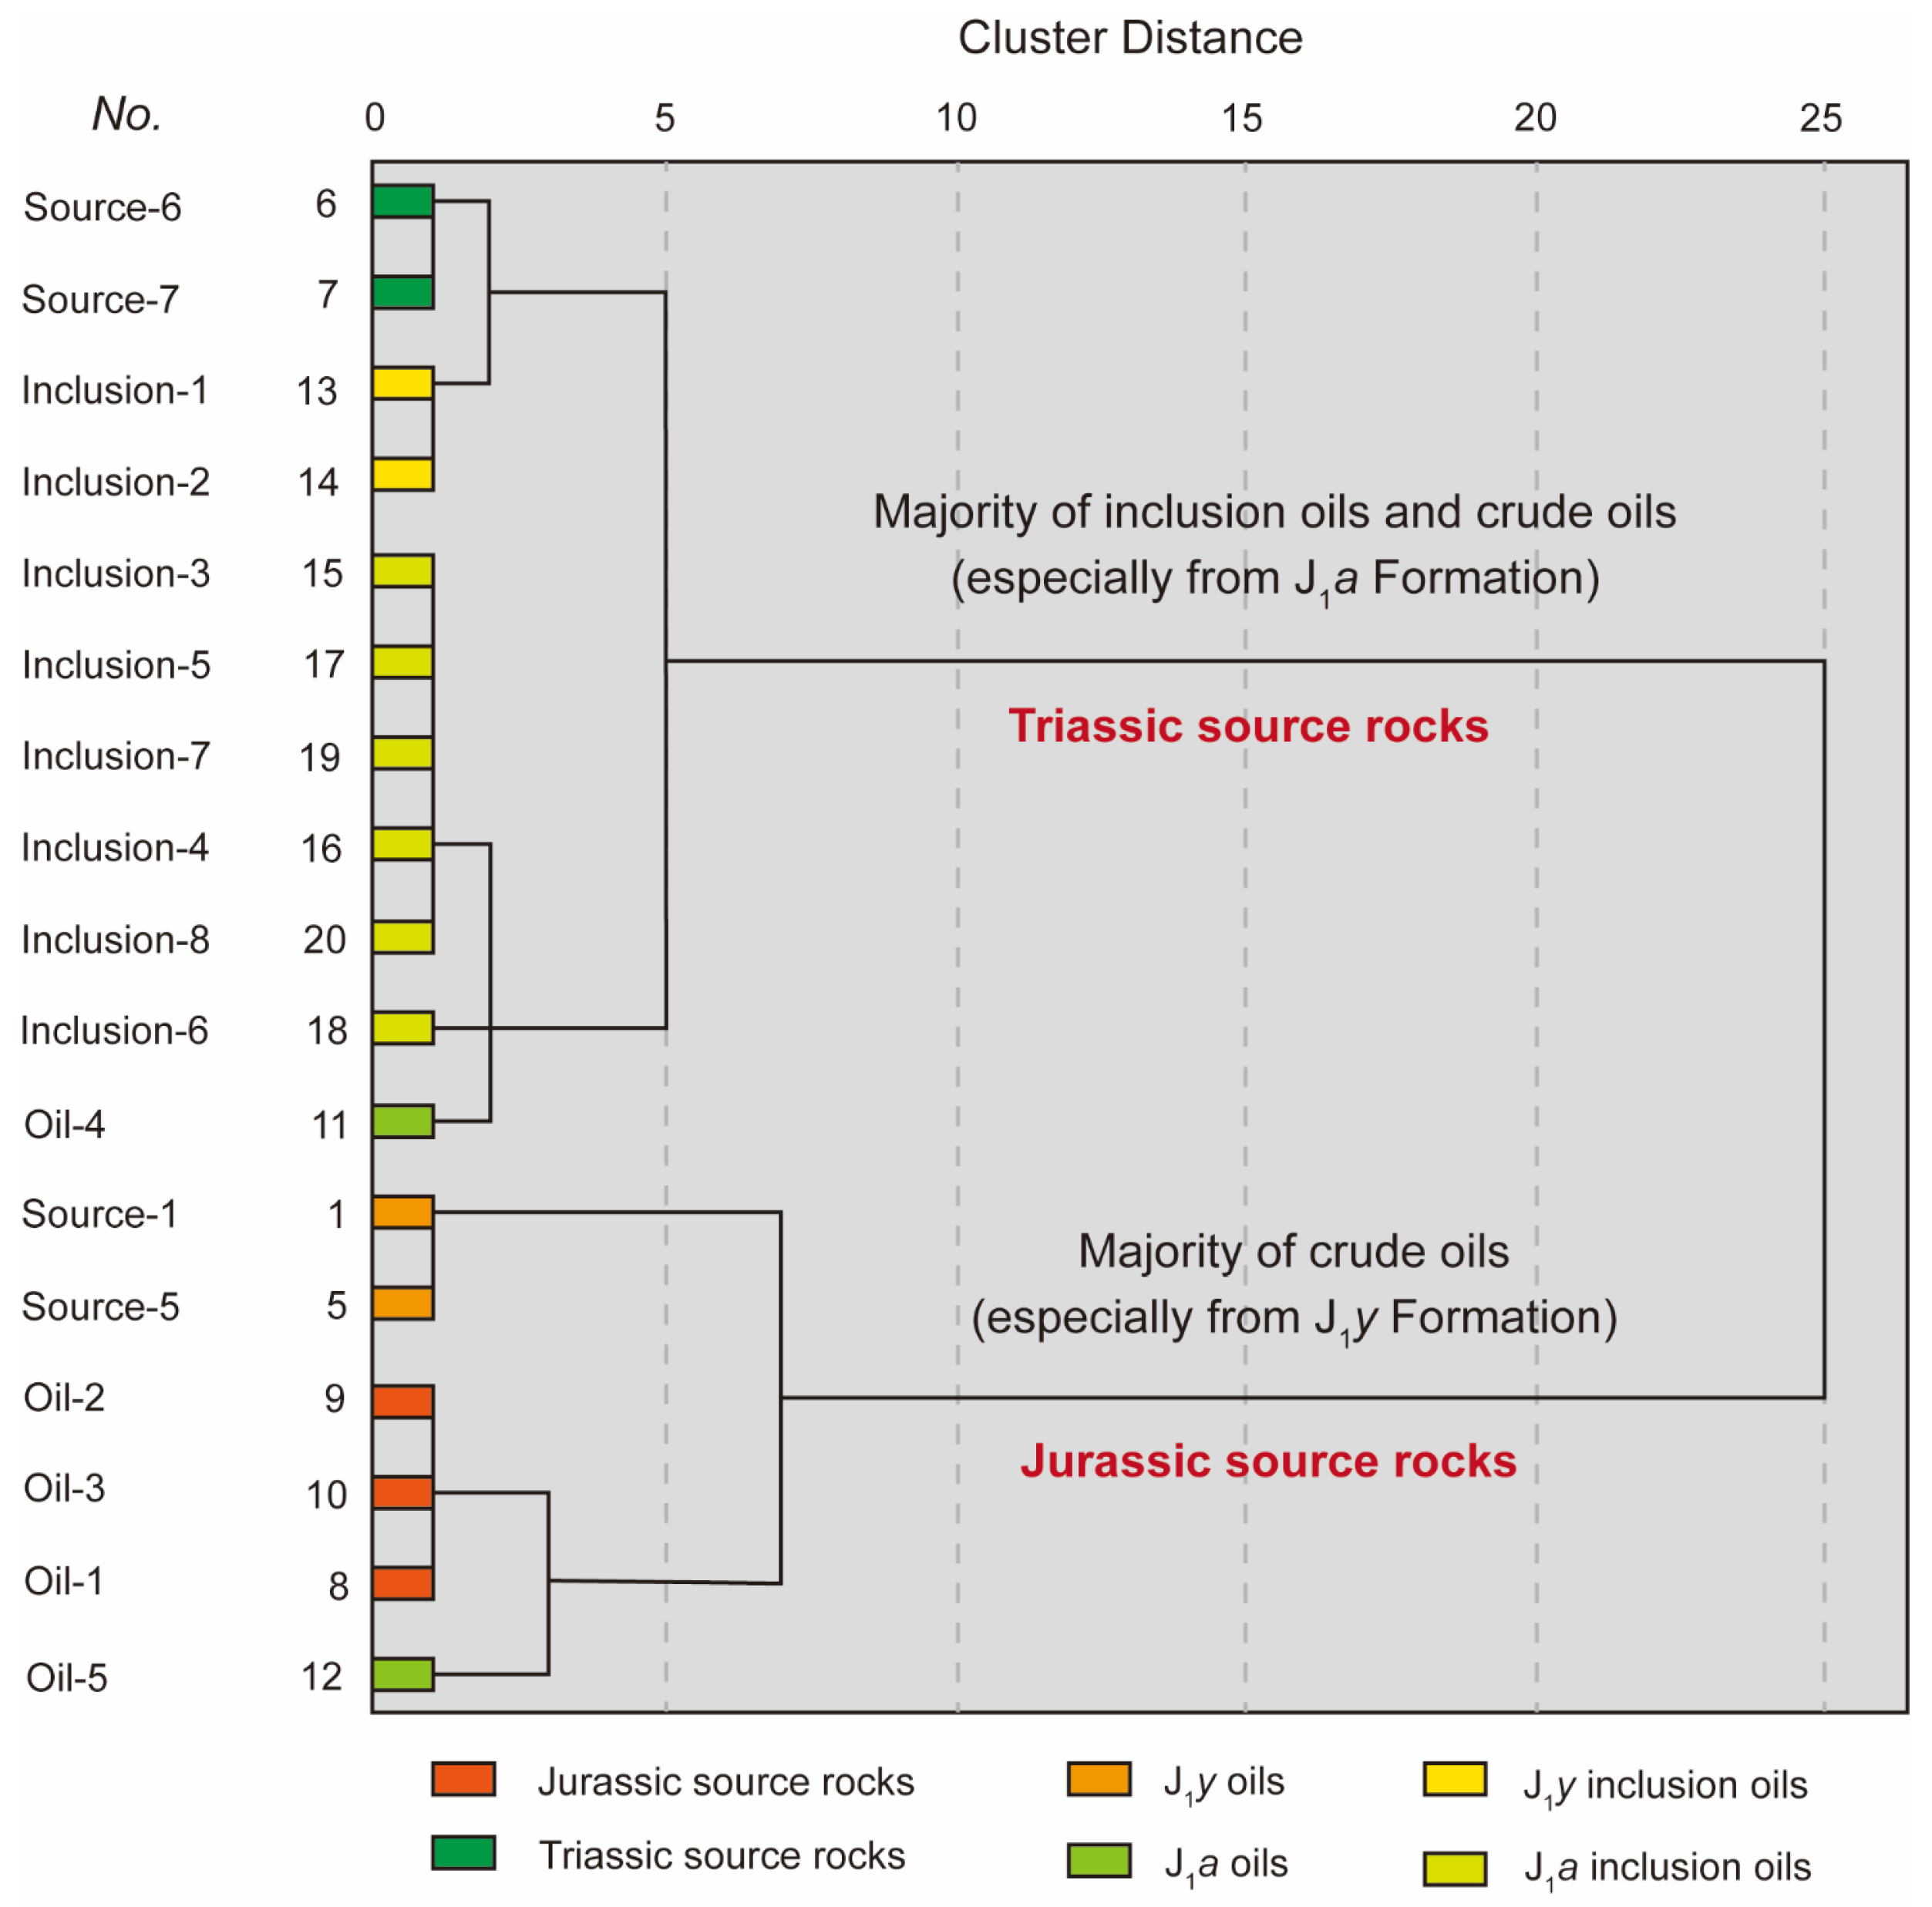
4.3.1. HCA Results
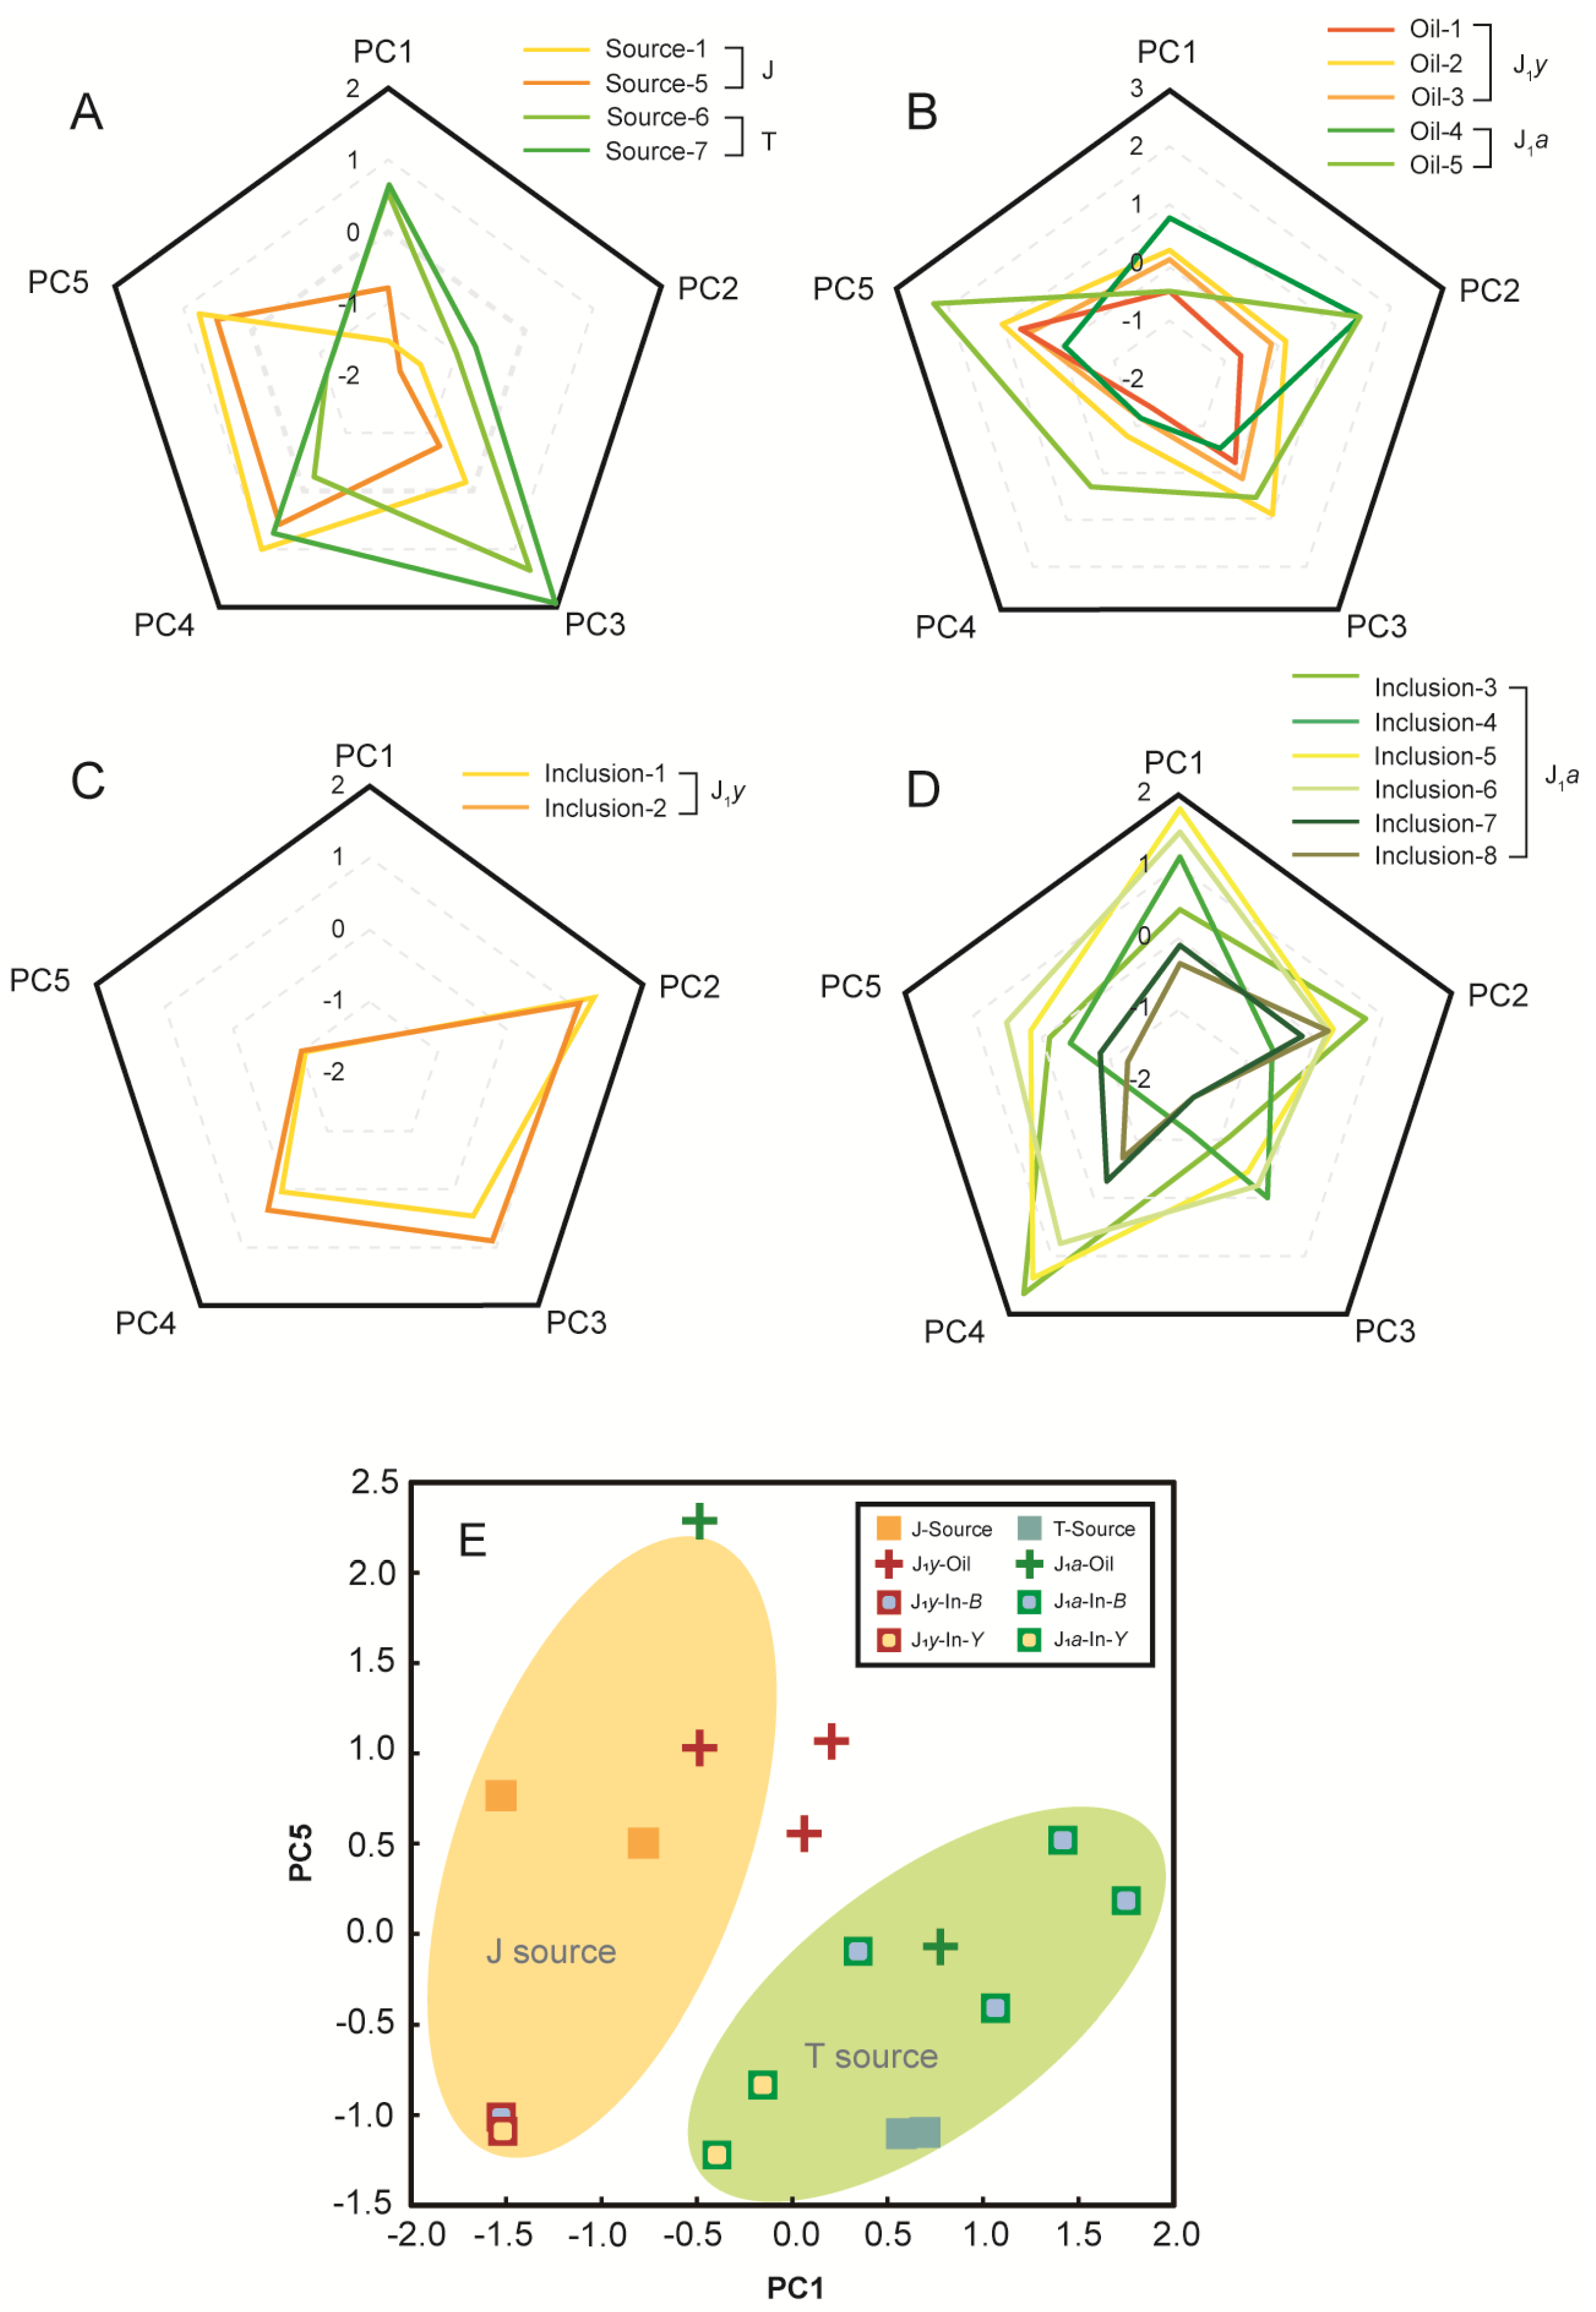
4.3.2. PCA Results
4.4. Basin Modeling Results
4.4.1. Hydrocarbon Generation and Accumulation History
4.4.2. Mass of Hydrocarbon Generation
5. Discussion
5.1. Source Rock Characteristics
5.2. Oil–Source Correlation
5.2.1. Different Oil–Source Correlations
5.2.2. Potential Oil–Source Changing
5.3. Gas Sources
5.4. Hydrocarbon Accumulation History
6. Conclusions
Author Contributions
Funding
Institutional Review Board Statement
Informed Consent Statement
Data Availability Statement
Conflicts of Interest
References
- Morley, C.K.; King, R.; Hillis, R.; Tingay, M.; Backe, G. Deepwater fold and thrust belt classification, tectonics, structure and hydrocarbon prospectivity: A review. Earth-Sci. Rev. 2001, 104, 41–91. [Google Scholar] [CrossRef]
- Zelilidis, A.; Maravelis, A.G.; Tserolas, P.; Konstantopoulos, P.A. An overview of the petroleum systems in the Ionian Zone onshore NW Greece and Albania. J. Pet. Geol. 2015, 38, 331–348. [Google Scholar] [CrossRef]
- Obermayer, M.; Osadetz, K.G.; Fowler, M.G.; Snowdon, L.R. Light hydrocarbon (gasoline range) parameter refinement of biomarker-based oil–oil correlation studies: An example from Williston Basin. Org. Geochem. 2000, 31, 959–976. [Google Scholar] [CrossRef]
- Bailey, N.J.; Burwood, R.; Harriman, G.E. Application of pyrolysate carbon isotope and biomarker technology to organofacies definition and oil correlation problems in North Sea basins. Org. Geochem. 1990, 16, 1157–1172. [Google Scholar] [CrossRef]
- Curiale, J.A. High-resolution organic record of Bridge Creek deposition, northwest New Mexico. Org. Geochem. 1994, 21, 489–507. [Google Scholar] [CrossRef]
- Requejo, A.G. Maturation of petroleum source rocks—II. Quantitative changes in extractable hydrocarbon content and composition associated with hydrocarbon generation. Org. Geochem. 1994, 21, 91–105. [Google Scholar] [CrossRef]
- Dzou, L.I.P.; Noble, R.A.; Senftle, J.T. Maturation effects on absolute biomarker concentration in a suite of coals and associated vitrinite concentrates. Org. Geochem. 1995, 23, 681–697. [Google Scholar] [CrossRef]
- Farrimond, P.; Taylor, A.; TelnÆs, N. Biomarker maturity parameters: The role of generation and thermal degradation. Org. Geochem. 1998, 29, 1181–1197. [Google Scholar] [CrossRef]
- Fang, R.; Littke, R.; Zieger, L.; Baniasad, A.; Li, M.; Schwarzbauer, J. Changes of composition and content of tricyclic terpane, hopane, sterane, and aromatic biomarkers throughout the oil window: A detailed study on maturity parameters of Lower Toarcian Posidonia Shale of the Hils Syncline, NW Germany. Org. Geochem. 2019, 138, 103928. [Google Scholar] [CrossRef]
- Hakimi, M.H.; Alaug, A.S.; Kahal, A.Y.; Rahim, A.; Radwan, A.E.; Talha Qadri, S.M. Organic matter characteristics and gas generation prospect of the fluvial deltaic organic-rich shale in the offshore Jiza-Qamar Basin, Yemen, based on organic geochemical, macerals composition, and biomarker results combined with 1-D basin modeling. Geol. J. 2023, 58, 4035–4056. [Google Scholar] [CrossRef]
- Moldowan, J.M.; Sundararamun, P.; Schoell, M. Sensitivity of biomarker properties to deposition environment and/or source input in the Lower Toarcian of S. W. Germany. Org. Geochem. 1986, 10, 915–926. [Google Scholar] [CrossRef]
- Keller, M.A.; Macquaker, J.H.S. High resolution analysis of petroleum source potential and lithofacies of Lower Cretaceous mudstone core (Pebble Shale Unit and GRZ of Hue Shale), Mikkelsen Bay State #1 Well, North Slope Alaska. In Petroleum Plays and Systems in the National Petroleum Reserve-Alaska; Houseknecht, D.W., Ed.; Society of Economic Paleontologists and Mineralogists, SEPM Core Workshop: Tulsa, OK, USA, 2001; Volume 21, pp. 37–56. [Google Scholar]
- Barker, C.E.; Pawlewicz, M.; Cobabe, E.A. Deposition of sedimentary organic matter in black shale facies indicated by the geochemistry and petrography of high-resolution samples, Blake Nose, western North Atlantic. In Western North Atlantic Palaeogene and Cretaceous Palaeoceanography; Geological Society: London, UK, 2001; Volume 183, pp. 49–72. [Google Scholar]
- Curiale, J.A. Oil–source rock correlations—Limitations and recommendations. Org. Geochem. 2008, 39, 1150–1161. [Google Scholar] [CrossRef]
- Hunt, J.M. Petroleum Geochemistry and Geology; W H Freemme and Company: San Francisco, CA, USA, 1979; pp. 25–189. [Google Scholar]
- Rullkötter, J. Gas chromatography/mass spectrometry of degraded triterpanes in fossil organic matter—A record of microbial action. Int. J. Mass Spectrom. 1983, 48, 39–42. [Google Scholar] [CrossRef]
- Peters, K.E.; Walters, C.C.; Moldowan, J.M. The Biomarker Guide: Biomarkers and Isotopes in Petroleum Exploration and Earth History; Cambridge University: London, UK, 2005; Volume 2, pp. 511–559. [Google Scholar]
- Waples, D.W.; Curiale, J.A. Oil–oil and oil–source rock correlations. In Exploring for Oil and Gas Traps; Beaumont, E.A., Foster, N.H., Eds.; American Association of Petroleum Geology: Tulsa, OK, USA, 1999; Chapter 8; pp. 1–71. [Google Scholar]
- Maravelis, A.G.; Koukounya, A.; Tserolas, P.; Pasadakis, N.; Zelilidis, A. Geochemistry of Upper Miocene-Lower Pliocene source rocks in the Hellenic Fold and Thrust Belt, Zakynthos Island, Ionian Sea, western Greece. Mar. Pet. Geol. 2015, 66, 217–230. [Google Scholar] [CrossRef]
- George, S.C.; Krieger, F.W.; Eadington, P.J.; Quezada, R.A.; Greenwood, P.F.; Eisenberg, L.I.; Hamilton, P.J.; Wilson, M.A. Geochemical comparison of oil-bearing fluid inclusions and produced oil from the Toro sandstone, Papua New Guinea. Org. Geochem. 1997, 26, 155–173. [Google Scholar] [CrossRef]
- Bourdet, J.; Eadington, P.; Volk, H.; George, S.C.; Pironon, J.; Kempton, R. Chemical changes of fluid inclusion oil trapped during the evolution of an oil reservoir: Jabiru–1A case study (Timor Sea, Australia). Mar. Pet. Geol. 2012, 36, 118–139. [Google Scholar] [CrossRef]
- Karlsen, D.A.; Nedkvitne, T.; Larter, S.R.; Bjørlykke, K. Hydrocarbon composition of authigenic inclusions: Application to elucidation of petroleum reservoir filling history. Geochim. Cosmochim. Acta 1993, 57, 3641–3659. [Google Scholar] [CrossRef]
- Pan, C.; Yang, J.; Fu, J.; Sheng, G. Molecular correlation of free oil and inclusion oil of reservoir rocks in the Junggar Basin, China. Org. Geochem. 2003, 34, 357–374. [Google Scholar] [CrossRef]
- Volk, H.; George, S.C.; Middleton, H.; Schofield, S. Geochemical comparison of fluid inclusion and present-day oil accumulations in the Papuan Foreland—Evidence for previously unrecognised petroleum source rocks. Org. Geochem. 2005, 36, 29–51. [Google Scholar] [CrossRef]
- Volk, H.; George, S.C.; Killops, S.D.; Lisk, M.; Ahmed, M.; Quezada, R.A. The use of fluid inclusion oils to reconstruct the charge history of petroleum reservoirs—An example from the Taranaki Basin. In Proceedings of the 2002 New Zealand Petroleum Conference: Crown Minerals, Auckland, New Zealand, 24–27 February 2002; pp. 221–233. [Google Scholar]
- Hagemann, H.W.; Hollerbach, A. The fluorescence behaviour of crude oils with respect to their thermal maturation and degradation. Org. Geochem. 1986, 10, 473–480. [Google Scholar] [CrossRef]
- Stasiuk, L.D.; Snowdon, L.R. Fluorescence micro-spectrometry of synthetic and natural hydrocarbon fluid inclusions: Crude oil chemistry, density and application to petroleum migration. Appl. Geochem. 1997, 12, 229–241. [Google Scholar] [CrossRef]
- Chang, Y.; Huang, W. Simulation of the fluorescence evolution of “live” oils from kerogens in a diamond anvil cell: Application to inclusion oils in terms of maturity and source. Geochim. Cosmochim. Acta 2008, 72, 3771–3787. [Google Scholar] [CrossRef]
- Macleod, G.; Petch, G.S.; Larter, S.R.; Aplin, A.C. Investigations of the composition of hydrocarbon fluid inclusions. In Proceeding of the 205th ACS National Meeting, Division of Geochemistry, Denver, FL, USA, 28 March–2 April 1993. [Google Scholar]
- Cheng, K.; Xiong, Y.; Zeng, X. Research on coal-derived hydrocarbon in Turpan-Hami Basin. Acta Pet. Sin. 2002, 23, 13–17. [Google Scholar]
- Xiong, Y.; Cheng, K.; Yang, Z. Advances in the correlation of oils and source in the Jiuxi depression, Northwest China. Pet. Explor. Dev. 2004, 31, 36–39. [Google Scholar]
- Leo, C.O.; Nicolas, C.O.; Mudiaga, C.O. Multivariate analysis of source and maturity biomarker indices of crude oils from SW Niger Delta. J. Geoscil. 2014, 18, 365–371. [Google Scholar]
- Irwin, H.; Meyer, T. Lacustrine organic facies. A biomarker study using multivariate statistical analysis. Org. Geochem. 1990, 16, 197–210. [Google Scholar] [CrossRef]
- Peters, K.E.; Moldowan, J.M.; Schoell, M.; Hempkins, W.B. Petroleum isotopic and biomarker composition related to source rock organic matter and depositional environment. Org. Geochem. 1986, 10, 17–27. [Google Scholar] [CrossRef]
- Zumberge, H.E. Prediction of source rock characteristics based on terpane biomarkers in crude oils: A multivariate statistical approach. Geochim. Cosmochim. Acta 1987, 51, 1625–1637. [Google Scholar] [CrossRef]
- Welte, D.H.; Yalcin, M.N. Basin modelling- A new comprehensive methodology in petroleum geology. Org. Geochem. 1988, 13, 141–151. [Google Scholar] [CrossRef]
- Poelchau, H.S.; Baker, D.R.; Hantschel, T.; Horsfield, B.; Wygrala, B. Basin simulation and the design of the conceptual basin model. In Petroleum and Basin Evolution; Welte, D.H., Horsfield, B., Baker, D.R., Eds.; Springer: Berlin, Germany, 1997; pp. 5–70. [Google Scholar]
- Burgreen-Chan, B.; Graham, S.A. Petroleum system modeling of the East Coast Basin, Hawke Bay, New Zealand. AAPG Bull. 2018, 102, 587–612. [Google Scholar] [CrossRef]
- D’ Ambrosio, A.; Lipparini, L.; Bigi, S.; Cassola, T.; Bambridge, V.R.; Derks, J.F.; Trippetta, F. Structural restoration and basin modelling of the central apennine orogen/fordeep/foreland system: New insights on the regional petroleum system. Mar. Petr. Geol. 2021, 127, 104948. [Google Scholar] [CrossRef]
- Underdown, R.; Redfern, J. Petroleum generation and migration in the Ghadames Basin, North Africa: A two-dimensional basin-modeling study. AAPG Bull. 2008, 92, 53–76. [Google Scholar] [CrossRef]
- Hakimi, M.H.; Najaf, A.A.; Abdula, R.A.; Mohialdeen, I.M.J. Generation and expulsion history of oil-source rock (Middle Jurassic Sargelu Formation) in the Kurdistan of north Iraq, Zagros folded belt: Implications from 1D basin modeling study. J. Pet. Sci. Eng. 2017, 162, 852–872. [Google Scholar] [CrossRef]
- Pang, X.; Peng, J.; Jiang, Z.; Yang, H.; Wang, P.; Jiang, F.; Wang, K. Hydrocarbon accumulation processes and mechanisms in Lower Jurassic tight sandstone reservoirs in the Kuqa subbasin, Tarim Basin, northwest China: A case study of the Dibei tight gas field. AAPG Bull. 2019, 4, 769–796. [Google Scholar] [CrossRef]
- Jia, C.; Li, Q. Petroleum geology of Kela-2, the most productive gas field in China. Mar. Pet. Geol. 2008, 25, 335–343. [Google Scholar]
- Li, J.; Wang, C.; Li, J.; Ma, W.; Zhang, H.; Lu, Y.; Li, D.; Liu, M. Source and exploration direction of tight oil and gas in the Dibei section of northern Kuqa depression. China Pet. Explor. 2019, 24, 485–497, (In Chinese with English abstract). [Google Scholar]
- Tang, Y.; Yang, X.; Xie, H.; Xu, Z.; Wei, H.; Xie, Y. Tight gas reservoir characteristics and exploration potential of jurassic Ahe Formation in Kuqa depression, Tarim Basin. China Pet. Explor. 2021, 26, 113–124, (In Chinese with English abstract). [Google Scholar]
- Wang, Q.; Zhang, R.; Yang, X.; Yu, Z.; Xu, Z.; Zhou, L.; Wang, K.; Zhang, L. Major breakthrough and geological significance of tight sandstones gsa exploration in Jurassic Ahe Formation in Dibei area, eastern Kuqa depression. Acta Pet. Sin. 2022, 43, 1050–1064, (In Chinese with English abstract). [Google Scholar]
- Hanson, A.D.; Zhang, S.C.; Moldowan, J.M.; Liang, D.G.; Zhang, B.M. Molecular organic geochemistry of the Tarim Basin, Northwest China. AAPG Bull. 2000, 84, 1109–1128. [Google Scholar]
- Liang, D.; Zhang, S.; Chen, J.; Wang, F.; Wang, P. Organic geochemistry of oil and gas in the Kuqa depression, Tarim Basin, NW China. Org. Geochem. 2003, 34, 873–888. [Google Scholar] [CrossRef]
- Qin, S.; Dai, J.; Liu, X. The controlling factors of oil and gas generation from coal in the Kuqa Depression of Tarim Basin, China. Int. J. Coal Geol. 2007, 70, 255–263. [Google Scholar] [CrossRef]
- Shi, G.; Zhang, Q.; Yang, X.; Mi, S. Oil and gas assessment of the Kuqa Depression of Tarim Basin in western China: By simple fluid flow models of primary and secondary migrations of hydrocarbons. J. Pet. Sci. Eng. 2010, 75, 77–90. [Google Scholar] [CrossRef]
- Jiang, H.; Pang, X.; Yu, R.; Chen, D.; Zhao, J.; Hu, T. Lower limit of hydrocarbon accumulation in the Kuqa Depression, Tarim Basin, NW China. Geol. J. 2017, 52, 141–153. [Google Scholar] [CrossRef]
- Song, X.; Lyu, X.; Shen, Y.; Guo, S. Hydrocarbon migration and accumulation history in deep reservoirs: A case study of Mesozoic sandstone gas reservoirs in the Kelasu-Yiqikelike structural belt of the Kuqa Depression, Tarim Basin. J. Geosci. 2019, 23, 69–86. [Google Scholar] [CrossRef]
- Wu, H.; Yan, S.; Zhao, M.; Lu, X. Hydrocarbon accumulation prospect and charge history of the northern monocline belt in Kuqa Depression of Tarim Basin, western China. Nat. Gas Geosci. 2015, 26, 2325–2335, (In Chinese with English Abstract). [Google Scholar]
- Graham, S.A.; Hendrix, M.S.; Wang, L.B.; Carroll, A.R. Collision successor basins of western China, impact of tectonic inheritance on sand composition. GSA Bull. 1993, 105, 323–344. [Google Scholar] [CrossRef]
- Wei, G.; Zhang, R.; Zhi, F.; Wang, K.; Yu, C.; Dong, C. Formation conditions and exploration directions of Mesozoic structural-lithologic reservoirs in the eastern Kuqa depression. Acta Pet. Sin. 2021, 42, 1113–1125. [Google Scholar]
- Zou, C.; Jia, J.; Tao, S.; Tao, X. Analysis of Reservoirs Forming Conditions and Prediction of Continuous Tight Gas Reservoirs for the Deep Jurassic in the Eastern Kuqa Depression, Tarim Basin. Acta Geol. Sin. 2011, 85, 1173–1186. [Google Scholar] [CrossRef]
- Ju, W.; Hou, G.; Huang, S.; Ren, K. Structural fracture distribution and prediction of the lower Jurassic Ahe Formation sandstone in the Yinan-Tuzi area, Kuqa depression. Geotecton. Metallog. 2013, 37, 592–602. [Google Scholar]
- Lu, H.; Lu, X.; Fan, J.; Zhao, M.; Wei, H.; Zhang, B.; Lu, Y. Controlling effect of fractures on gas accumulation and production within the tight sandstone: A case study on the Jurassic Dibei gas reservoir in the eastern part of the Kuqa foreland basin, China. Nat. Gas Geosci. 2016, 1, 61–71. [Google Scholar] [CrossRef]
- Wang, H.; Wu, T.; Fu, X.; Liu, B.; Wang, S.; Jia, R.; Zhang, C. Quantitative determination of the brittle–ductile transition characteristics of caprocks and its geological significance in the Kuqa depression, Tarim Basin, western China. J. Pet. Sci. Eng. 2019, 173, 492–500. [Google Scholar] [CrossRef]
- Molnar, P.; Tapponnier, P. Cenozoic Tectonics of Asia: Effects of a Continental Collision: Features of recent continental tectonics in Asia can be interpreted as results of the India-Eurasia collision. Science 1975, 189, 419–426. [Google Scholar] [CrossRef] [PubMed]
- Du, J.; Wang, Z.; Hu, S.; Wang, Q.; Xie, H. Formation conditions and geological characteristics of deep giant gas provinces in the Kuqa foreland thrust belt. Pet. Explor. Dev. 2012, 39, 413–422. [Google Scholar] [CrossRef]
- Guo, S.; Lyu, X.; Zhang, Y. Relationship between tight sandstone reservoir formation and hydrocarbon charging: A case study of a Jurassic reservoir in the eastern Kuqa Depression, Tarim Basin, NW China. J. Nat. Gas Sci. Eng. 2018, 52, 304–316. [Google Scholar] [CrossRef]
- Liu, J.; Jiang, Z.; Liu, K.; Gui, L.; Xing, J. Hydrocarbon sources and charge history in the Southern Slope Region, Kuqa Foreland Basin, northwestern China. Mar. Pet. Geol. 2016, 74, 26–46. [Google Scholar] [CrossRef]
- Lisk, M.; Eadington, P.J. Oil migration in the Cartier Through, Vulcan Sub–basin. In The Sedimentary Basins of WA: Proceedings PESA Symposium, Perth, Australia; Purcell, P.G., Purcell, R.R., Eds.; Petroleum Exploration Society of Australia (PESA): Perth, Australia, 1994; pp. 301–312. [Google Scholar]
- O’Brien, G.W.; Lisk, M.; Duddy, I.; Eadington, P.J.; Cadman, S.; Fellows, M. Late Tertiary fluid migration in the Timor Sea: A key control on thermal and diagenetic histories. APPEA 1996, 36, 399–427. [Google Scholar] [CrossRef]
- Eadington, P.J.; Kempton, R.H. New developments to investigate models of oil accumulation and fluid interactions in reservoirs using data from fluid inclusions. In Proceeding of the APPEA Conference & Exhibition, Perth, Australia, 6–9 April 2008; Volume 48. [Google Scholar]
- Liu, K.; George, S.C.; Lu, X.; Gong, S.; Tian, H.; Gui, L. Innovative fluorescence spectrophotometric techniques for rapidly characterizing oil inclusions. Org. Geochem. 2014, 72, 34–45. [Google Scholar] [CrossRef]
- George, S.C.; Volk, H.; Dutkiewicz, A. Mass spectrometry techniques for analysis of oil and gas trapped in fluid inclusions. In Mass Spectrometry Handbook; Lee, M.S., Ed.; John Wiley & Sons, Inc.: Hoboken, NJ, USA, 2012; pp. 645–673. [Google Scholar]
- Pradhan, U.K.; Shirodkar, P.V.; Shahu, B.K. Physicochemical characteristic of the coastal water off Devi estuary, Orissa and evaluation of its seasonal changes using chemometric techniques. Curr. Sci. 2009, 96, 1203–1209. [Google Scholar]
- Onojake, M.C.; Ukerun, S.O.; Iwuoha, G. A Statistical Approach for Evaluation of the Effects of Industrial and Municipal Wastes on Warri Rivers, Niger Delta, Nigeria. Water Qual. Expo. Health 2011, 3, 91–99. [Google Scholar] [CrossRef]
- Odden, W.; Kvalheim, O.M. Application of multivariate modeling to detect hydrocarbon components for optimal discrimination between two source rock types. Appl. Geochem. 2000, 15, 611–627. [Google Scholar] [CrossRef]
- Elliott, D. The construction of balanced cross-section. J. Struct. Geol. 1983, 5, 101. [Google Scholar] [CrossRef]
- Dahlstrom, C.D.A. Balanced cross sections. Can. J. Earth Sci. 1969, 6, 743–757. [Google Scholar] [CrossRef]
- Dennison, J.M.; Woodward, H.P. Palinspastic maps of central Appalachians. AAPG Bull. 1963, 47, 666–680. [Google Scholar]
- Maerten, L.; Gillespie, P.; Daniel, J.-M. 3-D geomechanical modeling for constraint of subseismic fault simulation. AAPG Bull. 2006, 90, 1337–1358. [Google Scholar] [CrossRef]
- Suppe, J.; Donald, A. Medwedeff Geometry and kinematics of fault-propagation folding. Eclogae Geol. Helv. 1983, 283, 684–721. [Google Scholar]
- Williams, G.; Chapman, T. Strains developed in the hanging walls of trusts due to their slip-propagation rate, a dislocation model. J. Struct. Geol. 1983, 5, 563–571. [Google Scholar] [CrossRef]
- Waples, D.W.; Suizu, M.; Kamata, H. The art of maturity modeling: Part 2––Alternative models and sensitivity analysis. AAPG Bull. 1992, 76, 47–66. [Google Scholar]
- Pepper, A.S.; Corvi, P.J. Simple kinetic models of petroleum formation: Part I—Oil and gas generation from kerogen. Mar. Pet. Geol. 1995, 12, 291–319. [Google Scholar] [CrossRef]
- Tissot, B.P.; Pelet, R.; Ungerer, P. Thermal history of sedimentary basins, maturation indices, and kinetics of oil and gas generation. AAPG Bull. 1987, 71, 1445–1466. [Google Scholar]
- Peters, K.E.; Burnham, A.K.; Walters, C.C. Petroleum generation kinetics: Single versus multiple heating-ramp open-system pyrolysis. AAPG Bull. 2015, 99, 591–616. [Google Scholar] [CrossRef]
- Ungerer, P.; Burrus, J.; Doligez, B.; Chenet, P.Y.; Bessis, F. Basin evaluation by integrated two-dimensional modelling of heat transfer, fluid flow, hydrocarbon generation, and migration. AAPG Bull. 1990, 74, 309–334. [Google Scholar]
- Dieckmann, V. Modelling petroleum formation from heterogeneous source rocks: The influence of frequency factors on activation energy distribution and geological prediction. Mar. Pet. Geol. 2005, 22, 375–390. [Google Scholar] [CrossRef]
- Liu, J.; Yang, X.; Liu, K.; Xu, Z.; Jia, K.; Lu, Z.; Wei, H.; Zhang, L.; Wu, S.; Wei, X. Differential hydrocarbon generation and evolution of typical terrestrial gas-prone source rocks: An example from the Kuqa foreland basin, NW China. Mar. Pet. Geol. 2023, 152, 106225. [Google Scholar] [CrossRef]
- Cheng, K.; Wang, Z. Hydrocarbon generation condition study for marine carbonate in high-mature and over-mature stage. Sci. China Earth Sci. 1996, 26, 537–543. (In Chinese) [Google Scholar]
- Cheng, K.; Wang, Z.; Xiong, Y.; Zhong, N. Hydrocarbon generation research for marine carbonate in China. Mar. Origin Pet. Geol. 1999, 4, 1–11. (In Chinese) [Google Scholar]
- Lu, S.; Xue, H.; Zhong, N. Simulating Calculation of the Variations of Organic Matter Abundance and Hydrocarbon-generating Potential during Geological Process. Geol. Rev. 2003, 49, 292–297, (In Chinese with English Abstract). [Google Scholar]
- Wygrala, B.P. Integrated Study of an Oil Field in the Southern Po Basin, Northern Italy; Forschungszentrum Karlsruhe/Jülich: Karlsruhe, Germany; Jülich, Germany, 1989; p. 217. [Google Scholar]
- Guo, Y.; Pang, X.; Dong, Y.; Jiang, Z.; Chen, D.; Jiang, F. Hydrocarbon generation and migration in the Nanpu Sag, Bohai Bay Basin, eastern China: Insight from basin and petroleum system modeling. J. Asian Earth Sci. 2013, 77, 140–150. [Google Scholar] [CrossRef]
- Deng, L.; Wang, Y. Dynamic simulation approach to the evolution history of the palaeotemperature field of a basin. J. Chengdu Univ. Technol. 1998, 25, 38–47, (In Chinese with English Abstract). [Google Scholar]
- Wang, L.; Li, C.; Liu, S.; Li, H.; Xu, M.; Yu, D.; Jia, C.; Wei, G. Terrestrial heatflow distribution in Kuqa foreland basin, Tatrim Basin, NW China. Pet. Explor. Dev. 2005, 32, 79–84, (In Chinese with English Abstract). [Google Scholar]
- Qiu, N.; Chang, J.; Feng, Q.; Zeng, S.; Liu, X.; Li, H.; Ma, A. Maturity evolution of deep and ultra-deep source rocks in the Chinese central and western basins. Earth Sci. Front. 2023, 30, 199–212, (In Chinese with English Abstract). [Google Scholar]
- Kvalheim, O.M.; Christy, A.A.; Telnæs, N.; Bjørseth, A. Maturity determination of organic matter in coals using the methylphenanthrene distribution. Geochim. Cosmochim. Acta 1987, 51, 1883–1888. [Google Scholar] [CrossRef]
- Gao, T.; Ding, X.; Yang, X.; Chen, C.; Xu, Z.; Liu, K.; Zhang, X.; Cao, W. Geochemical Characteristics and Depositional Environment of Coal-Measure Hydrocarbon Source Rocks in the Northern Tectonic Belt, Kuqa Depression. Appl. Sci. 2022, 12, 9464. [Google Scholar] [CrossRef]
- Didyk, B.M.; Simoneit, B.R.T.; Brassell, S.C.; Eglinton, G. Organic geochemical indicators of palaeoenvironmental conditions of sedimentation. Nature 1978, 272, 216–222. [Google Scholar] [CrossRef]
- Philp, R.P.; Gilbert, T.D. Source rock and asphaltene biomarker characterization by pyrolysisgas chromatography-mass spectrometry-multiple ion detection. Geochim. Cosmochim. Acta 1985, 49, 1421–1432. [Google Scholar] [CrossRef]
- Boudou, J.-P.; Pelet, R.; Letolle, R. A model of the diagenetic evolution of coaly sedimentary organic matter. Geochim. Cosmochim. Acta 1984, 48, 1357–1362. [Google Scholar] [CrossRef]
- Koopmans, M.P.; Koster, J.; Kaam–Peters, H.M.E.; Kenig, F.; Schouten, S.; Hartger, W.; Leeuw, J.W. Diagenetic and Catagenetia products of isorenieratene: Molecular indicators for photic zone anoxia. Geochim. Cosmochim. Acta 1996, 60, 67–96. [Google Scholar] [CrossRef]
- Huang, W.; Meinschein, W.G. Sterols as ecological indicators. Geochim. Cosmochim. Acta 1979, 43, 739–745. [Google Scholar] [CrossRef]
- He, T.; Lu, S.; Li, W.; Wang, W.; Sun, D.; Pan, W.; Zhang, B. Geochemical characteristics and effectiveness of thick, black shales in southwestern depression, Tarim Basin. J. Pet. Sci. Eng. 2019, 185, 106607. [Google Scholar] [CrossRef]
- Kleemann, D.O.; Walker, S.K.; Walkley, J.R.W.; Smith, D.H.; Ponzoni, R.W.; Seamark, R.F. Factors influencing lamb survival in a high fecundity Booroola Merino × South Australian Merino flock. Theriogenology 1990, 33, 965–976. [Google Scholar] [CrossRef]
- Damsté, J.S.S.; Leeuw, J.W.D. Analysis, structure and geochemical significance of organically -bound sulphur in the geosphere: State of the art and future research. Org. Geochem. 1990, 16, 1077–1101. [Google Scholar] [CrossRef]
- Moldowan, J.M.; Seifert, W.K.; Gallegos, E.J. Relationship between petroleum composition and depositional environment of petroleum source rocks. AAPG Bull. 1985, 69, 1255–1268. [Google Scholar]
- Cheng, B.; Liu, H.; Cao, Z.; Wu, X.; Chen, Z. Origin of deep oil accumulations in carbonate reservoirs within the north Tarim Basin: Insights from molecular and isotopic compositions. Org. Geochem. 2020, 139, 103931. [Google Scholar] [CrossRef]
- Radke, M.; Willsch, H.; Leythaeuser, D.; Teichmüller, M. Aromatic components of coal: Relation of distribution pattern to rank. Geochim. Cosmochim. Acta 1982, 46, 1831–1848. [Google Scholar] [CrossRef]
- Hou, D.; Xiao, Z.; Tang, Y.; Zhu, J.; Li, X. Geochemical characterization of mixing natural gas in Kekeya Field, Tarim Basin, China. Nat. Gas Geosci. 2003, 14, 474–479, (In Chinese with English Abstract). [Google Scholar]
- Zhang, M.; Huang, G.; Zhao, H.; Wang, X. Genetic features of gas-condensate reservoirs in the Kekeya Field, southwest depression in the Tarim Basin, China. Sci. China Earth Sci. 2008, 52, 19–25, (In Chinese with English Abstract). [Google Scholar] [CrossRef]
- Li, J.; Xie, Z.; Li, Z.; Luo, X.; Ju, G.; Gong, S. A gas source study for Kuqa depression. Pet. Explor. Dev. 2001, 28, 29–41. [Google Scholar]
- Li, J.; Hao, A.; Qi, X.; Chen, X.; Guo, J.; Ran, Q.; Li, Z.; Xie, Z.; Zeng, X.; Li, J.; et al. Geochemical characteristics and exploration potential of Jurassic coal-formed gas in northwest China. Nat. Gas Geosci. 2019, 4, 321–335. [Google Scholar] [CrossRef]
- Zou, Y.; Zhao, C.; Wang, Y.; Zhao, W.; Peng, P.; Shuai, Y. Characteristics and origin of natural gases in the Kuqa Depression of Tarim Basin, NW China. Org. Geochem. 2006, 37, 280–290. [Google Scholar] [CrossRef]

| No. | Well | Type | Formation | Depth/m | Proportion Oil Inclusion (Yellow:Blue) | GOI/% | ||
|---|---|---|---|---|---|---|---|---|
| 1 | Source-1 | YN-2 | Source rock | J2kz | 4319.8 | / | / | |
| 2 | Source-2 | YN-4 | Source rock | J2kz | 3220.8 | / | / | |
| 3 | Source-3 | YN-2 | Source rock | J1y | 4439.5 | / | / | |
| 4 | Source-4 | YN-4 | Source rock | J1y | 4230.1 | / | / | |
| 5 | Source-5 | YN-2 | Source rock | T3t | 5003.0 | / | / | |
| 6 | Source-6 | YN-2 | Source rock | T3h | 5310.0 | / | / | |
| 7 | Source-7 | YN-2 | Source rock | T3h | 5318.0 | / | / | |
| 8 | Oil-1 | YN-2 | Crude oil | J1y | 4746.0 | / | / | |
| 9 | Oil-2 | YN-2 | Crude oil | J1y | 4776.0 | / | / | |
| 10 | Oil-3 | YN-2 | Crude oil | J1y | 4905.0 | / | / | |
| 11 | Oil-4 | DB-104 | Crude oil | J1a | 4768.0 | / | / | |
| 12 | Oil-5 | DX-1 | Crude oil | J1a | 4800.0 | / | / | |
| 13 | Inclusion-1 | YN-2 | Oil inclusion | J1y-B | 4547.6 | 19:81 | Blue sample | 42.7 |
| 14 | Inclusion-2 | YS-4 | Oil inclusion | J1y-Y | 2585.5 | 89:11 | Yellow sample | 46.9 |
| 15 | Inclusion-3 | DB-5 | Oil inclusion | J1a-B | 5842.2 | 0:100 | Blue sample | 69.2 |
| 16 | Inclusion-4 | DB-5 | Oil inclusion | J1a-B | 5844.4 | 0:100 | Blue sample | 67.0 |
| 17 | Inclusion-5 | DB-102 | Oil inclusion | J1a-B | 4980.5 | 0:100 | Blue sample | 45.6 |
| 18 | Inclusion-6 | DB-102 | Oil inclusion | J1a-B | 5033.8 | 0:100 | Blue sample | 62.0 |
| 19 | Inclusion-7 | YS-4 | Oil inclusion | J1a-Y | 4005.0 | 98:2 | Yellow sample | 45.0 |
| 20 | Inclusion-8 | YS-4 | Oil inclusion | J1a-Y | 4072.6 | 90:10 | Yellow sample | 21.4 |
| No. | Well | Formation | R1 * | R2 | R3 * | R4 * | R5 * | R6 * | R7 * | R8 * | R9 * | R10 * | R11 * | R12 * | R13 | R14 | R15 | R16 | R17 | |
|---|---|---|---|---|---|---|---|---|---|---|---|---|---|---|---|---|---|---|---|---|
| 1 | Source-1 | YN-2 | J2kz | 0.22 | 0.11 | 0.68 | 0.32 | 1.87 | 0.66 | 0.32 | 0.36 | 0.26 | 0.12 | 0.46 | 0.43 | / | / | / | / | / |
| 2 | Source-2 | YN-4 | J2kz | 0.17 | 0.14 | 0.69 | 0.25 | 4.89 | 0.55 | 0.12 | 0.22 | 0.18 | 0.21 | 0.42 | 0.47 | 0.46 | 0.26 | 0.93 | 0.84 | 1.22 |
| 3 | Source-3 | YN-2 | J1y | 0.24 | 0.19 | 0.57 | 0.42 | 0.87 | 0.24 | 0.23 | 0.44 | 0.31 | 0.14 | 0.39 | 0.41 | / | / | / | / | / |
| 4 | Source-4 | YN-4 | J1y | 0.37 | 0.08 | 0.55 | 0.66 | 1.87 | 0.79 | 0.36 | 0.83 | 0.45 | 0.24 | 0.48 | 0.35 | 0.47 | 0.30 | 0.95 | 0.97 | 1.18 |
| 5 | Source-5 | YN-2 | T3t | 0.23 | 0.20 | 0.56 | 0.41 | 2.90 | 0.30 | 0.11 | 0.93 | 0.48 | 0.26 | 0.52 | 0.38 | 0.49 | 0.27 | 1.01 | 0.87 | 1.17 |
| 6 | Source-6 | YN-2 | T3h | 0.33 | 0.19 | 0.48 | 0.68 | 0.80 | 0.42 | 0.21 | 0.94 | 0.52 | 0.24 | 0.75 | 0.48 | 0.61 | 0.34 | 1.32 | 1.10 | 1.10 |
| 7 | Source-7 | YN-2 | T3h | 0.28 | 0.26 | 0.46 | 0.62 | 0.85 | 0.43 | 0.25 | 1.05 | 0.51 | 0.25 | 0.89 | 0.45 | / | / | / | / | / |
| 8 | Oil-1 | YN-2 | J1y | 0.27 | 0.27 | 0.46 | 0.58 | 2.04 | 0.21 | 0.09 | 0.69 | 0.41 | 0.17 | 0.51 | 0.48 | / | / | / | / | / |
| 9 | Oil-2 | YN-2 | J1y | 0.30 | 0.16 | 0.54 | 0.54 | 1.94 | 0.21 | 0.10 | 1.27 | 0.56 | 0.27 | 0.59 | 0.53 | / | / | / | / | / |
| 10 | Oil-3 | YN-2 | J1y | 0.33 | 0.20 | 0.47 | 0.70 | 1.88 | 0.24 | 0.11 | 1.05 | 0.51 | 0.19 | 0.62 | 0.45 | / | / | / | / | / |
| 11 | Oil-4 | DB-104 | J1a | 0.43 | 0.17 | 0.39 | 1.10 | 1.04 | 0.10 | 0.07 | 1.73 | 0.73 | 0.21 | 0.50 | 0.43 | / | / | / | / | / |
| 12 | Oil-5 | DX-1 | J1a | 0.43 | 0.20 | 0.37 | 1.16 | 2.62 | 0.23 | 0.08 | 1.57 | 0.61 | 0.19 | 0.59 | 0.48 | / | / | / | / | / |
| 13 | Inclusion-1 | YN-2 | J1y-B | 0.23 | 0.18 | 0.59 | 0.38 | 0.63 | 0.33 | 0.12 | 1.21 | 0.55 | 0.15 | 0.67 | 0.39 | 0.64 | 0.27 | 1.38 | 0.88 | 0.16 |
| 14 | Inclusion-2 | YS-4 | J1y-Y | 0.24 | 0.18 | 0.58 | 0.41 | 0.41 | 0.27 | 0.12 | 1.04 | 0.52 | 0.15 | 0.64 | 0.47 | 0.53 | 0.27 | 1.11 | 0.87 | 0.24 |
| 15 | Inclusion-3 | DB-5 | J1a-B | 0.38 | 0.12 | 0.50 | 0.75 | 1.07 | 0.43 | 0.34 | 1.24 | 0.55 | 0.19 | 0.43 | 0.30 | / | / | / | / | 0.93 |
| 16 | Inclusion-4 | DB-5 | J1a-B | 0.35 | 0.22 | 0.43 | 0.82 | 1.04 | 0.26 | 0.20 | 1.21 | 0.55 | 0.30 | 0.45 | 0.48 | / | / | / | / | 0.93 |
| 17 | Inclusion-5 | DB-102 | J1a-B | 0.40 | 0.24 | 0.35 | 1.13 | 1.23 | 0.48 | 0.34 | 1.38 | 0.58 | 0.26 | 0.43 | 0.37 | / | / | / | / | 0.96 |
| 18 | Inclusion-6 | DB-102 | J1a-B | 0.33 | 0.40 | 0.26 | 1.26 | 1.51 | 0.41 | 0.30 | 1.36 | 0.58 | 0.22 | 0.48 | 0.42 | 0.54 | 0.32 | 1.13 | 1.05 | 0.71 |
| 19 | Inclusion-7 | YS-4 | J1a-Y | 0.30 | 0.24 | 0.45 | 0.68 | 1.04 | 0.43 | 0.59 | 1.29 | 0.56 | 0.14 | 0.38 | 0.39 | 0.49 | 0.29 | 1.00 | 0.95 | 0.92 |
| 20 | Inclusion-8 | YS-4 | J1a-Y | 0.33 | 0.14 | 0.53 | 0.63 | 0.76 | 0.39 | 0.43 | 1.33 | 0.57 | 0.15 | 0.41 | 0.34 | 0.50 | 0.31 | 1.03 | 1.00 | 0.87 |
| Formation | Deposition Age | Erosion/ Hiatus | Lithology | Hydrocarbon Accumulation Element | PWD (m) | TOC (%) | HI (mg/g TOC) | ||
|---|---|---|---|---|---|---|---|---|---|
| From (Ma) | To (Ma) | From (Ma) | To (Ma) | ||||||
| Q | 1.8 | 0 | Conglomerate (typical) | Overburden Rock | 0 | ||||
| N2k | 5.3 | 1.8 | Shale and Sand. | Overburden Rock | 0 | ||||
| N1-2k | 12 | 5.3 | Shale and Sand. | Overburden Rock | 10 | ||||
| N1j | 23.3 | 12 | Gyp. and Sand. and Congl. | Overburden Rock | 10 | ||||
| E | 65 | 34 | 34 | 23.3 | Congl. and Sand. and Lime. | Overburden Rock | 5 | ||
| K1b | 125 | 112 | 112 | 65 | Shale and Sand. | Overburden Rock | 0 | ||
| K1s | 133.9 | 125 | Shale and Sand. | Overburden Rock | 5 | ||||
| K1y | 145.6 | 133.9 | Sand. (typical) | Reservoir Rock | 5 | ||||
| J2kz-SD | 178 | 165 | 165 | 145.6 | Sand. (typical) | Reservoir Rock | 2 | ||
| J2kz-DM | Shale (organic rich, 3%TOC) | Source Rock/Seal Rock | 2 | 3.00 | 250.00 | ||||
| J2kz-CM | Shale (organic rich, 20%TOC) | 2 | 51.00 | 300.00 | |||||
| J2kz-CO | Coal (pure) | 2 | 80.00 | 250.00 | |||||
| J1y-SD | 198 | 178 | Sand. (typical) | Reservoir Rock | 2 | ||||
| J1y-DM | Shale (organic rich, 3%TOC) | Source Rock/Seal Rock | 2 | 2.00 | 280.00 | ||||
| J1y-CM | Shale (organic rich, 20%TOC) | 2 | 55.00 | 300.00 | |||||
| J1y-CO | Coal (pure) | 2 | 90.00 | 250.00 | |||||
| J1a | 208 | 198 | Sand. (typical) | Reservoir Rock | 0 | ||||
| T3t | 216 | 208 | Shale and Sand. | Source Rock | 7 | 6.00 | 500.00 | ||
| T3h | 235 | 216 | Shale and Sand. | Source Rock | 20 | 10.00 | 500.00 | ||
| T2k | 245 | 235 | Shale and Sand. and Congl. | Underburden Rock | 5 | ||||
| P | 295 | 245 | Congl. and Sand. and Lime. | Underburden Rock | 10 | ||||
| C | 438 | 295 | Sand. and Shale and Lime. | Underburden Rock | 10 | ||||
| Biomarker Ratios | Principle Components (PC) | ||||
|---|---|---|---|---|---|
| PC1 | PC2 | PC3 | PC4 | PC5 | |
| R1 | 0.815 | 0.256 | −0.306 | −0.123 | −0.130 |
| R3 | −0.875 | −0.146 | 0.116 | 0.072 | 0.019 |
| R4 | −0.398 | −0.242 | −0.147 | 0.820 | −0.012 |
| R5 | −0.052 | −0.204 | −0.028 | −0.078 | 0.957 |
| R6 | −0.162 | −0.661 | −0.232 | 0.638 | −0.083 |
| R7 | 0.108 | −0.379 | −0.637 | 0.409 | −0.342 |
| R8 | 0.492 | 0.805 | −0.099 | −0.131 | −0.054 |
| R9 | 0.076 | 0.890 | 0.143 | −0.116 | −0.357 |
| R10 | 0.814 | 0.027 | 0.420 | −0.217 | 0.037 |
| R11 | −0.043 | 0.087 | 0.908 | −0.034 | −0.231 |
| R12 | −0.050 | −0.145 | 0.667 | −0.526 | 0.341 |
| Samples | Wells | Formations | No. | PC1 | PC2 | PC3 | PC4 | PC5 |
|---|---|---|---|---|---|---|---|---|
| Source-1 | YN-2 | J2kz | 1 | −1.522 | −1.525 | −0.153 | 1.043 | 0.772 |
| Source-3 | YN-2 | J2kz | 3 | −0.786 | −1.827 | −0.777 | 0.573 | 0.508 |
| Source-6 | YN-2 | J1y | 6 | 0.570 | −0.978 | 1.362 | −0.244 | −1.106 |
| Source-7 | YN-2 | J1y | 7 | 0.682 | −0.720 | 1.998 | 0.723 | −1.098 |
| Oil-1 | YN-2 | T3t | 8 | −0.494 | −0.710 | −0.086 | −1.414 | 1.031 |
| Oil-2 | YN-2 | T3h | 9 | 0.213 | 0.099 | 0.974 | −0.773 | 1.072 |
| Oil-3 | YN-2 | T3h | 10 | 0.049 | −0.127 | 0.126 | −1.168 | 0.565 |
| Oil-4 | DB-104 | J1y | 11 | 0.766 | 1.498 | −0.520 | −1.161 | −0.089 |
| Oil-5 | DX-1 | J1y | 12 | −0.486 | 1.446 | 0.527 | 0.298 | 2.298 |
| Inclusion-1 | YN-2 | J1y | 13 | −1.507 | 1.294 | 0.504 | 0.081 | −1.082 |
| Inclusion-2 | YS-4 | J1a | 14 | −1.534 | 1.123 | 0.959 | 0.401 | −1.010 |
| Inclusion-3 | DB-5 | J1a | 15 | 0.349 | 0.702 | −0.942 | 1.686 | −0.098 |
| Inclusion-4 | DB-5 | J1y-B | 16 | 1.078 | −0.655 | −0.007 | −1.516 | −0.396 |
| Inclusion-5 | DB-102 | J1y-Y | 17 | 1.745 | 0.233 | −0.405 | 1.473 | 0.175 |
| Inclusion-6 | DB-102 | J1a-B | 18 | 1.423 | 0.171 | −0.168 | 0.823 | 0.529 |
| Inclusion−7 | YN−2 | J1a-B | 19 | −0.148 | −0.180 | −1.710 | −0.183 | −0.835 |
| Inclusion−8 | YS−4 | J1a-B | 20 | −0.400 | 0.156 | −1.682 | −0.644 | −1.236 |
| Formation | Lithology | Type of Organic Matter | TOC (Average) | S1 + S2 (Average) | HI (Average) | Tmax |
|---|---|---|---|---|---|---|
| J2kz | DM | III and II2 | 0.01~2.96 (1.08) | 0.04~6.92 (1.56) | 11.68~79.00 (55.55) | 430~546 |
| J2kz | CM | III | 0.62~33.1 (16.94) | 14.91~76.38 (45.60) | 52.00~54.00 (166.83) | 431~446 |
| J2kz | CO | III | 42.62~53.75 (45.57) | 43.78~71.37 (56.73) | 83.17~161.07 (118.53) | 425~432 |
| J1y | DM | III and II2 | 0.01~15.30 (2.82) | 0.11~42.03 (9.68) | 19.00~901.00 (144.64) | 405~503 |
| J1y | CM | III | 11.13~36.86 (21.83) | 10.04~94.11 (33.10) | 79.00~302.00 (140.44) | 428~443 |
| J1y | CO | III | 21.65~68.23 (37.91) | 17.18~95.49 (43.27) | 70.00~245.00 (141.99) | 435~462 |
| T3t | CM | III | 1.62~2.96 (2.08) | 1.43~10.88 (3.30) | 46.00~278.00 (102.86) | 429~445 |
| T3h | CM | II2 and III | 0.26~7.29 (1.84) | 0.11~88.84 (14.07) | 16.00~189.63 (80.79) | 439~469 |
Disclaimer/Publisher’s Note: The statements, opinions and data contained in all publications are solely those of the individual author(s) and contributor(s) and not of MDPI and/or the editor(s). MDPI and/or the editor(s) disclaim responsibility for any injury to people or property resulting from any ideas, methods, instructions or products referred to in the content. |
© 2025 by the authors. Licensee MDPI, Basel, Switzerland. This article is an open access article distributed under the terms and conditions of the Creative Commons Attribution (CC BY) license (https://creativecommons.org/licenses/by/4.0/).
Share and Cite
Wei, X.; Liu, K.; Yang, X.; Liu, J.; Zhou, L.; Ding, X. Probing Petroleum Sources Using Geochemistry, Multivariate Analysis, and Basin Modeling: A Case Study from the Dibei Gas Field in the Northern Kuqa Foreland Basin, NW China. Appl. Sci. 2025, 15, 2425. https://doi.org/10.3390/app15052425
Wei X, Liu K, Yang X, Liu J, Zhou L, Ding X. Probing Petroleum Sources Using Geochemistry, Multivariate Analysis, and Basin Modeling: A Case Study from the Dibei Gas Field in the Northern Kuqa Foreland Basin, NW China. Applied Sciences. 2025; 15(5):2425. https://doi.org/10.3390/app15052425
Chicago/Turabian StyleWei, Xinzhuo, Keyu Liu, Xianzhang Yang, Jianliang Liu, Lu Zhou, and Xiujian Ding. 2025. "Probing Petroleum Sources Using Geochemistry, Multivariate Analysis, and Basin Modeling: A Case Study from the Dibei Gas Field in the Northern Kuqa Foreland Basin, NW China" Applied Sciences 15, no. 5: 2425. https://doi.org/10.3390/app15052425
APA StyleWei, X., Liu, K., Yang, X., Liu, J., Zhou, L., & Ding, X. (2025). Probing Petroleum Sources Using Geochemistry, Multivariate Analysis, and Basin Modeling: A Case Study from the Dibei Gas Field in the Northern Kuqa Foreland Basin, NW China. Applied Sciences, 15(5), 2425. https://doi.org/10.3390/app15052425