1. Introduction
The global energy crisis, characterized by rising energy demand, resource depletion, and environmental concerns, necessitates a transition towards more sustainable energy sources. Hydropower, as one of the most important and technically mature renewable energy sources that can be developed on a large scale, plays a pivotal role in this transformation and increases sustainable energy generation [
1,
2,
3]. Francis turbines can operate efficiently in a wide range of current and head conditions and are widely used in hydropower power plants as one of the most important baseload generating units for power systems.
Francis turbine units remain the mainstay of hydropower generation worldwide due to their ability to adapt to a wide range of heads and their high efficiency. Their adaptability and reliability have contributed significantly to the global push towards renewable energy. Photovoltaic and wind turbines as the mainstay of new energy have the disadvantage of intermittency and volatility, with power generation output fluctuating according to changes in weather and time. The instability of photovoltaic and wind power requires large hydropower units as a regulating power source to balance the grid and ensure the stability and reliability of the power supply. In order to cope with load fluctuations after a huge amount of photovoltaic and wind power is connected to the grid, hydropower units, especially large Francis turbines, are required to operate in the load range to balance the grid and ensure the stability and reliability of the power supply.
Changes in electricity consumption lead to continuous fluctuations in the load demand on the grid for hydroelectric power plants throughout the day. The hydropower units in the power plants must operate frequently under a broad range of loads under off-design operating conditions in order to meet the power grid’s requirements for absorbing new energy sources, such as photovoltaic and wind power. This has resulted in severe issues with the turbine runners and has drastically altered the operating characteristics of the units [
4,
5]. Francis turbine runners are susceptible to unstable flow when they operate under off-design conditions for an extended period. This can result in intense vibrations in the runner blades and a reduction in power generation efficiency [
6,
7]. Francis turbines can experience flow-induced cracks and damage in severe instances [
8,
9,
10].
Figure 1 shows damage to the runner blade of a large prototype Francis turbine.
Scholars worldwide have conducted a large number of in-depth studies on the unsteady flow characteristics of Francis turbines when they are operated outside of their rated operating conditions. The flow distribution in the Francis runner flow channel under partial loads is irregular, causing cavitation on the runner blades. Cavitation erosion decreases turbine performance, increases hydraulic losses, and causes material loss on the runner blades [
12,
13]. The runner blades of Francis turbines may develop pits and cracks as a result of prolonged cavitation erosion [
14,
15]. The time- and frequency-domain properties in the vaneless region of Francis units under various load conditions were monitored and simulated [
16].
At part-load conditions, the Francis turbine unit can experience draft tube pressure pulsations, leading to severe hydraulic vibrations in the Francis turbine unit and threatening its stability [
17,
18]. Experimental and numerical studies of swirling flow and flow instability in Francis turbines under different loads have been carried out to capture the transient rotating flow characteristics in the draft tube [
19]. Through the Francis turbine model test, it is possible to directly observe the complex flow characteristics of the draft tube vortex ropes under different operating conditions [
20].
The physical mechanisms of unsteady flow and flow-induced structural vibration and stress in Francis turbine units under different operating conditions can be further elucidated by performing field measurements of pressure pulsation and stress on a prototype Francis runner [
19,
21,
22]. To gain a deeper understanding of the prototype unit’s vibration mechanism underwater, the vibration measurements of a simplified hydraulic turbine model have been carried out using novel distributed fiber optic sensing technology to monitor vibrations and stresses [
23]. The underwater structural vibrations of Francis turbine runners were measured and simulated to evaluate the model behavior of the runners considering the added-mass effects of the surrounding water [
24]. Studies involving field measurements and numerical simulations have shown that unsteady flow-induced stresses in Francis runners are closely related to pressure pulsation levels, rotational speed, and the geometric configuration of the turbine [
25].
According to the results of a study into the runner blade breakdown of a 200 MW Francis turbine, cavitation damage from operations at low part loads combined with severe high-cycle fatigue caused the blade to crack [
26]. Another investigation discovered that cracks on the runner blades of a prototype Francis turbine were produced by operating load conditions deviating from the rated condition [
10]. Some Francis units may also be damaged as a result of excessive dynamic stresses within the runner and flow-induced structural resonance under off-design conditions [
8]. According to some experts, the Francis runner’s blades cracked because of the uneven weld surface, which was exacerbated by the weld filler material’s hydrogen embrittlement [
9]. The development of cracks in Francis turbine runners is a complicated issue that is impacted by several variables. One of the most frequent conclusions is that turbulence, particularly in off-design operating conditions, is a major factor in causing these cracks, even though the precise causes may differ.
Many researchers have studied the flow dynamics and structural vibration of Francis turbine runners by computational fluid dynamics (CFD), finite element method (FEM) and field measurements, respectively. However, the research for the comprehensive analysis of large prototype Francis turbines with full three-dimensional fluid–structure interaction (FSI) methods is still relatively limited [
27]. In order to capture the flow-induced dynamic behavior more accurately and to avoid serious flow-induced damage in Francis turbines, the flow-induced strength analysis of a 183 MW prototype Francis turbine is carried out in this study following the workflow shown in
Figure 2.
First, a geometrical model of the Francis turbine unit’s fluid and structural domains is created. Second, three operating loads are chosen to perform the CFD analysis of the Francis turbine unit’s entire flow passage in order to thoroughly examine the pressure distribution and the flow distribution characteristics: 33.3%, 66.6%, and 100% of the rated power. Ultimately, the finite element model of the Francis runner is mapped with the pressure data calculated from the CFD analysis, and an in-depth investigation of the runner’s stress distribution is conducted.
3. Specifications of the Francis Turbine Unit and Investigated Operating Conditions
The hydropower plant of this study has six large-scale Francis turbine generation units, each rated at 183 MW. The turbine units’ rated head and maximum head are 68 m and 80 m. The rated discharge and the rotating speed of the turbine are 294
and 100 rpm, respectively. The Francis turbine unit has 20 stay vanes and 20 guide vanes, and the turbine runner has 13 blades. The rotating direction of the turbine runner is clockwise in the top view. The parameter specifications of the Francis turbine unit are listed in
Table 1.
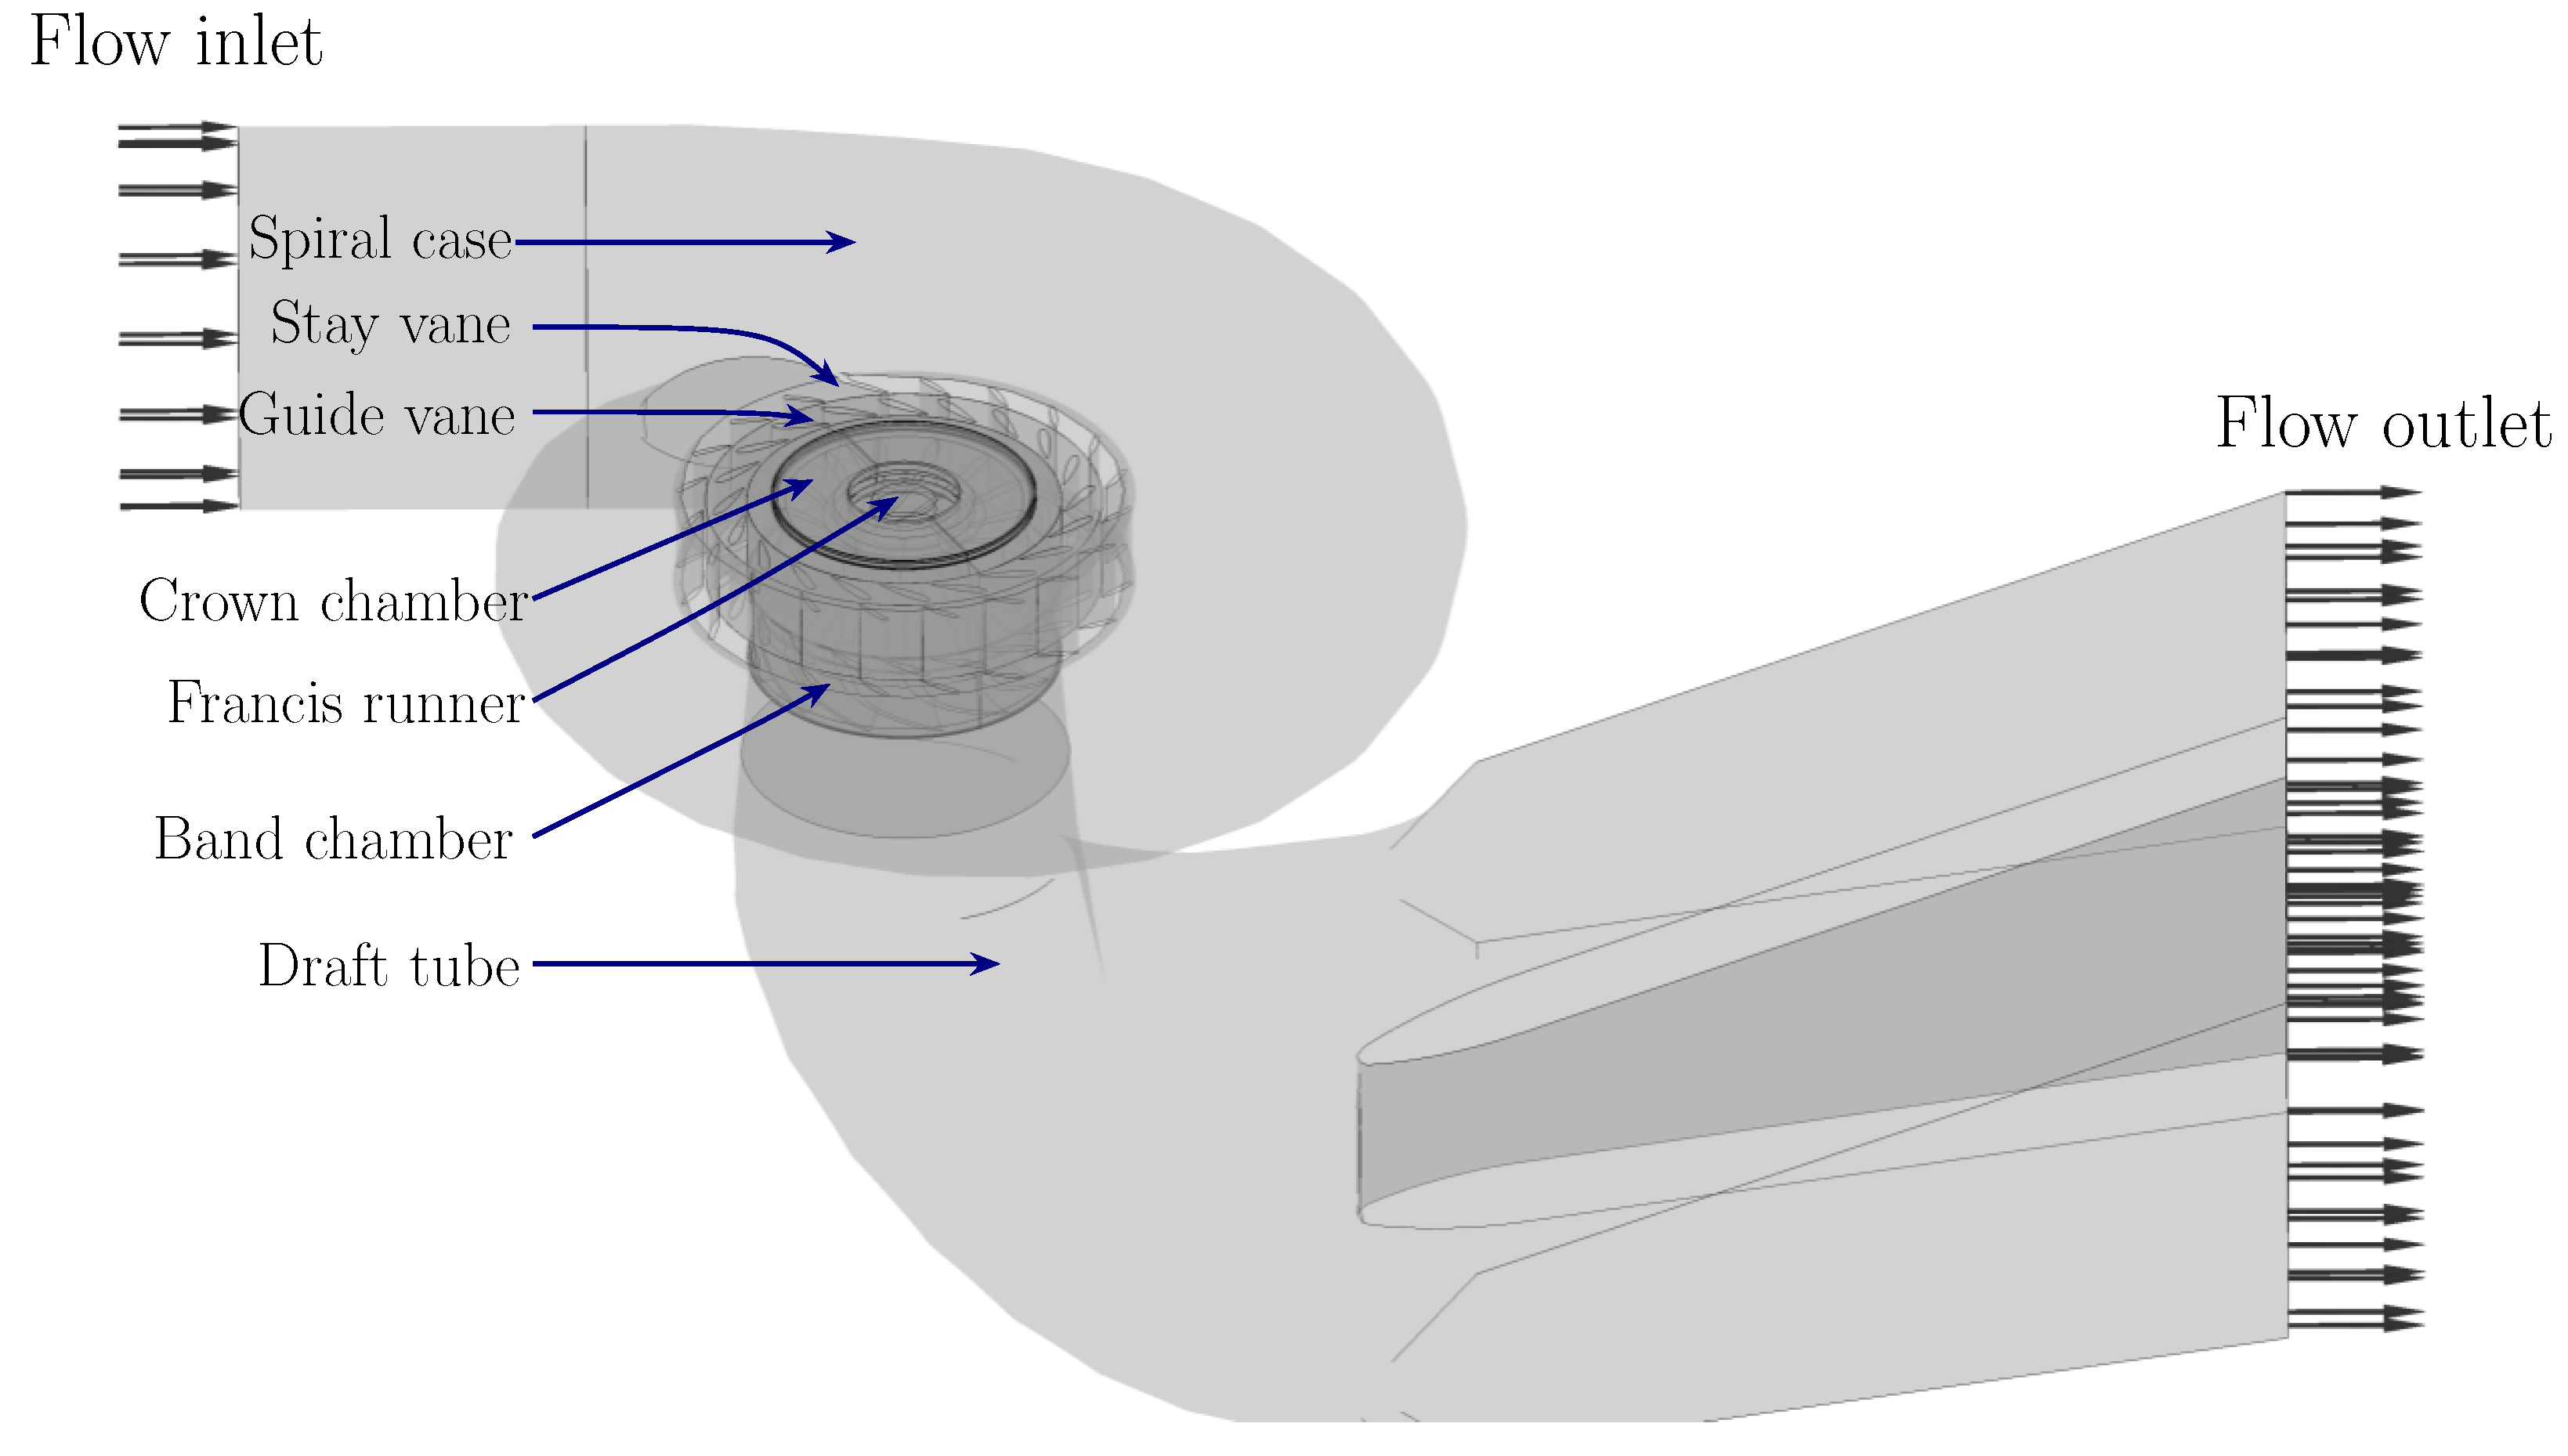
The three-dimensional geometrical model of the water passage of the Francis turbine prototype is shown in
Figure 3. The inlet and outlet of the turbine flow passages are also illustrated in the figure. The spiral case is the Francis turbine unit’s flow intake structure, and its spiral design helps to maintain an even distribution of flow velocity and pressure, thereby minimizing energy loss as the water enters the stay vane flow passage. Stay vanes within the stay ring, positioned radially between the spiral case and the guide vanes, provide structural support to the spiral case and other structures of the turbine unit. The guide vanes can be adjusted in their opening angle to regulate water flow and finely control the power output on the turbine. The Francis runner is the core component of the turbine. When the water flows through the Francis runner, its potential and kinetic energy are converted into the mechanical energy of the rotor system. The draft tube, located at the outlet of the runner, discharges water from the runner to the downstream and converts the remaining kinetic energy of water exiting the runner into pressure energy. This increases the overall efficiency of the turbine by reducing energy losses. The water in the crown chamber and band chamber between the runner and the surrounding stationary structures balances the pressure and thrust of the runner. Labyrinth seals in the crown and belt chambers help to reduce water leakage of the runner passage.
The power plant operation statistics show that the Francis turbine units often operate at 74 m, close to the maximum head. To meet the requirements of the grid load regulation, the turbine units of the power plant have to operate under off-design operating conditions for a long period and even extend their operation to the low load zone. In this study, three operating conditions of 33.3%, 66.6%, and 100% of the rated power are adopted for the CFD simulation and subsequent flow-induced strength analysis. The operating parameters of the selected operating conditions are analyzed based on site measurements (
Table 2).
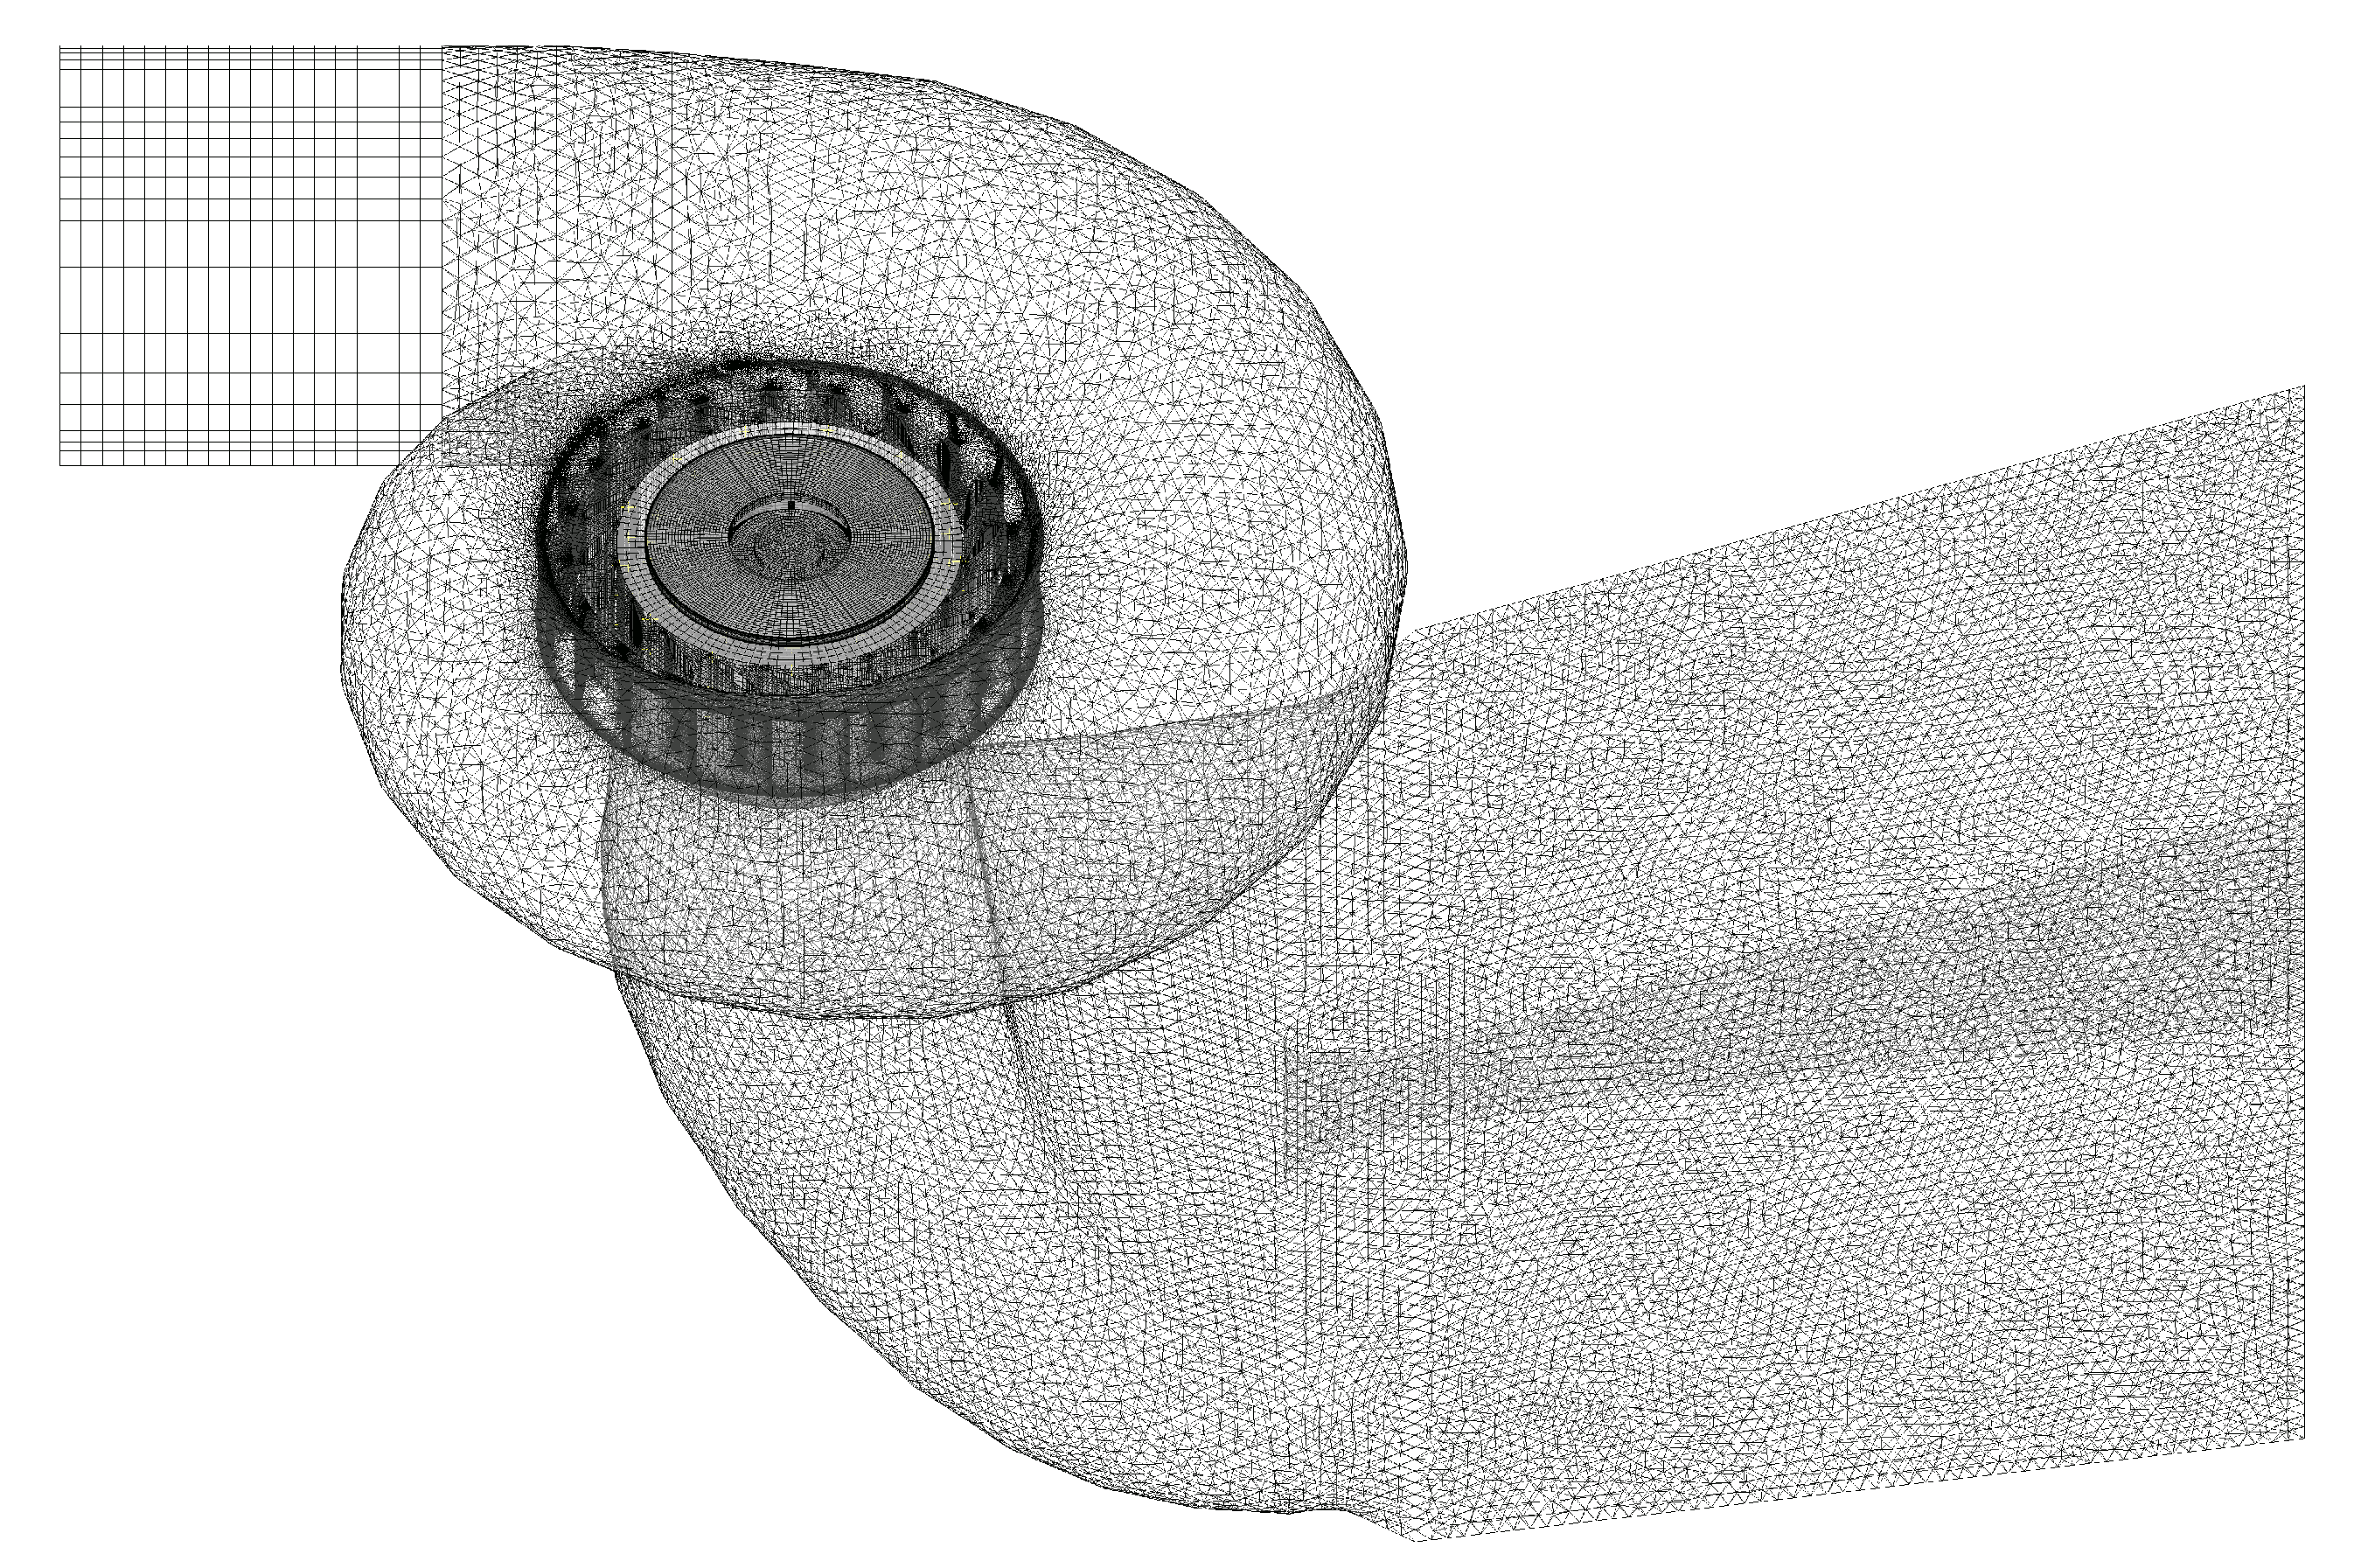
To perform the CFD simulation of the turbine unit, the fluid domain computational model of the Francis turbine is generated with high-quality tetrahedral and hexahedral meshes. The meshes near the structure wall surfaces of key flow domains such as runner blades and guide vanes are refined. There are five mesh layers near the wall surfaces, with the first mesh height of 0.1 mm and an expansion ratio of 1.2. Three groups of meshes are generated for the fluid domain of the Francis turbine unit, with 7.3 million, 14.2 million, and 25.8 million elements, respectively, and the mesh sensitivity assessment is performed to ensure the reliability and convergence of the calculation results. The deviation of the power output of the Francis turbine at 100% of load calculated by the first mesh group from the target 183
is around 10%, which cannot be used. The power output of the second and third mesh groups is close to the measured power onsite. However, the simulation time with the third mesh group is much longer than that with the second mesh group. According to the computing resources and requirements, the second mesh group with 14.2 million elements is selected to ensure a reasonable balance between calculation accuracy and efficiency (
Table 3).
The meshes of different fluid domains including the spiral case, stay vanes, guide vanes, Francis runner, crow and band chambers, and draft tube of the turbine unit, and the entire fluid domain of the turbine unit are presented in
Figure 4 and
Figure 5.
The flow domains of the spiral case, stay vane, guide vane, draft tube, and crown and band chambers are set up in the stationary frame, and the runner flow domain is located in the rotating frame with the rated rotating speed of 100 rpm, which allows to simulate the centrifugal and Coriolis forces and other rotational effects on the fluid flow. Interface surfaces are specified between the runner fluid domain and adjacent fluid domains to transfer data between the rotating frame and the stationary frame.
The spiral case inlet and the draft tub outlet are defined with the field-measured flow discharge and static pressure values from site campaigns in the power plant. All surfaces of the fluid domain connected to the turbine unit structures are designated as no-slip walls. Automatic wall treatment is selected for the wall surfaces. The total physical time in the simulation is set to 3.6 s, corresponding to 10 rotation revolutions for the Francis runner, and the residual threshold of the CFD simulations is specified as . It can ensure the convergence of the CFD simulation and avoid unnecessary calculation overhead caused by an excessively long calculation time. Finally, 720 steps per revolution is set up to fully capture the complex turbulent flow in the turbine flow domains.
4. Results and Discussions of Flow-Induced Strength Analysis
4.1. Flow Pressure Distributions and Velocity Distributions of the Francis Turbine Unit
Under three different operating loads of 33.3%, 66.6%, and 100% of the rated power, the simulation results of the power output of the Francis turbine approach the measured ones, which verifies the reliability of the CFD calculation results. In order to better compare the calculation results of the Francis turbine under different operating conditions, the pressure and velocity of the turbine in this study are normalized according to the flowing formulae:
where
g is the acceleration of gravity,
H is the operating head of the Francis turbine unit, and
is the maximum velocity value of the three load cases.
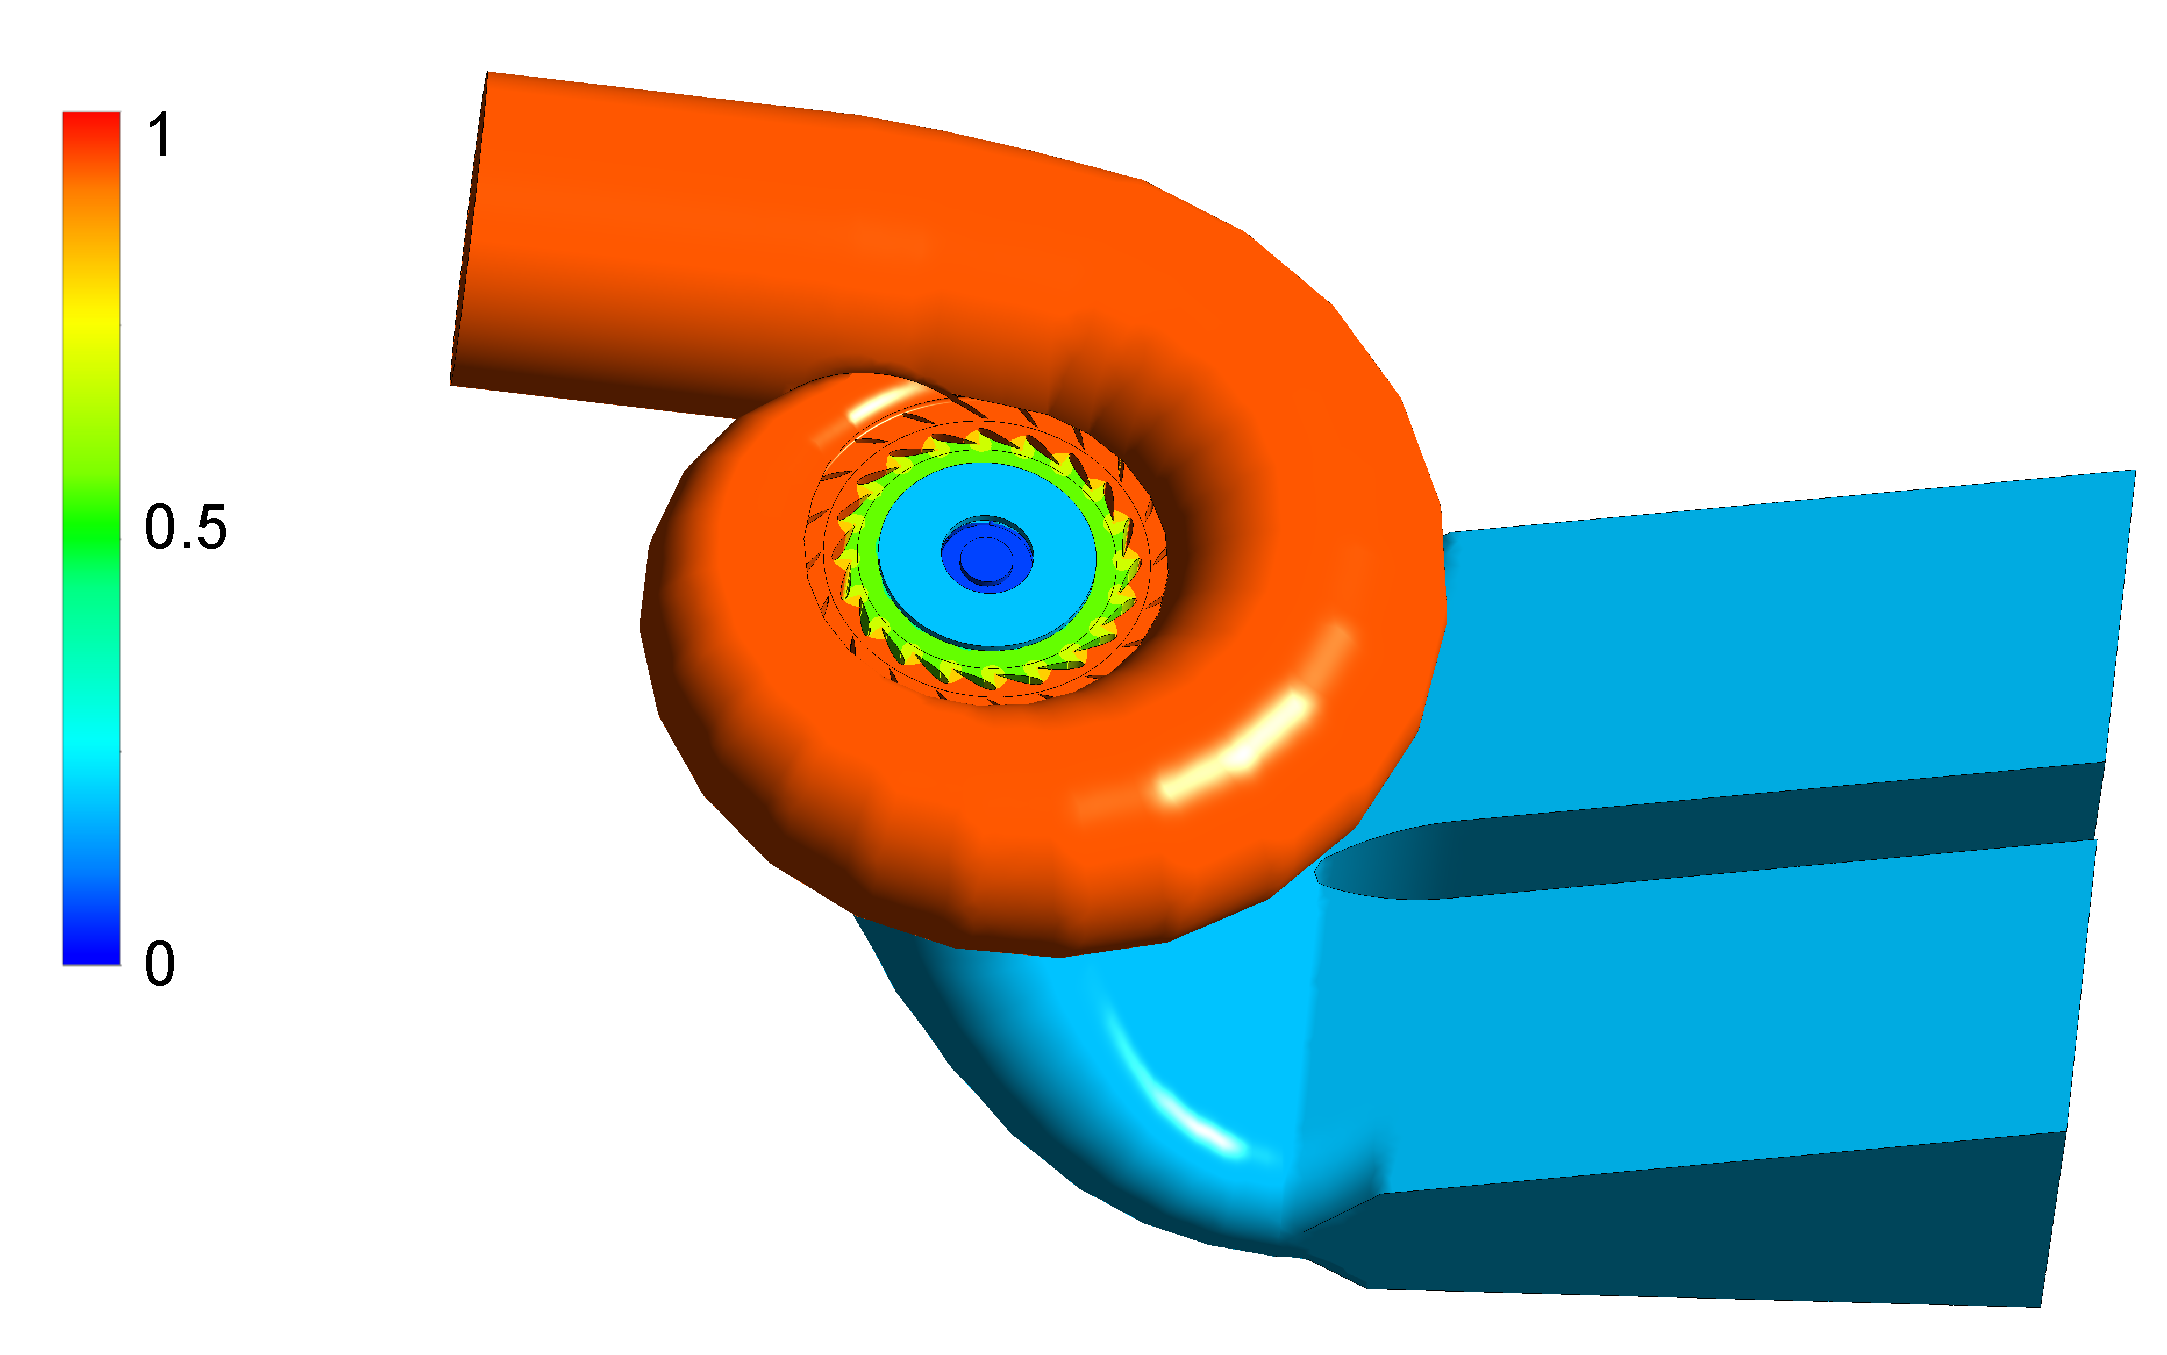
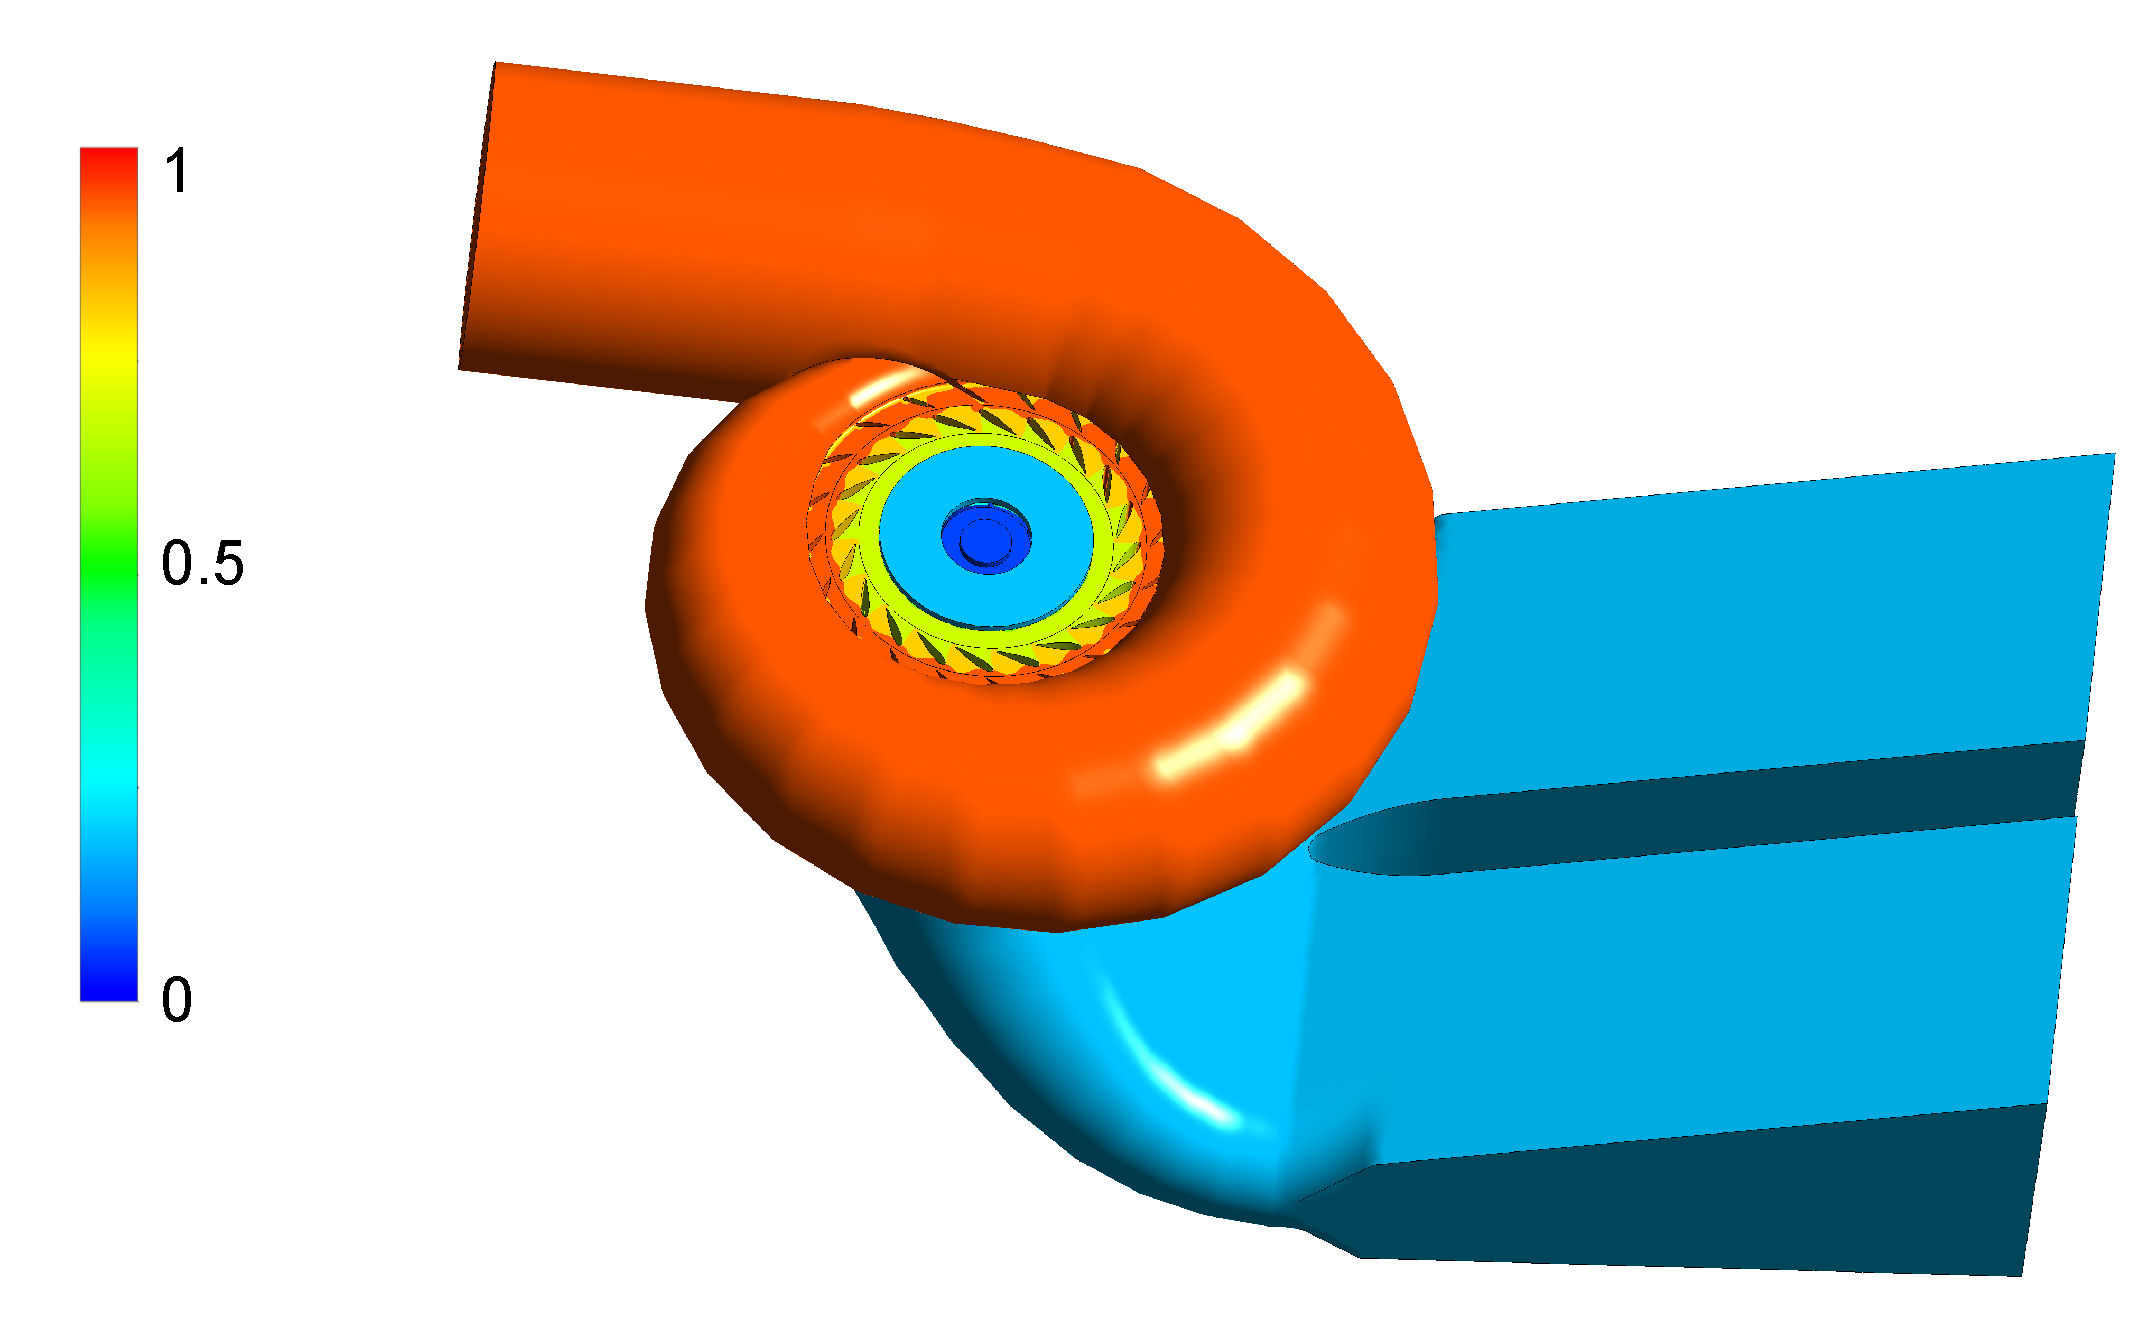
The normalized pressure distribution in the flow domain of the Francis turbine unit at three different operating conditions, 33.3%, 66.6%, and 100% of the rated power, are demonstrated in
Figure 6,
Figure 7 and
Figure 8, respectively.
The results reveal that at 33.3%, 66.6%, and 100% loads of the rated power, the pressure of the Francis turbine flow domains decreases from the spiral case to the draft tube in general. The pressure in the spiral case is the highest in the flow domain, where the hydraulic energy is dominated by pressure energy. In the runner flow domain, the pressure drops significantly across the runner due to the pressure energy being transferred from the fluid to the rotating blades as kinetic energy. After the runner runner outlet, the fluid flows into the draft tube, which acts as a diffuser to recover part of the kinetic energy into pressure energy. The pressure in the draft tube is the lowest in the entire flow passages of the Francis turbine unit.
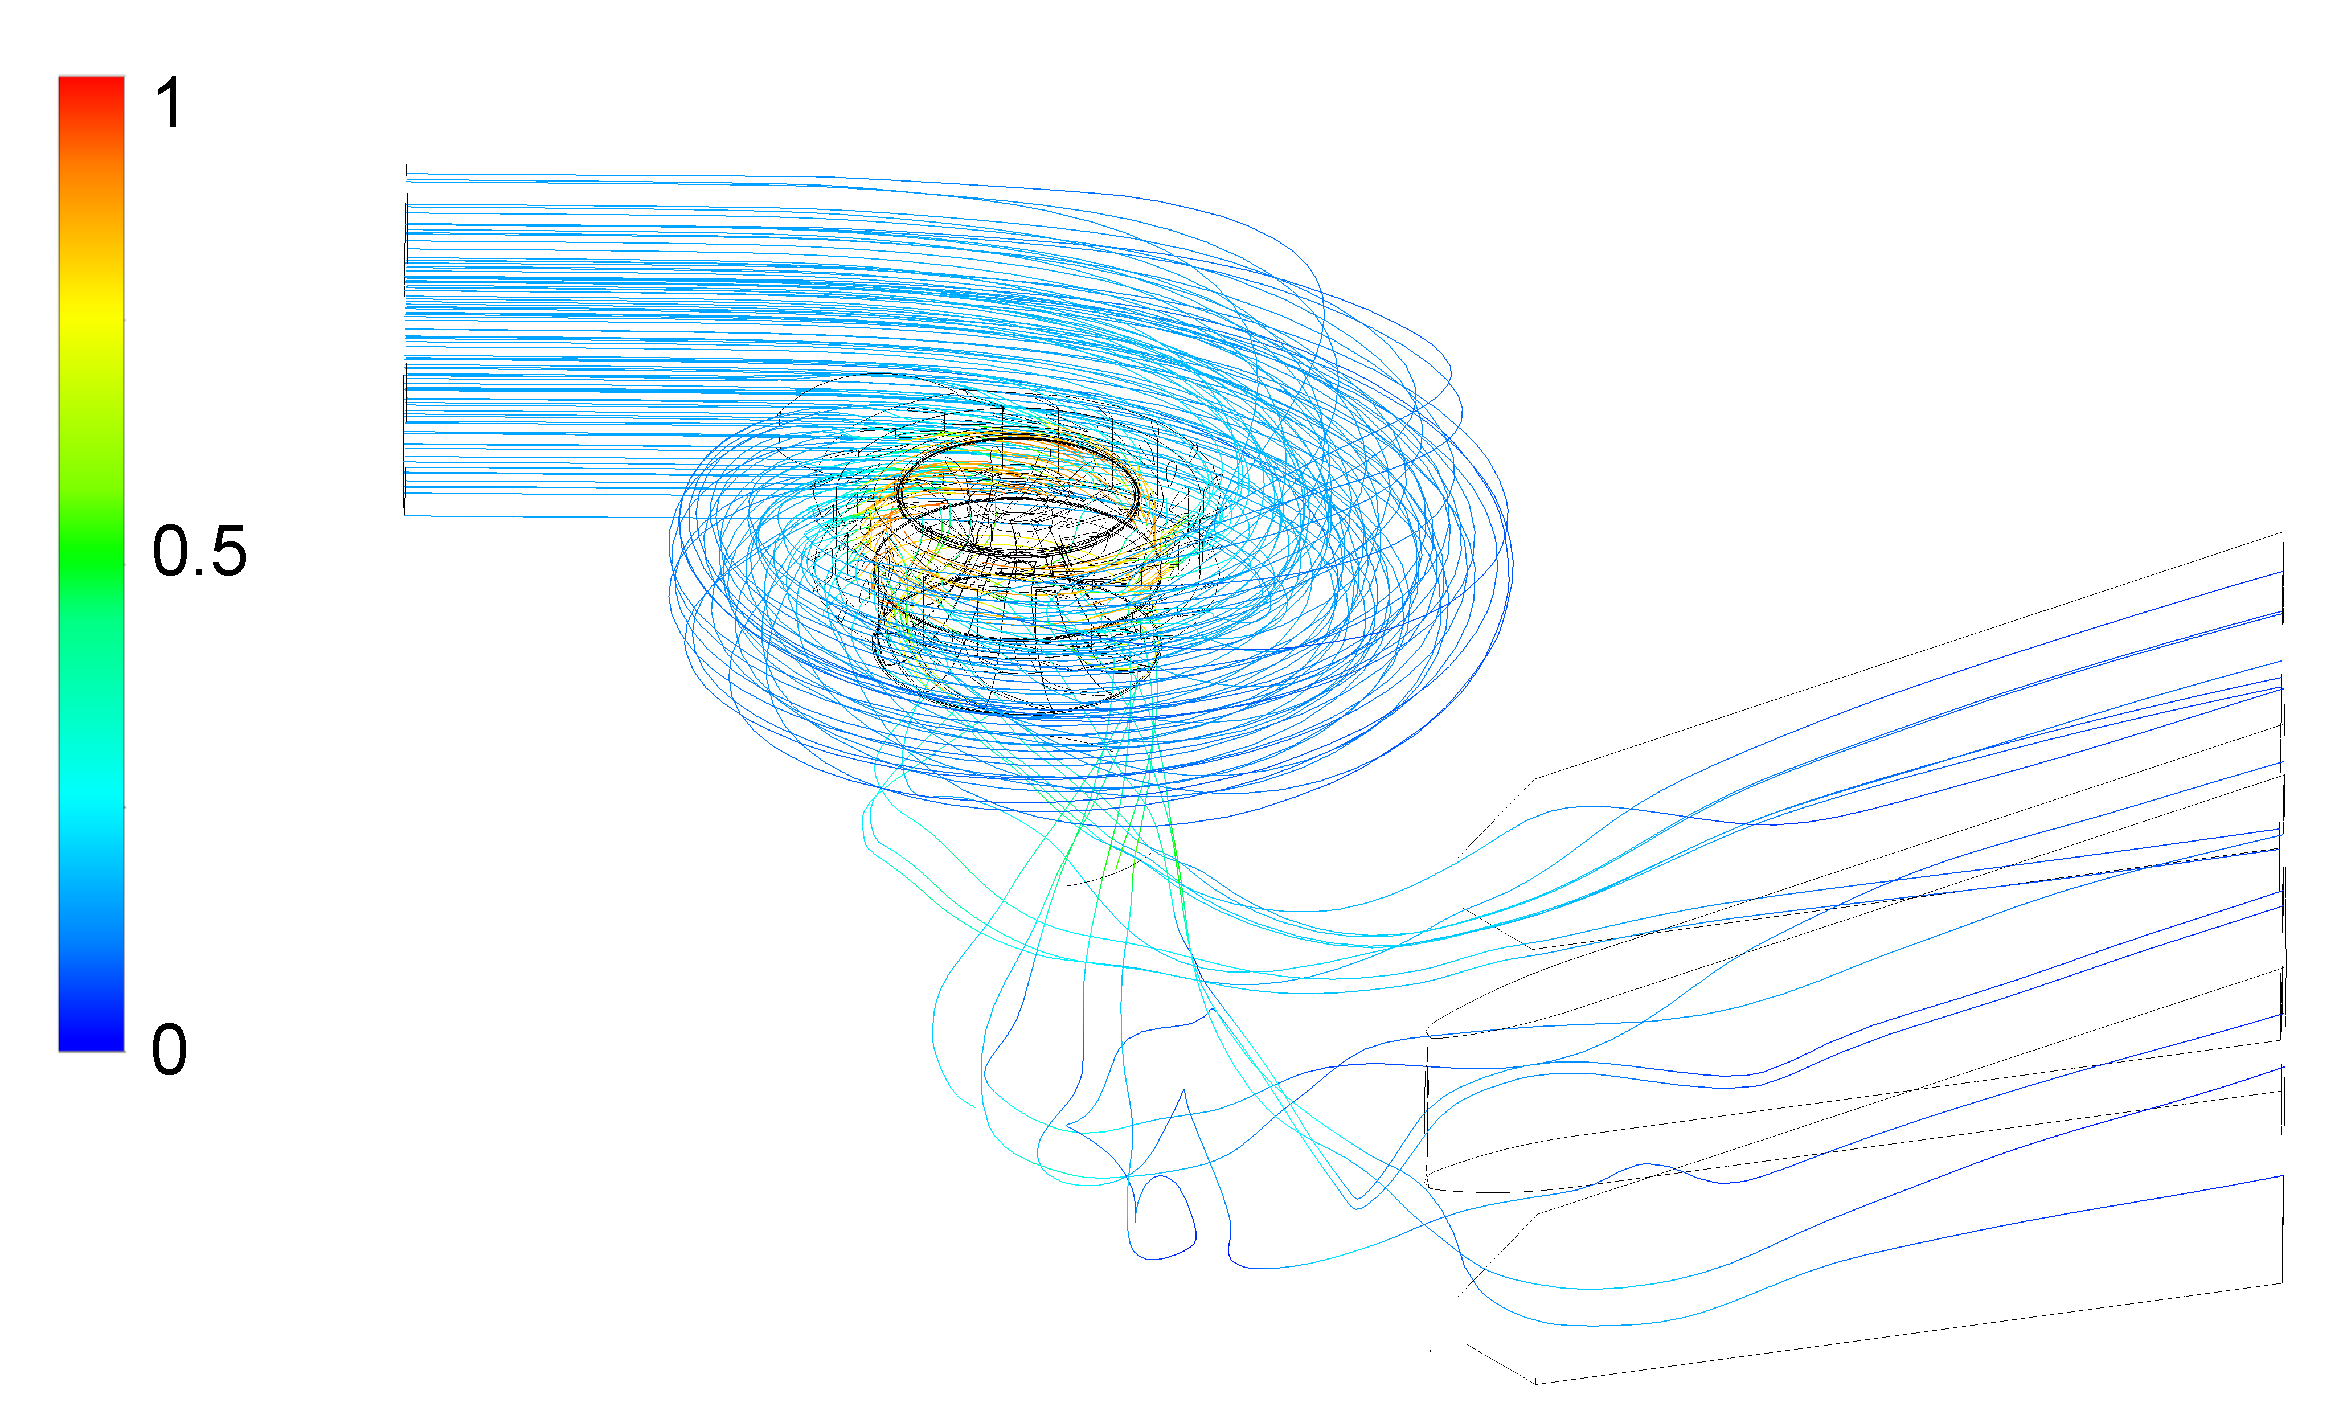
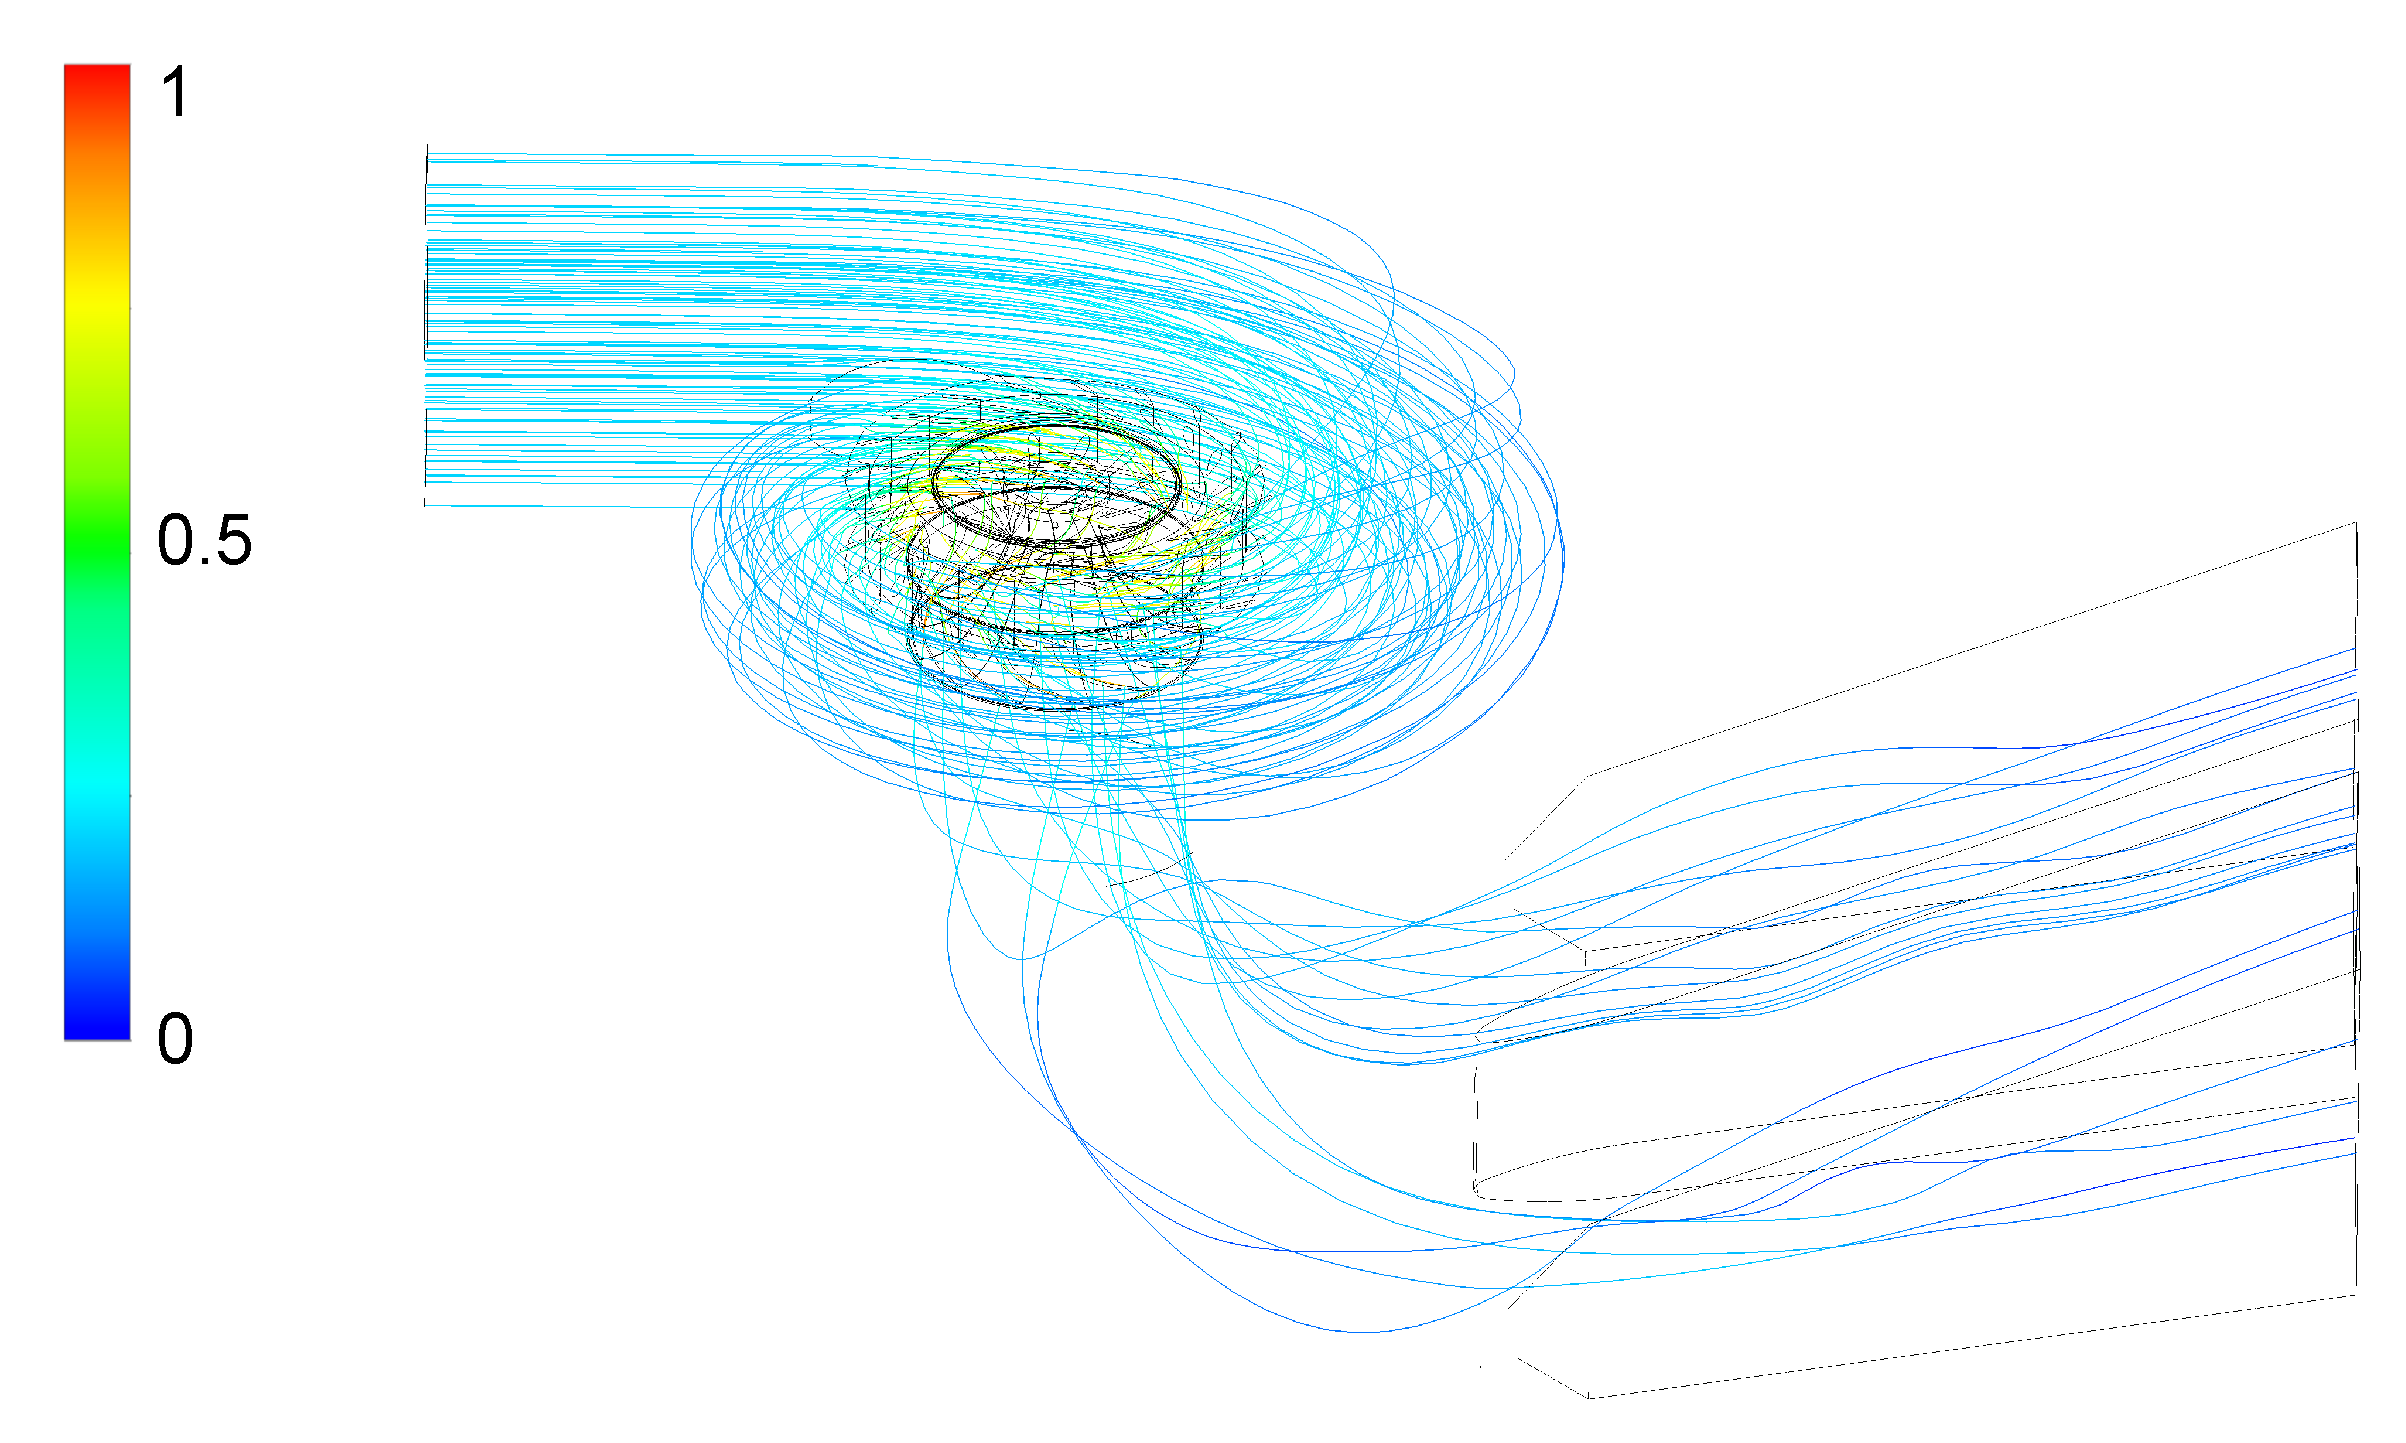
Under various loads, the flow rate and flow direction of the water entering the runner can be controlled by adjusting the guide vane openings. Since the guide vane opening angles are significantly different at the three loads, the local pressure distributions in the guide vane domains also vary with each other. At a 33.3% rated power load, the guide vane opening is relatively small, and the water flow is ejected to the runner blade fluid channels from the narrow gaps between adjacent guide vanes. There is a significant difference in pressure between the upstream and downstream of the guide vanes. The pressure upstream of the guide vane is higher, and the pressure downstream of the guide vane is lower. With the guide vane opening increases at a 66.6% rated power load, the discharge increases accordingly to generate more power. And the pressure level of the flow between the guide vanes increases. At a 100% rated power load, the guide vanes are fully opened, and the pressure gradually decreases from the spiral case toward the guide vane outlet. The pressure gradient in the guide vane region is less than that at 33.3% and 66.6% loads of rated power. The normalized flow velocity distributions of the Francis turbine flow domain at 33.3%, 66.6%, and 100% loads of rated power are shown in
Figure 9,
Figure 10 and
Figure 11, respectively.
The flow streamlines of the Francis turbine under different operating conditions from 33.3% to 100% of the rated power load have obvious differences. At the 33.3% rated power load, the flow in the spiral case is relatively stable, but the flow between guide vanes and in the vaneless region is obviously irregular. Due to the small opening of the guide vanes and the narrow water flow passages in between, the fluid velocity increases when passing through the gap between adjacent guide vanes, forming a high shear zone with high speed locally. The fluid streamline distribution in the draft tube is disordered and asymmetric with obvious vortex and backflow. The loss of fluid kinetic energy increases, resulting in a reduction in turbine efficiency. At the 66.6% rated power load, the flow in the spiral case remains stable. With a large guide vane opening, the flow in the guide vane flow domain and the runner flow domain is improved. The streamlines gradually become regular and the flow velocity of the high speed ring in the vaneless region is decreased. In the runner blade flow channel, the streamlines are relatively smooth, and the energy transfer is more efficient. The streamline distribution is more regular than that at the 33.3% rated power load, and the vortex and backflow are weakened but not completely eliminated.
When the power output reaches 100% of the rated power load, the flow streamlines of the turbine flow passage are distributed more regularly, and the energy transfer is the highest. The flow velocity distribution in the spiral case is very uniform and provides stable inflow conditions to the guide vane region. The flow lines are distributed regularly among the guide vanes, and the water gradually accelerates as it passes through the guide vanes, forming a uniform flow field into the runner flow domain. The high-speed ring in the vaneless region disappears. The streamlines flow smoothly along the blade surface inside the Francis runner without obvious separation or turbulence, and the kinetic energy is gradually converted into mechanical energy. The streamlines in the draft tube are of high regularity. The flow velocity decreases evenly, and backflow and vortex phenomena are almost disappeared. At the 100% rated power load, the flow distributions in all flow domains are optimized to the best state, and the turbine efficiency and stability reach the highest level.
4.2. Flow-Induced Strength Analysis of the Francis Runner
In order to evaluate the strength of the Francis runner under three different operating conditions, the flow-induced strength analysis of the runner needs to be performed by combining the above CFD simulations with finite element analysis (FEA). The data of the pressure distributions on the runner at 33.3%, 66.6%, and 100% loads of rated power can be exported from the CFD analysis performed in the previous section and mapped on the finite element of the Francis runner as surface loads.
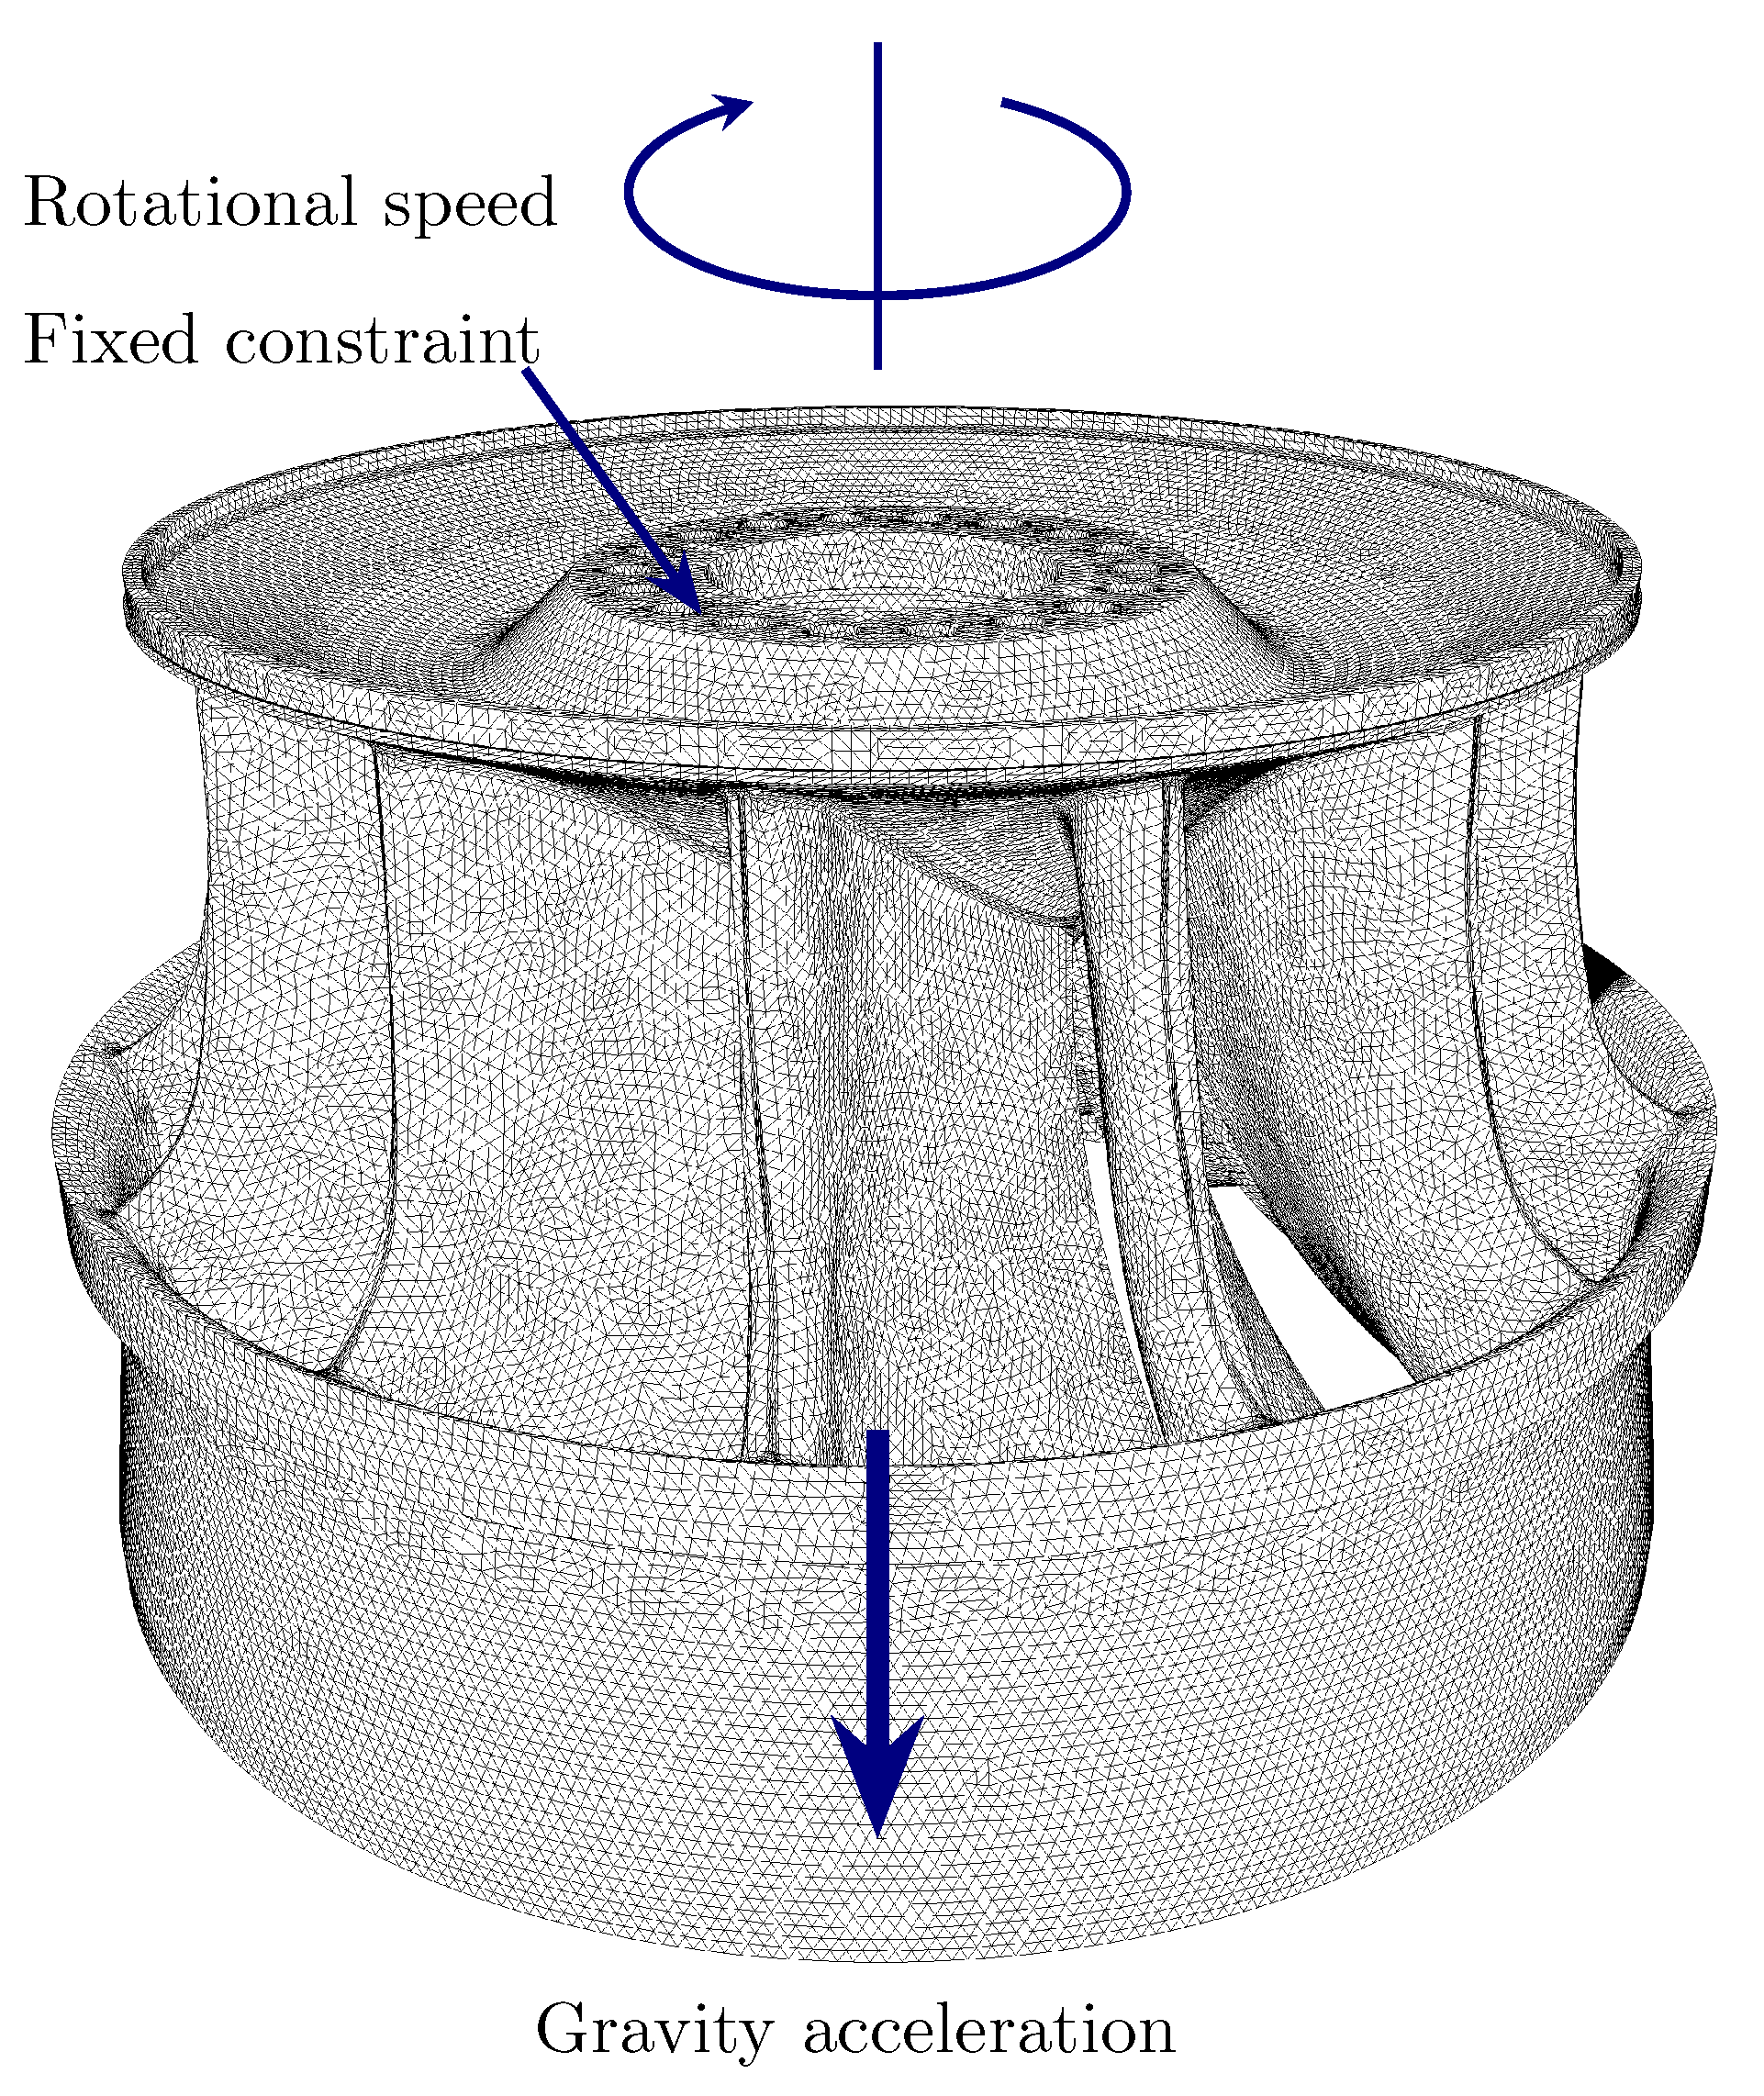
High-quality tetrahedral elements are used to create the Francis runner’s finite element model (
Figure 12). The Francis turbine runner blades’ geometrical curvature varies significantly, particularly at the fillets, which are likely to become locations of concentrated stress. To accurately record the stress values, the mesh at the runner blades’ fillets is improved and refined. The Francis runner is subjected to the boundary conditions, which include the fixed restrictions, rotating speed, and gravity acceleration.
The Francis runner in this study is made of stainless steel, and the material parameters of the runner are summarized in
Table 4 and include a density of 7700
, a Young’s modulus of
, a Poisson’s ratio of 0.3, and a yield stress of 550 MPa. This value of yield stress ensures that the Francis runner can withstand operational loads under normal and transient conditions without permanent deformation.
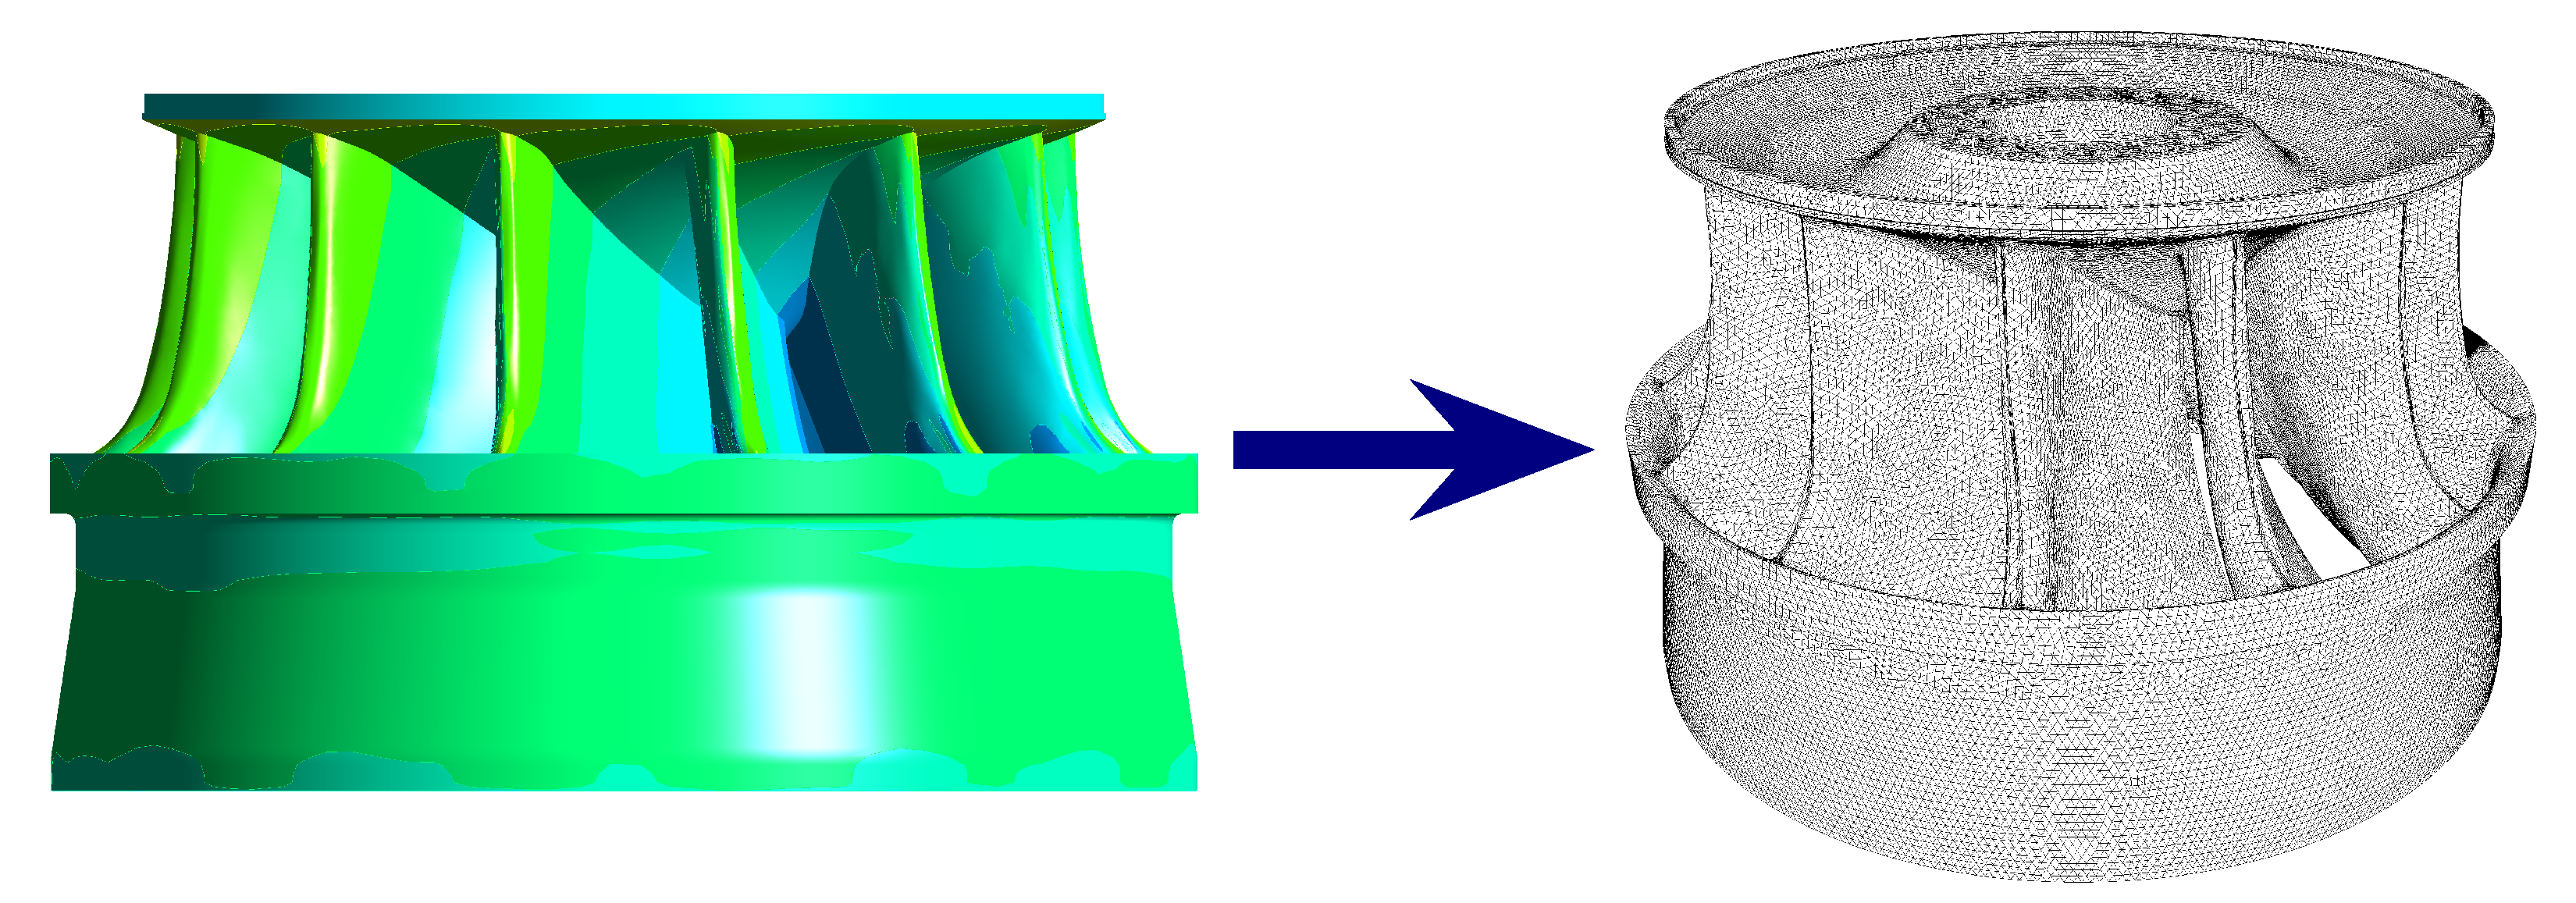
The pressure files across the entire flow passage of the Francis turbine unit at three different loads can be exported from the CFD analysis discussed in the previous section. This CFD-derived pressure data can then be accurately mapped onto the nodes of the finite element model to facilitate the subsequent flow-induced structural stress analysis (
Figure 13).
As shown in
Figure 14, the maximum stresses of the runner at 33.3%, 66.6%, and 100% loads of rated power are located in the fillets between the blade trailing edge and the crown.
When the Francis runner is running stably at a rated speed, its load is determined by the hydraulic torque acting on the runner. As the load of the Francis unit increases, the opening of the unit’s guide vanes increases accordingly; therefore, the water flow entering the runner flow passage and the runner hydraulic torque increases. Eventually, the value of the runner hydraulic torque is equal to the value of the counter load torque on the turbine shaft so that a new torque equilibrium is formed in the Francis turbine unit. As shown in
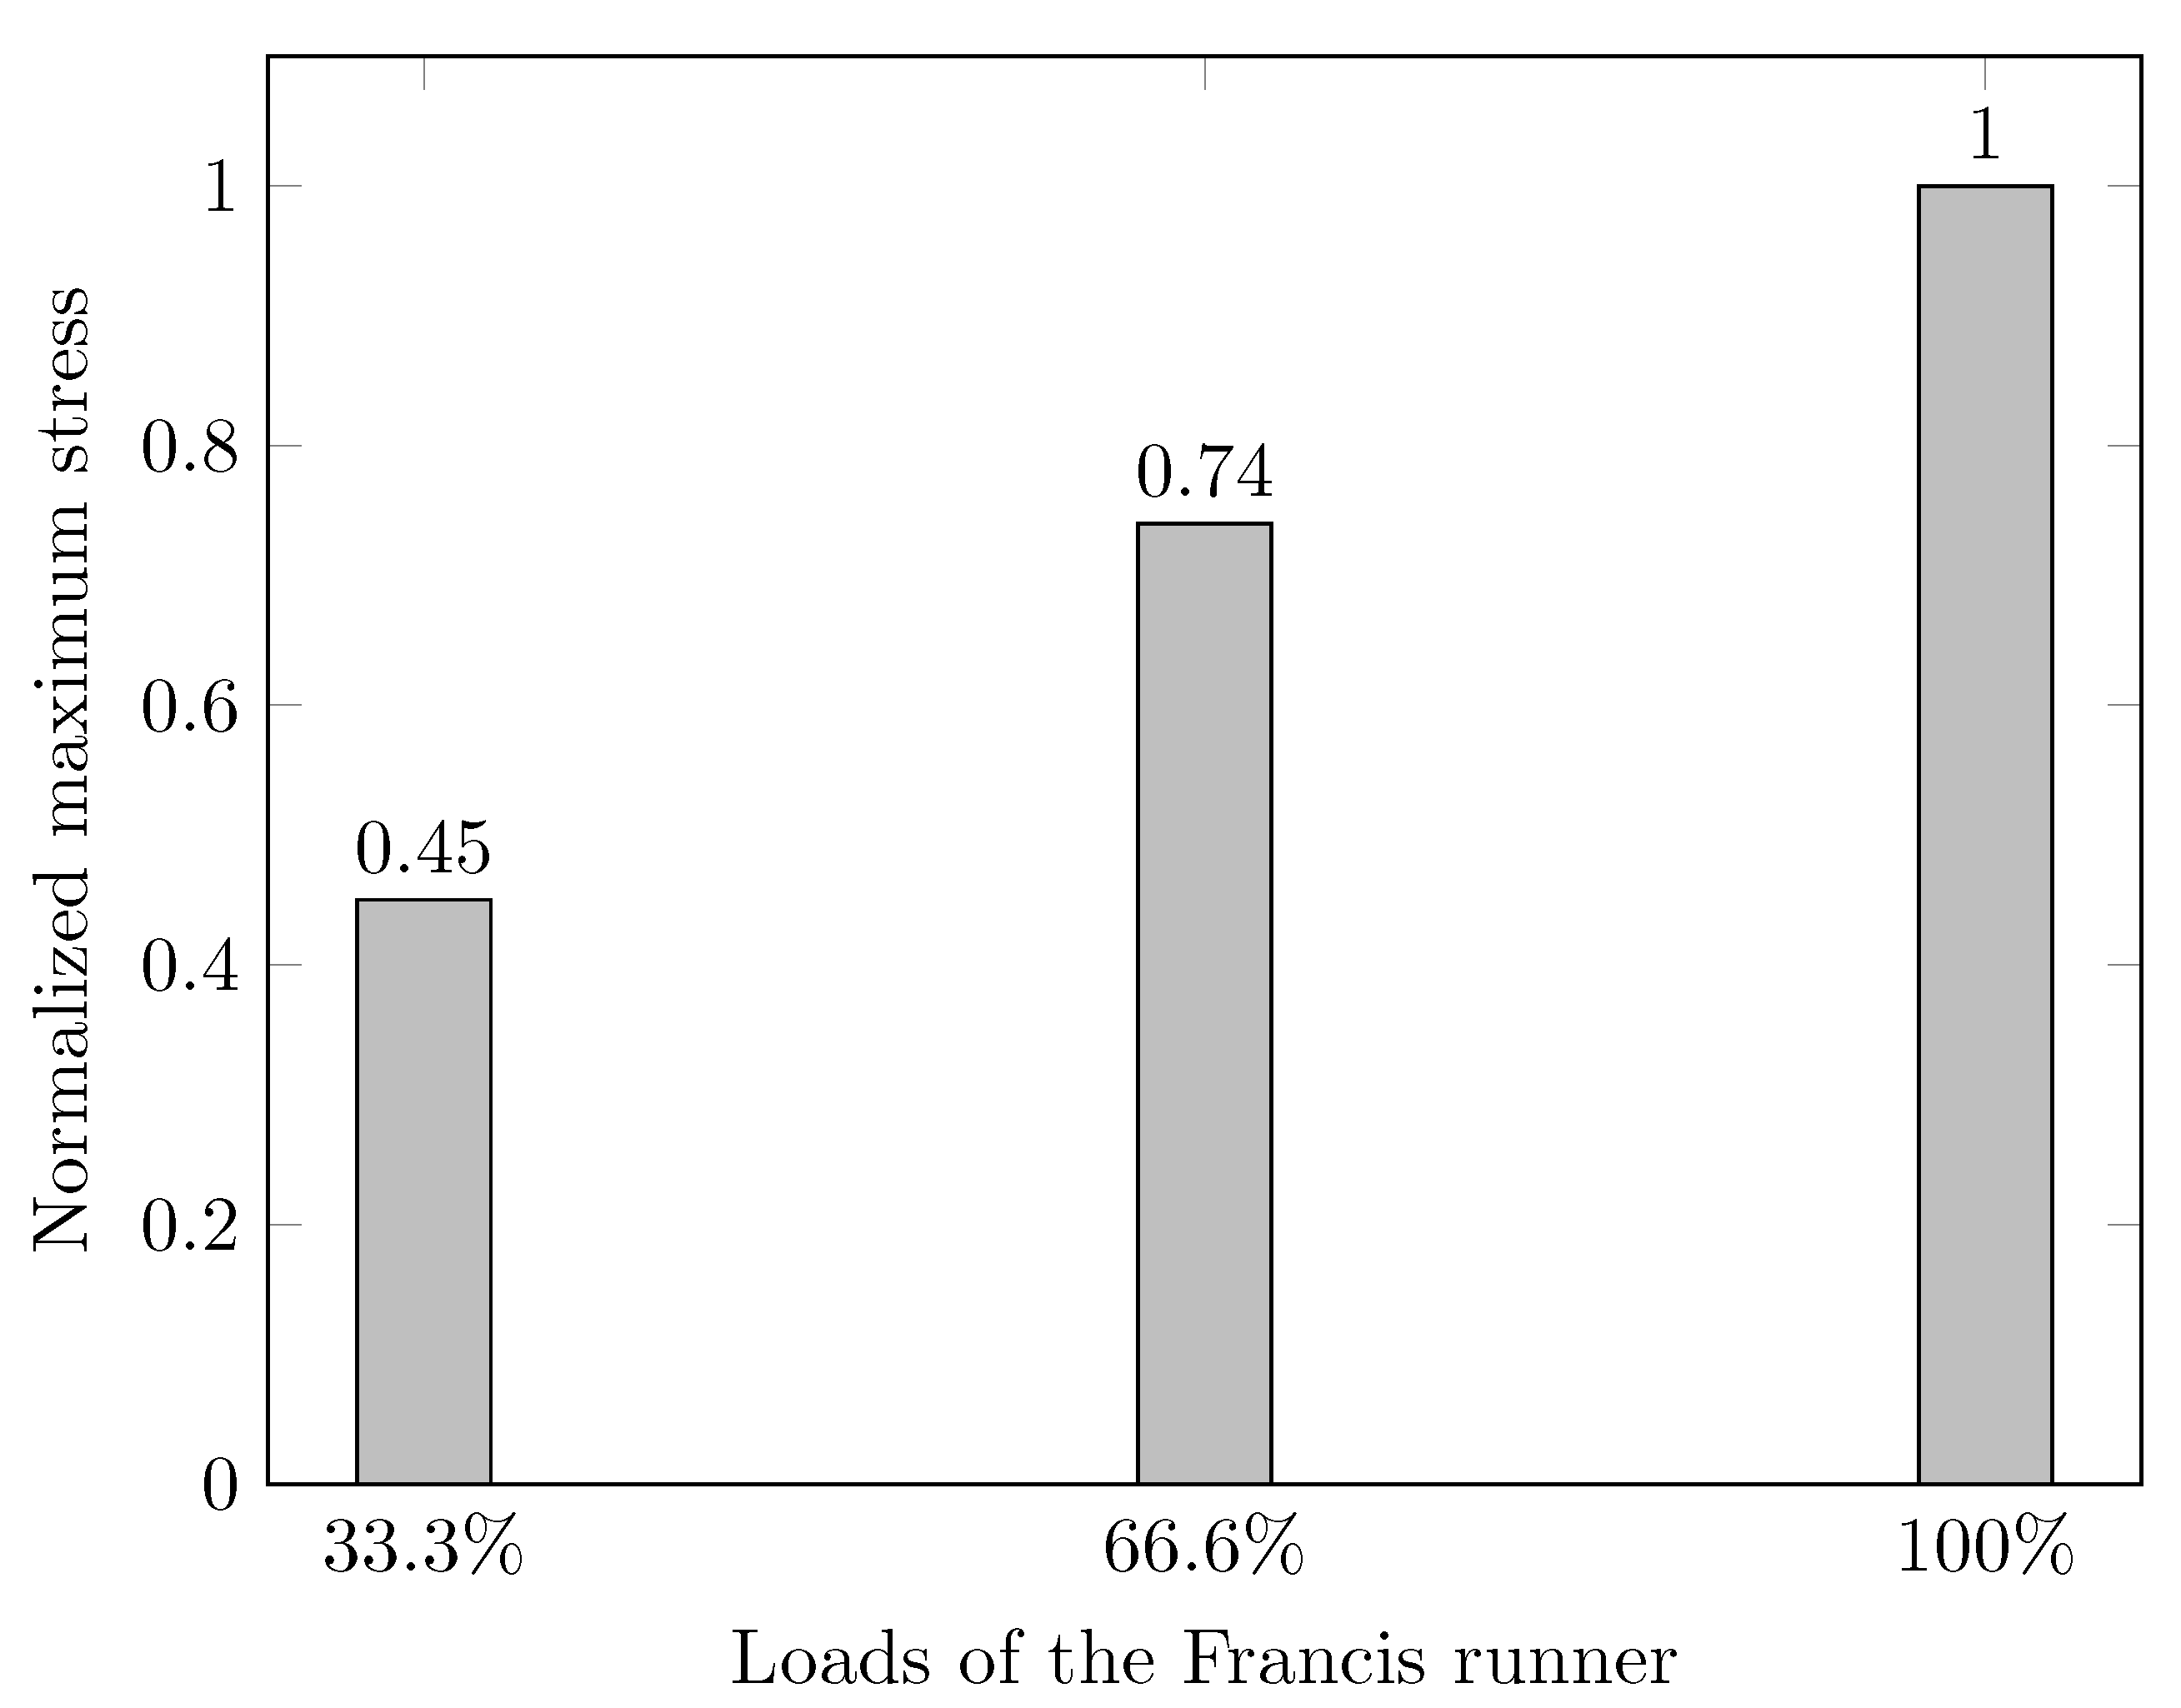
Figure 15, the maximum stress of the runner gradually increases with the power from 33.3% to 100% of the rated power load.
As the hydraulic torque on each runner blade increases with the load, the flow-induced stress of the runner blades also increases accordingly. The maximum stress values of the runner at the 33.3% rated power load and the 66.6% rated power load are 0.45 and 0.74 times the stress at the 100% rated power load, which is around 1/3 of the yield stress of runner material. Therefore, the runner is safe during the extended operation range from 33.3% to 100% of the rated power load. As the service life of the Francis turbine increases, the performance of the materials used in the turbine runner may degrade, especially for materials that are susceptible to cavitation erosion or corrosion. To ensure the safe and efficient operation of the units, it is still recommended to strengthen the inspection of the runners to prevent problems before they occur.
The Francis runner’s fatigue and cavitation resistance deteriorate with deteriorating material, making the runner blades more vulnerable to stress concentration at off-design conditions. This can hasten damage and impact the turbine’s stability and service life. To address these issues, the next plan is to measure the flow characteristics and strength behavior of the Francis turbine under about 60 different operating conditions, ranging from 0 to 100% loads of rated power. Then, with the help of the corresponding flow-induced strength simulations, the flow pattern and flow-induced stress characteristics under these operating conditions will be thoroughly analyzed, and effective vibration monitoring and control measures will be implemented to guarantee the turbine’s dependability and efficiency after long operating times.
5. Conclusions
In the study, the geometrical model CFD calculation models of the entire fluid domain including the spiral case, stay vanes, guide vanes, turbine runner, crow and band chambers, and draft tube of the turbine unit were constructed. CFD simulations and the flow-induced strength analysis under three operating conditions in the extended load range from the 33.3% rated power load to the full load have been performed.
The Francis turbine flow domain pressure drops from the spiral case to the draft tube under 33.3%, 66.6%, and 100% loads of rated power, according to the CFD calculation results. Nevertheless, the guide vane region’s local pressure distributions change with various loads. The pressure differential between the guide vanes’ upstream and downstream is evident for the 33.3% and 66.6% loads of rated power, with the upstream pressure being higher than the downstream pressure. The pressure gradient in the guide vane region is lower at the 100% rated power load when the guide vanes are fully opened than when it is at 33.3% and 66.6% loads of rated power.
The flow velocity distributions of the turbine under three operating conditions vary from one another. The flow in the spiral case is relatively stable for all loads. However, the flows in the guide vane region and the vaneless zone are strongly related to the guide vane openings. The flow forms a high-speed ring in the vaneless region at the 33.3% rated power load due to the small guide vane opening. The fluid velocity in the draft tube at the 33.3% and 66.6% rated power loads is asymmetric and disordered with the vortex and backflow. At the 100% rated power load, the flow of the whole turbine flow domain is more regular and stable. The high-speed ring in the vaneless region and the backflow and vortex in the draft tube disappear.
According to the Francis runner’s flow-induced strength analysis, the runner’s maximum stress progressively rises as the power increases from 33.3% to 100% of the rated power load. Therefore, the maximum stress on the runner blades increases with the Francis runner’s load. Under 100% of the rated power load, the analyzed runner’s maximum stress is 2.2 and 1.4 times that under 33.3% and 66.6% of the rated power load, respectively, but it is only about one-third of the runner material’s yield stress. This runner is safe to operate throughout the extended range of 33.3% to 100% of the rated power load. Because of the Francis runner’s distinctive design, the flow-induced structural stress on the runner blades varies nonlinearly with the runner load.
The study provides an in-depth analysis of flow-induced stresses of a large Francis turbine over an extended load range. By integrating CFD and FEA approaches, this study fills a critical gap in understanding the operating limits of large Francis turbines to ensure their safe operation under varying load conditions. The analysis approach proposed in this study can be applied to other hydraulic machinery including Francis turbines, pumps, and pump–turbines.


