Abstract
In manufacturing automation, accurately determining the optimal tool replacement timing is critical yet challenging. Tool condition monitoring (TCM) has been widely studied to address this issue. Cutting force is a key parameter for evaluating tool wear, but conventional force sensors are costly and difficult to implement. This study proposes a cost-effective alternative by estimating cutting forces using spindle vibration data through a long short-term memory (LSTM)-based machine learning model. First, the correlation between cutting force and tool wear is analyzed to emphasize the need for accurate force estimation. Then, vibration data collected from the spindle are used to train an LSTM model, which is effective for time-series data processing. The model is trained with vibration signals from various machining positions, with structured time-series datasets improving performance and generalization. Experimental results show that the developed model accurately estimates cutting forces using short segments of vibration data from a single tool revolution. Additionally, the observed relationship between cutting force and tool wear remains consistent across different machining conditions. This study validates real-time cutting force estimation via spindle vibration monitoring and suggests its potential for tool wear prediction. The proposed method offers a practical, low-cost solution for improving tool condition monitoring in automated machining.
1. Introduction
Replacing tools at the optimal time during machining processes is critical for maintaining productivity and ensuring consistent product quality. In most industrial settings, tool replacement timing is traditionally determined through visual inspections conducted by experienced operators. However, as the availability of skilled operators declines and production automation becomes increasingly widespread, the demand for systems capable of accurately estimating tool replacement timing has grown significantly. Consequently, tool condition monitoring (TCM) systems have become indispensable, as real-time monitoring of tool wear and damage is essential to establish appropriate replacement intervals [1,2,3].
Current TCM systems utilize various sensors to assess tool conditions based on physical signals, including cutting force, motor current, acoustic emission (AE), and vibration. Among these, cutting force is a key indicator directly reflecting tool wear and damage, making it central to TCM. Dynamometers are commonly employed to measure cutting force, offering highly accurate data [4,5,6,7]. However, their structural limitation of typically being installed beneath the workpiece complicates practical usage, while their high cost further restricts applicability in industrial settings.
Current sensors monitor tool conditions by detecting increases in motor load current, which are correlated with rising cutting forces as tool wear progresses [8,9,10,11]. The sensor is relatively inexpensive and supports real-time monitoring. However, if the motor–spindle connection involves multiple stages, such as through a reducer, or if a relatively small tool is used compared to the motor’s specifications, the motor current changes may become less sensitive. Consequently, accurately estimating the cutting force using this method can become challenging or even infeasible.
Acoustic emission (AE) sensors detect high-frequency sound signals generated during material cutting, which are closely associated with cutting forces and are effective for identifying tool wear and damage. However, AE monitoring typically relies on processed signals, such as root mean square (RMS) values, rather than raw data, due to the high sampling rates required. This reliance can obscure subtle or rapid changes in tool condition. As a result, the sensitivity of the monitoring system may be reduced [12,13,14,15].
Vibration sensors provide a cost-effective alternative by measuring the interaction between the tool and workpiece through vibration signals, which are then used to indirectly estimate tool conditions. These sensors are easy to install and affordable, but their performance is affected by external factors such as machine structure, tool geometry, workpiece material, and environmental noise. Advanced signal processing techniques are often required to isolate relevant signals from background noise [16,17,18].
As previously mentioned, many studies have been conducted to develop deep learning-based monitoring approaches to overcome the limitations of sensor-based TCM. Since tool condition monitoring exhibits time-dependent characteristics, research has increasingly focused on utilizing recurrent neural networks (RNNs) and long short-term memory (LSTM) networks [19,20,21,22]. Various studies have employed current and vibration data to predict surface roughness and classify tool conditions, demonstrating the effectiveness of deep learning models in machining process monitoring [23]. However, existing tool condition classification and surface roughness prediction models face challenges in real-time implementation, highlighting the need for more efficient learning models capable of real-time monitoring.
In sensor-based TCM systems, key requirements include a cost-effective approach and the ability to accurately estimate cutting forces in real time. To address these challenges, this study proposes a method to estimate cutting forces in real time using a cost-efficient vibration sensor, which is based on the machine learning using an LSTM. Among the sensors discussed earlier, the vibration sensor was chosen for the cutting force estimation algorithm because it does not require high sampling rates, effectively reflects tool changes through the vibration of the spindle near the tool, is free from structural limitations, and is both easy to install and cost-effective. Section 2 experimentally examines the relationship between cutting force and tool wear. Section 3 introduces the proposed method for cutting force estimation based on the LSTM time-series machine learning model. Finally, Section 4 evaluates the training process and performance of the cutting force estimation model, validating its estimation accuracy at other machining locations.
2. Relationship Between Tool Wear and Cutting Force
As tool wear progresses, cutting forces typically increase; however, relying solely on changes in cutting forces to precisely determine the optimal timing for tool replacement presents inherent limitations. While an increase in cutting forces indicates greater cutting resistance caused by wear, these variations are influenced by complex interactions between tool conditions and machining parameters, making quantitative evaluation challenging. Furthermore, changes in cutting forces due to tool wear often display non-linear characteristics, complicating accurate estimations of tool wear based solely on simple fluctuations in force magnitude. To address these challenges, this chapter aims to experimentally and quantitatively investigate the relationship between changes in cutting forces and machined surface quality, thereby establishing a foundation for determining the optimal timing for tool replacement.
2.1. Machining Experiments
As shown in Figure 1a, a dynamometer was installed beneath the workpiece fixture of the 5-axis machining center to measure cutting forces, and an accelerometer was attached to the lateral surface of the spindle to capture vibration signals. Figure 1b provides an overview of the data acquisition (DAQ) system used to simultaneously collect cutting force and vibration data. The specifications of the sensors and the DAQ system are detailed in Table 1. During the data collection process, spindle vibration signals were recorded concurrently, and these data will be utilized in subsequent chapters to develop and refine the cutting force estimation model.
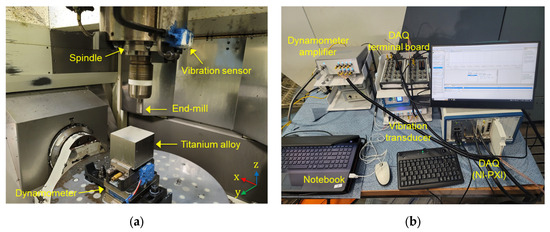
Figure 1.
Experimental setup of machining center and data acquisition system for cutting force spindle vibration monitoring: (a) Machining center configuration with sensor and tool dynamometer placement; (b) Data acquisition system with software interface and signal processing units.

Table 1.
List of sensors and data acquisition system.
Table 2 presents a comprehensive summary of the machining equipment, tools, workpieces, and machining parameters used in the experiment. The machining conditions were determined based on the material-specific guidelines provided by the tool manufacturer. According to Equations (1) and (2), the spindle speed () was set to 1194 rpm (19.9 Hz), and the feed rate () was adjusted to 573 mm/min. The sampling frequency for both cutting force and acceleration signals was configured at 1 kHz, ensuring data acquisition at a rate more than 12 times higher than the tooth passing frequency of 79.6 Hz.
where , , , and represent the number of teeth, tool diameter, cutting speed, and feed per tooth, respectively.
Table 2.
Machining conditions: machining center and condition.
The machining path for the experiment was a linear pass along the x-axis for the first layer, as depicted in Figure 2a. After each pass, the tool advanced by the radial depth of cut () along the y-axis, repeating the same machining pattern. This process was repeated for a total of 33 passes, after which the tool returned to its initial position and moved by the axial depth of cut () along the z-axis to begin the second layer, continuing with 32 passes. As shown in Figure 2b, with each successive layer, the number of passes decreased by one, resulting in a stepped workpiece composed of seven layers (a total of 210 passes). Six workpieces were machined under identical conditions, and the side surface of each layer was examined under a microscope to monitor surface changes.
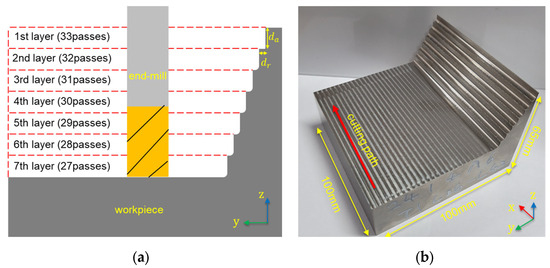
Figure 2.
The machining shape description: (a) seven layers are generated for each workpiece, and the number of passes for each layer; (b) the machined workpiece.
2.2. Effect of Tool Wear on Cutting Force
After completing the machining process, the tool wear of the end mill was measured. As shown in Figure 3a, all four cutting edges (flutes) exhibited wear exceeding 238 μm. Additionally, as observed in Figure 3b, the worn region was concentrated within the lower 2 mm of the free surface of the workpiece. To analyze the effect of tool wear on the machined surface, the surface profile was captured, and surface roughness was measured for each layer. As shown in Figure 4, regular cusp formations were observed in the initial machining layers. However, from the 11th layer, the cusps gradually disappeared from the upper part of the surface. By the 17th layer, burr formation began at the upper surface, and the previously regular cusp patterns were entirely eliminated. The occurrence of burrs increased as machining progressed, and as tool wear intensified, the surface profile became more irregular and rougher. Additionally, the average surface roughness (Ra) was analyzed for each layer, as shown in Figure 5. Initially, significant variations in Ra values were observed between layers, but these fluctuations gradually diminished. This trend is attributed to the effect of replacing the workpiece every seventh layer, causing variations due to material and tool positioning changes. However, from the 17th layer of the third workpiece, Ra values began increasing again, followed by a reduction in fluctuation. This indicates that as tool wear progresses, surface roughness stabilizes, which serves as an important indicator of the tool wear stage.
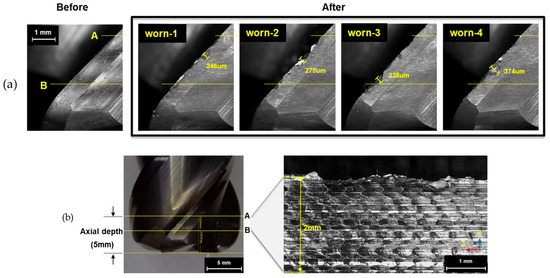
Figure 3.
Tool wear condition and surface quality characteristics of the end mill: (a) Post-machining tool wear condition; (b) Positions affecting surface quality on the end mill.
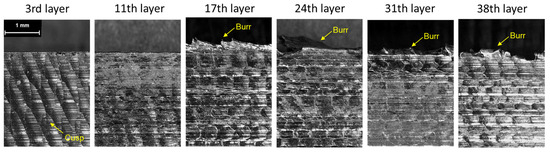
Figure 4.
Surface morphology changes on the workpiece side.
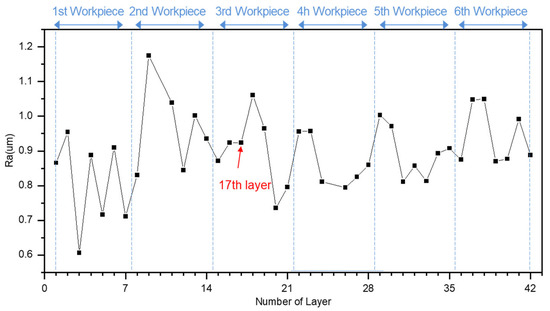
Figure 5.
Variation in surface roughness (Ra).
The variation in the average value of cutting force per pass as the number of passes increases is shown in Figure 6. The average cutting force in the machining direction () decreased from 490 N to 270 N, while the average cutting force in the lateral direction () gradually increased from approximately 630 N to 875 N. These changes in and suggest a close relationship with the change in machining angle due to tool wear. As tool wear progresses, the angle between the tool edge and the material gradually shifts towards a more perpendicular orientation. Accordingly, the formation and disappearance of cusps, as well as the occurrence of burrs, seem to be directly influenced by the wear of the cutting edge and changes in the cutting geometry.

Figure 6.
Cutting force by pass.
As shown in Figure 7, the correlation between x-axis force () and y-axis force ( for each pass was analyzed, revealing a decreasing trend in the correlation coefficient as the number of passes increases. Additionally, as seen in Figure 8, the variation in the correlation coefficient across passes shows a sharp decline during the first 400 passes, after which the correlation coefficient remains relatively stable. However, the correlation coefficient between and significantly decreases after the 17th layer (486–516 passes), which coincides with the point of reduced machining performance.

Figure 7.
Correlation between and by pass.
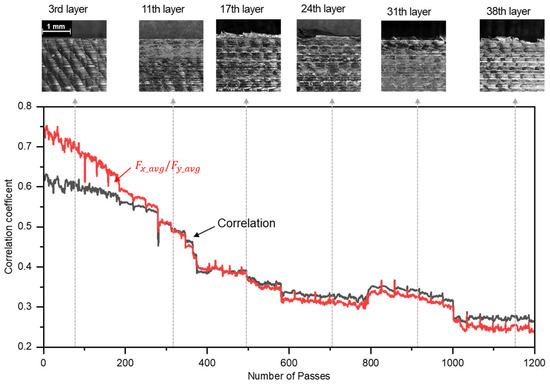
Figure 8.
Correlation coefficient, similarity of , and its variation with machined surface changes.
These findings clearly demonstrate that as tool wear progresses, the cutting edge undergoes wear, leading to a reduction in machining performance, which provides critical information for predicting the point at which tool replacement is necessary. In industrial settings, it is standard practice to replace tools when defects such as burrs appear in the product. Therefore, by analyzing the correlation between and based on cutting forces, it becomes possible to accurately identify the point at which production quality begins to degrade, allowing for estimative tool replacement.
3. Cutting Force Estimation Using LSTM-Based Time-Series Machine Learning
The relationship between cutting force and tool wear was identified through previous experiments, and the data are used to develop a machine learning model utilizing spindle vibration data to estimate cutting force without relying on a dynamometer. Among the various machine learning techniques, the LSTM model is particularly effective for cutting force estimation because it captures dependencies in time-series data. Since cutting force variations are influenced by tool wear over time, utilizing historical data is essential for accurate estimation [24]. The LSTM model is well-suited for learning both short-term and long-term dependencies in time-series data, making it an excellent choice for cutting force estimation, as described below.
First, the LSTM model effectively captures both long-term and short-term dependencies, allowing it to retain essential patterns in time-series data while integrating new information. This capability is particularly useful for modeling the complex and dynamic relationships between cutting force and vibration data [25].
Second, the LSTM model demonstrates strong robustness in handling noisy signals, which is crucial in machining environments where vibration data often contain significant noise. By selectively extracting relevant time-series features and filtering out irrelevant noise, the model enhances estimation accuracy [26].
Third, the non-linear relationship between cutting force and tool wear poses a challenge for traditional modeling approaches. The LSTM model excels in capturing such complex dependencies, improving the accuracy of cutting force estimation as the tool condition deteriorates [25].
Finally, the LSTM model enables real-time cutting force monitoring, making it well-suited for integration into industrial tool condition monitoring systems. By utilizing past data, the model estimates cutting force at each time step, facilitating real-time tracking of force variations due to tool wear and supporting optimized tool replacement strategies [25].
In summary, this study presents an LSTM-based approach for estimating cutting force using spindle vibration data. The proposed method provides a cost-effective and practical alternative to direct dynamometer-based force measurements while enhancing the efficiency of tool condition monitoring.
3.1. LSTM-Based Time-Series Machine Learning
The primary capability of LSTM in effectively handling time-series data originates from its memory cell (). Figure 9 shows a block diagram of LSTM. As shown in Equations (3) and (4), the memory cell retains only the essential information from both the new input ()and the past state (), preventing gradient vanishing problems commonly encountered in recurrent neural networks (RNN):

Figure 9.
Block diagram of LSTM.
Additionally, as illustrated in Figure 7, LSTM incorporates three gates (input gate, forget gate, and output gate) to regulate the flow of information. The input gate () in Equation (5) controls how much new information is stored in the memory cell, while the forget gate () in Equation (6) determines how much past information is retained. The output gate () in Equation (7) regulates the amount of processed information that is passed to the next time step:
where and represent the sigmoid and hyperbolic tangent activation functions, respectively. The parameters and denote trainable weights and biases updated iteratively during training.
Finally, the hidden state (), representing the LSTM’s output at each time step, is derived by combining the output gate with the updated memory cell, as shown in Equation (8):
The combination of the memory cell and gating mechanisms allows LSTM to effectively capture long-term dependencies and temporal patterns in sequential data. This capability makes it particularly well-suited for tasks involving sequential information, such as cutting force estimation in this study.
3.2. LSTM Architecture for Cutting Force Estimation
To estimate the cutting forces ( and ), the spindle vibration data , and ) collected in the previous section is structured as shown in Figure 10a. The input to the LSTM model consists of these three-axis acceleration signals, while the output is defined as the average peak force values for and , as shown in Figure 10b. Each data sample corresponds to one full tool rotation, capturing information from all tool flutes and allowing for real-time monitoring by estimating cutting forces over short time intervals.

Figure 10.
Configuration of input and output data per tool revolution for LSTM training: (a) Input data—spindle vibration signals; (b) Output data—mean peak cutting force.
Since the vibration signals are closely linked to cutting forces, aligning the two datasets enhances feature extraction, enabling accurate estimation of cutting forces. The outputs are designed to estimate the mean peak cutting force for each tool flute in and . Given a spindle speed of 19.9 Hz and a data acquisition rate of 1 kHz, each sensor captures 49 data points per axis for every tool rotation. Consequently, the input consists of 147 values (three vibration axes), and the output consists of two values representing the estimated cutting forces.
This dataset contains 99 data samples per pass, resulting in a total of 124,740 datasets across 1260 passes, as shown in Figure 11. Since LSTM models rely on sequential data, time-dependent variations must be properly structured for effective learning. To achieve this, the training dataset is divided into time-series segments, grouping temporal variations at each cutting position into 99 datasets. From the entire dataset, 80% (80 datasets) is allocated for training, while 20% (19 datasets) is used for validation. The dataset order is randomized during training to improve generalization, but the internal sequence within each dataset is preserved.
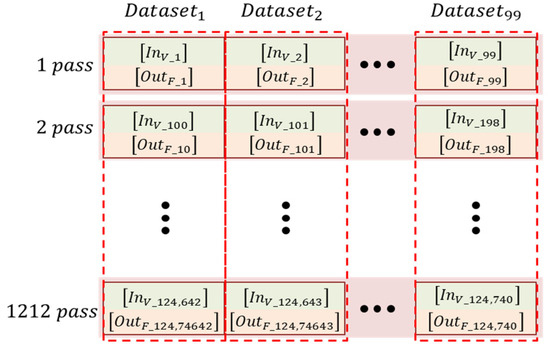
Figure 11.
Dataset configuration.
The proposed learning model, shown in Figure 12, incorporates an LSTM layer followed by a dropout layer (rate = 0.5) to prevent overfitting. The total number of trainable parameters is 288,552, ensuring an appropriate balance between model complexity and computational efficiency.
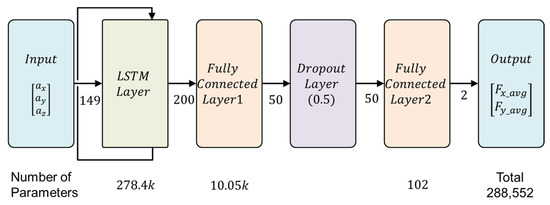
Figure 12.
LSTM architecture for cutting force estimation.
4. Training and Analysis of Cutting Force Estimation
The training results of 200 epochs for cutting force estimation using the proposed model and dataset are shown in Figure 13. In the figure, the blue line represents the root mean square error of cutting force () calculated between the cutting forces obtained from the dynamometer (training dataset) and those estimated by the LSTM-based algorithm [27]. The red line represents the , calculated using the validation dataset. The definition of is provided in Equation (9):
where n and represent the total number of datasets and the index of each dataset, respectively. and are the actual cutting forces for the -th dataset, while and represent the cutting forces estimated by the LSTM-based learning algorithm.
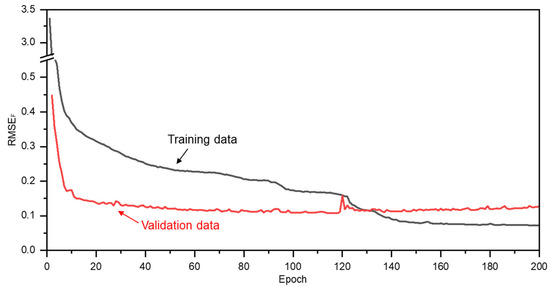
Figure 13.
Performance of the learning model during training: in training and validation datasets.
To evaluate the cutting force estimation performance of the proposed LSTM architecture, a comparative analysis was conducted by replacing the LSTM layer with a fully dense layer while maintaining the overall model structure. The alternative model was trained using the same dataset to assess its effectiveness in capturing cutting force patterns. Figure 14a,b illustrate the estimation performance for and , respectively. The LSTM-based model demonstrates a strong correlation with the actual cutting forces measured by the dynamometer, exhibiting minimal error and closely following the real force patterns. In contrast, the fully dense layer-based model exhibits significant oscillations in its estimations, indicating instability in force prediction.

Figure 14.
Estimated force components using validation data: (a) estimated using validation data; (b) estimated using validation data.
This discrepancy is further evident in the cutting force correlation estimation performance, as shown in Figure 15a. The fully dense model struggles to capture the variations in force correlation, whereas the LSTM-based model accurately follows the real correlation trend. Notably, in Figure 15b, the correlation coefficient experiences a noticeable decline around the 17th layer. While the fully dense model fails to detect this critical change, the LSTM-based model successfully tracks the actual trend, highlighting its superior ability to model the temporal dependencies in cutting force variations.
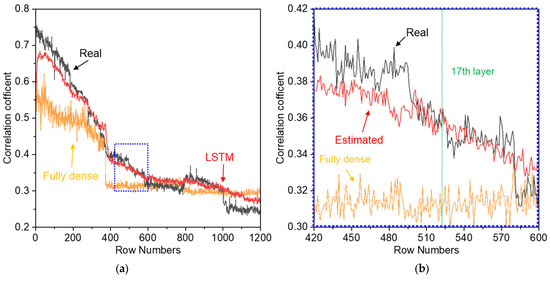
Figure 15.
Correlation results estimated using the trained model: (a) correlation results for the entire pass; (b) correlation results for 420–600 passes.
5. Conclusions
In this study, a machine learning approach was developed to accurately estimate cutting forces using spindle vibration signals. Unlike conventional force measurement methods, which require dynamometers or indirect sensor-based approaches, the proposed model enables real-time estimation of cutting forces solely from vibration data. Experimental investigations were conducted to analyze the relationship between tool wear and cutting force variations, and a machine learning model was constructed to estimate cutting forces with high accuracy. Additionally, the correlation between F_x and F_y was examined, allowing for further analysis of cutting force variations in relation to tool wear progression. To evaluate the performance of the proposed model, a comparative study was conducted against a fully dense neural network model. The results demonstrated that the LSTM-based model achieved significantly lower estimation errors and demonstrated superior accuracy in estimating the correlation coefficient of cutting force variations during machining. Furthermore, the proposed model successfully estimated cutting forces using spindle vibration data collected within a single tool revolution, confirming its feasibility for real-time tool condition monitoring. In conventional vibration-based tool condition monitoring (TCM) systems, advanced signal processing techniques are often required, involving complex filtering methods and anomaly detection algorithms to isolate meaningful signals. In contrast, this study employed a simple filtering method to effectively remove non-cutting signals while preserving the essential vibration data needed for force estimation. By eliminating the need for a high-cost dynamometer, the proposed method provides a practical and efficient alternative for real-time force estimation in machining environments. The findings of this study demonstrate the potential of spindle vibration-based cutting force estimation as a viable approach for monitoring machining processes. While the estimation of cutting force correlation coefficients may provide additional insights into tool wear trends, this remains a secondary aspect of the study. Future research will focus on evaluating the robustness of the proposed algorithm across diverse machining conditions and further refining the estimation accuracy under varying operational environments.
Author Contributions
Conceptualization, J.-D.R., H.-H.L., K.-N.H., S.-R.K. and M.C.L.; Methodology, J.-D.R., S.-R.K. and M.C.L.; Software, J.-D.R.; Formal analysis, J.-D.R.; Investigation, J.-D.R., H.-H.L. and K.-N.H.; Resources, H.-H.L. and K.-N.H.; Data curation, J.-D.R.; Writing—original draft, J.-D.R.; Writing—review & editing, J.-D.R. and M.C.L.; Supervision, H.-H.L., K.-N.H. and S.-R.K.; Funding acquisition, S.-R.K. All authors have read and agreed to the published version of the manuscript.
Funding
This study was supported by the Korea Institute of Industrial Technology (KITECH) under the “Establishment of BIZ platform for advancement of Ppuri industry” (KITECH MZ240010) and by the Ministry of Trade, Industry and Energy under the “Development of Class 1E EHO Control Valve Localization” (NS240048).
Data Availability Statement
The original contributions presented in this study are included in the article. Further inquiries can be directed to the corresponding author.
Conflicts of Interest
Authors Je-Doo Ryu, Hoon-Hee Lee, Kyoung-Nam Ha, Sung-Ryul Kim were employed by the company Korea Institute of Industrial Technology. The remaining authors declare that the re-search was conducted in the absence of any commercial or financial relationships that could be construed as a potential conflict of interest.
References
- Byrne, G.; Dornfeld, D.; Inasaki, I.; Ketteler, G.; König, W.; Teti, R. Tool condition monitoring (TCM)—The status of research and industrial application. CIRP Ann. 1995, 44, 541–567. [Google Scholar] [CrossRef]
- de Leon, M.A.L.; Kolarik, J.; Byrtus, R.; Koziorek, J.; Zmij, P.; Martinek, R. Tool condition monitoring methods applicable in the metalworking process. Arch. Comput. Methods Eng. 2024, 31, 221–242. [Google Scholar] [CrossRef]
- Siddhpura, A.; Paurobally, R. A review of flank wear prediction methods for tool condition monitoring in a turning process. Int. J. Adv. Manuf. Technol. 2013, 65, 371–393. [Google Scholar] [CrossRef]
- Audy, J. An appraisal of techniques and equipment for cutting force measurement. J. Zhejiang Univ. A 2006, 7, 1781–1789. [Google Scholar] [CrossRef]
- Hanif, M.I.; Aamir, M.; Ahmed, N.; Maqsood, S.; Muhammad, R.; Akhtar, R.; Hussain, I. Optimization of facing process by indigenously developed force dynamometer. Int. J. Adv. Manuf. Technol. 2019, 100, 1893–1905. [Google Scholar] [CrossRef]
- Qin, Y.; Zhao, Y.; Li, Y.; Zhao, Y.; Wang, P. A novel dynamometer for monitoring milling process. Int. J. Adv. Manuf. Technol. 2017, 92, 2535–2543. [Google Scholar] [CrossRef]
- Raheem, A.; Khan, R.; Mazhar, A.R.; Ya, H.H.; Alam, M.A.; Ahmed, T.; Azeem, M. A review of recent studies of dynamometers for cutting force measurement in machining processes. In Proceedings of the International Conference on Robotics and Automation in Industry, Rawalpindi, Pakistan, 26–27 October 2021; pp. 1–7. [Google Scholar] [CrossRef]
- Zhou, Y.; Sun, W. Tool wear condition monitoring in milling process based on current sensors. IEEE Access 2020, 8, 95491–95502. [Google Scholar] [CrossRef]
- Li, X.; Djordjevich, A.; Venuvinod, P. Current-sensor-based feed cutting force intelligent estimation and tool wear condition monitoring. IEEE Trans. Ind. Electron. 2000, 47, 697–702. [Google Scholar] [CrossRef]
- Yuan, J.; Liu, L.; Yang, Z.; Bo, J.; Zhang, Y. Tool wear condition monitoring by combining spindle motor current signal analysis and machined surface image processing. Int. J. Adv. Manuf. Technol. 2021, 116, 2697–2709. [Google Scholar] [CrossRef]
- Lin, X.; Zhou, B.; Zhu, L. Sequential spindle current-based tool condition monitoring with support vector classifier for milling process. Int. J. Adv. Manuf. Technol. 2017, 92, 3319–3328. [Google Scholar] [CrossRef]
- Li, X. A brief review: Acoustic emission method for tool wear monitoring during turning. Int. J. Mach. Tools Manuf. 2002, 42, 157–165. [Google Scholar] [CrossRef]
- Jemielniak, K.; Kossakowska, J. Tool wear monitoring based on wavelet transform of raw acoustic emission signal. Adv. Manuf. Sci. Technol. 2010, 34, 5–16. [Google Scholar]
- Hase, A.; Wada, M.; Koga, T.; Mishina, H. The relationship between acoustic emission signals and cutting phenomena in turning process. Int. J. Adv. Manuf. Technol. 2014, 70, 947–955. [Google Scholar] [CrossRef]
- Kishawy, H.A.; Hegab, H.; Umer, U.; Mohany, A. Application of acoustic emissions in machining processes: Analysis and critical review. Int. J. Adv. Manuf. Technol. 2018, 98, 1391–1407. [Google Scholar] [CrossRef]
- Sun, X. Milling tool condition monitoring based on an integrated wireless vibration sensing tool holder. Int. J. Precis. Eng. Manuf. 2024, 25, 2611–2623. [Google Scholar] [CrossRef]
- Arslan, H.; Er, A.O.; Orhan, S.; Aslan, E. Tool condition monitoring in turning using statistical parameters of vibration signal. Int. J. Acoust. Vib. 2016, 21, 371–378. [Google Scholar] [CrossRef]
- Yesilyurt, I.; Ozturk, H. Tool condition monitoring in milling using vibration analysis. Int. J. Prod. Res. 2007, 45, 1013–1028. [Google Scholar] [CrossRef]
- Kaliyannan, D.; Thangamuthu, M.; Pradeep, P.; Gnansekaran, S.; Rakkiyannan, J.; Pramanik, A. Tool Condition Monitoring in the Milling Process Using Deep Learning and Reinforcement Learning. J. Sens. Actuator Netw. 2024, 13, 42. [Google Scholar] [CrossRef]
- Caggiano, A.; Mattera, G.; Nele, L. Smart Tool Wear Monitoring of CFRP/CFRP Stack Drilling Using Autoencoders and Memory-Based Neural Networks. Appl. Sci. 2023, 13, 3307. [Google Scholar] [CrossRef]
- Turšič, N.; Klančnik, S. Tool Condition Monitoring Using Machine Tool Spindle Current and Long Short-Term Memory Neural Network Model Analysis. Sensors 2024, 24, 2490. [Google Scholar] [CrossRef]
- Lin, Y.-C.; Wu, K.-D.; Shih, W.-C.; Hsu, P.-K.; Hung, J.-P. Prediction of Surface Roughness Based on Cutting Parameters and Machining Vibration in End Milling Using Regression Method and Artificial Neural Network. Appl. Sci. 2020, 10, 3941. [Google Scholar] [CrossRef]
- Wang, Z.; Zhao, Y.; Yao, J.; Yu, T.; Qu, S.; Zhao, J. The Investigation of Graphene Oxide-Enhanced Hybrid Slurry Preparation and Its Polishing Characteristic on CVD Single Crystal Diamond. Materials 2024, 17, 6053. [Google Scholar] [CrossRef] [PubMed]
- Hochreiter, S.; Schmidhuber, J. Long short-term memory. Neural Comput. 1997, 9, 1735–1780. [Google Scholar] [CrossRef] [PubMed]
- Zhang, J.; Zeng, Y.; Starly, B. Recurrent neural networks with long term temporal dependencies in machine tool wear diagnosis and prognosis. SN Appl. Sci. 2021, 3, 442. [Google Scholar] [CrossRef]
- Coto-Jiménez, M. Robustness of LSTM neural networks for the enhancement of spectral parameters in noisy speech signals. In Advances in Computational Intelligence: MICAI 2018 Proceedings, Part II; Batyrshin, I., Martínez-Villaseñor, M., Ponce Espinosa, H., Eds.; Springer: Cham, Switzerland, 2018; pp. 227–238. [Google Scholar] [CrossRef]
- Zhu, M.; Zhang, J.; Bu, L.; Nie, S.; Bai, Y.; Zhao, Y.; Mei, N. Methodology and experimental verification for predicting the remaining useful life of milling cutters based on hybrid CNN-LSTM-Attention-PSA. Machines 2024, 12, 752. [Google Scholar] [CrossRef]
Disclaimer/Publisher’s Note: The statements, opinions and data contained in all publications are solely those of the individual author(s) and contributor(s) and not of MDPI and/or the editor(s). MDPI and/or the editor(s) disclaim responsibility for any injury to people or property resulting from any ideas, methods, instructions or products referred to in the content. |
© 2025 by the authors. Licensee MDPI, Basel, Switzerland. This article is an open access article distributed under the terms and conditions of the Creative Commons Attribution (CC BY) license (https://creativecommons.org/licenses/by/4.0/).