Article

Experimental Studies and Computational Fluid Dynamics Simulations to Evaluate the Characteristics of the Air Velocity Profile Generated by the Positive Pressure Ventilator

1
Scientific and Research Centre for Fire Protection, National Research Institute, 05-420 Józefów, Poland
2
Faculty of Environmental and Energy Engineering, Institute of Thermal Energy, Poznań University of Technology, 60-965 Poznań, Poland
3
Faculty of Mechanical Engineering, Institute of Machine Design, Poznań University of Technology, 60-965 Poznań, Poland
4
Faculty of Civil Engineering and Resource Management, Department of Environmental Engineering, AGH University of Krakow, 30-059 Krakow, Poland
5
Building Research Institute (ITB), 00-611 Warsaw, Poland
*
Author to whom correspondence should be addressed.
Appl. Sci. 2025, 15(5), 2332; https://doi.org/10.3390/app15052332
Submission received: 27 January 2025 / Revised: 11 February 2025 / Accepted: 19 February 2025 / Published: 21 February 2025
(This article belongs to the Section Civil Engineering)

Abstract

:
Determining the appropriate position of a positive pressure ventilator, where it exhibits the highest efficiency (measured by the achieved volumetric flow rate), can influence the success of rescue operations conducted by fire protection units. The aim of this article is to evaluate the possibility of using LES (Large Eddy Simulation) analyses to verify the positioning parameters of positive pressure ventilators in numerical simulation conditions, without the need for time-consuming experiments. The article presents a comparative analysis of full-scale experimental studies (conducted on a test setup to assess the velocity profile of the air jet in open flow) and CFD numerical analyses. The analysis confirmed the convergence of the flow rate parameter entering the surface of the door opening model installed on the test setup. Depending on the distance of the ventilator position (1–7 m), a convergence degree ranging from 1.6% to 3.8% was achieved for the volumetric flow rate. This publication demonstrates that the LES model is a suitable tool for effectively determining the working positions of positive pressure ventilators, as defined in real working conditions (open flow). The analysis may serve as a helpful tool for manufacturers of mobile ventilators, who can use the method for the technological testing of their units without conducting time-consuming experiments.

1. Introduction

Positive pressure ventilators are an important tool used in rescue and firefighting operations with a wide range of applications [1,2]. Available on the market are ventilator units powered by both electric and combustion engines [3]. Due to the nature of their use, these devices should be characterized by operational efficiency, which is measured by the generated flow parameters [4,5]. Flow parameters, including the amount of air injected into the interior of a building, will depend on the device’s power [6,7], rotor size [8] (including the presence of a flow straightener on its surface [9]), rotor blade geometry [10,11] or mechanisms for changing it [12,13], and positioning parameters, such as the distance from the door opening and the rotor’s angle of inclination. There are numerous scientific studies in the literature aimed at evaluating the parameters that influence operational efficiency. In 2022, Kaczmarzyk et al. determined the effect of the positioning distance of positive pressure ventilators and changes in the size of the outlet opening on flow parameters (volumetric airflow rate and pressure) in a real building structure [14]. Their research showed that the ventilators operate in completely different ways, i.e., the conventional ventilator generated the highest volumetric flow rate when positioned 1 m away, while the turbo ventilator (with a flow straightener mounted on the rotor) performed best at a distance of 5 m. Similar studies were conducted by Ezekoye and his team [15], who investigated the use of PPV in a three-story building. They demonstrated that the distance at which the ventilator was positioned in front of the door opening affects the amount of air moved. Additionally, they pointed out that the larger the building volume, the less efficient the ventilation with a ventilator becomes due to the larger area where potential structural leaks could occur.
In the literature, there are many simulation studies conducted using various Computational Fluid Dynamics (CFD) tools [16,17]. These programs are widely applied in different branches of industry as well as the scientific environment [18,19]. Kaczmarzyk et al., in 2024, performed experimental tests and CFD simulations (using Fire Dynamics Simulator FDS) to assess the flow parameters of a mobile ventilator (for positioning distances of 1–7 m) in a multi-story building. A comparative analysis showed a convergence degree between the tests and the simulation from 0.4% to 11.5% (for volumetric flow rate) and from 0.6% to 30.1% for pressure. Furthermore, the authors proposed a method for assessing the air velocity profile in the immediate vicinity of the ventilator’s rotor in their publication [20]. In 2006, Kerber used the FDS program to assess the air velocity profile in open flow for various positioning distances of the positive pressure ventilator. In his research, he obtained the following convergence degrees between the experiment and CFD simulation: 8.7% (distance 1.8 m), 14.7%—2.4 m, and 3.1% for 3.1% [21]. A similar comparative analysis was also conducted by Weinschenk et al., in 2011 [22]. The authors, in their publication, assessed the possibility of using simple analytical methods and CFD simulations to predict the flow parameters of the air jet generated by a positive pressure ventilator through a building. In the considered building, the authors (between CFD simulation and actual tests) showed the following convergence degree of flow parameters: 2.5% (pressure) and 9.9% (mass flow rate). Furthermore, the authors demonstrated that neglecting structural leaks in the numerical model could overestimate the pressure by approximately 12.5% and the mass flow rate by around 50%. In 2017, Panindre et al. conducted CFD numerical analyses related to evaluating the impact of the outlet opening size on the internal pressure within a building’s volume [23]. Their research showed that the use of DOAR (Door Open Area Reducer) allows for generating higher internal pressure in the ventilated space by 40–60%. Additionally, they also pointed out that the use of DOAR not only increases the effectiveness of the positive pressure ventilator but also reduces the adverse impact of wind on the ventilation process. Also, in 2017, Panindre et al. continued their work related to evaluating flow parameters within large-volume buildings using the FDS program [24]. The model they developed proved to be accurate in predicting pressure changes in the building during the use of positive pressure ventilators in rescue operations. The differences in pressure values between the simulation and the experiment reached a maximum of 8.5%, which was considered an acceptable value in the context of using the FDS program for this application. The literature also contains works on the use of CFD simulations to assess the flow parameters of positive pressure ventilators in test stands [25]. Fritsche et al., in 2018, built a channel test stand to evaluate the volumetric flow rate generated by firefighting ventilators [25] and conducted CFD simulations using the Ansys CFX environment [26]. In the simulation, the author used the SST (Shear Stress Transport) model, which provided good accuracy in predicting airflow through the channel and the flow straightener installed within it. For the discussed case, convergence approached 88%.
The aim of the article is to assess the possibility of using LES-type analyses for CFD simulation studies of the volumetric flow rate parameter and the velocity profile of the positive pressure ventilators (operating in open flow) used in rescue operations. The article presents a comparative analysis to evaluate the degree of convergence of the volumetric airflow between experimental tests conducted at full scale and CFD numerical simulations. The studies were conducted using a test stand designed to evaluate the velocity profile characteristics to assess the effective positioning parameters of positive pressure ventilators operating in real working conditions (open flow) [27]. Simultaneously, the same testing conditions were replicated in the CFD environment of the Fire Dynamics Simulator program.

2. Materials and Methods

2.1. Research Methodology in Real-Scale: Velocity Profile on the Door Opening Surface in Open Flow

For the research, a positive pressure ventilator of the turbo type Ramfan GX 350 (Spring Valley, NY, USA), which is a commonly used tool by fire protection units, was utilized. The ventilator is powered by a gasoline engine with a power output of 4.1 kW and a displacement of 196 cm3. The manufacturer has declared an airflow rate of 31,799 m3/h for this unit [3,4,28].
The velocity profile of the airflow across the door opening plane was measured using a test stand designed to assess the characteristics of the velocity profile of the air stream in open flow [27]. A crucial aspect of the test stand’s operation is its ability to account for geometric parameters related to the positioning of the ventilator, such as the distance from the door opening. For the purpose of evaluating the airflow of mobile ventilators (to reflect their real operating conditions), the measurement plane was integrated with an obstacle imitating a door opening, with dimensions of 2.03 × 0.91 m [29]. Fifty measurement points were evenly distributed across the surface of the door opening, where airflow velocity values were recorded. These measurement points were placed uniformly across the door opening’s surface using the equal plane method, as described in ISO 5221 [30]. The arrangement of the measurement points is shown in Figure 1. The measurement module, mounted on a sampling arm, was equipped with a TSI thermoanemometer model 8455 (TSI, Shoreview, MN, USA) (with a measuring range from 0.127 to 50 m/s and an accuracy of approximately 1% of the reading). The transport of the probe was facilitated by stepper motors, allowing for automatic and repeatable changes in the probe’s position. The drive used enabled the probe to be positioned on the measuring plane surface with an accuracy of at least 1 mm. The research program was configured so that the measurement duration at each point lasted 300 s, with an acquisition frequency of 10 Hz. The tests were conducted for five ventilator positioning distances, namely 1 m, 3 m, 4 m, 5 m, and 7 m. For each distance, the rotor axis inclination angle was set to 0°. The volumetric flow rate value at the door opening surface was determined according to the equation presented by Kaczmarzyk et al. in 2023 [4] and 2024 [20]. In the analysis of the measurement error (for airflow velocity tests at selected measuring points), the arithmetic mean was used as the estimator of the value. The standard deviation of the arithmetic mean was adopted as the error of the estimator. The main test results provided average values of airflow rate from 50 trials (N = 50), with confidence intervals determined at a 95% confidence level (p = 0.05). Significant statistical differences were analyzed using Student’s t-test. The tests were carried out in a research hall with a volume of 1500 m3. During the tests, the garage doors were open. Environmental conditions were monitored during the tests, with the following parameters: temperature: 15 ± 2 °C; humidity: 50 ± 3%; pressure: 1003 ± 10 hPa. The experimental tests were conducted under conditions where the wind speed did not exceed 0.3 m/s, and all obstacles were located at a distance of at least 10 times the diameter of the impeller (D) from the ventilator.

2.2. Methodology for Measuring the Volumetric Flow Rate of Positive Pressure Ventilators

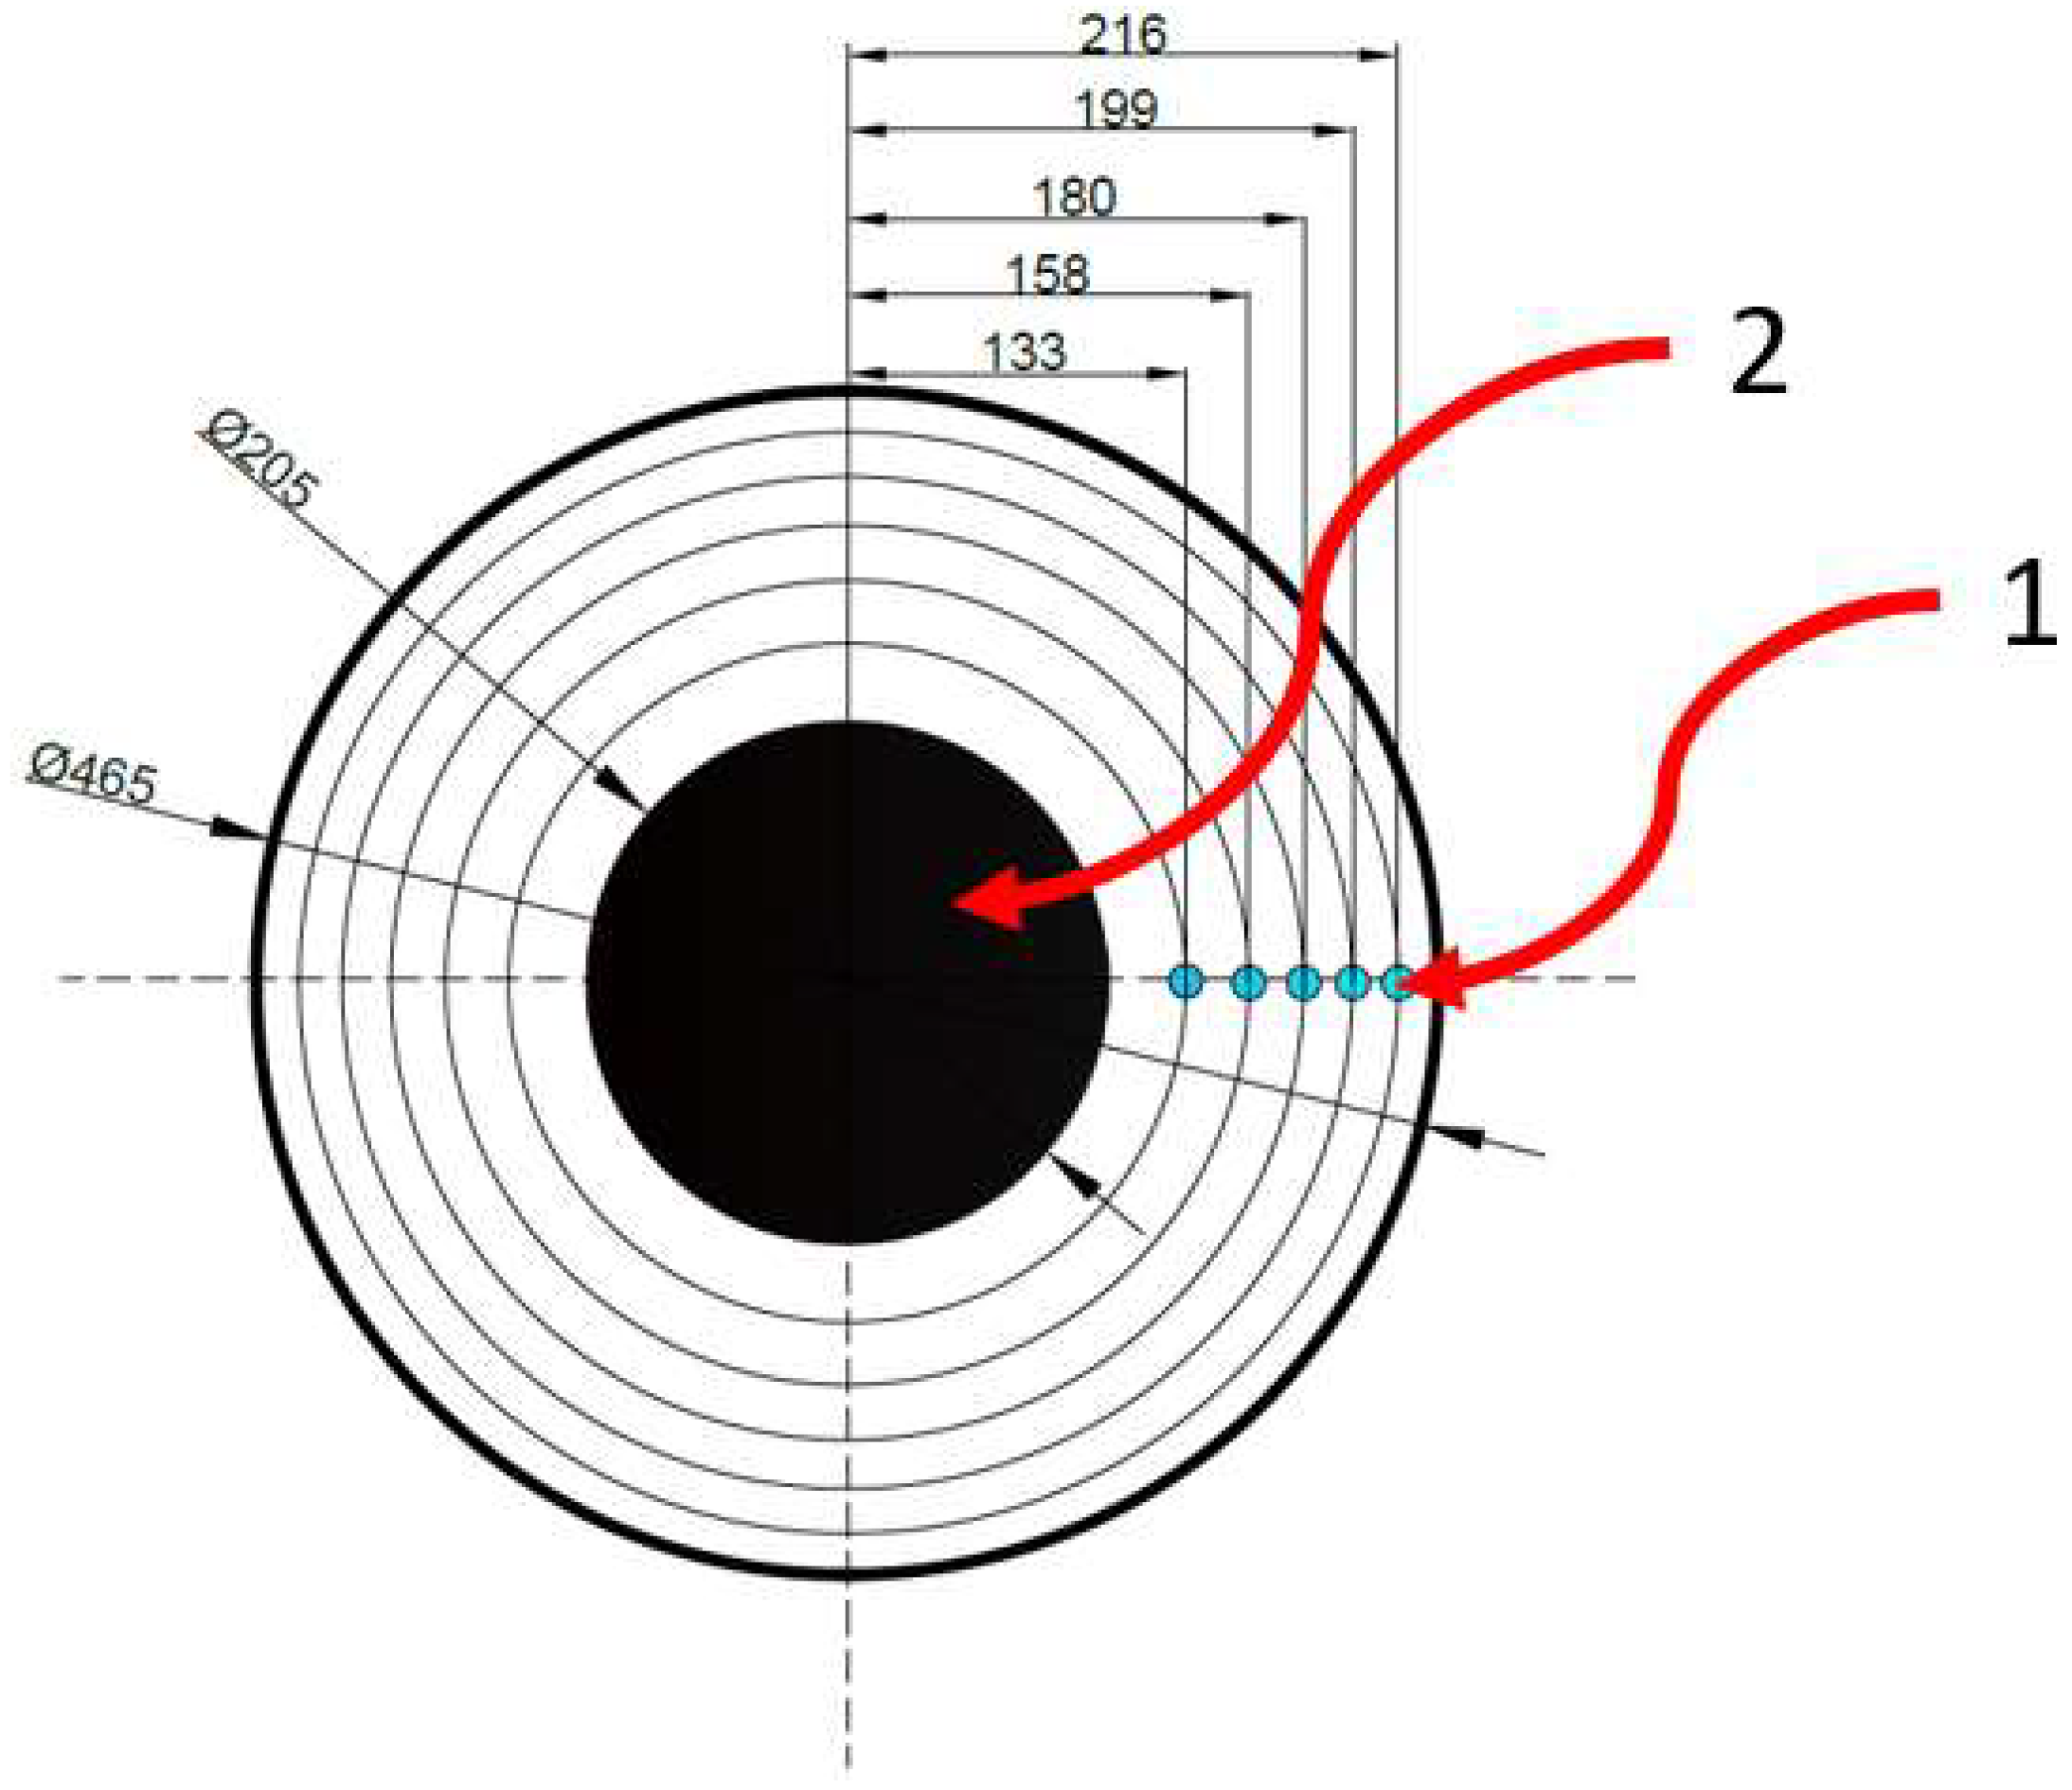
To introduce reliable flow parameters into the CFD simulation model in the Fire Dynamics Simulator, studies were conducted on the velocity profile of the air jet in the immediate vicinity of the impeller of the positive pressure ventilator. The tests were performed using a ventilator that had previously undergone experimental testing. The measurements were carried out based on a modified method of equal surfaces in accordance with ISO 5221 [30]. The modification to the standard method was related to isolating the central surface of the ventilator hub (dead zone) mounted on the impeller. In this area, as shown in the schematic in Figure 2, the velocity field of the positive pressure ventilator was not evaluated. For the execution of the tests, the following measurement equipment was used: Prandtl probe (Nordic Aviation, Singapore) (manufactured according to the requirements of the ANSI/AMCA 210-16 standard) [31]; data acquisition system Dataq Instruments (Akron, OH, USA) (DI-710-UL 0–10 V card); and supporting tools (tape measure, stabilizing body, protractor, and caliper). The measurement equipment used in these tests ensured measurement consistency and provided reliable data for the simulation model.
The studies were conducted in a symmetric arrangement on both sides of the ventilator impeller at two probe positioning distances in front of the surface of the positive pressure ventilator impeller, specifically 50 mm and 100 mm. During the experiments on the velocity profile of the impeller jet, the ventilator operated at its maximum rotational speed. The volume flow rate was calculated based on the obtained average dynamic pressure values and the surface area of the ventilator impeller (reduced by the hub plug—the dead flow zone). The tests were carried out inside a closed research hall with a volume of approximately 1500 m3, where stable environmental conditions were maintained (temperature 22 ± 1 °C and humidity 50 ± 2%).

2.3. CFD Simulation Methodology

The CFD analysis was performed using Fire Dynamics Simulator (version 6.7.9), an open-source CFD software package dedicated to modeling low-speed turbulent flows using the LES (Large Eddy Simulation) approach to turbulence. The software was developed by the National Institute of Standards and Technology (NIST) [32] and is an extensive tool for predicting velocity distributions, smoke flow, and fire development [33,34,35]. The software solves the LES equations (temporally and spatially filtered Navier–Stokes equations) to directly resolve the large turbulent scales responsible for the turbulent transport of mass and momentum. In this simulation, the flow is primarily driven by the positive pressure ventilator. The transport of subgrid-scale momentum is modeled using an eddy viscosity approach based on the Deardorff model [36]. Further details on the implementation of the SGS model can be found in the FDS technical reference guide [37]. The FDS program uses explicit time steps with automatic control to maintain the maximum Courtant–Friedrischs–Lewy CFL condition in the domain in the range of 0.8 to 1.0 [38]. The update of the velocity equation solution occurs repeatedly for each time step until the maximum velocity error is reduced below a specified tolerance threshold (set at 0.001 m/s).
The analysis employed an isothermal flow model. Pyrosim 2022.3.1208 software was used for visualizing the model. The boundary condition for the air jet generated by the positive pressure ventilator was described using the “Velocity Patch” function [37], which allows for the assignment of a non-uniform velocity profile on the surface of the ventilator. This function was implemented by providing flow velocity values obtained from experimental studies. The boundary condition for the volume flow rate generated by the ventilator was the product of the average velocities on the surface of the ventilator’s impeller and the area of the impeller surface, which corresponds to a value of 12,600 m3/h (Table A1). The airflow on the impeller surface was measured using the “volume flow in the gas phase” function [20]. This simulation setup provided a detailed and accurate representation of the ventilator’s performance in generating airflow, which was essential for the analysis of its impact on the environment in a firefighting or rescue operation.
For the CFD simulation, a geometry corresponding to the real dimensions of the test setup and the ventilator was developed. The spatial model was constructed on a Cartesian computational grid divided into 447,252 computational cells, each with dimensions of 0.05 × 0.05 × 0.05 m. The level of detail for all elements of the model, including the ventilator housing and the test setup structure, was designed with an accuracy corresponding to the grid cell resolution, i.e., 5 cm. As part of the work performed, an analysis of the mesh convergence was performed, which showed that the indicated value was optimal, i.e., it allows for the assessment of the positioning distance of the positive pressure ventilator without the need to engage too much computing power.
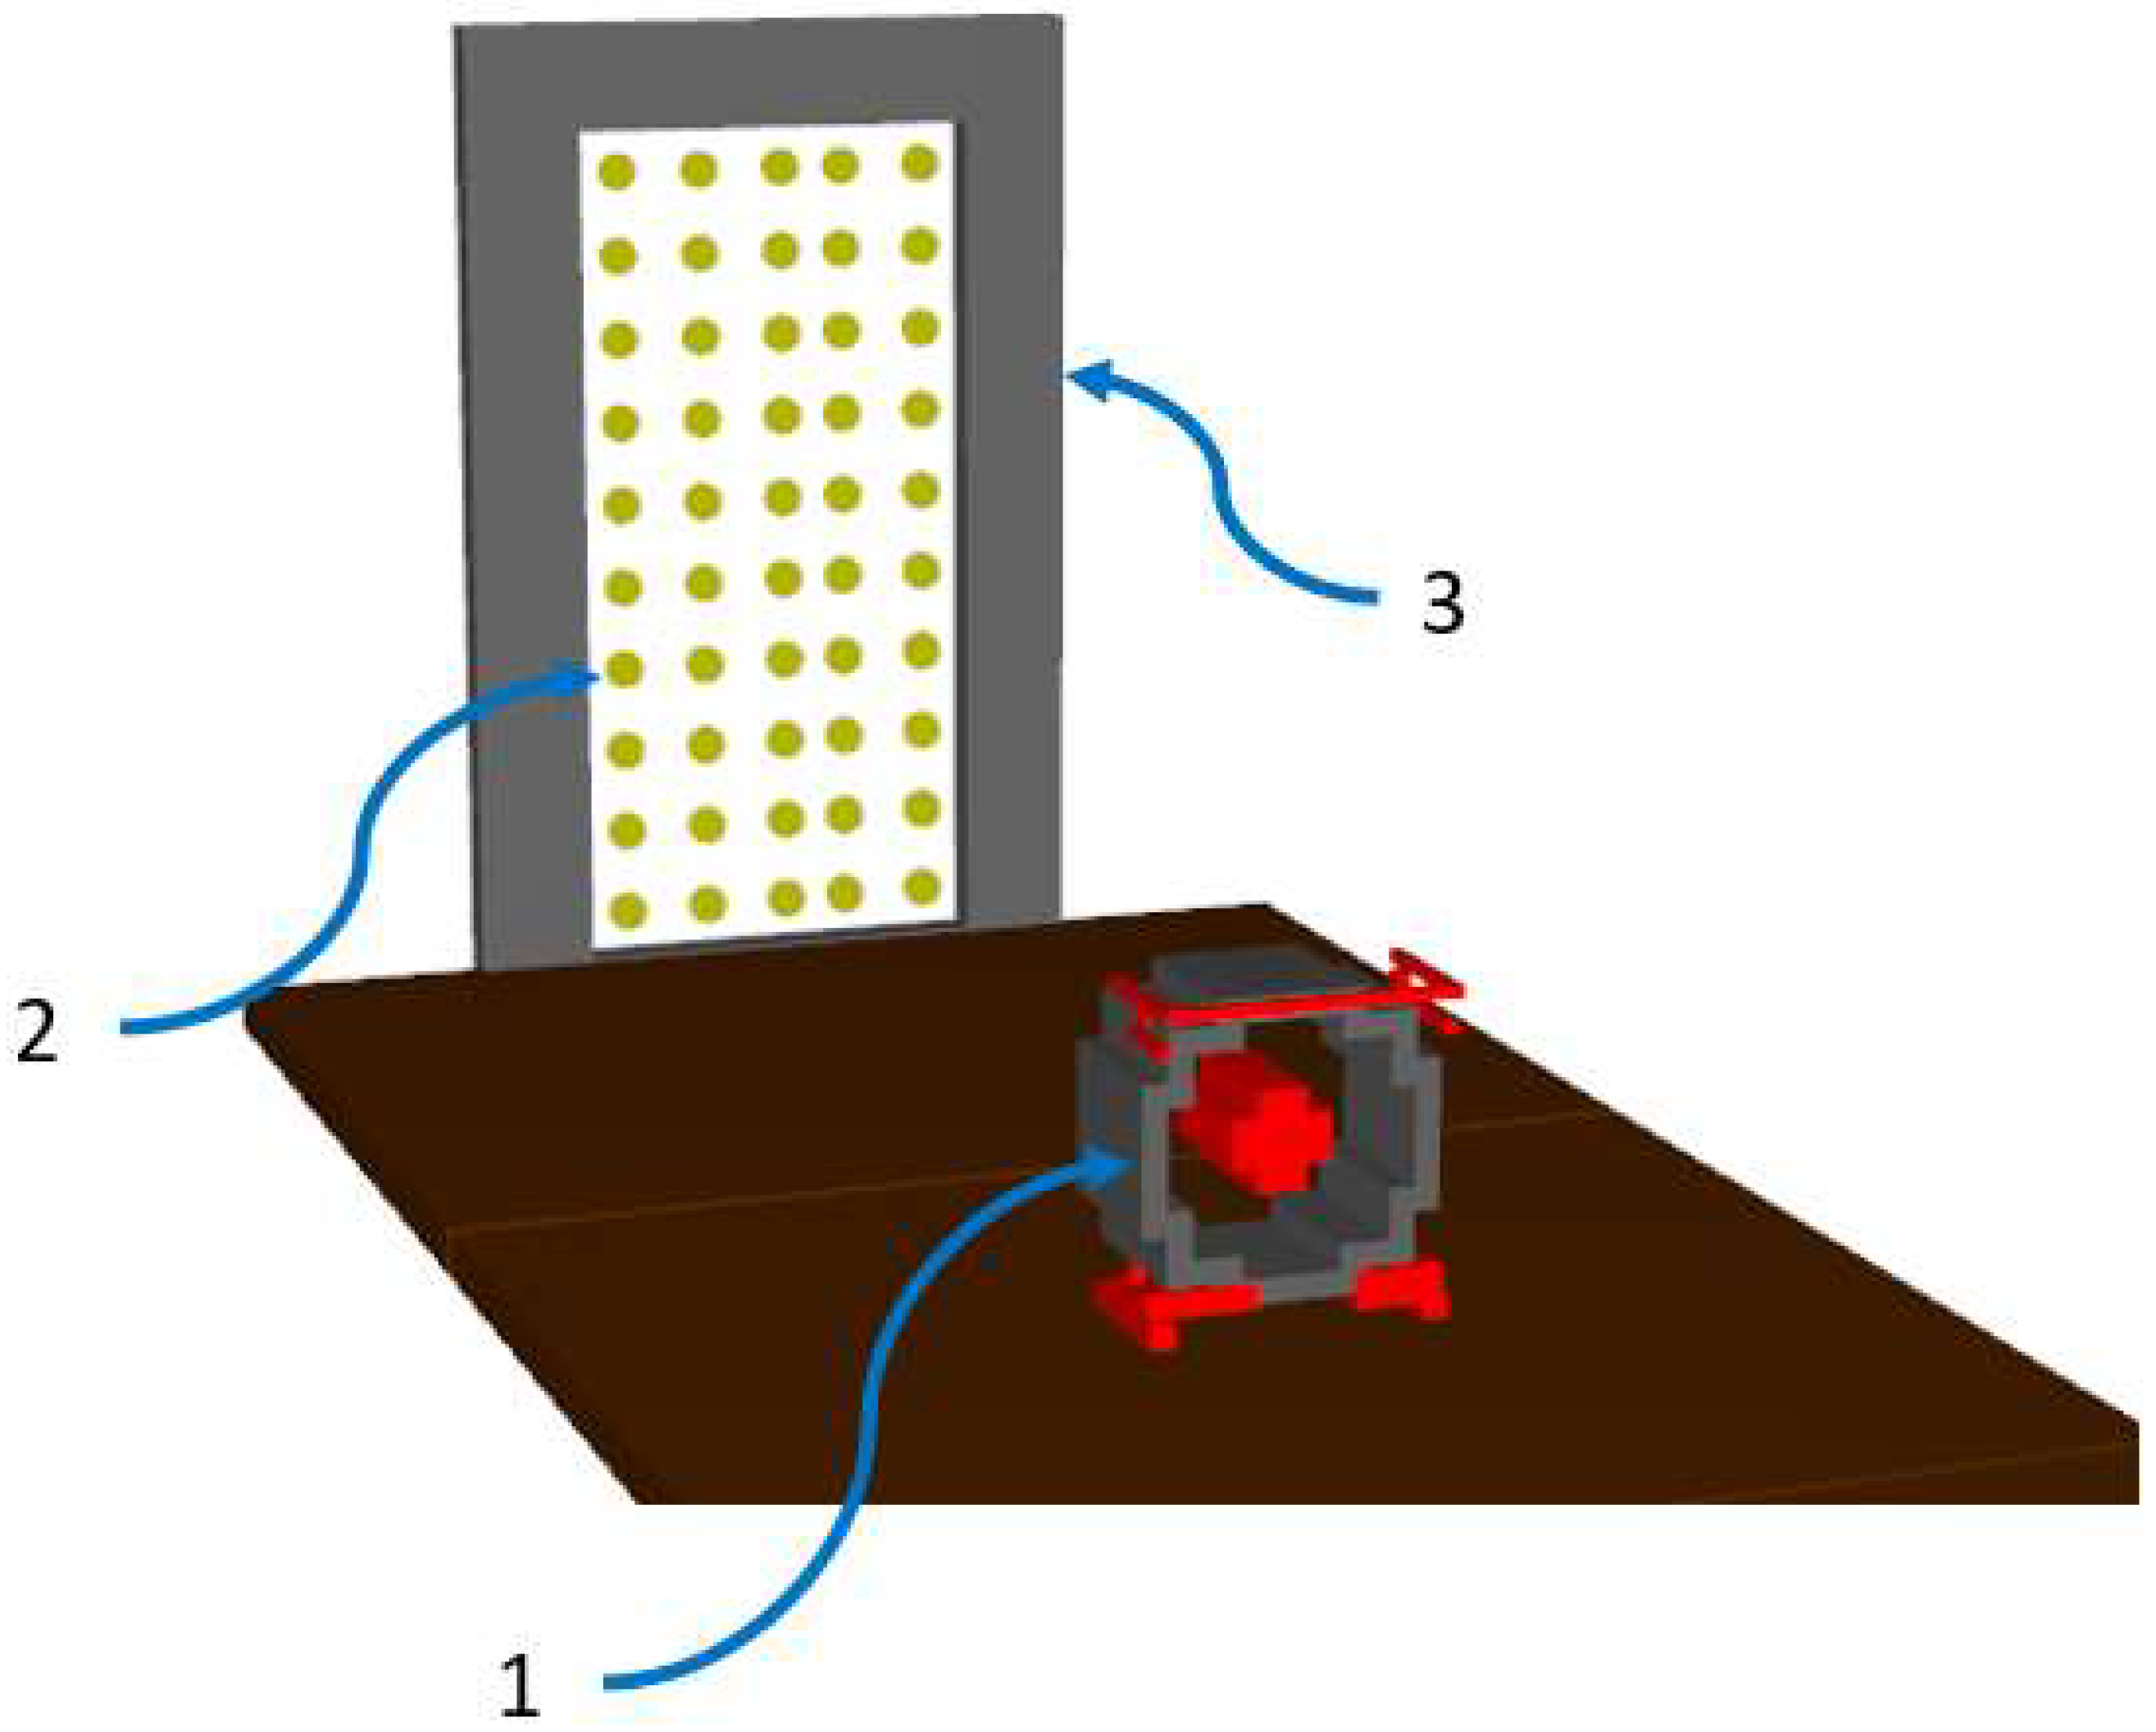
The remaining parameters of the model were as follows: atmospheric pressure: 1013.3 hPa; ambient temperature: 15 °C; primary materials used in the model construction: steel and wood; relative humidity: 50%; atmospheric temperature gradient: 0.03 K/m. The model was equipped (Figure 3) with measurement points to record the airflow velocity on the surface of the door opening (the same layout as in the experimental tests conducted in real-world conditions), with a total of 50 measurement points.

3. Results and Discussion

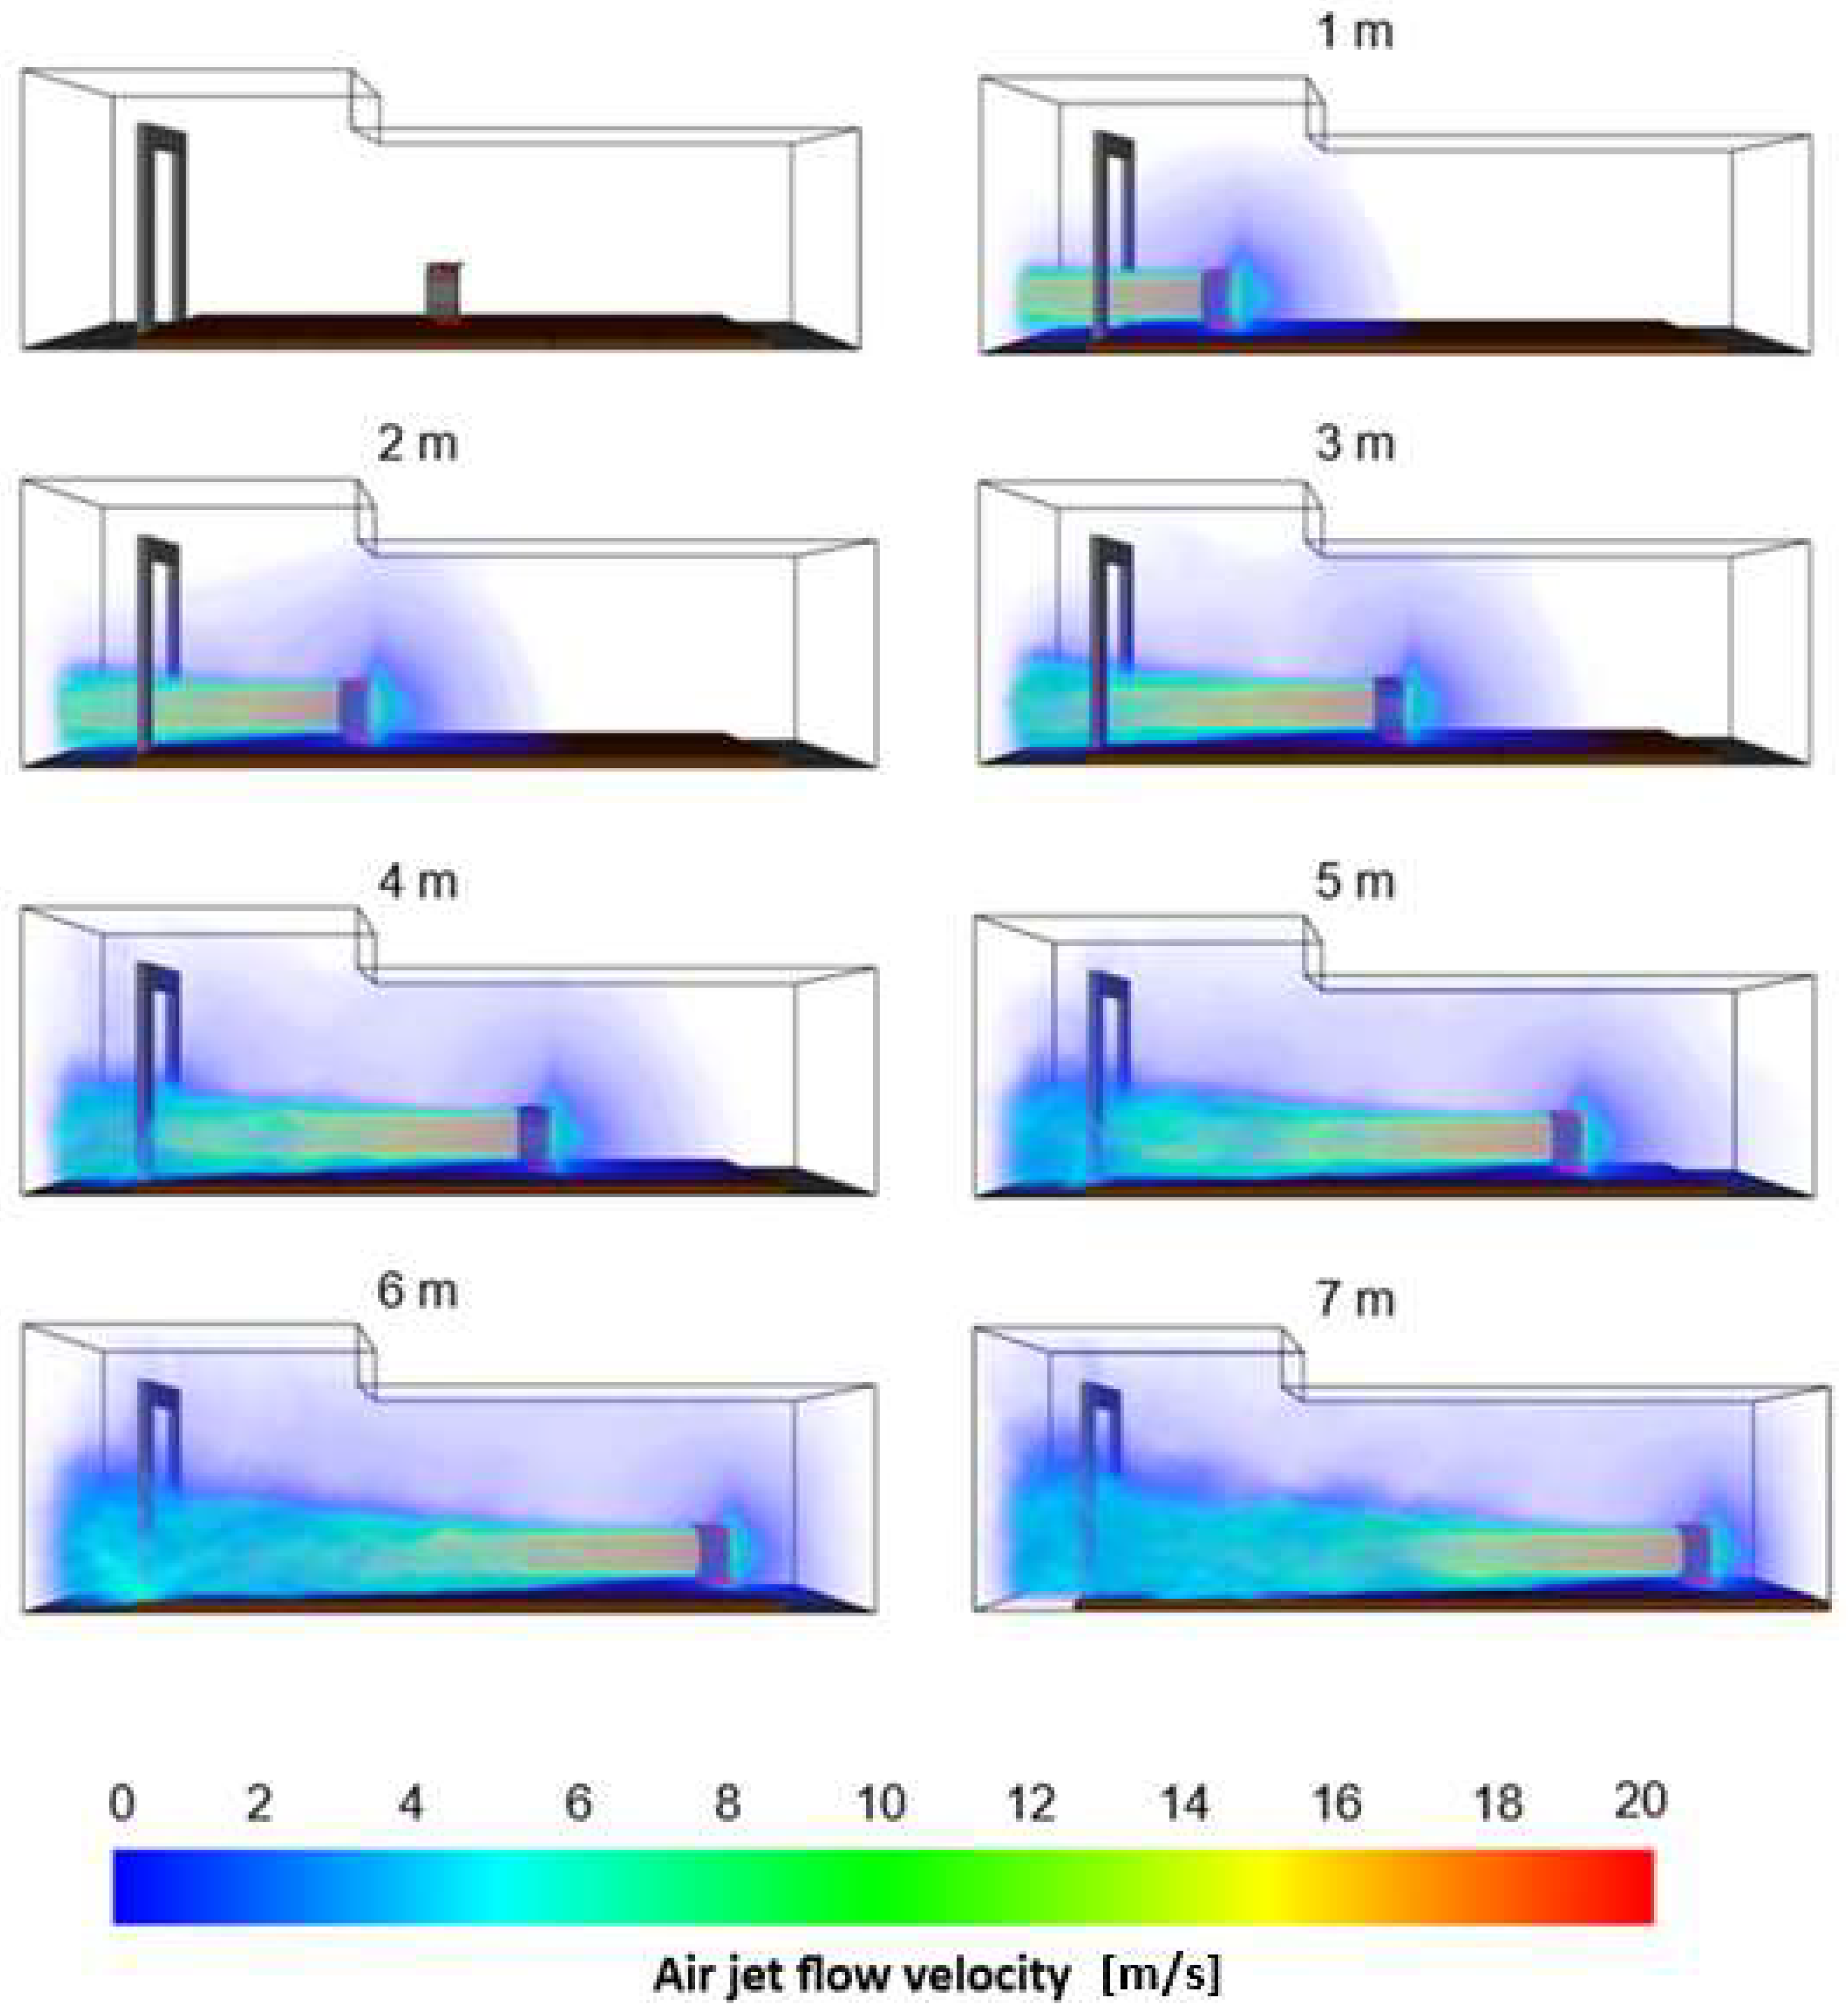
The result of volumetric flow rate depending on the positioning distance of the positive pressure ventilator (calculated based on the method described by Kaczmarzyk et al. in 2023) [27] is presented in Figure 4 and in Appendix A in Table A9. The visualization of the airflow generated by the ventilator in the CFD simulation is shown in Figure 5.
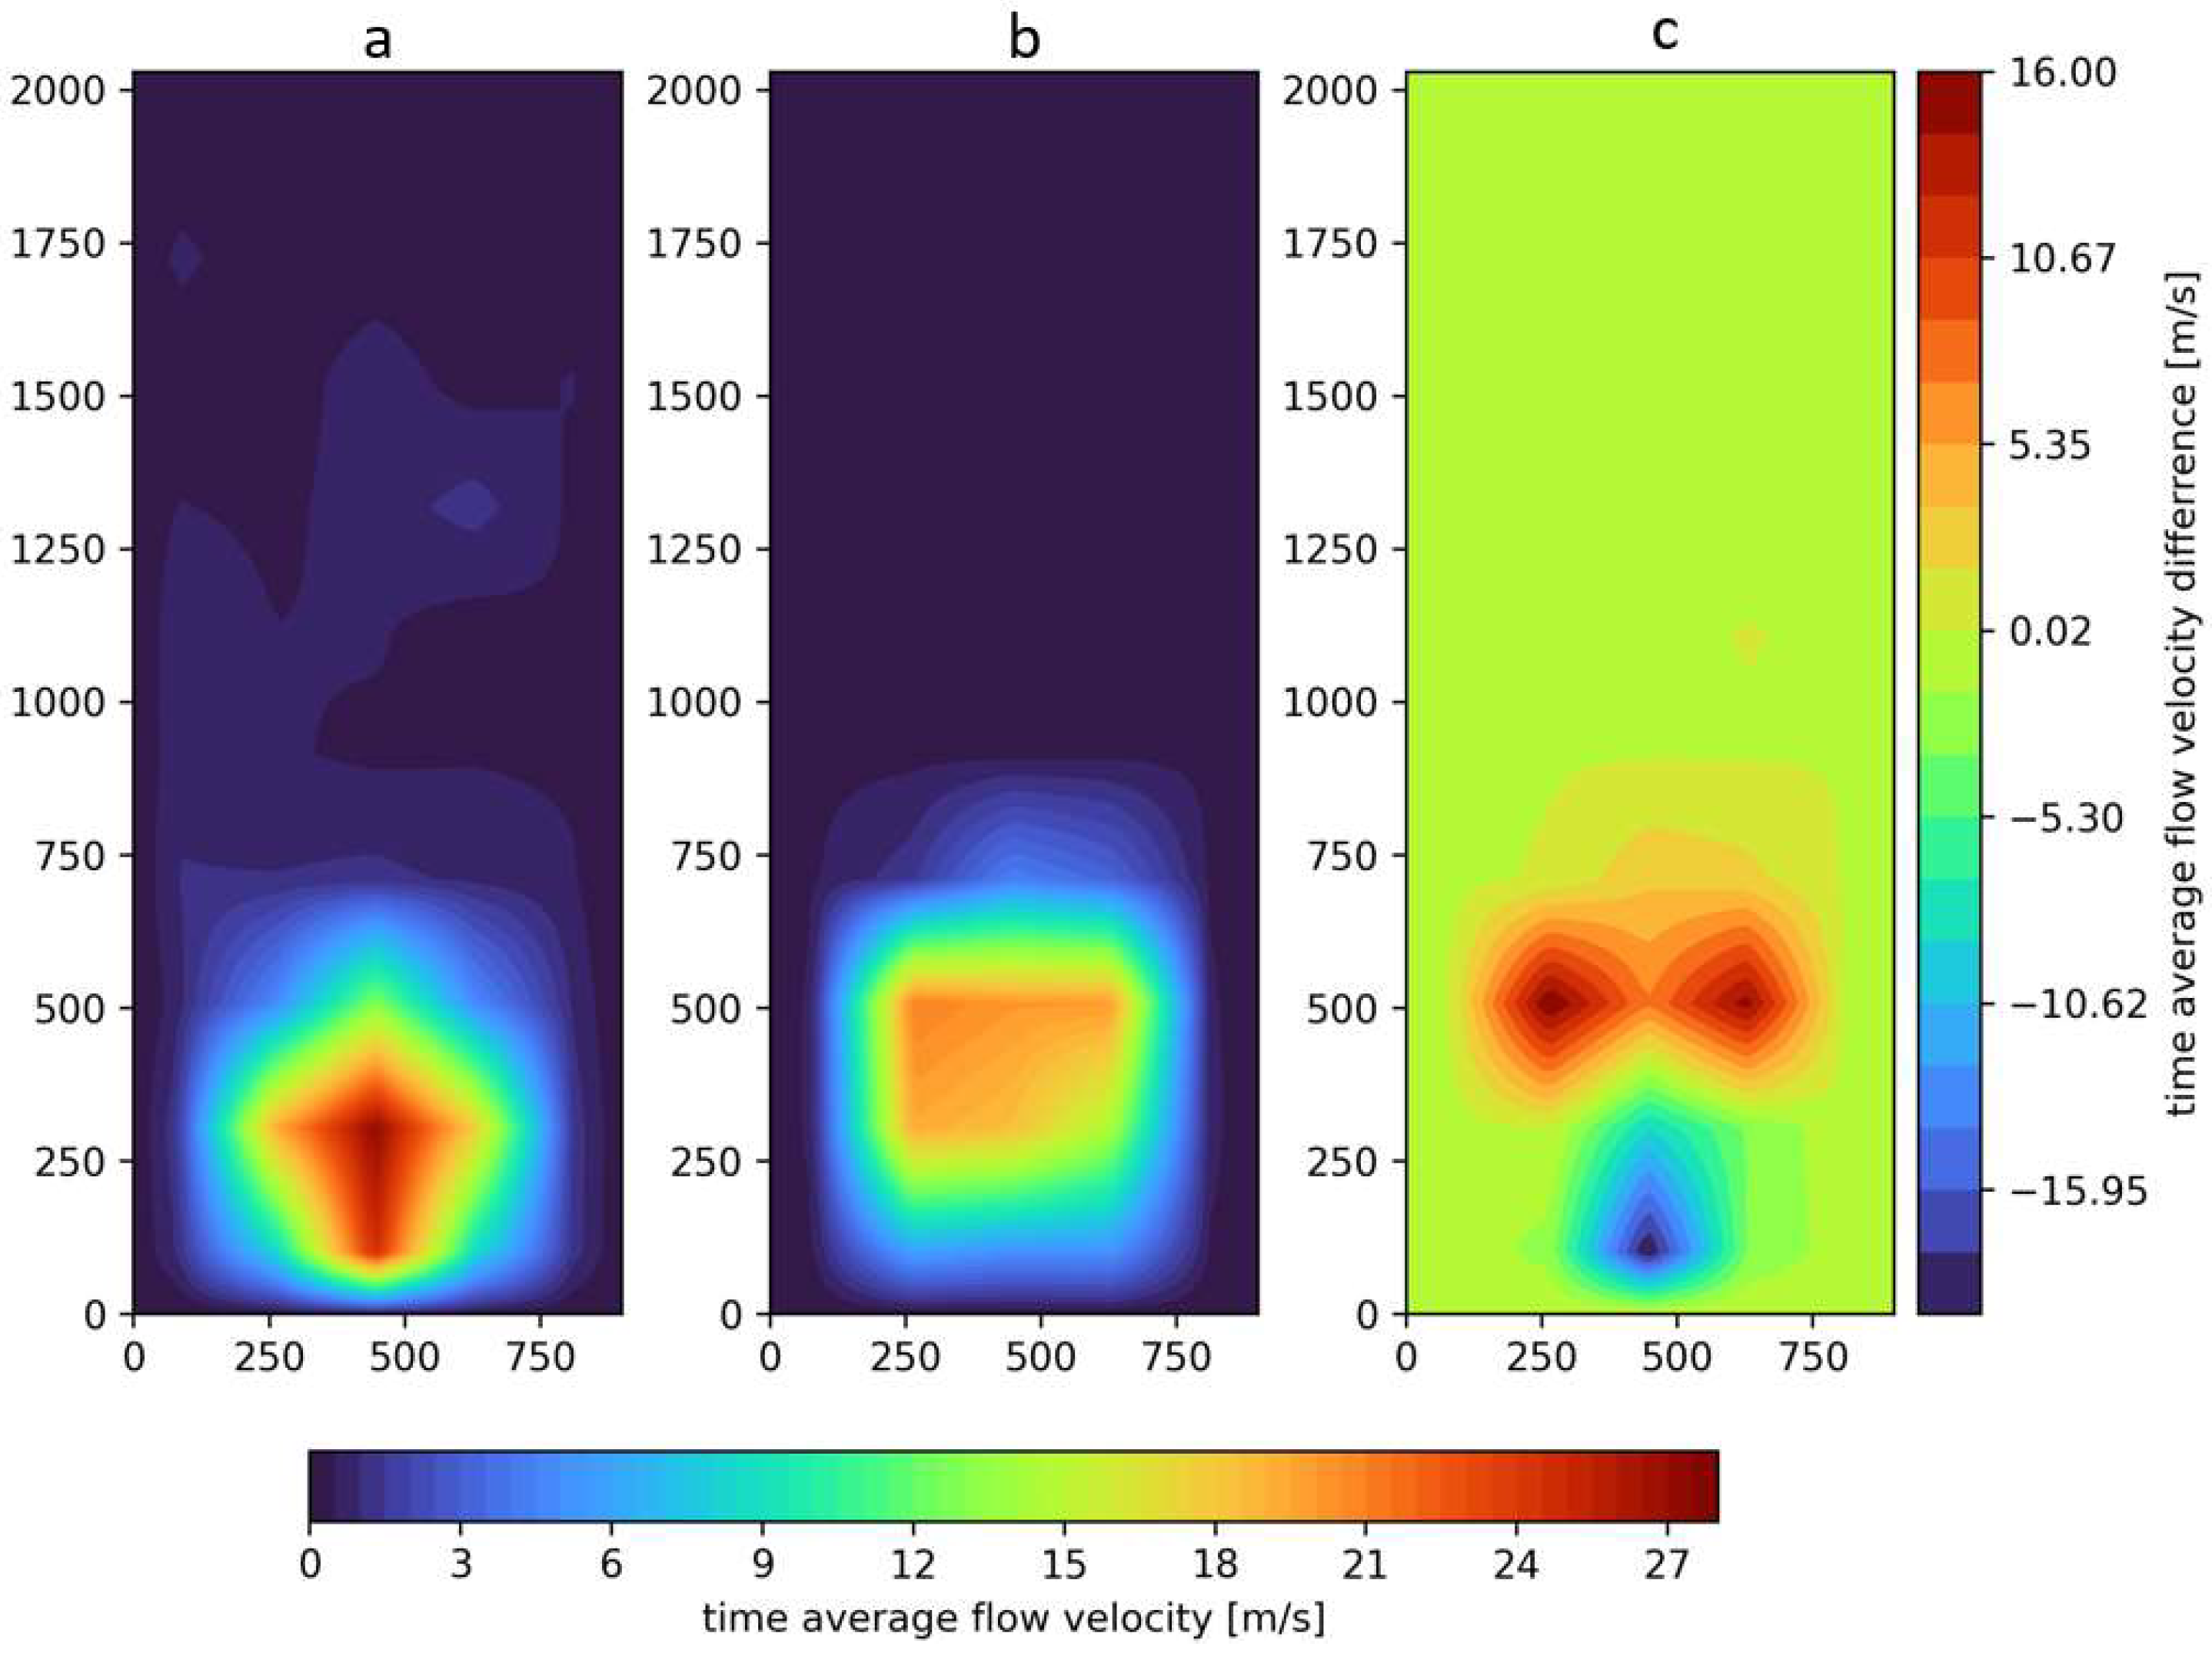
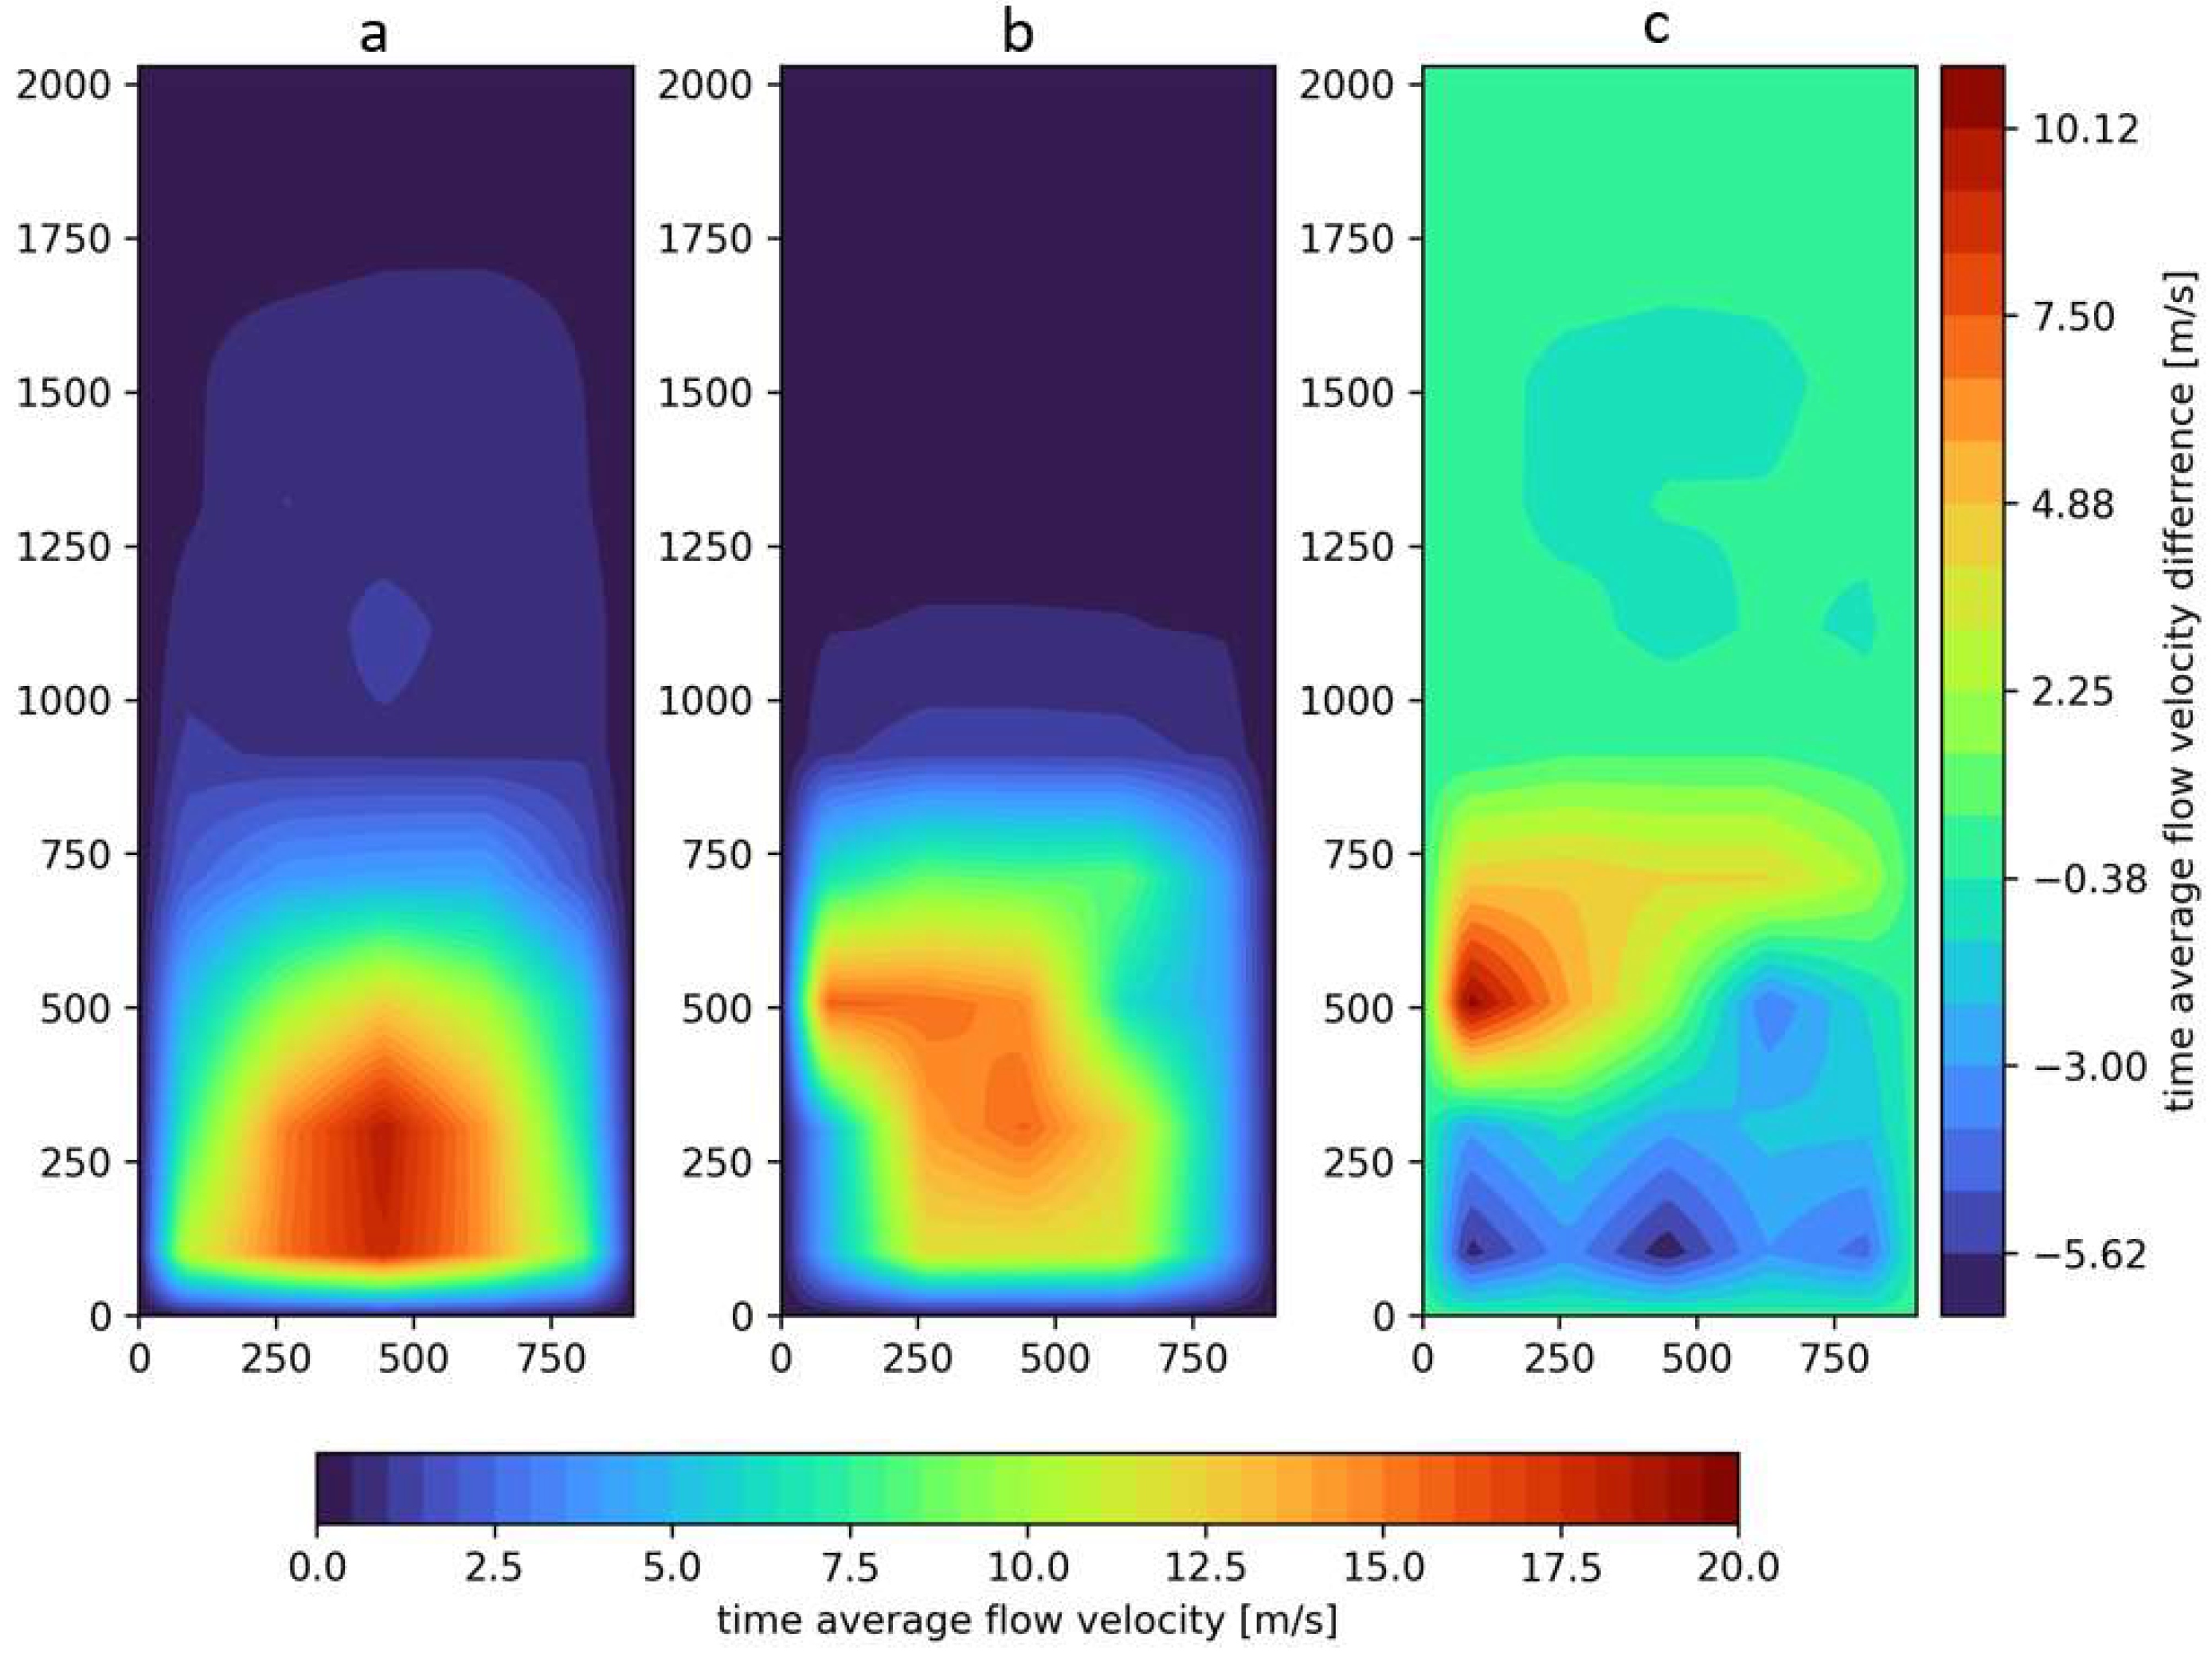
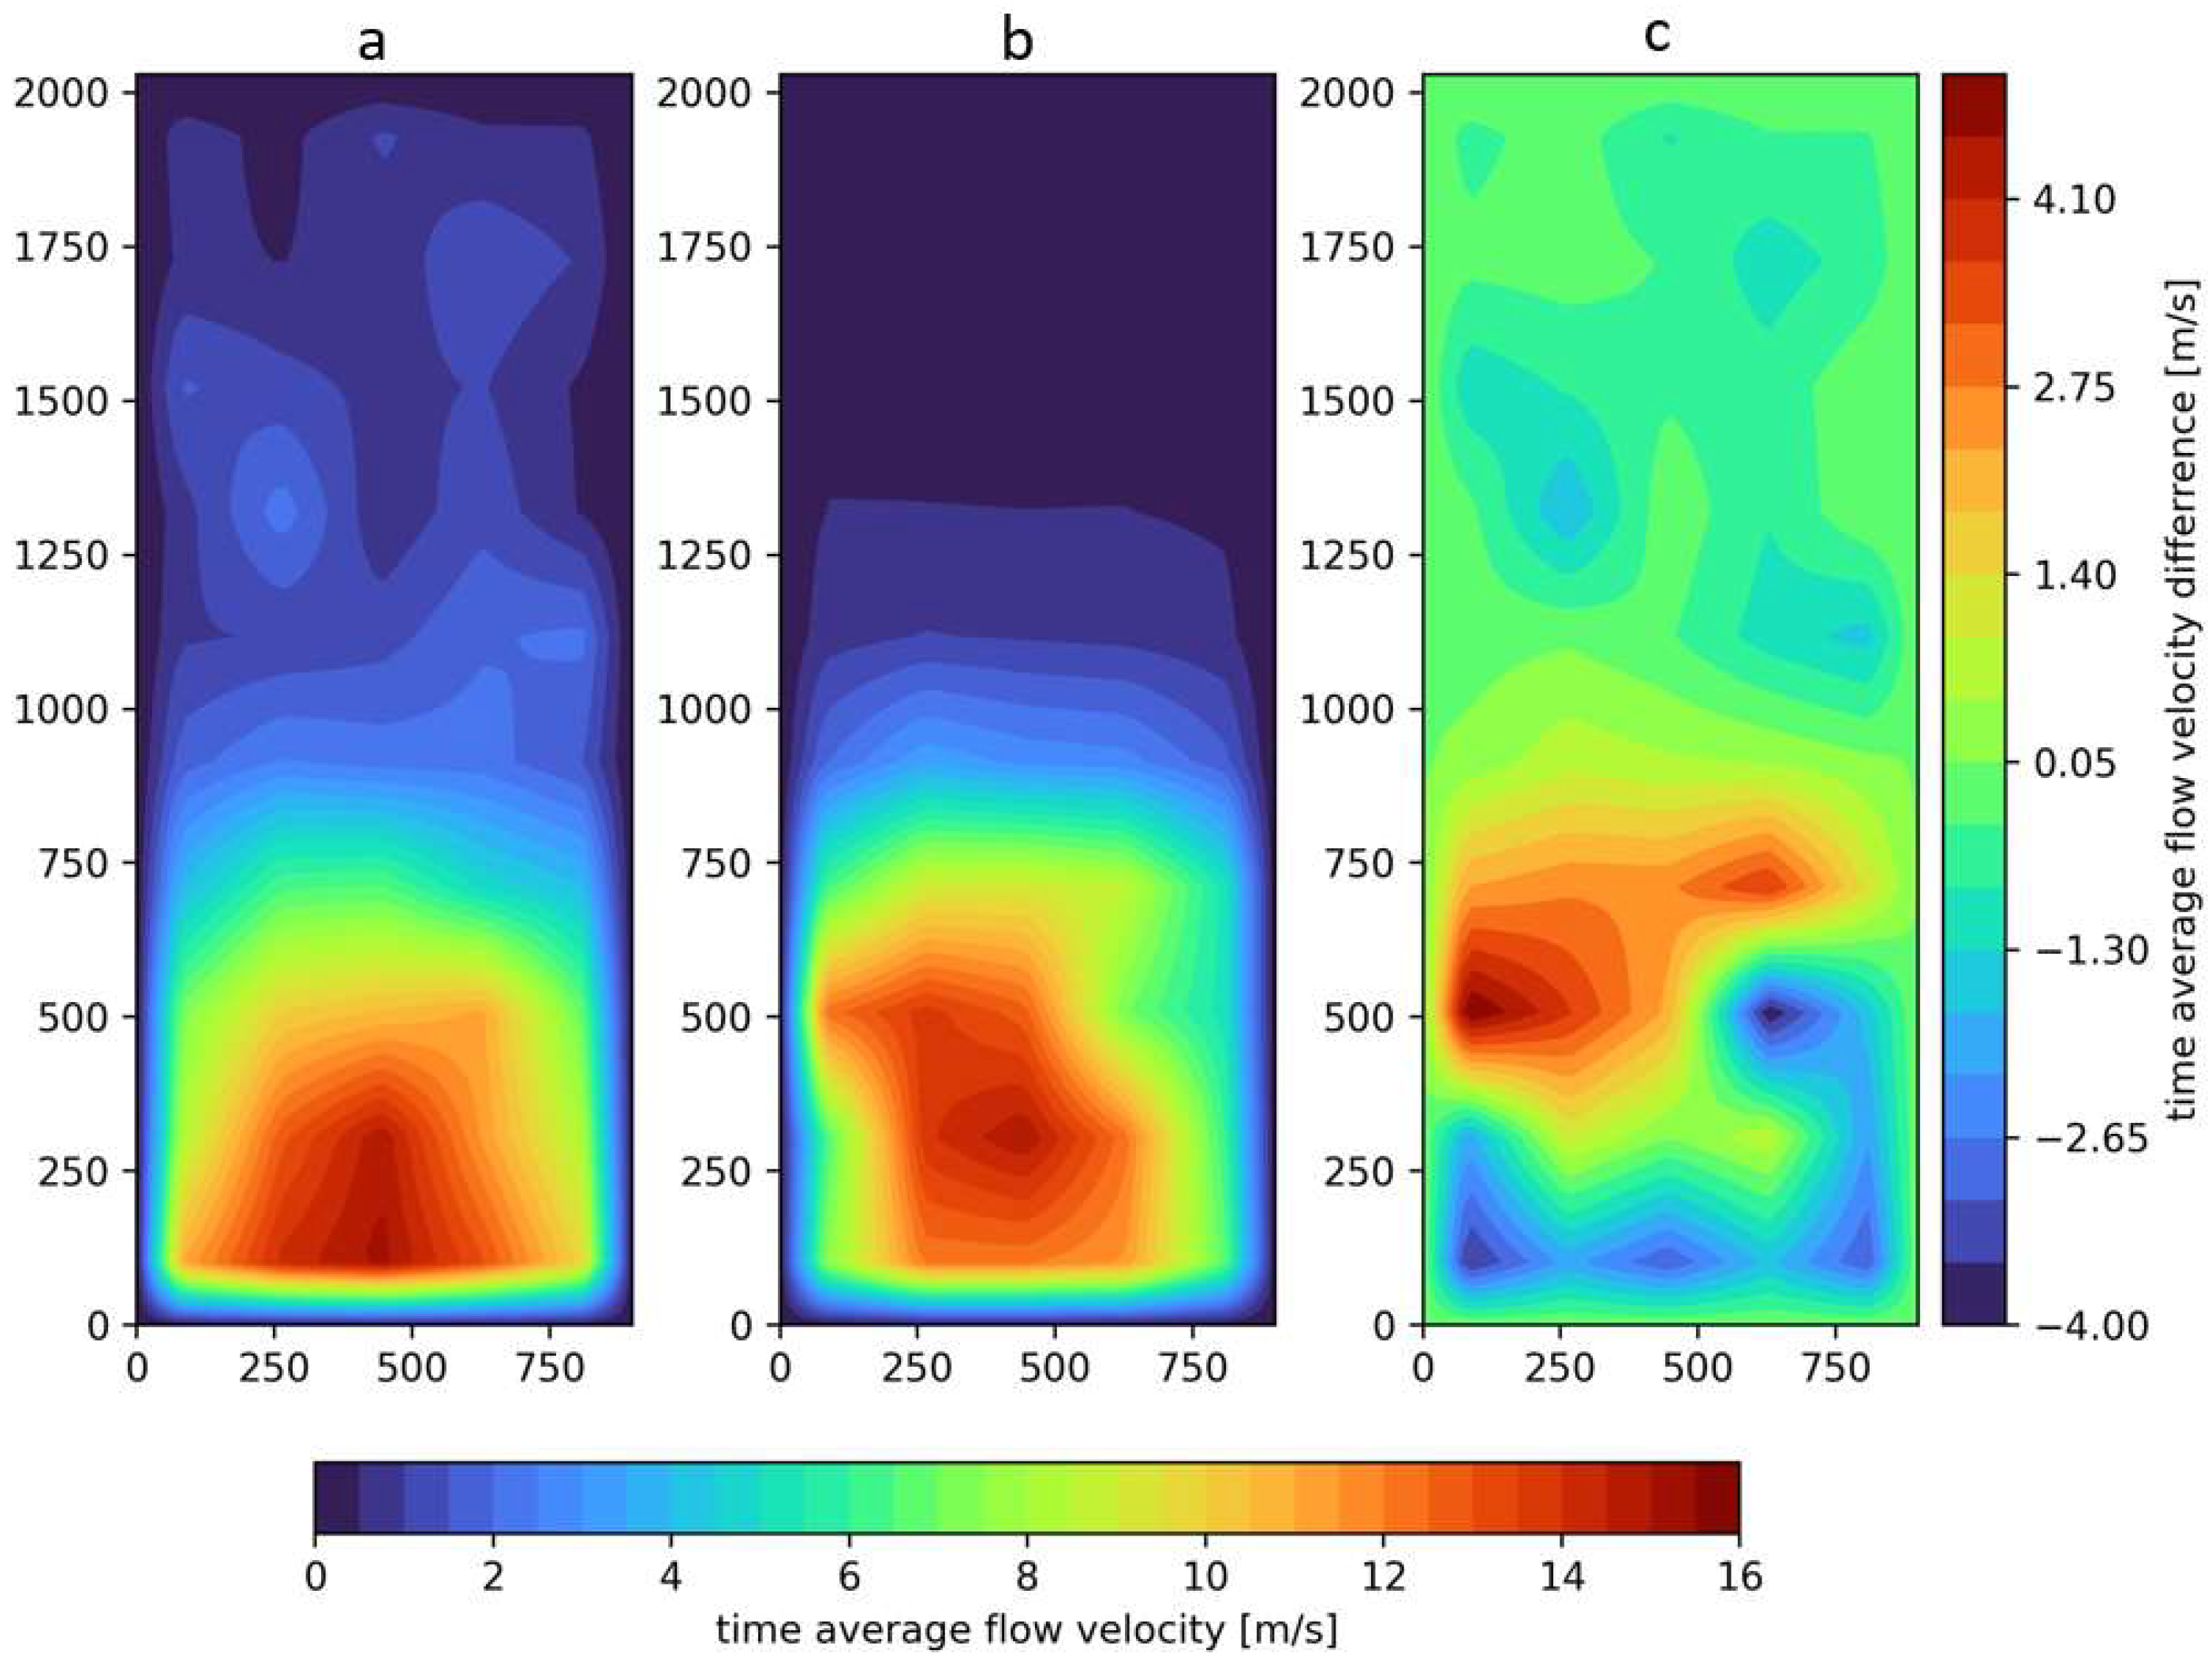
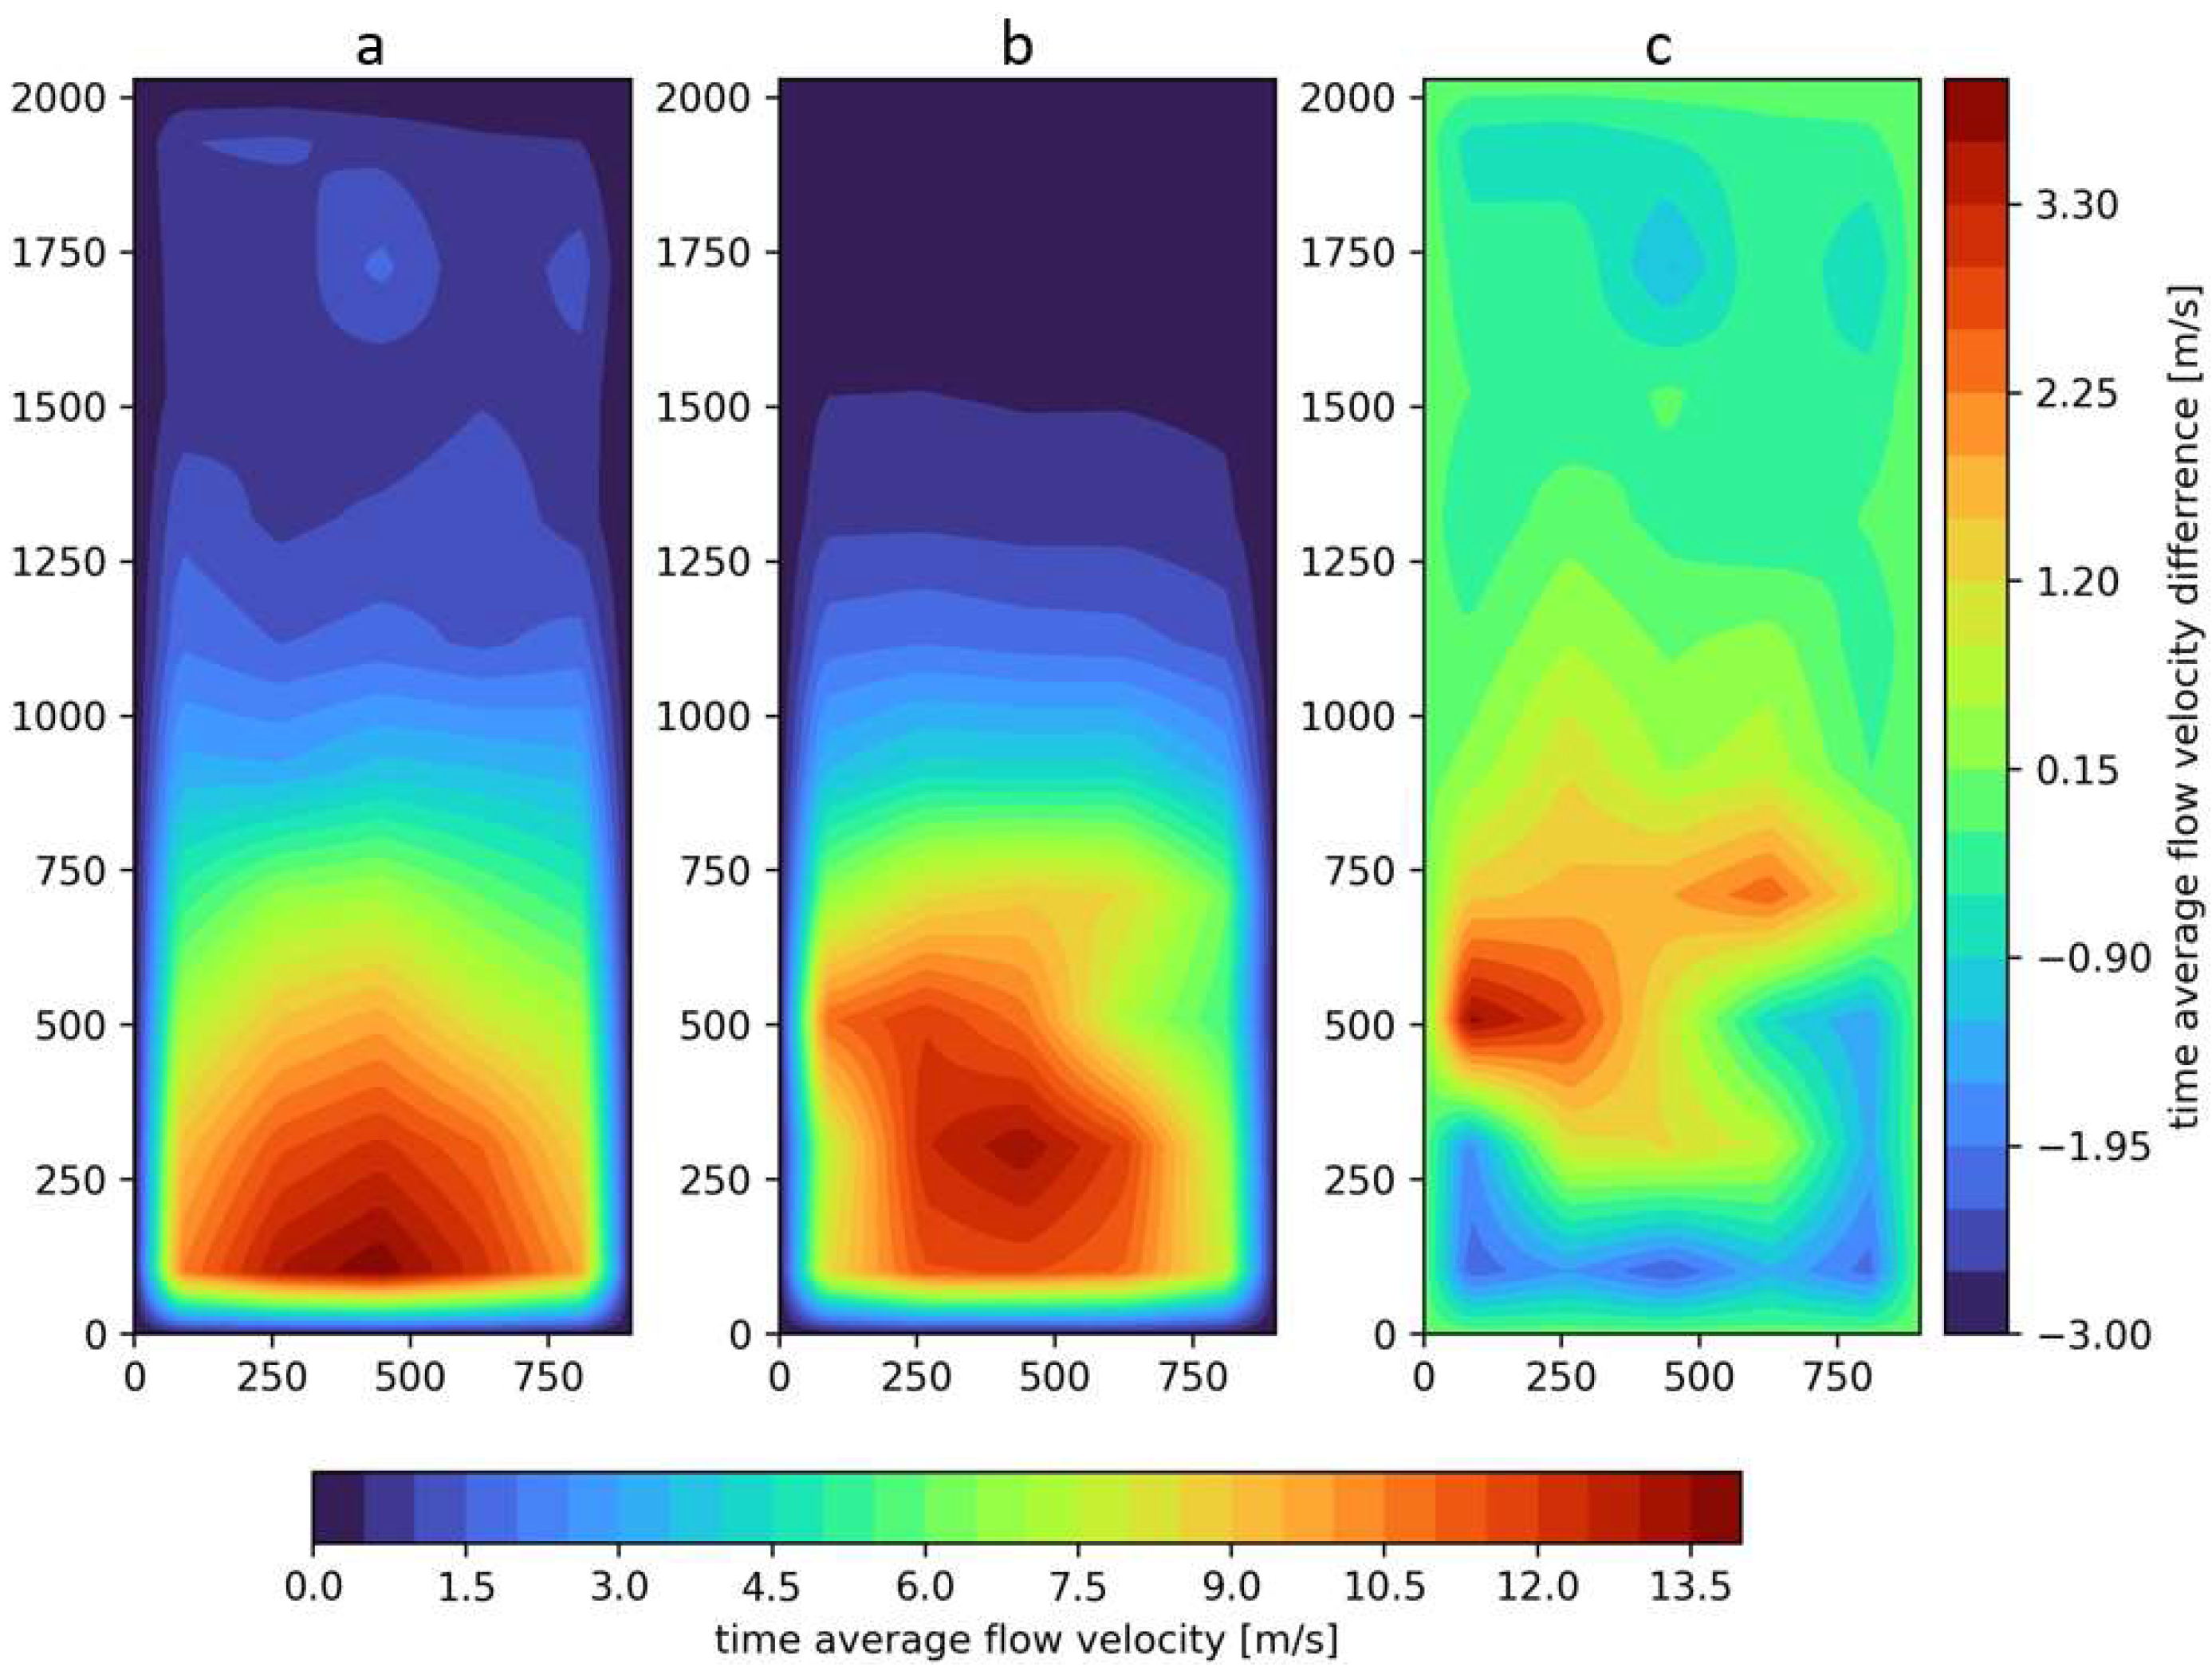
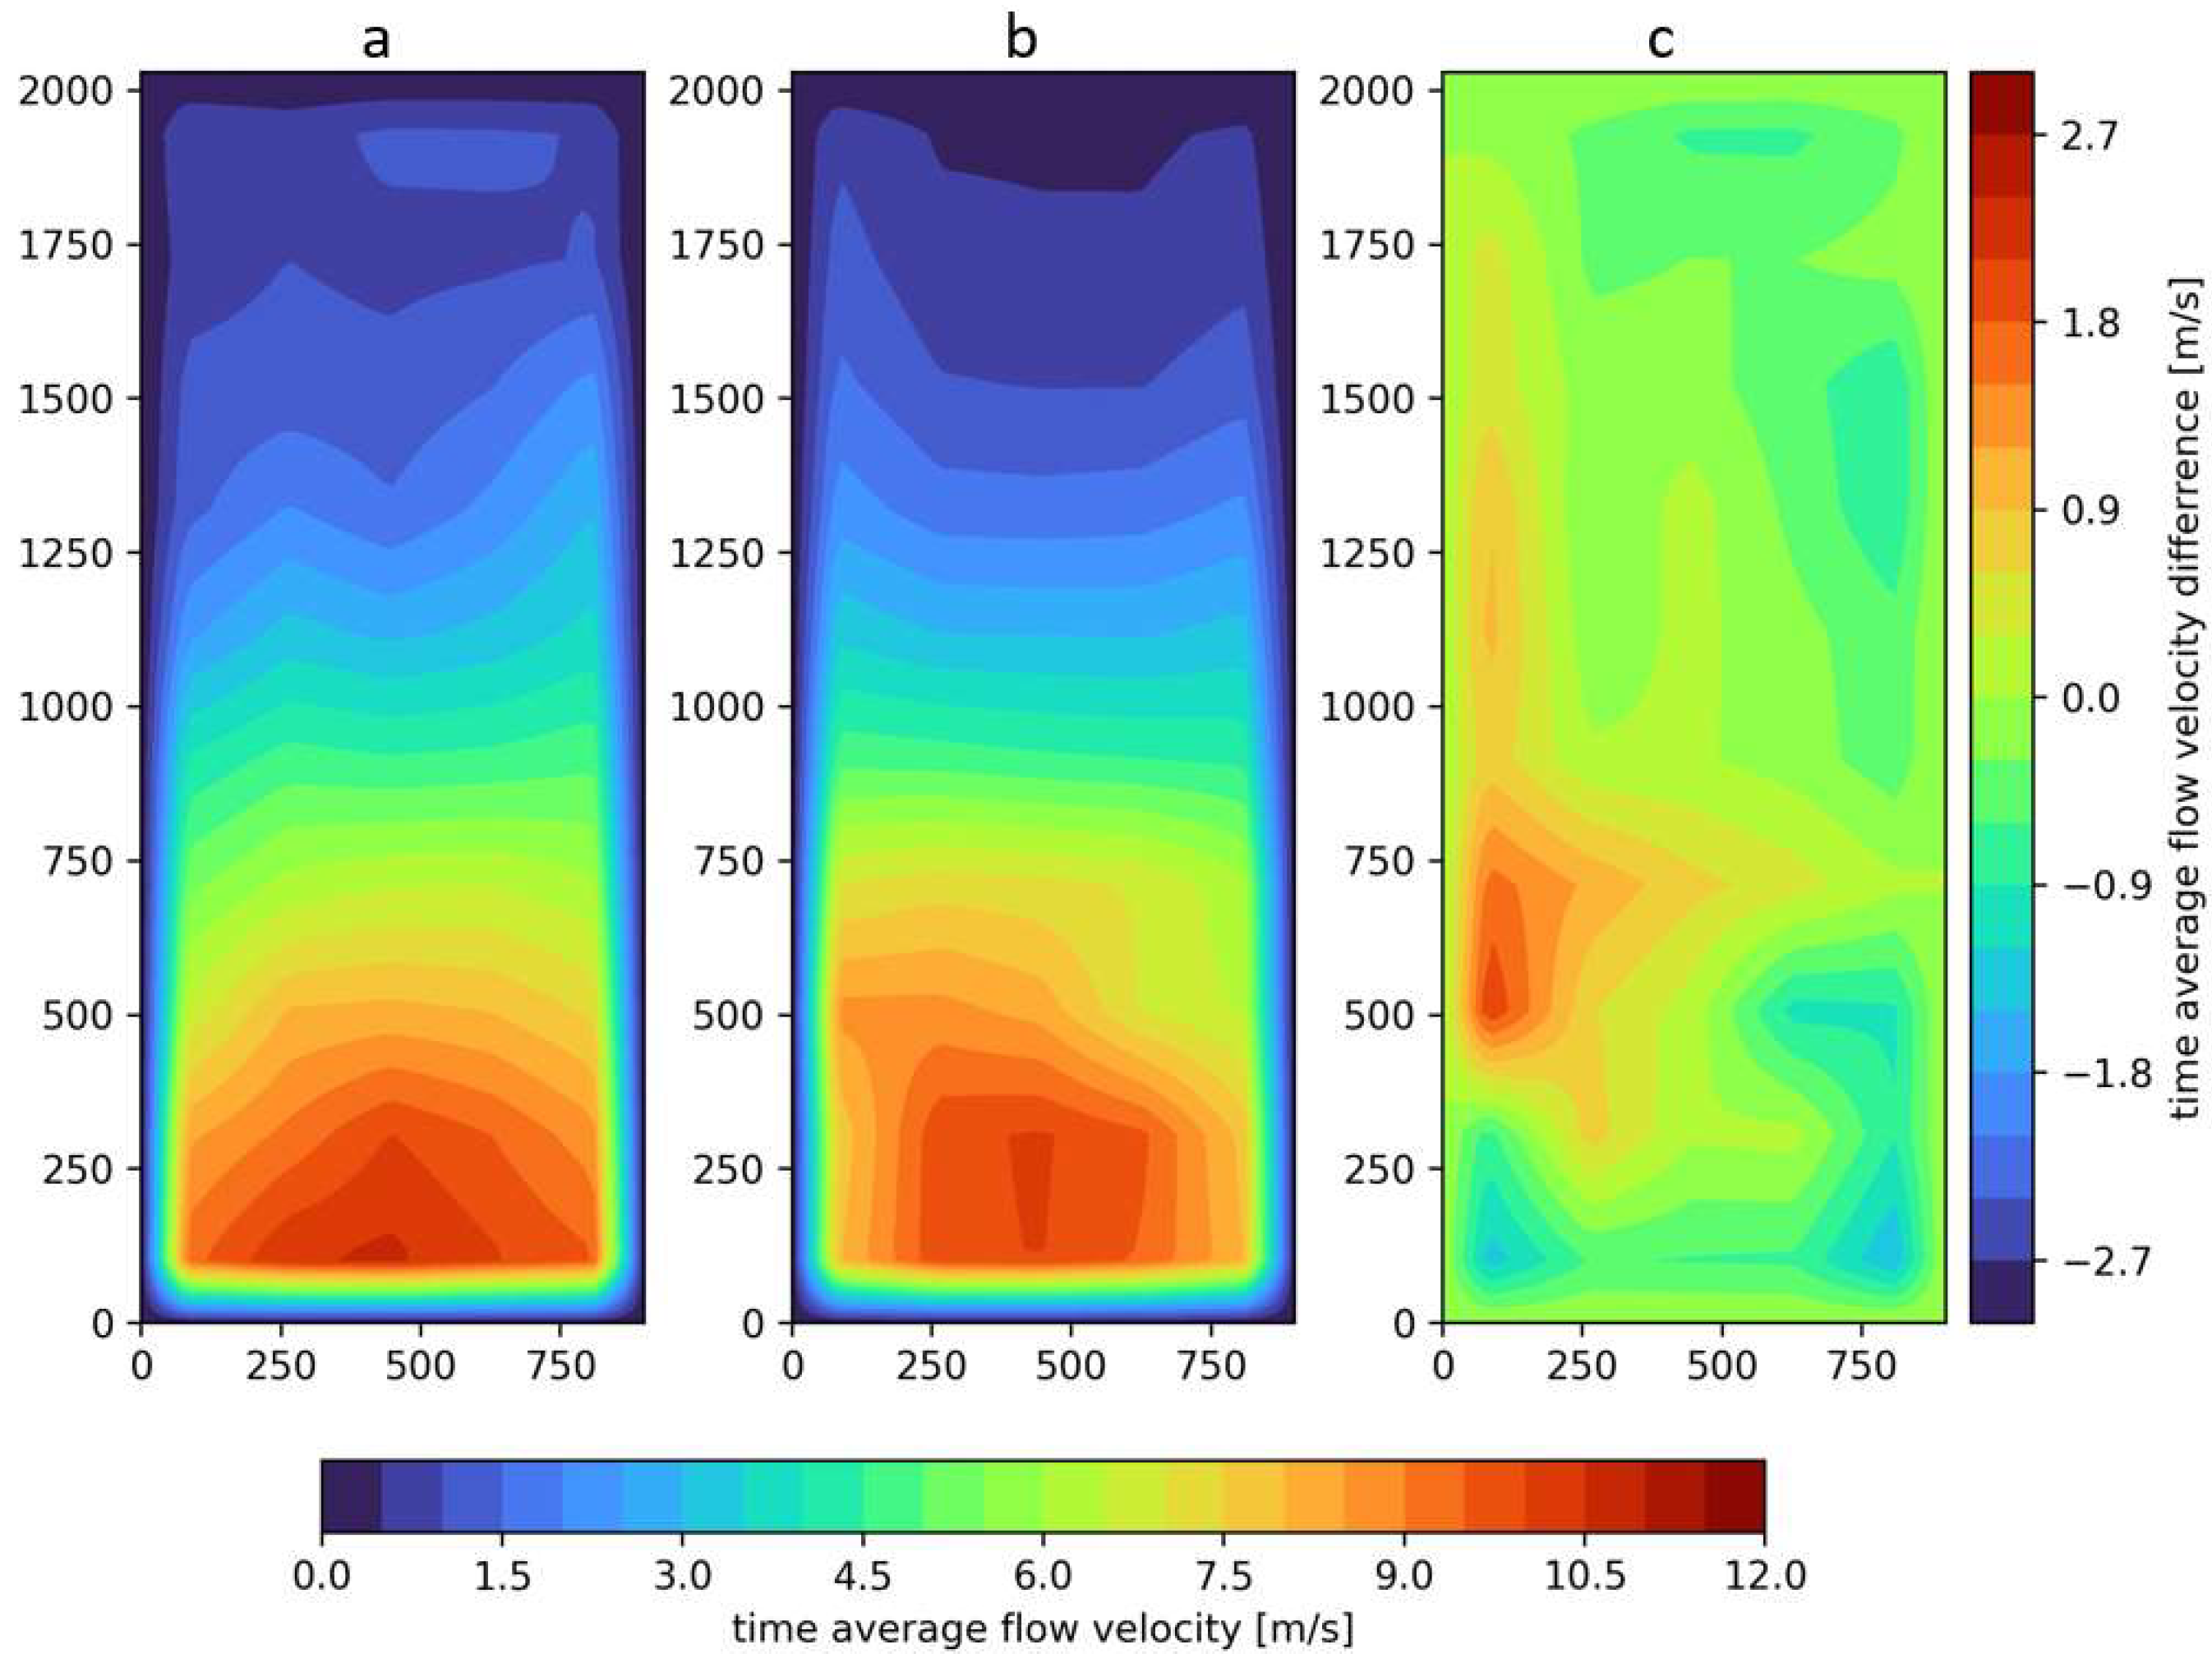
The results of the volumetric flow rate measurements taken in the immediate area of the ventilator’s impeller are presented in Appendix A in Table A1. The results of the velocity profile of the airflow measured on the surface of the mock-up of the door opening during experimental tests and CFD simulations are shown in Figure 6, Figure 7, Figure 8, Figure 9 and Figure 10. Due to the way the velocity profile results are presented in the figures, information on measurement accuracy is not indicated. These details are provided in Appendix A in Table A2, Table A3, Table A4, Table A5, Table A6, Table A7 and Table A8, which include the average values of the airflow velocity and measurement errors on the surface of the door opening.
The visualizations of the obtained results of the airflow velocity profile generated by the ventilator (Figure 6, Figure 7, Figure 8, Figure 9 and Figure 10) are presented. Larger differences are observed at closer positions of the ventilator, where large velocity gradients are observed at the door opening. As a result, the analysis with a fixed spatial resolution directly resolves a smaller part of the turbulent scales. In the case of larger distances between the ventilator and the door opening, where the shear layer is much thicker, this also leads to larger dominant vortical structures—the differences between CFD and experimental results are negligible. Importantly, the application of the boundary condition on the ventilator based on the measured velocity profile allows for high convergence of the volumetric flow rate in the mock-up of the door opening, regardless of the ventilator’s distance. In all of the investigated configurations (including the experiment, simulation, and various ventilator positioning distances), the airflow was concentrated in the lower area of the door opening (up to a height of 900 mm). Referring to the obtained volumetric flow rate values, it is indicated that the ventilator during the experimental tests generated the highest flow rate when positioned at a distance of 7 m (30.156 m3/h), while in the CFD simulation, the highest flow rate was at a distance of 6 m (29.397 m3/h). The lowest flow rate was obtained at a distance of 1 m. During the experiment, the ventilator pumped a flow of 20.123 m3/h, while during the simulation, it was 19.743 m3/h. Lambert and Merci conducted similar tests for ventilators that generated flow rates of 30.800 m3/h for gasoline engine-powered ventilators and 30.000 m3/h for electrically powered ventilators [39]. The results of studies conducted by Kaczmarzyk et al. in 2023 showed that the tested ventilators generated a volumetric flow rate ranging from 14.021 m3/h to 15.656 m3/h, depending on the type of ventilator [40].
In comparative considerations (between experimental studies and CFD analysis), the flow rate stream showed a level of convergence described by a percentage difference ranging from 1.6% (at a positioning distance of 4 m) to 3.8% (at 7 m). In 2003, Kerber and Walton were the first to present a method for assessing velocity profile parameters in free flow for positive pressure ventilators and conducted CFD simulations in free flow [21]. Their comparative analysis of the research and simulation results showed a level of convergence ranging from 3.1% to 14.7%, depending on the measurement distance. Referring to the obtained results of the velocity profile characteristics on the surface of the door opening and the achieved volumetric flow rate, it is also important to mention certain limitations of the given configuration. Specifically, the experiment was conducted in free flow (environment with constant pressure) on a mock-up simulating a door opening, without the volume of the structure directly behind the opening. The lack of counterpressure that would be exerted by the air exchange path of the ventilated building affects the flow rate values. Therefore, conclusions drawn from this type of research should be cautiously applied to cases involving ventilation of volumes that impose significant resistance to airflow (particularly when the air exchange path is long and/or has many constrictions). Considering the above, it should be noted that the method used does not allow for the evaluation of the volumetric flow rate under counterpressure conditions that occur in a building, and whose value will change depending on its construction and internal conditions generating resistance. However, for qualitative assessment of the coverage of the door opening by the ventilator’s airflow or determining optimal distances of the ventilator from the opening, this is a method that requires significantly fewer resources than replicating a series of variable flow characteristics for buildings.

4. Conclusions

Determining the correct operating position of the positive pressure ventilator at which it generates the highest flow rate can have an impact on the effectiveness of Fire Service rescue operations. Verification of the positioning parameters of positive pressure ventilators can be carried out using CFD tools and applying the LES model. As part of this work for the ventilator, a comparative analysis was carried out to assess the degree of convergence of the volumetric flow rate parameter during both a real-scale experiment and a CFD simulation on a dedicated test rig. The analysis performed confirmed the convergence of the incoming flow parameter to the surface of the mock-up doorway installed on the test stand. Under the presented test conditions, the following degrees of convergence were obtained between the experiment and CFD simulation (for variable positioning parameters): 1.9% (1 m), 3.4% (3 m), 1.6% (4 m), 1.6% (5 m), and 3.8% (7 m). The performed analysis confirms the feasibility of using an LES-type model to evaluate the volumetric flow rate under constant pressure conditions—a test configuration corresponding to the actual operating conditions of this type of equipment. An important aspect of the use of LES-type numerical analyses is that, in addition to determining the value of the flow rate, they reproduce relationships that allow practical conclusions to be drawn, such as the optimum distance for ventilator positioning or the geometric distribution of velocity on the control surface, which is often more important to the ventilator user than the value of the pumped flow rate itself. The author team declares to continue the development of work related to the evaluation of the applicability of LES-type analyses in relation to other methods used for testing the flow parameters of positive pressure ventilators (e.g., ANSI/AMCA-240 [29] and ISO 5801 standards [41]). As part of the implementation, in addition to changing the measurement methods, other CFD simulation tools such as Ansys Fluent and OpenFoam will also be used.

Author Contributions

Conceptualization, P.K., B.Z., Ł.W. and T.B.; methodology, P.K., B.Z. and Ł.W.; software, P.K., T.P. and T.S.; validation, P.K., B.Z., Ł.W. and T.B.; formal analysis, P.K., B.Z., Ł.W. and T.B.; investigation, P.K., P.A. and Ł.W.; resources, P.K. and Ł.W.; data curation, P.K. and B.Z.; writing—original draft preparation, P.K., B.Z. and Ł.W.; writing—review and editing, P.K., B.Z., Ł.W. and P.A.; visualization, P.K.; supervision, P.K. and B.Z.; project administration, P.K.; funding acquisition, P.K. All authors have read and agreed to the published version of the manuscript.

Funding

The research presented in the article was carried out within the framework of the subsidy of the Ministry of Science and Higher Education, No. 068/BW/CNBOP-PIB/MNiSW.

Institutional Review Board Statement

Not applicable.

Informed Consent Statement

Not applicable.

Data Availability Statement

The original contributions presented in this study are included in the article. Further inquiries can be directed to the corresponding author.

Conflicts of Interest

The authors declare no conflicts of interest.

Appendix A

Table A1. Value of the volumetric flow rate generated by the positive pressure ventilator, measured at the rotor surface at distances of 50 and 100 mm, where AVG—arithmetic mean of flow rat; SD—standard deviation taken as measurement error.
Measurement Distance from the Rotor Surface
[mm]
Flow Rate Obtained by Positive Pressure Ventilator [m3/h]
AVGSD
5012,541404
10012,482314
Table A2. Airflow velocity in the door opening for experimental studies and CFD simulation (distance 1 m), where x—position of the measuring point in relation to the x-axis; y—position of the measuring point in relation to the y-axis; AVG—arithmetic mean of the flow rate; SD—standard deviation taken as the measurement error.
Distance of the Positive Pressure Ventilator from the Door Opening (1 m)
Casex (mm)
91273455637819
AVGSDAVGSDAVGSDAVGSDAVGSD
y (mm)101.5EXP1.000.938.260.2824.910.358.670.341.241.00
CFD0.40 5.82 4.99 5.20 0.44
304.5EXP1.380.7719.290.7727.270.6217.740.631.331.38
CFD0.68 19.38 18.41 14.39 0.71
507.5EXP0.720.704.790.6112.920.764.860.590.900.72
CFD0.68 21.05 20.09 20.01 0.63
710.5EXP1.030.521.020.941.150.960.860.450.551.03
CFD0.45 1.33 4.35 3.24 0.43
913.5EXP0.850.490.560.530.410.490.460.580.430.85
CFD0.37 0.36 0.34 0.38 0.36
1116.5EXP0.880.220.510.200.550.570.240.530.440.43
CFD0.32 0.30 0.29 0.31 0.31
1319.5EXP0.520.200.390.430.730.131.200.620.420.07
CFD0.27 0.25 0.25 0.25 0.270.27
1522.5EXP0.220.350.230.300.770.700.290.390.530.12
CFD0.24 0.23 0.24 0.22 0.220.24
1725.5EXP0.600.260.200.100.240.390.210.270.290.30
CFD0.23 0.21 0.22 0.22 0.23
1928.5EXP0.200.330.190.060.160.470.200.210.220.14
CFD0.12 0.10 0.10 0.11 0.10
Table A3. Airflow velocity in the door opening for experimental studies and CFD simulation (distance 1 m), where x—position of the measuring point in relation to the x-axis; y—position of the measuring point in relation to the y-axis; AVG—arithmetic mean of the flow rate; SD—standard deviation taken as the measurement error.
Distance of the Positive Pressure Ventilator from the Door Opening (2 m)
Casex (mm)
91273455637819
AVGSDAVGSDAVGSDAVGSDAVGSD
y (mm)101.5CFD0.11-0.08-0.09-0.08-0.09-
304.5EXP0.21-0.19-0.20-0.19-0.21-
507.5CFD0.22-0.25-0.26-0.23-0.22-
710.5CFD0.24-0.29-0.30-0.26-0.25-
913.5CFD0.29-0.35-0.37-0.33-0.30-
1116.5CFD0.41-0.60-0.62-0.54-0.40-
1319.5CFD1.49-7.44-8.06-6.07-1.49-
1522.5CFD4.02-18.28-18.62-17.48-4.46-
1725.5CFD2.29-18.26-18.25-12.94-2.34-
1928.5CFD0.93-9.31-11.62-7.94-0.84-
Table A4. Airflow velocity in the door opening for experimental studies and CFD simulation (distance 3 m), where x—position of the measuring point in relation to the x-axis; y—position of the measuring point in relation to the y-axis; AVG—arithmetic mean of the flow rate; SD—standard deviation taken as the measurement error.
Distance of the Positive Pressure Ventilator from the Door Opening (3 m)
Casex (mm)
91273455637819
AVGSDAVGSDAVGSDAVGSDAVGSD
y (mm)101.5EXP10.630.9315.310.2818.000.3514.440.348.740.49
CFD4.47-11.71-11.99-11.99-3.39-
304.5EXP7.210.7714.950.7718.480.6214.360.636.670.55
CFD5.06-14.06-15.68-12.11-3.47-
507.5EXP4.960.709.590.6112.580.7610.120.595.480.70
CFD7.63-15.30-16.47-15.66-6.20-
710.5EXP2.120.523.880.944.190.964.310.451.780.43
CFD3.23-8.60-8.05-8.14-4.34-
913.5EXP1.130.490.900.530.880.490.840.580.940.36
CFD0.76-1.64-1.61-1.48-0.87-
1116.5EXP0.750.220.620.201.200.570.780.530.930.43
CFD0.52-0.62-0.56-0.59-0.59-
1319.5EXP0.370.201.020.430.700.130.720.620.570.07
CFD0.35 -0.40-0.42-0.35-0.33-
1522.5EXP0.400.350.830.300.930.700.790.390.500.12
CFD0.25 -0.31-0.33-0.32-0.28-
1725.5EXP0.370.260.310.100.430.390.460.270.420.30
CFD0.24-0.24-0.25-0.15-0.24-
1928.5EXP0.400.330.290.060.270.470.230.210.250.14
CFD0.09 -0.11-0.11-0.11-0.13-
Table A5. Airflow velocity in the door opening for experimental studies and CFD simulation (distance 4 m), where x—position of the measuring point in relation to the x-axis; y—position of the measuring point in relation to the y-axis; AVG—arithmetic mean of the flow rate; SD—standard deviation taken as the measurement error.
Distance of the Positive Pressure Ventilator from the Door Opening (4 m)
Casex (mm)
91273455637819
AVGSDAVGSDAVGSDAVGSDAVGSD
y (mm)101.5EXP10.990.9314.190.2815.190.3513.120.349.800.49
CFD11.65 11.02 11.22 4.32 4.40
304.5EXP8.250.7712.820.7714.880.6211.410.638.220.55
CFD13.69 15.52 12.52 3.90 16.55
507.5EXP7.160.7010.010.6110.540.7611.080.596.830.70
CFD9.32 16.51 15.47 4.84 3.98
710.5EXP3.920.526.400.946.550.964.860.454.030.43
CFD7.26 8.46 7.54 4.01 0.62
913.5EXP1.760.492.540.532.290.492.240.581.490.36
CFD0.96 0.84 0.93 0.64 0.37
1116.5EXP0.930.221.050.201.290.571.930.532.130.43
CFD0.50 0.51 0.49 0.39 0.29
1319.5EXP0.770.202.260.430.590.131.340.620.450.07
CFD0.43 0.37 0.35 0.31 0.23
1522.5EXP1.570.351.180.300.850.701.030.390.420.12
CFD0.31 0.31 0.32 0.25 0.24
1725.5EXP0.610.260.490.100.720.391.370.270.960.30
CFD0.18 0.24 0.19 0.23 0.11
1928.5EXP0.740.330.340.061.070.470.610.210.590.14
CFD0.14 0.12 0.11 0.10 3.70
Table A6. Airflow velocity in the door opening for experimental studies and CFD simulation (distance 5 m), where x—position of the measuring point in relation to the x-axis; y—position of the measuring point in relation to the y-axis; AVG—arithmetic mean of the flow rate; SD—standard deviation taken as the measurement error.
Distance of the Positive Pressure Ventilator from the Door Opening (5 m)
Casex (mm)
91273455637819
AVGSDAVGSDAVGSDAVGSDAVGSD
y (mm)101.5EXP10.440.9313.070.2813.930.3512.300.349.890.49
CFD10.42-11.86 11.02 7.31 6.08
304.5EXP9.120.7711.370.7712.160.6211.010.638.550.55
CFD12.07-12.71 10.95 6.49 11.39
507.5EXP7.060.709.040.619.780.768.030.597.080.70
CFD9.12-13.15 12.06 6.85 6.36
710.5EXP5.110.526.640.946.970.965.960.455.090.43
CFD6.34 9.68 9.49 6.85 3.83
913.5EXP3.190.493.060.533.700.493.510.583.230.36
CFD4.02 4.89 4.63 3.00 2.29
1116.5EXP1.930.221.480.201.700.571.400.531.710.43
CFD1.73 1.90 1.23 1.38 1.46
1319.5EXP1.350.200.860.431.100.131.340.620.760.07
CFD0.70 0.60 0.54 0.47 0.50
1522.5EXP0.680.350.980.300.580.700.950.390.810.12
CFD0.48 0.37 0.43 0.34 0.48
1725.5EXP0.780.260.620.101.660.390.560.271.230.30
CFD0.41 0.32 0.35 0.41 0.27
1928.5EXP0.980.331.090.060.820.470.580.210.510.14
CFD0.18 0.15 0.11 0.14 5.48
Table A7. Airflow velocity in the door opening for experimental studies and CFD simulation (distance 6 m), where x—position of the measuring point in relation to the x-axis; y—position of the measuring point in relation to the y-axis; AVG—arithmetic mean of the flow rate; SD—standard deviation taken as the measurement error.
Distance of the Positive Pressure Ventilator from the Door Opening (2 m)
Casex (mm)
91273455637819
AVGSDAVGSDAVGSDAVGSDAVGSD
y (mm)101.5CFD8.18-10.71-11.10-10.27-8.15-
304.5EXP7.75-11.00-11.53-10.64-8.17-
507.5CFD7.19-9.66-9.98-9.27-7.41-
710.5CFD6.30-7.83-7.81-7.34-6.18-
913.5CFD4.45-4.75-4.48-4.26-3.86-
1116.5CFD2.93-2.63-2.42-2.21-1.99-
1319.5CFD1.62-1.33-1.20-1.02-0.88-
1522.5CFD0.85-0.69-0.57-0.54-0.49-
1725.5CFD0.50-0.48-0.41-0.45-0.42-
1928.5CFD0.35-0.34-0.30-0.26-0.35-
Table A8. Airflow velocity in the door opening for experimental studies and CFD simulation (distance 7 m), where x—position of the measuring point in relation to the x-axis; y—position of the measuring point in relation to the y-axis; AVG—arithmetic mean of the flow rate; SD—standard deviation taken as the measurement error.
Distance of the Positive Pressure Ventilator from the Door Opening (7 m)
Casex (mm)
91273455637819
AVGSDAVGSDAVGSDAVGSDAVGSD
y (mm)101.5EXP9.310.9310.460.2810.650.3510.100.349.580.49
CFD8.49 9.07 9.25 8.98 7.82
304.5EXP8.370.779.140.7710.020.629.500.638.700.55
CFD9.61 10.15 9.57 8.74 8.59
507.5EXP6.560.708.040.618.140.767.960.597.380.70
CFD7.71 8.61 8.33 6.61 6.60
710.5EXP5.360.526.160.946.450.966.490.456.100.43
CFD7.46 7.32 6.37 5.86 5.55
913.5EXP4.070.494.710.534.550.494.650.584.880.36
CFD4.33 3.86 3.29 3.77 3.44
1116.5EXP2.380.223.200.202.900.573.150.533.690.43
CFD2.25 1.92 2.20 2.38 1.93
1319.5EXP1.330.202.040.431.560.132.140.622.970.07
CFD1.49 0.63 0.73 1.14 1.70
1522.5EXP1.130.351.190.301.150.701.470.392.130.12
CFD0.67 0.49 0.56 0.86 1.99
1725.5EXP0.750.261.000.100.870.390.910.271.030.30
CFD0.43 0.54 0.40 0.91 1.04
1928.5EXP1.000.330.810.061.090.471.080.210.960.14
CFD0.21 0.30 0.28 0.51 8.06
Table A9. Volumetric airflow rate for full-scale experiment and CFD simulation (with variable positioning parameters of GX 350 ventilator (test ventilator)), where AVG—arithmetic mean of the flow rate; SD—standard deviation taken as the measurement error.
Ventilator Positioning Distance
[m]
CaseVolumetric
Airflow Rate
[m3/h]
AVGSD
1experiment20.123.41404
CFD analysis19.742.6-
difference [%]1.9
2experiment--
CFD analysis23.717.2-
difference [%]-
3experiment27.230.82492
CFD analysis26.294.3-
difference [%]3.4
4experiment29.705.12973
CFD analysis28.282.9
difference [%]1.6
5experiment29.695.02686
CFD analysis29.220.3-
difference [%]1.6
6experiment--
CFD analysis29.396.9-
difference [%]-
7experiment30.156.32938
CFD analysis29.019.3-
difference [%]3.8

References

  1. Garcia, K.; Kauffmann, R.; Schelble, R. Positive Pressure Attack for Ventilation & Firefighting; PennWell Books: Tulsa, OK, USA, 2006; ISBN 978-1-59370-048-5. [Google Scholar]
  2. Svensson, S. A Study of Tactical Patterns during Fire Fighting Operations. Fire Saf. J. 2002, 37, 673–695. [Google Scholar] [CrossRef]
  3. Warguła, Ł.; Kaczmarzyk, P. Legal Regulations of Restrictions of Air Pollution Made by Mobile Positive Pressure Fans—The Case Study for Europe: A Review. Energies 2022, 15, 7672. [Google Scholar] [CrossRef]
  4. Kaczmarzyk, P.; Warguła, Ł.; Janik, P.; Krawiec, P. Influence of Measurement Methodologies for the Volumetric Air Flow Rate of Mobile Positive Pressure Fans on Drive Unit Performance. Energies 2022, 15, 3953. [Google Scholar] [CrossRef]
  5. Thielens, M. Assessment of Ventilation Procedures for Fire Fighting in Buildings; Ghent University: Ghent, Belgium, 2018. [Google Scholar]
  6. Popov, G.S.; Klimentov, K.V.; Kostov, B.Z. Investigation of the Energy Consumption in Regulating the Flow Rate of Fan Systems. IOP Conf. Ser. Mater. Sci. Eng. 2019, 595, 012012. [Google Scholar] [CrossRef]
  7. Liu, X.; Liu, J.; Wang, D.; Zhao, L. Experimental and Numerical Simulation Investigations of an Axial Flow Fan Performance in High-Altitude Environments. Energy 2021, 234, 121281. [Google Scholar] [CrossRef]
  8. Tanaka, S.; Murata, S. Scale Effects in Cross-Flow Fans: Effects of Fan Dimensions on Performance Curves. JSME Int. J. Ser. B 1994, 37, 844–852. [Google Scholar] [CrossRef]
  9. Bayomi, N.N.; Abdel Hafiz, A.; Osman, A.M. Effect of Inlet Straighteners on Centrifugal Fan Performance. Energy Convers. Manag. 2006, 47, 3307–3318. [Google Scholar] [CrossRef]
  10. Pędzisz, I.; Magryta, P.; Pietrykowski, K. Computational Fluid Dynamics Studies of a Vertical Axis Wind Turbine with a Variable Swept Area. Adv. Sci. Technol. Res. J. 2024, 18, 333–348. [Google Scholar] [CrossRef]
  11. Fan, C.; Amankwa Adjei, R.; Wu, Y.; Wang, A. Parametric Study on the Aerodynamic Performance of a Ducted-Fan Rotor Using Free-Form Method. Aerosp. Sci. Technol. 2020, 101, 105842. [Google Scholar] [CrossRef]
  12. Moczko, P.; Odyjas, P.; Pietrusiak, D.; Więckowski, J.; Scholz, P.; Dix, M.; Osiecki, T.; Timmel, T.; Kroll, L. Enhancing Efficiency of Industrial Centrifugal Fans Using Blade Adjustment Mechanism. Energies 2022, 15, 893. [Google Scholar] [CrossRef]
  13. Odyjas, P.; Więckowski, J.; Pietrusiak, D.; Moczko, P. Challenges in the Design of a New Centrifugal Fan with Variable Impeller Geometry. Acta Mech. Et Autom. 2023, 17, 16–27. [Google Scholar] [CrossRef]
  14. Kaczmarzyk, P.; Warguła, Ł.; Krawiec, P.; Janik, P.; Noske, R.; Klapsa, W. Influence of the Positive Pressure Ventilator Setting Distance in Front of the Doorway on the Effectiveness of Tactical Mechanical Ventilation in a Multistory Building. Appl. Sci. 2023, 13, 5536. [Google Scholar] [CrossRef]
  15. Ezekoye, O.A.; Svensson, S.; Nicks, R. Investigating Positive Pressure Ventilation; Royal Holloway College: Egham, UK, 2007. [Google Scholar]
  16. Szpica, D.; Mieczkowski, G.; Borawski, A.; Leisis, V.; Diliunas, S.; Pilkaite, T. The Computational Fluid Dynamics (CFD) Analysis of the Pressure Sensor Used in Pulse-Operated Low-Pressure Gas-Phase Solenoid Valve Measurements. Sensors 2021, 21, 8287. [Google Scholar] [CrossRef]
  17. Caban, J.; Vrabel, J.; Górnicka, D.; Nowak, R.; Jankiewicz, M.; Matijošius, J.; Palka, M. Overview of Energy Harvesting Technologies Used in Road Vehicles. Energies 2023, 16, 3787. [Google Scholar] [CrossRef]
  18. Zhang, S.; Lu, L.; Wen, T.; Dong, C. Turbulent Heat Transfer and Flow Analysis of Hybrid Al2O3-CuO/Water Nanofluid: An Experiment and CFD Simulation Study. Appl. Therm. Eng. 2021, 188, 116589. [Google Scholar] [CrossRef]
  19. Shirzadi, M.; Mirzaei, P.A.; Tominaga, Y. RANS Model Calibration Using Stochastic Optimization for Accuracy Improvement of Urban Airflow CFD Modeling. J. Build. Eng. 2020, 32, 101756. [Google Scholar] [CrossRef]
  20. Kaczmarzyk, P.; Małozięć, D.; Burdzy, T.; Ziegler, B.; Krawiec, P.; Dziechciarz, A.; Warguła, Ł. Analysis of the Air Stream Flow Parameters Generated by the Positive Pressure Ventilator—Full Scale Experiment and CFD Simulation. Sci. Rep. 2024, 14, 6852. [Google Scholar] [CrossRef]
  21. Kerber, S. Evaluation of the Ability of Fire Dynamic Simulator to Simulate Positive Pressure Ventilation in the Laboratory and Practical Scenarios; National Institute of Standards and Technology: Gaithersburg, MD, USA, 2006. [Google Scholar]
  22. Weinschenk, C.; Beal, C.; Ezekoye, O. Modeling Fan-Driven Flows for Firefighting Tactics Using Simple Analytical Models and CFD. J. Fire Prot. Eng. 2011, 21, 85–114. [Google Scholar] [CrossRef]
  23. Panindre, P.; Mousavi, N.S.S.; Kumar, S. Improvement of Positive Pressure Ventilation by Optimizing Stairwell Door Opening Area. Fire Saf. J. 2017, 92, 195–198. [Google Scholar] [CrossRef]
  24. Panindre, P.; Mousavi, N.S.S.; Kumar, S. Positive Pressure Ventilation for Fighting Wind-Driven High-Rise Fires: Simulation-Based Analysis and Optimization. Fire Saf. J. 2017, 87, 57–64. [Google Scholar] [CrossRef]
  25. Fritsche, M.; Epple, P.; Delgado, A. Development of a Measurement Method for the Classification and Performance Evaluation of Positive Pressure Ventilation (PPV) Fans; American Society of Mechanical Engineers Digital Collection: New York, NY, USA, 2018. [Google Scholar]
  26. ANSYS. ANSYS CFX-Solver Theory Guide (Release 11.0); ANSYS, Inc.: Canonsburg, PA, USA, 2006. [Google Scholar]
  27. Kaczmarzyk, P.; Warguła, Ł.; Janik, P. Experimental Studies of the Influence of Mobile Fan Positioning Parameters on the Ability to Transport the Air Stream into the Door Opening. Sci. Rep. 2023, 13, 14976. [Google Scholar] [CrossRef]
  28. Warguła, Ł.; Kaczmarzyk, P.; Lijewski, P.; Fuć, P.; Markiewicz, F.; Małozięć, D.; Wieczorek, B. Effect of the Volumetric Flow Rate Measurement Methodology of Positive Pressure Ventilators on the Parameters of the Drive Unit. Energies 2023, 16, 4515. [Google Scholar] [CrossRef]
  29. ANSI/AMCA Standard 240-15; Laboratory Methods of Testing Positive Pressure Ventilators for Aerodynamic Performance Rating. ANSI: Washington, DC, USA, 2015.
  30. ISO 5221:1984; Air Distribution and Air Diffusion—Rules to Methods of Measuring Air Flow Rate in an Air Handling Duct. ISO: Geneva, Switzerland, 1984.
  31. AMCA 210-16; ANSI/ASHRAE 51-16; Laboratory Methods of Testing Fans Certified Aerodynamic Performance Rating. Air Movement and Control Association International: Arlington Heights, IL, USA, 2016.
  32. Fire Dynamics Simulator (FDS) and Smokeview (SMV); National Institute of Standards and Technology: Gaithersburg, MD, USA, 2024.
  33. McGrattan, K.B.; Hamins, D.W. Stroup, Sprinkler, Smoke and Heat Vent, Draft Curtain Interaction: Large Scale Experiments and Model Development; NISTIR 6196-1; Building and Fire Research Laboratory: Gaithersburg, MD, USA, 1998. [Google Scholar]
  34. Huang, Y.; Sun, Y.; Wang, M.; Zheng, X.; Liu, W.; Xie, H.; Lin, C. Thermal Runaway Simulation of Lithium Iron Phosphate Battery Based on Pyrosim Software. In Proceedings of the 2023 2nd International Conference on Clean Energy Storage and Power Engineering (CESPE), Xi’an, China, 15–16 December 2023; pp. 52–56. [Google Scholar]
  35. Vinay; Raja, S.; Tauseef, S.M.; Varadharajan, S. Investigating the Impact of Oxygen Concentration on Fire Dynamics Using Numerical Simulation with FDS. Process Saf. Environ. Prot. 2023, 178, 195–203. [Google Scholar] [CrossRef]
  36. Deardorff, J.W. Stratocumulus-capped mixed layers derived from a three-dimensional model. Bound.-Layer Meteorol. 1980, 18, 495–527. [Google Scholar] [CrossRef]
  37. Fire Dynamics Simulator (Version 4) User’s Guide; National Institute of Standards and Technology Special Publication 1019; National Institute of Standards and Technology: Gaithersburg, MD, USA, 2024. [CrossRef]
  38. McGrattan, K.; Hostikka, S.; McDermott, R.; Floyd, J.; Weinschenk, C.; Overholt, K. Fire dynamics simulator technical reference guide volume 1: Mathematical model. NIST Spec. Publ. 2013, 1018, 175. [Google Scholar]
  39. Lambert, K.; Merci, B. Experimental Study on the Use of Positive Pressure Ventilation for Fire Service Interventions in Buildings with Staircases. Fire Technol. 2014, 50, 1517–1534. [Google Scholar] [CrossRef]
  40. Kaczmarzyk, P.; Janik, P.; Małozięć, D.; Klapsa, W.; Warguła, Ł. Experimental Studies of the Impact of the Geometric Dimensions of the Outlet Opening on the Effectiveness of Positive Pressure Ventilation in a Multi-Storey Building—Flow Characteristics. Appl. Sci. 2023, 13, 5714. [Google Scholar] [CrossRef]
  41. ISO 5801; Fans—Performance Testing Using Standardized Airways. ISO: Geneva, Switzerland, 2017.
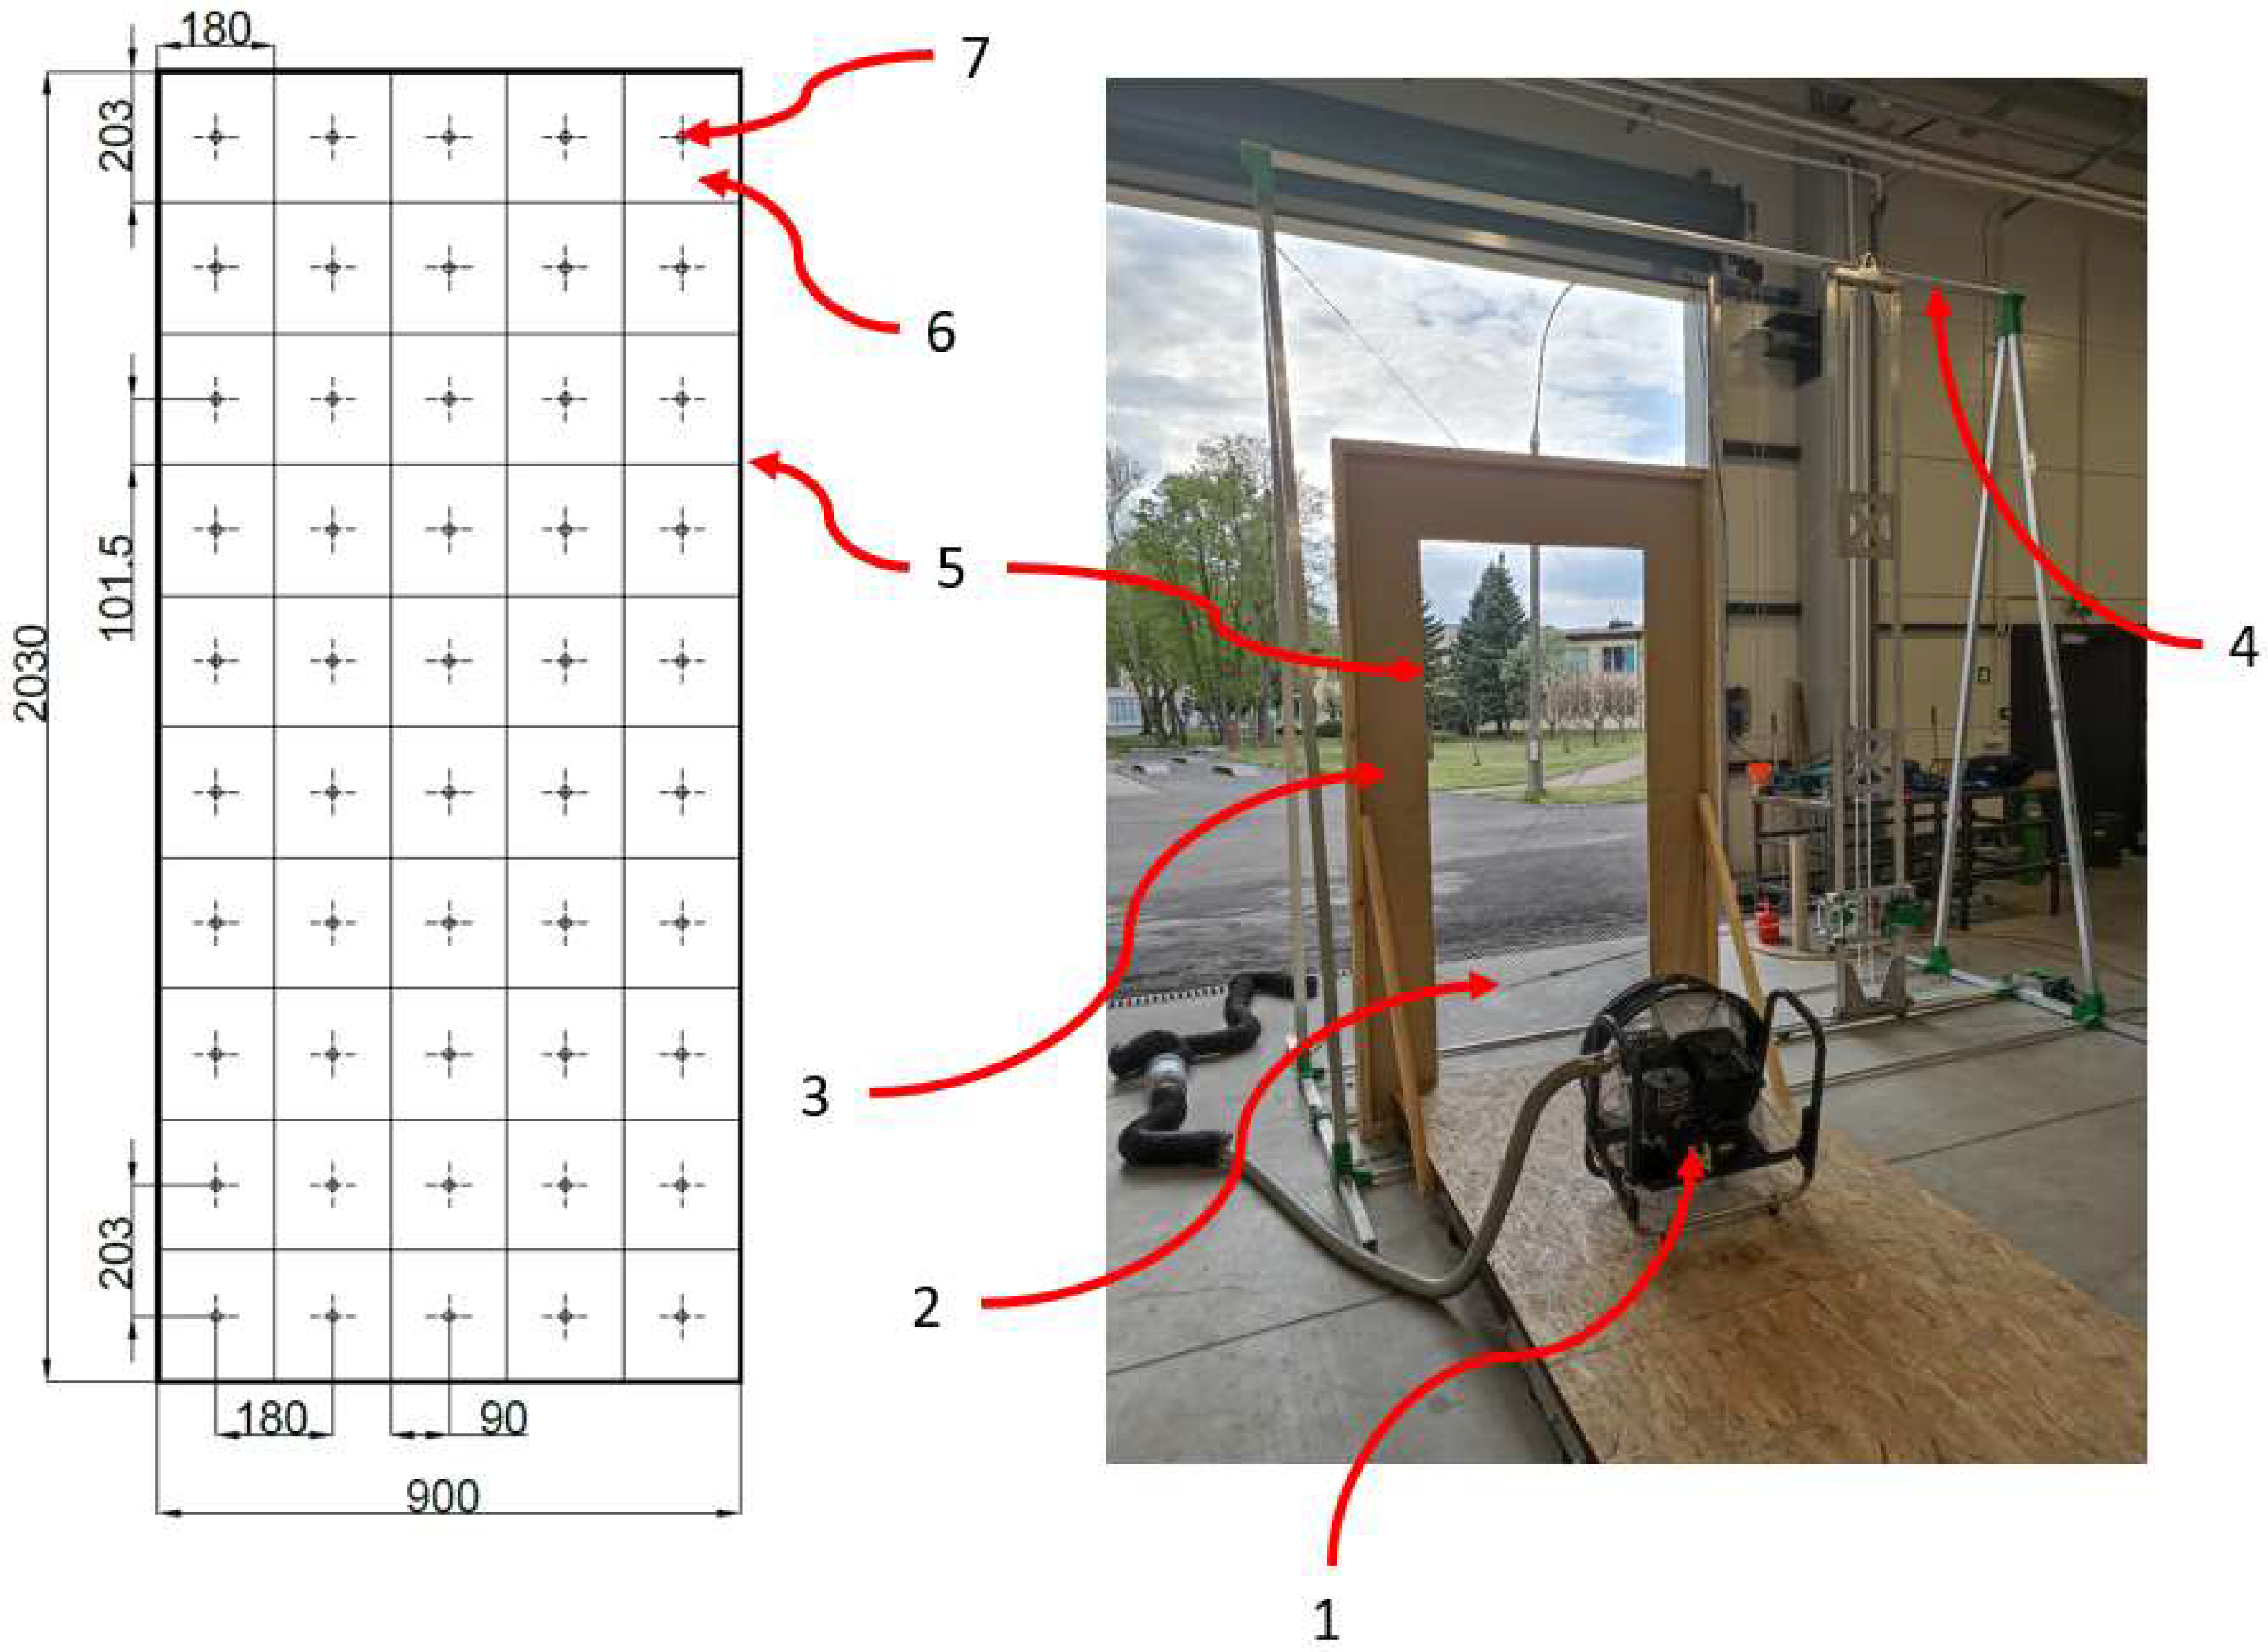
Figure 1. Test configuration, where 1—ventilator; 2—measurement probe (TSI Thermoanemometer); 3—door opening model; 4—frame with measurement device rails; 5—measurement plane; 6—area of the door opening for which the measurement is performed at the measurement point; 7—measurement point for a given area.
Applsci 15 02332 g001
Figure 2. Diagram of the test configuration to assess the velocity profile in the immediate area of the ventilator impeller, where 1—measurement point of the dynamic pressure of the air jet; 2—hub on the impeller shaft (dead flow zone).
Applsci 15 02332 g002
Figure 3. Visualization of the numerical model created for the simulation test to evaluate the characteristics of the airflow velocity profile on the surface of the door opening, where 1—positive pressure ventilator; 2—detector of airstream velocity; 3—mock-up simulating the door opening.
Applsci 15 02332 g003
Figure 4. The characteristic of the volumetric flow rate of a positive pressure ventilator obtained during experimental tests in real conditions and CFD simulations at a test setup for evaluating the velocity profile of the airflow at the door opening surface.
Applsci 15 02332 g004
Figure 5. Visualization of CFD simulation—tests of profile characteristics of air jet flow velocity in free flow generated by the ventilator for positioning distances from 1 m to 7 m.
Applsci 15 02332 g005
Figure 6. Characteristics of the airflow velocity profile of the positive pressure ventilator positioned 1 m from the door opening (measuring plane), where (a) real-scale experiment, (b) CFD simulation (FDS program), (c) difference between the experiment and CFD simulation.
Applsci 15 02332 g006
Figure 7. Characteristics of the airflow velocity profile of the positive pressure ventilator positioned 3 m from the door opening (measuring plane), where (a) real-scale experiment, (b) CFD simulation (FDS program), (c) difference between the experiment and CFD simulation.
Applsci 15 02332 g007
Figure 8. Characteristics of the airflow velocity profile of the positive pressure ventilator positioned 4 m from the door opening (measuring plane), where (a) real-scale experiment, (b) CFD simulation (FDS program), (c) difference between the experiment and CFD simulation.
Applsci 15 02332 g008
Figure 9. Characteristics of the airflow velocity profile of the positive pressure ventilator positioned 5 m from the door opening (measuring plane), where (a) real-scale experiment, (b) CFD simulation (FDS program), (c) difference between the experiment and CFD simulation.
Applsci 15 02332 g009
Figure 10. Characteristics of the airflow velocity profile of the positive pressure ventilator positioned 7 m from the door opening (measuring plane), where (a) real-scale experiment, (b) CFD simulation (FDS program), (c) difference between the experiment and CFD simulation.
Applsci 15 02332 g010
Disclaimer/Publisher’s Note: The statements, opinions and data contained in all publications are solely those of the individual author(s) and contributor(s) and not of MDPI and/or the editor(s). MDPI and/or the editor(s) disclaim responsibility for any injury to people or property resulting from any ideas, methods, instructions or products referred to in the content.