Article

Comparative Lifecycle Assessment of Renewable Energy Investments in Public Buildings: A Case Study of an Austrian Kindergarten Under Atypical Operational Conditions

by
Georgia Kousovista
,
Giannis Iakovides
,
Stefanos Petridis
,
Nikolaos-Charalampos Chairopoulos
,
Angelos Skembris
,
Maria Fotopoulou
*,
Despina Antipa
,
Nikolaos Nikolopoulos
and
Dimitrios Rakopoulos
Centre for Research and Technology Hellas, Chemical Process and Energy Resources Institute, 52 Egialias Str., 15125 Athens, Greece
*
Author to whom correspondence should be addressed.
Appl. Sci. 2025, 15(5), 2330; https://doi.org/10.3390/app15052330
Submission received: 23 January 2025 / Revised: 14 February 2025 / Accepted: 18 February 2025 / Published: 21 February 2025

Abstract

:
This paper investigates the environmental and economic impacts of energy-efficient renovations, specifically focusing on the integration of photovoltaic (PV) systems in a public kindergarten. Leveraging the VERIFY platform, this study employs Life Cycle Assessment (LCA) and Life Cycle Costing (LCC) methodologies to evaluate building performance over a 25-year analysis period under three distinct scenarios: a low-usage period during the COVID-19 pandemic (2021), a normal-usage period under post-pandemic conditions (2024) with the realized investment, and a hypothetical scenario with a PV installation size that allows for appropriate reductions alongside favorable financial outcomes. The pandemic-induced occupancy reduction led to atypical energy demand patterns, with lower self-consumption and increased electricity exports to the grid, affecting the financial viability of PV investments. By incorporating post-pandemic operational data, a meaningful comparison of energy efficiency measures under constrained and stable operating conditions is conducted, addressing the impact of fluctuating demand on long-term energy investment sustainability. The results highlight that system sizing and energy reconciliation policies (net metering, net billing) significantly influence financial outcomes. The PV system achieved a Levelized Cost of Electricity (LCOE) of EUR 0.0811–0.0948/kWh, with payback periods ranging from 6.01 to 14.66 years, depending on operational intensity. The findings demonstrate that while PV systems contribute to emission reductions and cost savings, their economic feasibility depends on occupancy stability and policy frameworks. This study provides insights for optimizing renewable energy investments in public buildings, demonstrating the importance of considering dynamic operational conditions in lifecycle assessments.

1. Introduction

The pressing global challenges of climate change, rapid urbanization, and resource depletion have led to a growing demand for sustainable, energy-efficient building practices. Life Cycle Assessment (LCA) and Life Cycle Costing (LCC) have emerged as key methodologies for evaluating environmental and economic impacts across the entire building lifecycle, from initial design through operation and end-of-life stages [1,2,3,4]. These frameworks are particularly valuable for assessing energy consumption, greenhouse gas (GHG) emissions, and the financial feasibility of renewable energy systems and efficient materials [5]. Despite their benefits, traditional LCA and LCC models often lack the adaptability needed to account for dynamically changing conditions, such as those introduced by external disruptions like the COVID-19 pandemic [6,7].
The COVID-19 pandemic significantly disrupted building operations, revealing challenges in maintaining energy efficiency and meeting sustainability targets. With shifts in occupancy patterns, energy demand fluctuated dramatically, affecting the performance of building systems and renewable energy installations [8,9]. These disruptions underscored the need for adaptive analysis frameworks capable of addressing short-term operational changes and long-term sustainability goals [10,11,12]. Accurate assessments of building renovations during this period require methodologies that incorporate scenario-based modeling and simulation tools to reflect dynamically changing conditions [7,13,14].
Advancements in digital technologies, such as digital twins, are transforming the early design stages of urban and building projects by enhancing transparency and data accuracy. Saadé et al. (2022) [8] emphasized the importance of integrating circular economy principles with LCA to achieve comprehensive sustainability insights early in the design process. Similarly, Fnais et al. (2022) [9] highlight challenges in data collection and the need for robust methodologies in building LCA. Digital twins provide a virtual representation of systems, enabling real-time monitoring and iterative sustainability evaluations. By addressing gaps in data quality and collection, these technologies enhance tracking capabilities and support more accurate, transparent assessments. Adaptive energy systems that integrate photovoltaic (PV) panels [12,15,16,17], battery energy storage systems, and heating, ventilation, and air-conditioning (HVAC) systems have been shown to significantly enhance energy efficiency and cost savings in residential and office buildings. Zhao et al. (2023) [13] demonstrated that combining PV systems with battery storage reduces energy costs by optimizing real-time energy use in office buildings, resulting in up to a 30% improvement in energy utilization efficiency. Similarly, Linssen, Stenzel, and Fleer (2015) [14] highlighted how variations in consumer load profiles influence the economic and energy performance of PV-battery systems, underscoring their potential to align energy generation and demand effectively. These integrations not only improve operational efficiency but also reduce reliance on grid electricity, leading to lower overall costs and improved energy performance. Despite these advancements, many LCA and LCC tools still predominantly rely on static estimations of the use-stage performance of the devices analyzed, limiting their capacity to evaluate dynamically changing operational conditions [11,18].
To address these challenges, this study utilizes the VERIFY platform [19,20,21], a web-based tool integrating LCA and LCC methodologies for building renovation assessments. VERIFY combines static and dynamic data with simulation-based evaluations to provide scenario analyses of environmental and economic impacts. The platform aligns with international standards such as ISO 14040, ISO 14044, ISO 15686-5, and EN 15978 [22,23,24,25,26,27,28] and incorporates frameworks like the EU’s Level(s) [29,30,31] for energy performance and global warming potential (GWP) indicators. These features make it particularly relevant for analyzing long-term building performance under varying conditions, including disruptions like the COVID-19 pandemic [32,33,34,35].
The case study presented in this paper is part of the AURORAL project (https://www.auroral.eu/ (accessed on 1 August 2024), Grant Agreement No. 101016854), a European initiative running for 48 months, designed to advance smart communities by leveraging digital services and fostering interoperability. This program aims to enhance connectivity and establish a digital ecosystem comprising smart objects and interoperable service platforms, promoting innovation, applications, and services tailored to rural settings. By bridging the digital divide between rural and urban areas, AURORAL contributes to economic development, job creation, and addressing critical societal challenges in underrepresented regions. However, the COVID-19 pandemic introduced significant challenges during the project’s implementation, such as delays in pilot deployments, restricted field activities, and disruptions in stakeholder engagement across the seven European regions. These limitations impacted the project’s ability to collect real-world data and validate cost-efficient cross-domain solutions under normal conditions, which may have influenced the project’s impact, as evaluated through its stated key performance indicators (KPI) and target values. In the presence of major unforeseen disruptions, the evaluation of such activities’ efficacy requires systematic frameworks that can combine both data- and model-driven approaches and scenario-based analytic capabilities to estimate the potential outcomes of investments in the energy upgrade of the European building stock even in the presence of limited field data.
This study examines the renovation of a public kindergarten in Austria conducted during the AURORAL project utilizing the VERIFY platform. The analysis spans a hypothetical 25-year period and evaluates two distinct operational scenarios: a low-usage case, based on field data collected during 2021 during the COVID-19 pandemic when building occupancy was significantly reduced, and a high-usage case that reflects stable conditions with full occupancy, using the economic conditions prevalent in 2024. By integrating LCA and LCC methodologies, this research aims to demonstrate the benefits of scenario-based analysis in situations with atypical social and economic conditions, which would otherwise prevent a reliable estimation of an energy upgrade investment’s impact. It also highlights the need for such analyses to adapt to dynamic operational conditions and assess long-term energy and environmental performance. The findings offer insights into the impact of reduced building usage on energy performance and emissions, validate scenario-based approaches for evaluating sustainability, and provide recommendations for integrating renewable energy systems to ensure long-term cost-efficiency and environmental resilience in public buildings.

2. Comparative Review of Life Cycle Analysis Tools for Building Assessment

2.1. Existing LCA/LCC Tools and Methods

The field of building assessment has produced various LCA tools that evaluate the environmental and economic impacts of construction and renovation projects. While these tools have significantly advanced sustainability practices, they exhibit certain limitations, particularly when applied to dynamic scenarios such as building renovations under atypical conditions. This section provides a comparative overview of widely used LCA tools, identifying their strengths and shortcomings to set the stage for how VERIFY addresses these gaps in the next subsection.
Several established tools are frequently used for LCA and LCC in building assessments, each focusing on specific aspects of sustainability and performance. SimaPro, for instance, is a versatile tool applied across various industries, including construction, offering robust data modeling and environmental impact assessment capabilities [36]. However, its broad applicability often requires extensive customization for construction-specific applications and lacks modules tailored to operational energy performance or renovation scenarios. Similarly, the Athena Impact Estimator for Buildings, designed for the North American construction sector, facilitates detailed assessments of embodied energy and emissions through its comprehensive material database [37]. Despite its strengths in material impact analysis, Athena’s limited capability for operational energy modeling and lifecycle economic evaluations restricts its scope for comprehensive building performance analyses. RETScreen, on the other hand, is widely used for renewable energy feasibility studies and performance analysis, offering an integrated platform to evaluate energy efficiency measures, cost savings, and emission reductions. While RETScreen excels in energy performance and financial analysis, it is less suited for detailed lifecycle environmental assessments [38].
In Europe, One Click LCA software is widely used for its integration with Building Information Models (BIM), streamlining LCA processes for architects and construction managers [39]. Its alignment with European standards and extensive material database makes it particularly effective for material impact evaluations. However, as of v1.0.4.0, its primary focus on material impacts limits its flexibility in addressing scenario-based analyses or dynamic simulations, which are essential for assessing renovation strategies. Tally, another tool integrated with BIM, excels in evaluating embodied carbon and resource use during early design stages [40]. While valuable for preliminary assessments, Tally’s limited applicability to post-construction evaluations and operational energy modeling reduces its suitability for comprehensive lifecycle analyses of building renovations.
Despite their contributions, existing tools often face limitations when applied to dynamic building renovations. Most are designed for static evaluations, which restricts their ability to simulate changing operational conditions, such as occupancy shifts or evolving energy demands. For example, many tools emphasize material-focused analyses or short-term performance, making them less effective for evaluating long-term impacts or responding to disruptions like the COVID-19 pandemic. Additionally, limited scenario flexibility and a lack of advanced simulation capabilities hinder the comprehensive assessment of lifecycle costs, payback periods, and renovation strategies. Tools optimized for specific regional markets further reduce their adaptability to global or multi-regional contexts.

2.2. VERIFY as a Dynamic LCA/LCC Tool

The abovementioned challenges underline the necessity of tools that integrate environmental and economic assessments with dynamic, scenario-based modeling to better support decision-making in building renovations. VERIFY addresses these gaps by combining robust data integration, advanced simulation capabilities, and scenario flexibility. VERIFY enables stakeholders to assess the impacts of renovations across a range of conditions, such as atypical disruptions like the COVID-19 pandemic, by dynamically integrating data on energy usage, energy tariffs, and renewable energy contributions. Unlike static tools, VERIFY’s interoperability with energy modeling tools supports long-term energy performance projections and thermal simulations over extended periods, providing accurate insights into potential renovation impacts. Additionally, VERIFY’s alignment with European and international standards ensures compliance with regulatory requirements and facilitates the generation of standardized reports suitable for certification processes.
VERIFY is a web-based platform developed to address the challenges of integrating environmental and economic assessments for building renovations, particularly under dynamic and atypical conditions. Its hybrid model data-driven LCA and LCC approach offers a holistic framework for the evaluation of environmental and financial implications of renovation strategies. By utilizing both static and dynamic data, VERIFY enhances the accuracy and relevance of its assessments, addressing limitations observed in traditional tools. The modular design within VERIFY ensures that components such as building systems, renewable technologies, and energy storage are analyzed both independently (in terms of their lifecycle impact and costs) and jointly (in terms of their contribution to the building’s energy consumption and production patterns) while considering their contributions to the overall lifecycle performance. This modular functionality allows for both targeted system-level optimizations and holistic assessments, enabling stakeholders to evaluate short-term operational impacts and long-term sustainability goals with precision.
In the context of project AURORAL, VERIFY was integrated into the broader AURORAL platform to support the LCA and LCC analyses for the project’s building renovation projects. Figure 1 presents the architecture of the overall platform. It should be noted that, while in this case, the AURORAL platform was used as a data source, any source provisioning either real-time or historical data of hourly granularity can be used for VERIFY’s analyses.
For cases where no historical data are available, VERIFY relies on physics-based energy simulation software to acquire representative time series for the building’s operational profile. This is achieved through VERIFY’s integration with INTEMA, a building energy modeling tool developed by the Centre for Research and Technology Hellas and validated through its application in multiple modeling scenarios [21,41,42,43,44,45,46]. INTEMA, developed in Modelica [47], conducts accurate building energy performance simulations. The underlying Modelica library consists of two main packages: the first deals with the passive elements of the building, accounting for various heat transfer phenomena such as conduction, convection, short-wave, and long-wave radiation. The second package includes dynamic models for the building’s active systems, such as HVAC, electrical generation, and energy storage. The variables considered for estimating the energy load include, among others, (i) solar radiation; (ii) the presence of people, their activities, and the use of the space; (iii) psychrometric charts and HVAC system operations; and (iv) power generation from electrical systems, if applicable. The flexibility of the Modelica language and the ability to develop custom components ensure precise simulations of energy demand and efficiency under various operating conditions, providing an accurate foundation for environmental impact assessments.
In cases where energy billing data are available for building systems that include heat pumps to meet their heating and cooling demands, a custom method for time-series disaggregation has been implemented, whereby synthetic hourly-based time series of the building’s energy usage are adjusted using historical actual energy consumption data from the bills. This approach allows for an accurate estimation of the heat pump’s consumption as a portion of the total demand. This estimation is crucial for the LCA of the heat pump, as it provides a solid basis for evaluating its operation by combining both simulated data and actual meter readings.
In addition to simulation data from INTEMA, VERIFY also utilizes additional system parameters, such as energy profiles and system efficiencies, and integrates these values with static lifecycle inventory data and additional external dynamic parameters like fuel prices and emission factors. VERIFY synthesizes these inputs to perform comprehensive LCA and LCC assessments, producing insights into the environmental and economic impacts of renovation scenarios.

3. Methodological Framework

3.1. Scenario Definition

3.1.1. Building Configuration and Renovation Action

As part of the project “AURORAL: a European initiative aimed at enhancing smart communities through the integration of digital tools and interoperability” (https://www.auroral.eu (accessed on 1 August 2024)/, Grant Agreement No. 101016854), a case study was conducted on a public kindergarten located in Southern Burgenland, Austria. This single-story building, constructed primarily with bricks, spans a total floor area of 168.85 m2 and operates year-round. The kindergarten’s energy demands, particularly for heating during winter and cooling in summer, are covered using conventional energy systems, namely, a heat pump and basic air conditioning.
The energy upgrade action implemented under the AURORAL project focused on the installation of a photovoltaic (PV) system as a key step toward sustainability. The roof-slanted PV system was designed to reduce reliance on grid electricity by generating renewable energy during daylight hours. The building operates under a net billing buyback scheme, enabling it to export surplus electricity to the grid while remaining connected for additional energy needs. This targeted sustainable energy measure represents a practical application that constitutes a basic use case for demonstrating how scenario-based analysis can be used to analyze and optimize the cost-efficiency of sustainability investments in real-world contexts.
Table 1 outlines the basic structural and operational characteristics of the SBA1 Kindergarten, providing an overview of the building.
Table 2 provides detailed information about the primary building components and systems, including the heating and cooling systems, insulation, glazing, and the domestic hot water (DHW) system. These details reflect the existing infrastructure and its associated costs and performance metrics.
Table 3 summarizes the energy upgrades implemented in the SBA1 Kindergarten, focusing on the photovoltaic (PV) system and its associated environmental metrics.
The values in Table 4 for Primary Energy (PE) demand and Global Warming Potential (GWP) (Stage A quantities) were obtained using SimaPro v9.5.0.2 software with the EcoInvent database v3.9.1 [48], and the same impact assessment method was applied to all components. The Life Cycle Inventory (LCI) data are consistent across components, ensuring comparability.
Table 5 presents the CO2 equivalent (CO2-eq) emission factors for Austria, as officially reported for each EU Member State, from the dataset provided by the Joint Research Centre (JRC) of the European Commission for the years 1990 to 2021 [49]. Since VERIFY dynamically adjusts the CO2-eq emission factor in its analysis every year, a Logistic Regression model was developed to estimate the corresponding emission factors beyond 2021 based on historical values. This model fits the historical data and generates future projections (extrapolations) of emission factors based on the characteristic trend observed. The model is based on the logistic function, as shown in Equation (1) [50]:
f x = L a exp k   ( x m e d i a n x ) )
where the parameters L, k, and α are estimated through curve-fitting on the historical data. The curve fitting was performed using the nonlinear least squares method, minimizing the sum of squared residuals between the observed and predicted values. The algorithm was implemented using Python 3.8.
The analysis period for the kindergarten spans 25 years, during which the CO2-eq emission factor for years beyond 2024 is assumed to remain consistent with the 2024 value.

3.1.2. Analysis Period

The performance of the kindergarten following the installation of the photovoltaic (PV) system was evaluated over a 25-year period through two distinct scenarios, each representing different building usage patterns and operational conditions.
The first scenario focuses on a low-usage case, reflecting the conditions during the COVID-19 pandemic. For this scenario, real building energy consumption data were collected during 2021, a period marked by reduced building occupancy and irregular usage patterns caused by lockdowns and restrictions. These atypical operational conditions resulted in fluctuating energy demands, and the analysis examines how the PV system mitigated energy costs and enhanced resilience under limited usage. The second scenario represents a high-usage case, corresponding to normal, stable operational conditions with full building occupancy. This analysis begins in 2024 and models performance under consistent energy demand over the remaining timeline. By comparing the two cases, this study evaluates the long-term sustainability and financial benefits of the PV system under normal usage patterns without real field data, including operational cost savings and reductions in greenhouse gas emissions.
These analyses, conducted within the AURORAL project, align with broader efforts to foster digital transformation and implement smart energy solutions in private and public infrastructure. The use of VERIFY ensures a robust, data-driven evaluation of energy and economic performance under both dynamic and stable conditions, supporting sustainable decision-making and long-term planning.

3.2. Data Availability

3.2.1. Economic Context: Electricity and Inflation Rates

To accurately assess the economic performance of the kindergarten renovation project, electricity prices and inflation rates during the analyzed periods were incorporated into the LCC analysis. These metrics, sourced from Eurostat, reflect the real-world conditions impacting the project’s financial sustainability. Table 6 presents key electricity prices and inflation rates for Austria for 2021 and 2024, including a 2024 (without subsidy) column to estimate prices under unsubsidized conditions [51,52,53].
Austria’s electricity export prices are determined by wholesale market prices, particularly the day-ahead market, which drives cross-border electricity trade and influences arbitrage opportunities between countries. In the absence of precise export price data, we assumed that the export price would equal Austria’s wholesale price. The values used include the 2021 average price (from both semesters) and the 2024 first semester price. For the import price, all components, such as taxes, levies, and network charges, were included to reflect the full cost borne by consumers. The 2021 and 2024 values incorporate Austria’s Eco-Social Tax Reform, which introduced carbon pricing, further increasing energy costs [54,55]. The buyback price for 2021 was provided by AURORAL project partners. To estimate the base price for 2024, we applied a 21.34% increase derived from observed price trends. This adjustment yields a 2024 base buyback price of 0.0771 EUR/kWh. The “2024 (without subsidy)” column estimates the impact of removing Austria’s energy subsidies and reductions. This scenario highlights potential cost increases for end-users under an unsubsidized framework [56].
These values highlight significant fluctuations influenced by external shocks, including the COVID-19 pandemic and the war in Ukraine. During the pandemic, global supply chain disruptions, shifts in energy demand, and government interventions created volatility in energy markets, initially leading to lower prices but subsequently driving increases as economies reopened. The war in Ukraine further exacerbated energy price inflation in Europe due to disruptions in natural gas supplies, impacting electricity prices and Austria’s inflation rates. These factors were integrated into VERIFY’s analysis to ensure that financial assessments reflect the turbulent economic conditions and provide a realistic understanding of energy performance under both historical and projected market scenarios.
Additionally, this analysis considers multiple scenarios for low usage and high usage conditions with varying PV system sizes and corresponding CAPEX, as summarized in Table 7. As the exact cost of the PV system installation was not covered within the AURORAL project, the cost was estimated based on national benchmarks for PV system prices in Austria. These benchmarks were sourced from the International Energy Agency Photovoltaic Power Systems Programme (IEA-PVPS) for 2021 and 2023 [57,58,59].

3.2.2. Data for Energy Demand and Performance

This analysis examined the kindergarten’s energy demand and the performance of its PV system under three scenarios. During the low-usage case, energy demand variations were influenced by changes in occupancy and usage patterns due to pandemic-related restrictions. Austria, including the Southern Burgenland region, experienced multiple lockdowns between March 2020 and December 2021, with schools and public buildings facing closures and limited operations during this period [60]. Detailed time series data, consisting of 8760 hourly final energy consumption measurements for the year 2021, were sourced from the AURORAL platform. These data covered key energy-related components, including the air conditioning (AC) system, heat pump, domestic hot water (DHW) system, PV system, and electrical consumption for lighting and other uses. The analysis specifically relied on the 2021 dataset, as it provided the most complete and representative time series available. This annual dataset served as the foundation for evaluating the building’s energy demand and the performance of its systems under hypothetical reduced usage conditions for a period of 25 years.
The high-usage period modeled stable operational conditions for 25 years (2024–2049), focusing on the sustainability and economic performance of the PV system. In the absence of operational data for this extended period, the annual electricity demand for the kindergarten was estimated at 10,608.38 kWh, based on regional benchmarks for European schools [61] reporting an average energy use of 120 kWh/m2/year. Using the kindergarten’s total floor area of 168.85 m2, this value reflects the projected energy demand under normal operational conditions. To further simulate system interactions, hourly time series data were generated using INTEMA.building, providing a detailed representation of the building’s energy demand and interactions among its systems.
In addition, as the energy consumption patterns indicated that the PV-based system was overprovisioned considering the actual needs of the building, a third hypothetical scenario was considered, with a PV system that was more rationally sized based on the expected annual electricity demand of the building. This scenario is referred to as “high-usage (low PV)” in the rest of the text.
To better understand the energy performance under both low- and high-usage conditions, the analysis considered two distinct energy policies: net metering buyback and net billing buyback. The net metering buyback scheme allows the electricity generated and exported to the grid to directly offset the electricity consumed on a 1:1 energy basis. At the end of the billing period, any surplus energy can either roll over as a credit for future use (rolling credit) or be compensated at a predefined rate. This approach generally maximizes economic benefits when energy generation and consumption are balanced over the billing period. The net billing buyback scheme, on the other hand, values the exported energy at a lower rate than the imported energy price. Instead of offsetting energy directly, the policy balances the monetary difference between exported and imported electricity. Both policies were examined under various reconciliation periods (yearly, quarterly, monthly, and daily) to analyze their economic impacts. In this context, “reconciliation” refers to the timeframe over which the balance between exported and imported electricity is calculated. For example, yearly reconciliation aggregates surplus energy credits over the year to offset annual consumption costs. Conversely, monthly or daily reconciliation calculates balances over shorter periods, which can reduce the economic benefit for users when energy generation and consumption fluctuate significantly.
The results highlight how these policies influence the building’s energy costs under both low-usage conditions (using 2021 data during the COVID-19 period) and high-usage conditions (using 2024 data under stable operation). These policies align with established methodologies and are supported by the literature, such as the comparative assessment of net metering and net billing systems by Dufo-López and Bernal-Agustín (2015) [56]. By considering different reconciliation strategies and energy export schemes, the analysis provides a comprehensive evaluation of the economic performance of the PV system across varying building usage scenarios, different socioeconomic conditions affecting energy prices, as well as different billing schemes. The large number of parameters and potential combinations to be considered highlights the advantages of scenario-based approaches over the traditional solutions outlined in Section 2.1.

3.3. Key Performance Indicators

The evaluation of the kindergarten energy upgrade project is grounded on a robust framework of Key Performance Indicators (KPIs) designed to capture both the environmental and economic impacts of the energy upgrade. These KPIs align with the European Level(s) framework, ensuring compliance with standardized sustainability benchmarks. By focusing on critical aspects such as energy efficiency, carbon emissions, and financial performance, the KPIs provide a comprehensive methodology for assessing the renovation’s outcomes over the building’s lifecycle.
An overview of the equations, variables, and methodologies for these KPIs is provided in Table 8, while a detailed explanation of the equations, variables, and methodologies is available in the Supplementary Materials.

4. Results and Discussion

4.1. Results

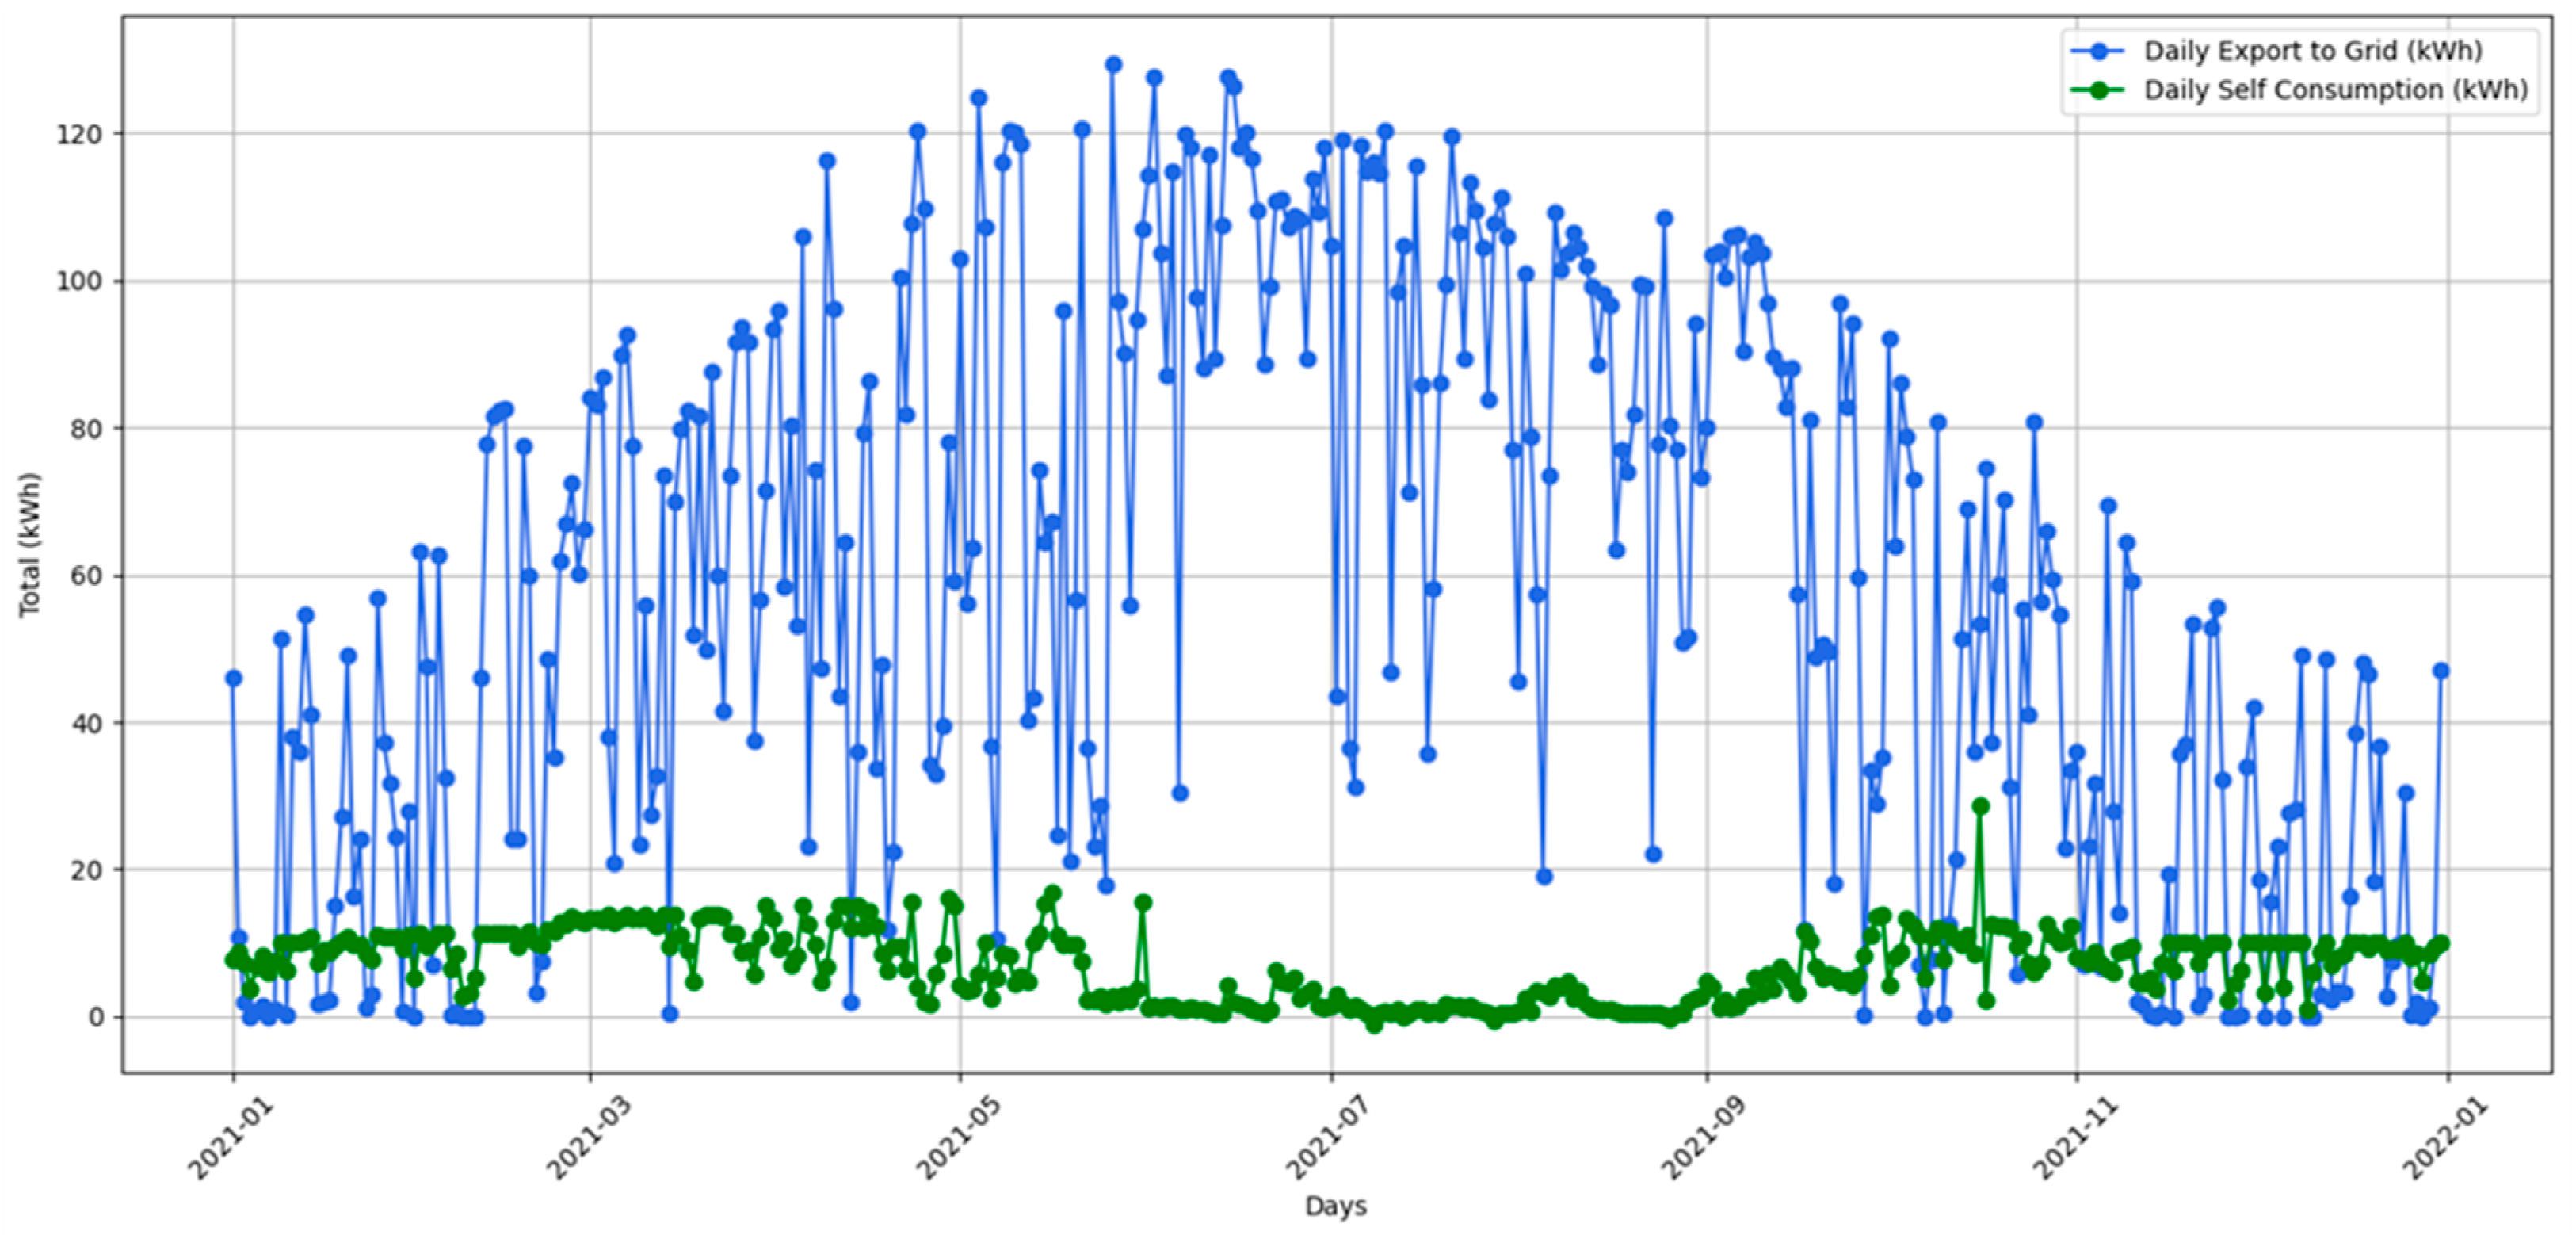
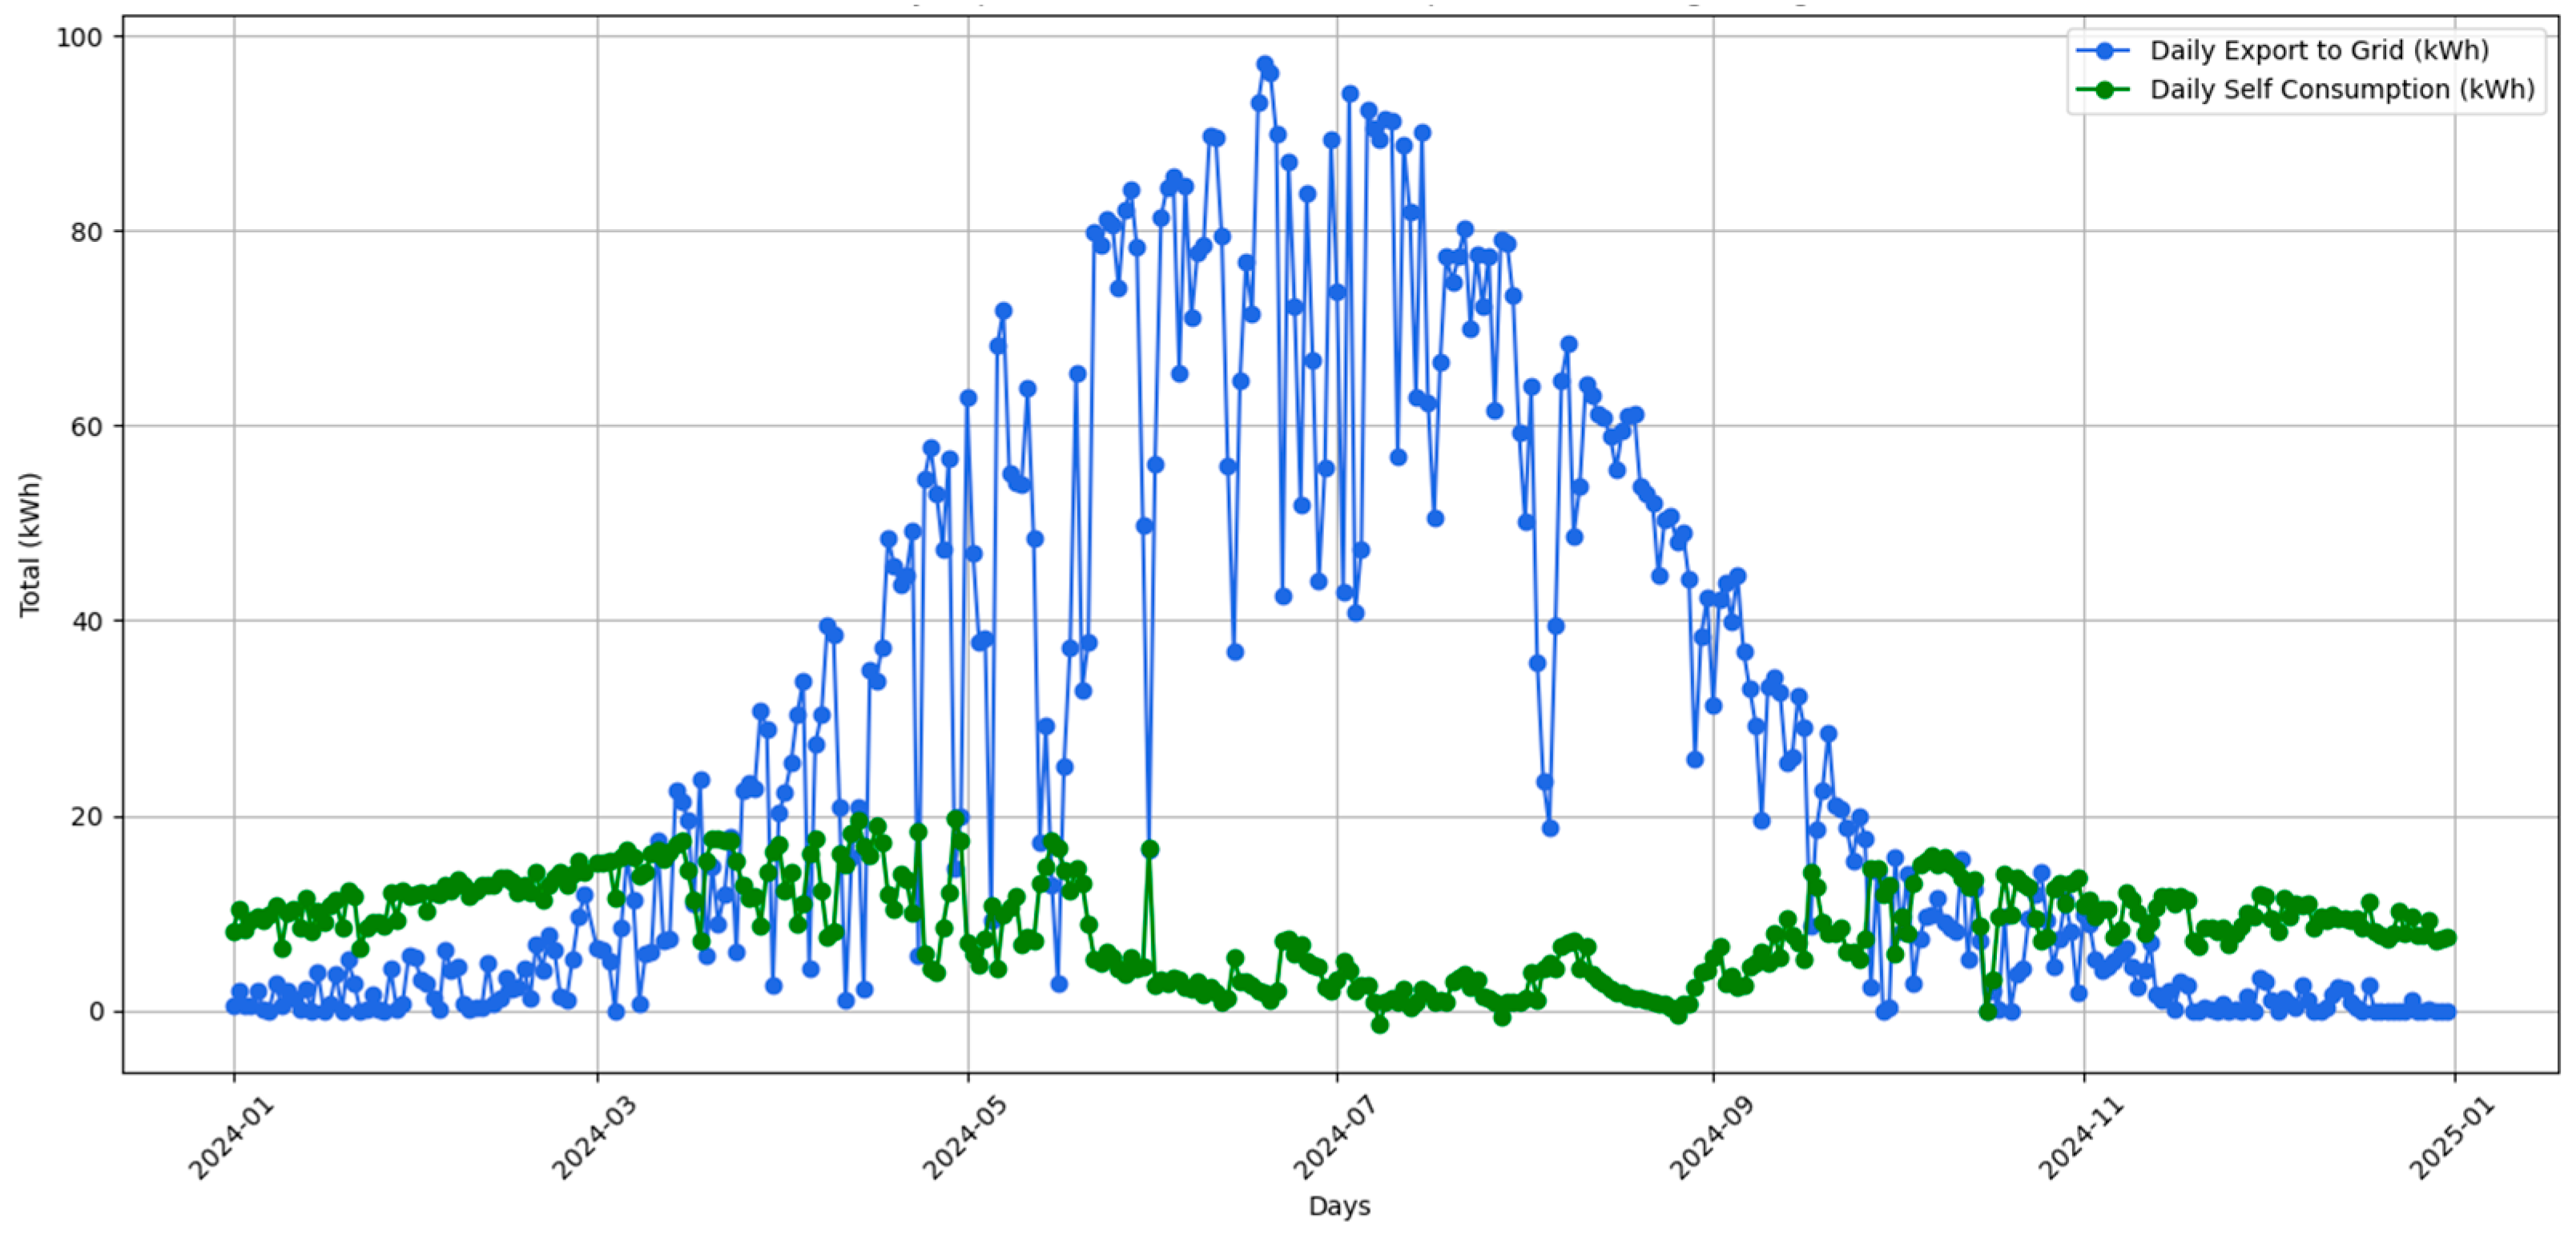
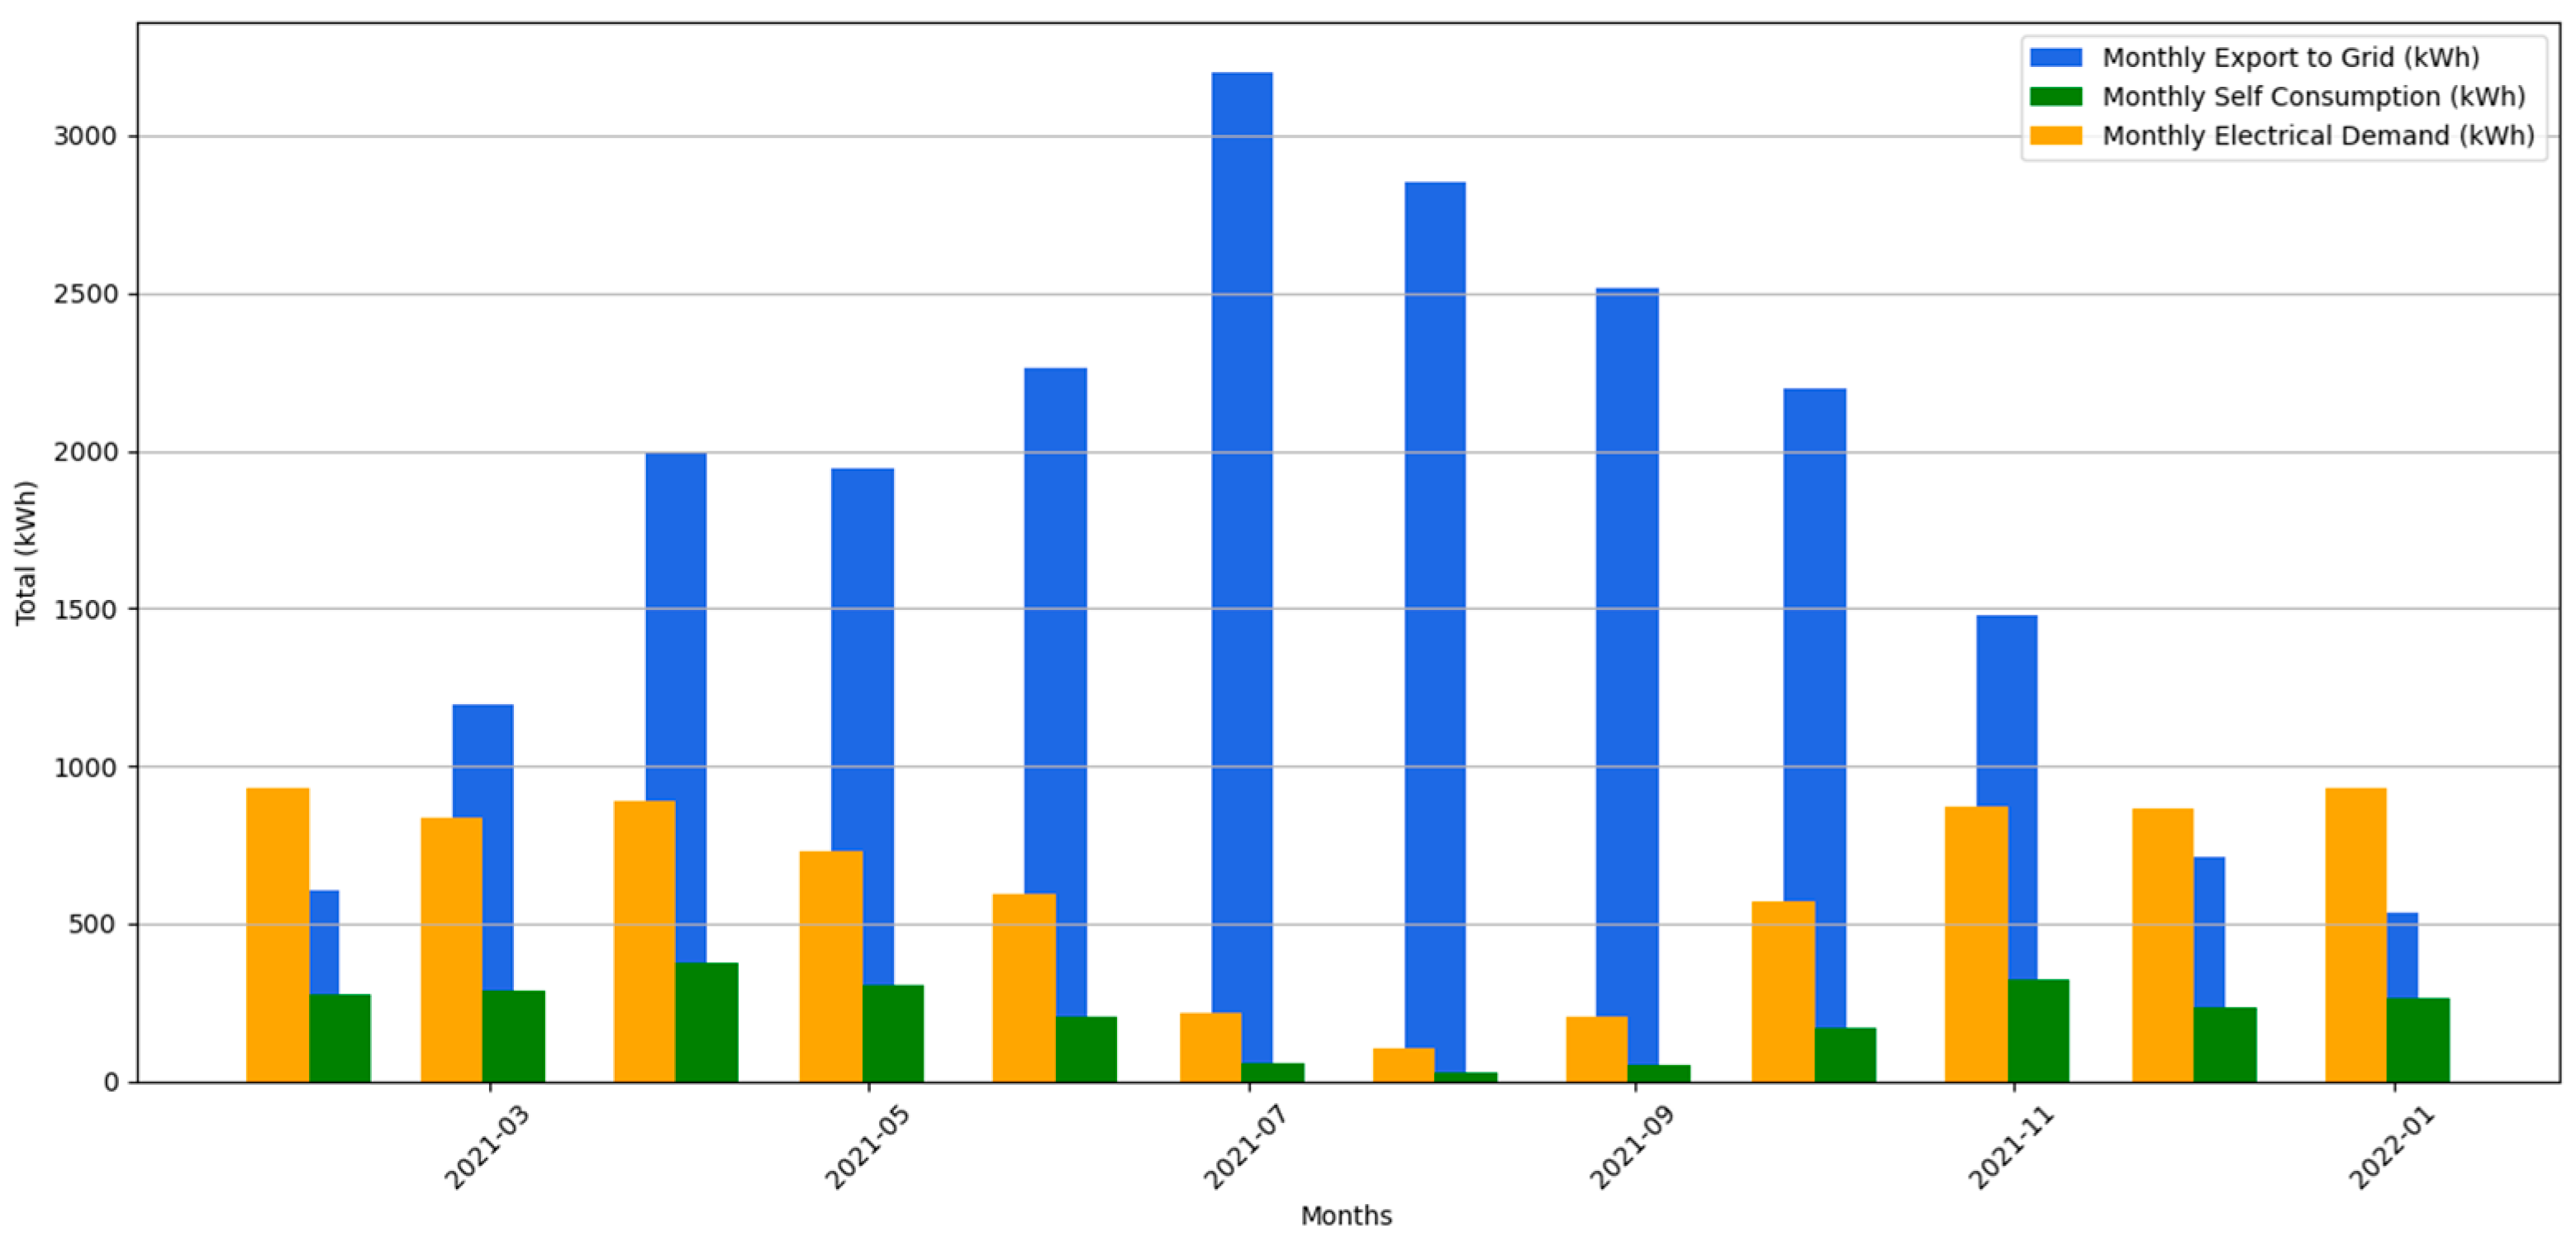
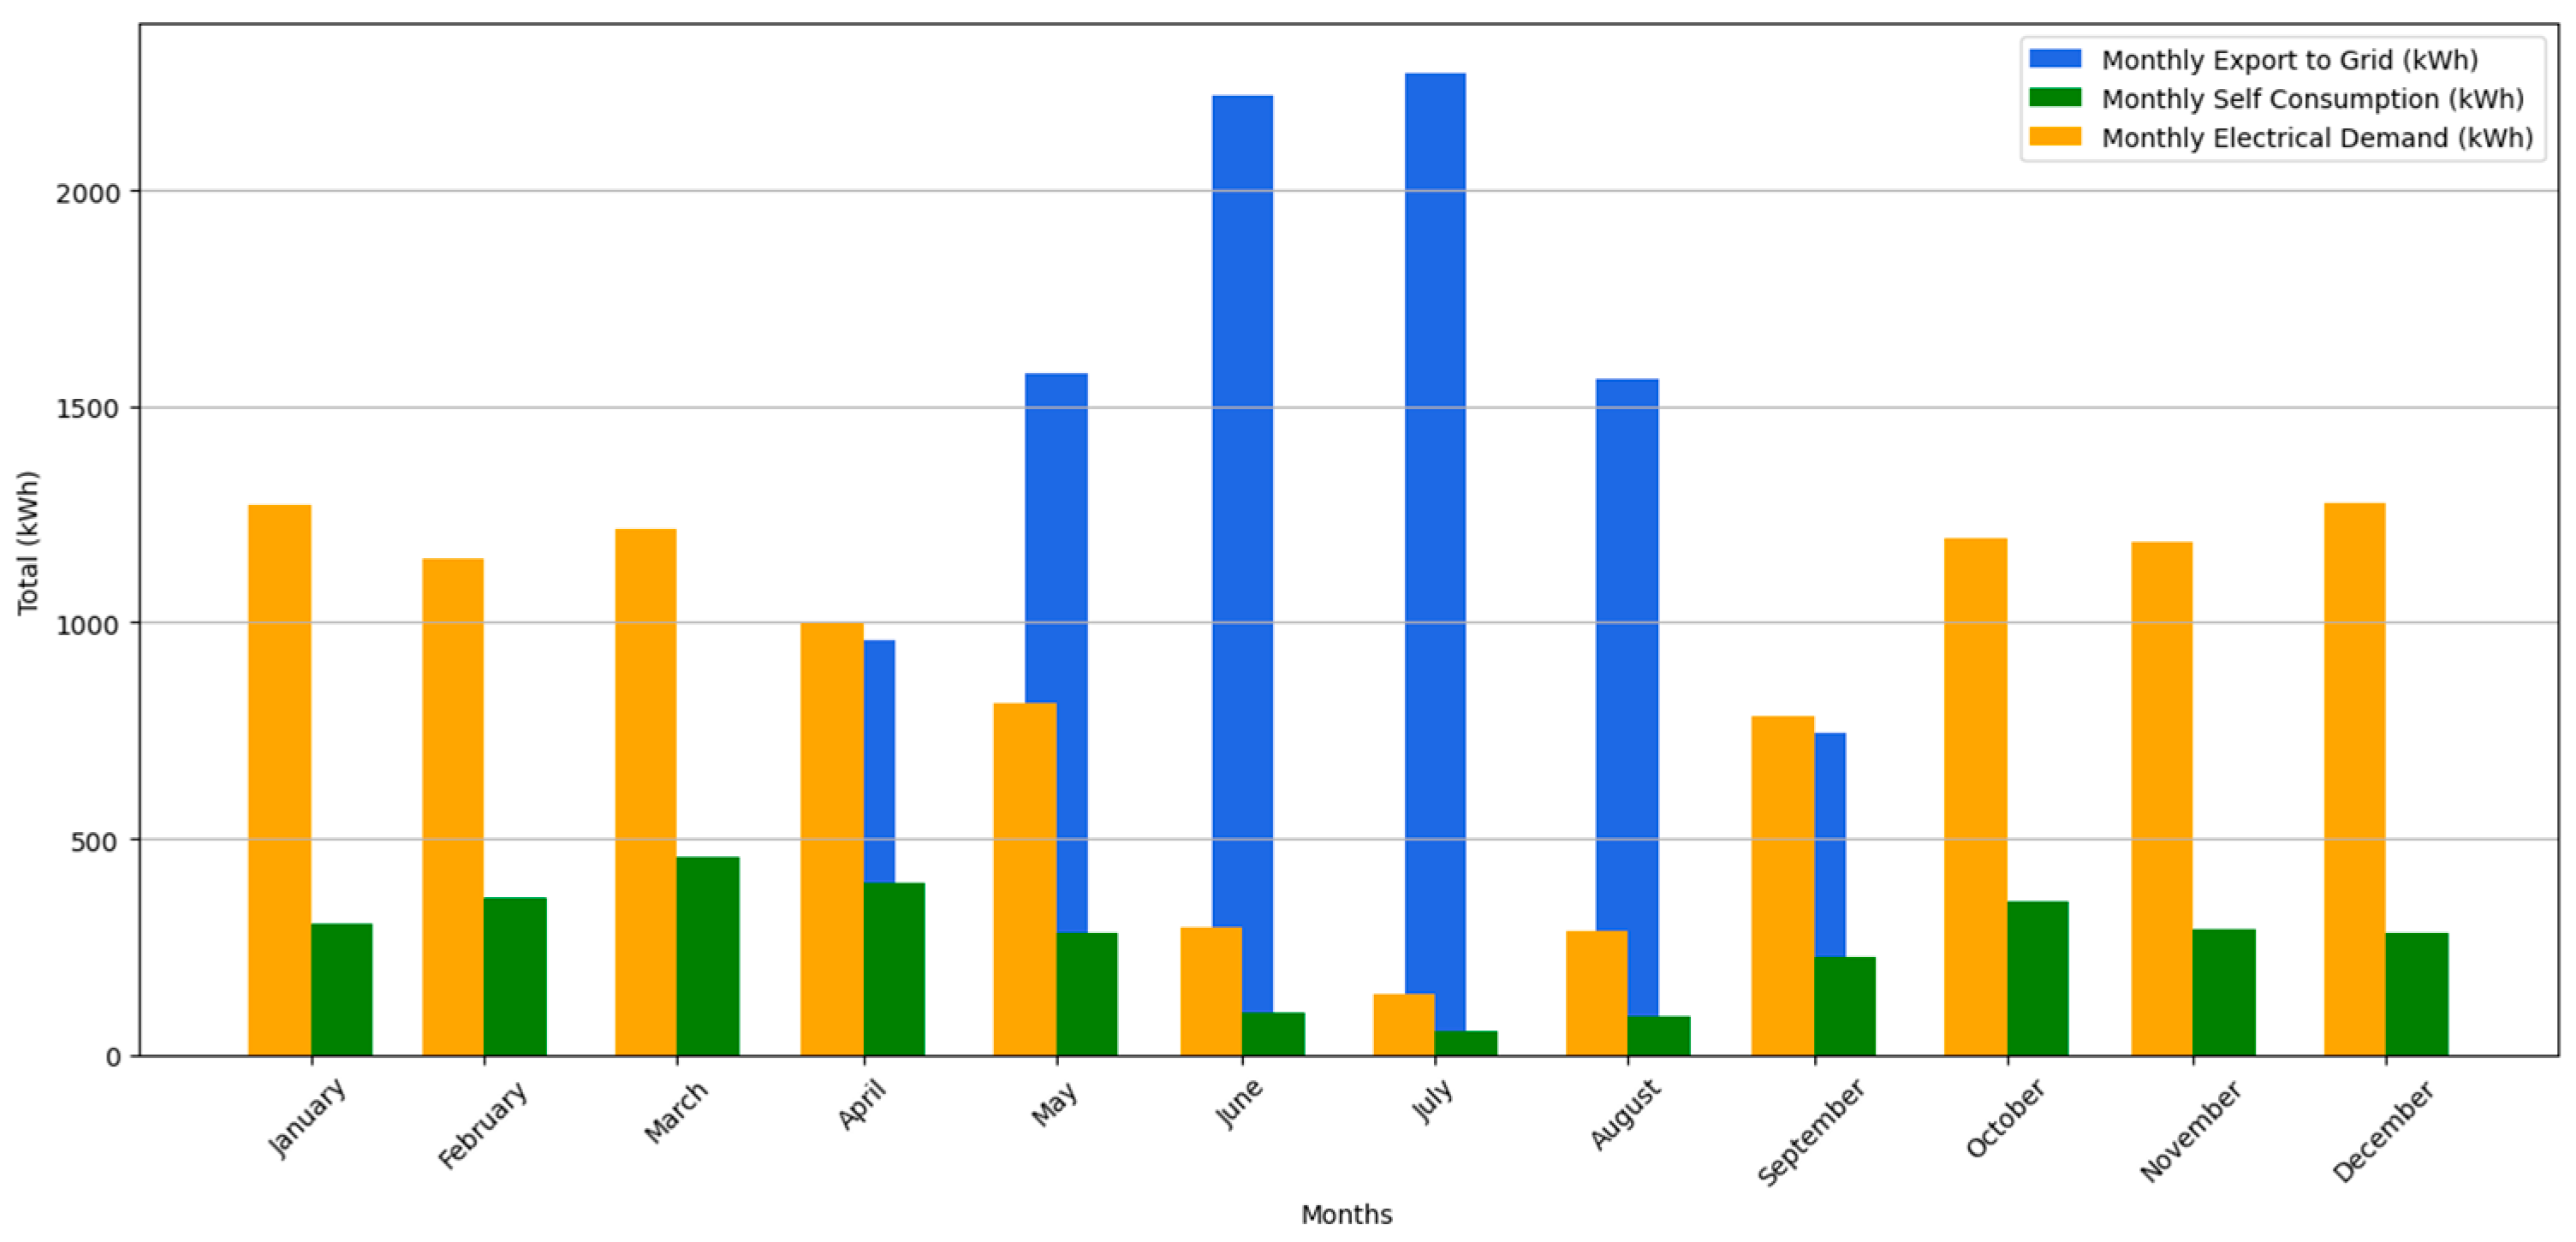
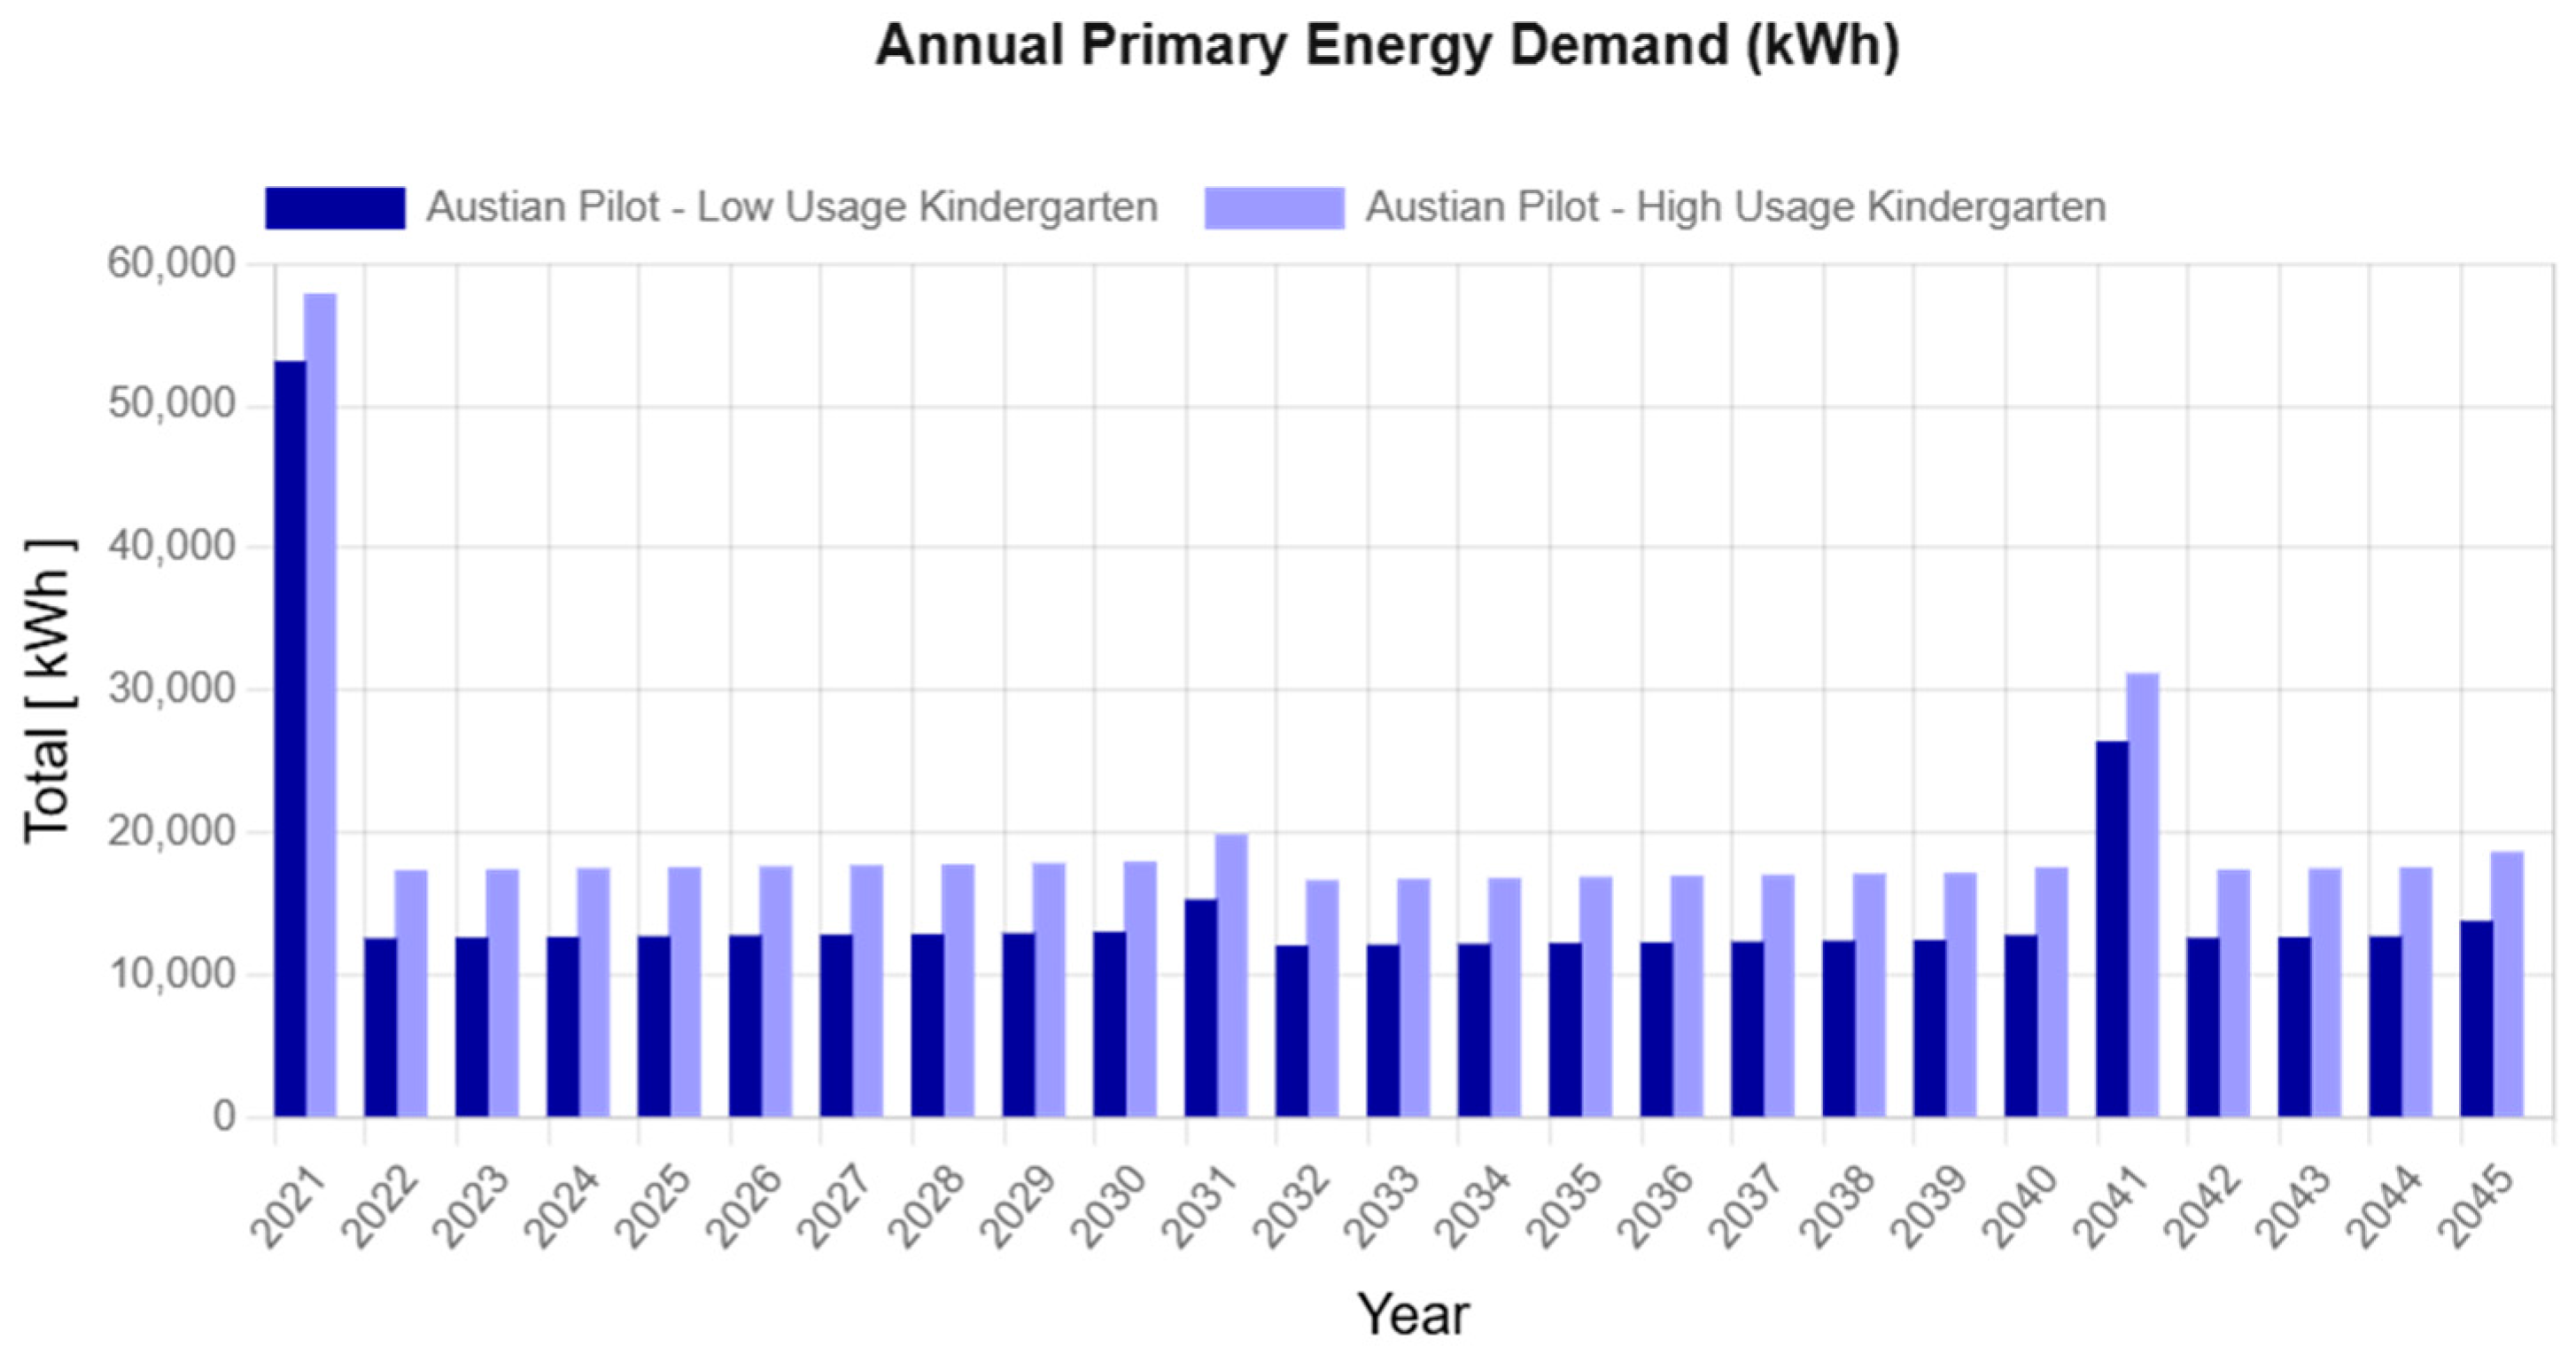
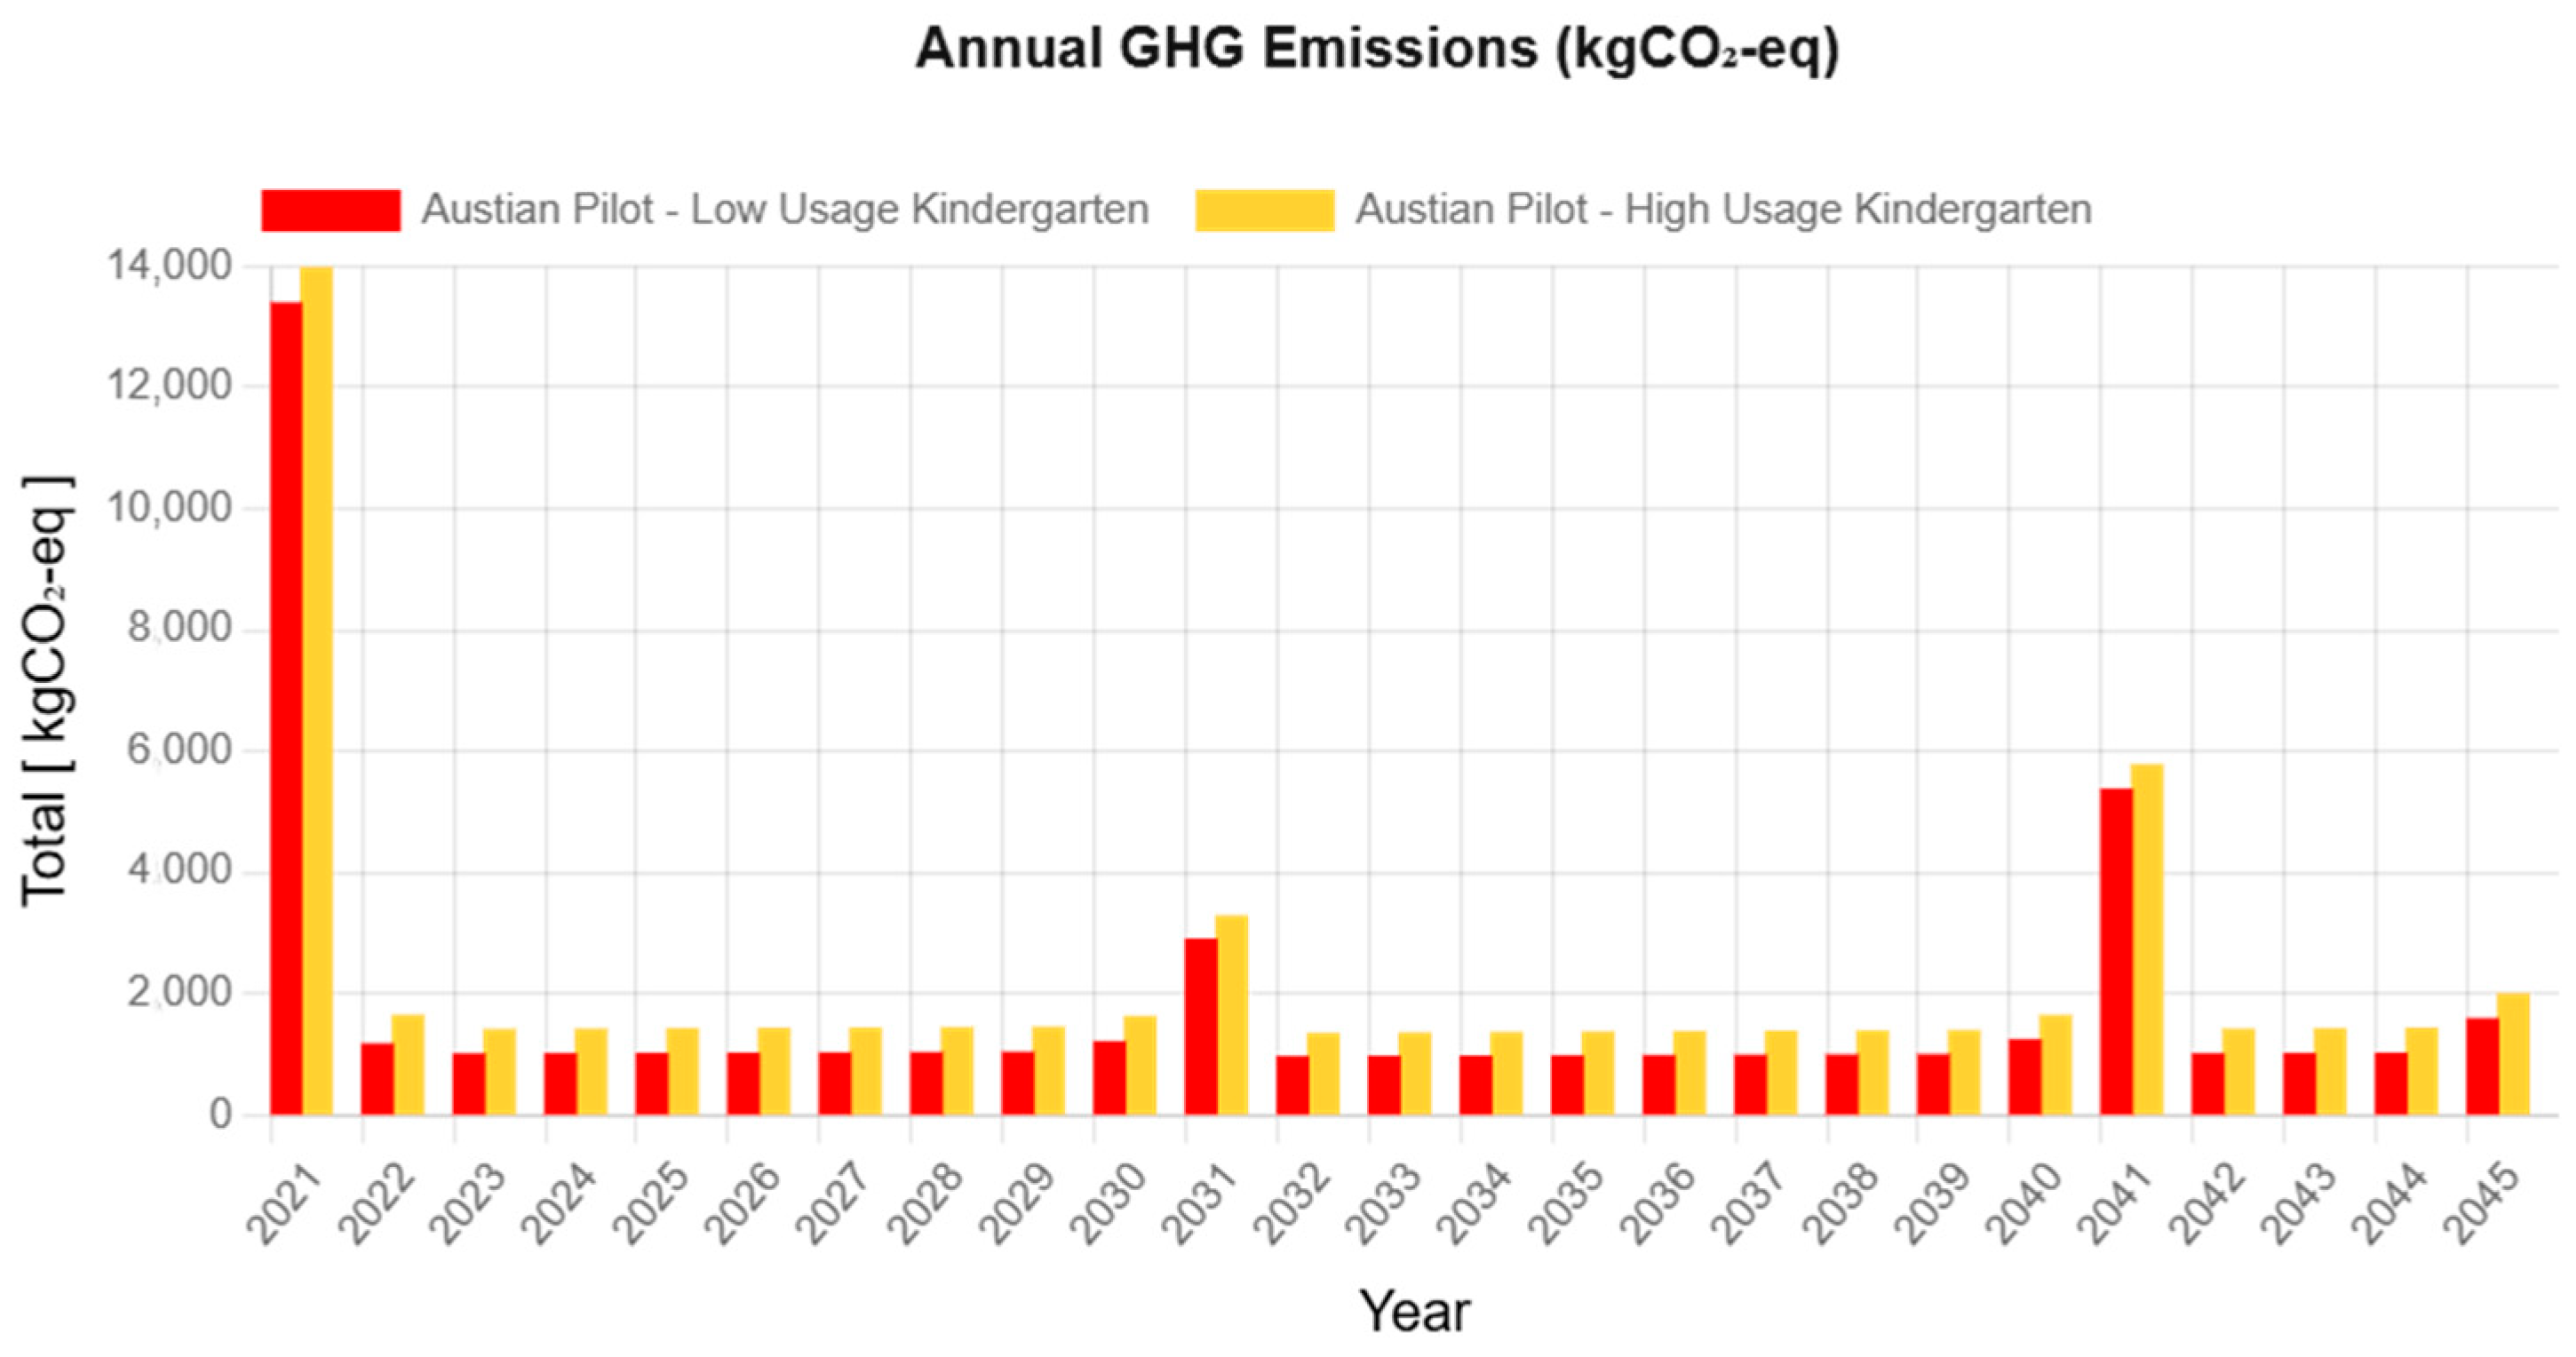
4.1.1. Comparison of Energy Performance: Low and High Usage of the Kindergarten

To compare the results between the low-usage and high-usage scenarios of the building, three 25-year analyses were conducted using the VERIFY platform. The analysis examined key metrics, including electrical demand, self-consumption levels, and energy exported to the grid. Two sets of results were generated to facilitate comparison: the energy performance during the COVID-19 period (2021) and the estimated performance under stable, post-pandemic conditions (2024). The objective was to highlight differences in energy usage patterns and evaluate the impact of the pandemic on the kindergarten’s energy management.
Figure 2 illustrates the energy performance of the kindergarten in 2021, reflecting the low-usage conditions resulting from the COVID-19 pandemic mitigation measures. The blue line illustrates the daily export of electricity to the grid, while the green line depicts the self-consumption levels within the building. During the summer months, when solar irradiance was higher, the PV system generated significantly more electricity, leading to notable peaks in energy exported to the grid. However, self-consumption levels remained consistently low throughout the year due to the building’s limited operations under COVID-19 conditions. This low internal energy usage highlights the effect of restrictions, as the kindergarten was not fully utilized during this period. The consistent gap between production (export) and consumption underscores the underutilization of generated energy for internal needs, emphasizing the impact of external disruptions on energy management and, potentially, the grid.
Figure 3 depicts the estimated daily energy performance of the kindergarten throughout 2024, representing high-usage conditions under stable and normal operational circumstances. The green line represents daily self-consumption levels, while the blue line indicates daily electricity export to the grid. During the winter months, when the kindergarten operates at full capacity, energy demand is higher due to heating and regular building use. The PV production during this time is primarily used for self-consumption, as shown by consistently higher green line values, while export levels to the grid remain minimal. In contrast, during the summer months, when the building is closed for school holidays, energy demand drops significantly. As a result, the PV system’s output is largely exported to the grid, reflected by higher blue line peaks.
Figure 4 presents the aggregated monthly energy consumption and production patterns for the kindergarten during 2021, characterized by low usage. The blue bars represent electricity exported to the grid; the green bars indicate self-consumed electricity generated by the PV system, and the orange bars show the building’s total electrical demand. Throughout this period, monthly electrical demand remained reduced and relatively stable, reflecting limited operations and lower occupancy caused by pandemic restrictions. Electricity exports fluctuated significantly, peaking during the summer months (June to August) when increased solar irradiance boosted PV production. Conversely, exports were lower in the winter months due to reduced solar production. Self-consumption levels remained consistent throughout the year, corresponding to the building’s baseline energy demand, such as energy needed for maintenance systems, which persisted regardless of occupancy. The aggregated data also highlight that electricity imports occurred when PV production could not fully meet demand, even though substantial amounts of energy were exported during periods of surplus generation.
Figure 5 depicts the estimated monthly energy performance of the kindergarten under normal operational conditions, simulating a fully functional year (2024) without pandemic disruptions. The blue bars represent electricity exported to the grid; the green bars indicate self-consumed electricity, and the orange bars reflect the total electrical demand. Under high usage, the monthly electrical demand was significantly higher than during the low usage scenario, reflecting the kindergarten’s full operational schedule with regular occupancy and activity levels. Self-consumption was also notably higher, particularly during the winter months, as the PV system supported the increased energy needs of the building, including heating and lighting. During the summer months (June to August), the kindergarten’s energy demand dropped due to school holidays, leading to reduced self-consumption. However, the PV system continued to generate electricity at high levels due to optimal solar conditions. This resulted in a marked increase in electricity exported to the grid (blue bars), as surplus energy was fed into the grid when internal demand was minimal.
To further assess the impact of the kindergarten’s energy upgrade across the three usage scenarios, the key performance indicators (KPIs) were summarized to provide a comprehensive evaluation of the environmental and economic outcomes. These KPIs, derived from the VERIFY platform, offer a detailed analysis of the building’s performance, highlighting the effects of the implemented energy sustainability measures under differing operational conditions.
The comparison presented in the tables showcases the variations and improvements achieved during the low-usage period and the high-usage period, as well as the building’s baseline performance without any upgrades. Table 9 focuses on the environmental KPIs, comparing results across these scenarios. The findings reveal differences in PED and GWP, offering valuable insights into the environmental benefits of the energy upgrade and its effectiveness under varying usage conditions.
The results reveal significant differences in both Primary Energy Demand (PED) and Global Warming Potential (GWP) across the analyzed scenarios, reflecting the impact of operational intensity and energy upgrades. For Primary Energy Demand (PED), the baseline case (without PV installation) records the highest lifetime PED, reflecting the building’s full reliance on grid electricity. In the low-usage scenario, the lifetime PED was 29.7% lower than the baseline, driven by reduced occupancy and decreased energy demand during periods of limited kindergarten usage. Conversely, in the high-usage scenario, lifetime PED shows a 6.9% reduction compared to the baseline but increases relative to the low-usage case. This rise in PED under high usage is attributed to greater operational intensity and consistent energy demands under normal conditions. Under low-usage conditions, the GWP decreases by 25.7% compared to the baseline, primarily due to lower energy consumption during periods of limited occupancy. In the high-usage scenario, lifetime GWP is 8.2% lower than the baseline but 23.5% higher than the low-usage case, reflecting the increased energy consumption associated with higher operational intensity under normal usage conditions.
The observed values also account for the impact of gradual component degradation on energy performance and environmental outcomes over time. The KPIs highlight the interplay between operational energy demands, the efficiency of the renewable energy system, and lifecycle events such as maintenance and component replacements. While the results confirm the kindergarten’s ability to achieve emission reductions through PV system upgrades, they also emphasize the importance of ongoing system optimization to sustain these benefits over the long term.
The trends observed in the KPIs are further contextualized and analyzed in the subsequent discussion of the PED and GHG emissions plots, providing deeper insights into the system’s performance under varying operational conditions.
Figure 6 and Figure 7 illustrate the annual trends in PED and GWP over the 25-year analysis period, highlighting key lifecycle events and differences between low-usage and high-usage scenarios:
  • Initial Peak (2021): The sharp peak observed in 2021 reflects the embodied energy associated with the installation of the PV system. This includes energy requirements for the manufacturing, transportation, and installation processes, which significantly increase PED and GWP in the first year;
  • Steady Trend with Gradual Increase: Following the initial installation, PED and GWP stabilize but exhibit a gradual increase over time. This trend is driven by the 0.5% annual degradation assumed in the PV system’s performance. As the system’s efficiency declines, its renewable energy output decreases, causing a greater reliance on grid electricity to meet the building’s energy demand;
  • Spikes (2031 and 2041): Distinct spikes are expected to occur in 2031 and 2041, corresponding to the replacement of the air conditioning (assumed to occur in 2031) and the heat pump (in 2041) systems. These lifecycle events temporarily increase PED due to the embodied energy required for the manufacturing and installation of the replacement components.

4.1.2. Comparison of Economic Performance: Low and High Usage of Kindergarten

The economic evaluation employs LCC methodologies to provide detailed insights into the long-term financial impacts of the renovation measures. By capturing data on the building’s economic performance, the assessment ensures a robust and holistic understanding of its energy systems. The findings validate the renovation strategy, demonstrating that the kindergarten remains energy-efficient and economically viable throughout its lifecycle. To further analyze cost-effectiveness, the evaluation incorporates two distinct schemes:
  • Net metering—where exported energy offsets imported energy on a 1:1 basis;
  • Net billing—where exported energy is valued at a lower rate than imported energy.
Both schemes were examined under various reconciliation periods: yearly, quarterly, monthly, and daily, allowing for a detailed comparison of their economic performance under differing operational conditions. Table 10 summarizes the economic outcomes of the kindergarten’s energy upgrade for both the low-usage and high-usage scenarios, including the case with a smaller PV system under high-usage conditions. This combined analysis provides a comprehensive perspective on the financial performance and cost-effectiveness of the implemented energy measures, particularly focusing on the PV system installation and its impact across varying system sizes and operational conditions.
The results from Table 10 highlight significant differences in economic performance between the net metering buyback and net billing buyback schemes across all usage scenarios, with variations becoming more pronounced as reconciliation frequency shortens.
Under net metering, surplus energy offsets imported energy costs on a 1:1 basis, resulting in better economic outcomes, especially with yearly reconciliation. In high-usage scenarios, shorter reconciliation intervals (e.g., daily) increase LCC and WLC by 17.6% and 22.6%, respectively, compared to yearly intervals. In contrast, net billing, which values exported energy at a lower rate, shows smaller cost variations with shorter intervals, achieving slightly lower LCC (0.4%) and a 3.5% shorter payback period under daily reconciliation compared to net metering. These results highlight net metering’s advantage in long intervals and net billing’s stability with shorter intervals.
In the low-usage scenario, net metering outperforms net billing due to its reliance on surplus energy exports, which directly offset costs. Yearly reconciliation under net metering results in shorter payback periods and lower WLC compared to daily reconciliation, while net billing sees higher LCC and extended payback periods as surplus energy is undervalued. These findings emphasize net metering’s advantage in low-demand settings, where it achieves greater savings than net billing.
In the high-usage scenario with a smaller PV system, both net metering and net billing result in significantly higher costs and longer payback periods due to reduced energy generation. For daily reconciliation, net metering shows a 48.2% increase in LCC and a 61.4% longer payback period compared to yearly reconciliation, while net billing exhibits similar trends with slightly shorter payback periods (1.7% lower) across all intervals. However, WLC remains consistently higher for shorter reconciliation periods, underscoring the inefficiencies of balancing energy production and demand over smaller intervals.
However, in certain cases where the values remain identical across different reconciliation periods or schemes, this outcome occurs because the PV system generates sufficient surplus energy to cover the building’s demand. At the end of the reconciliation period, any remaining credits ensure that grid electricity is not required, resulting in the same LCC, WLC, and payback periods across those conditions.
The LCOE is a key indicator for assessing the economic viability of the PV systems [62] implemented in the kindergarten’s energy upgrade. The results in Table 11 represent the average cost of electricity generated over the lifetime of the PV system, considering the installation, operational, and maintenance expenses.
The LCOE values for all scenarios demonstrate the economic feasibility and competitiveness of the PV system installation. For comparison, the Fraunhofer Institute for Solar Energy Systems) reported that, as of 2021, the LCOE for PV systems in Germany ranged from EUR 0.0312 to EUR 0.1101 per kWh, depending on system size and location [63]. The kindergarten’s LCOE values fall well within this range, confirming the financial viability of the energy upgrade. The low-usage scenario achieves the lowest LCOE due to reduced energy demand, which allows the PV system to meet a larger share of the building’s needs while exporting surplus energy to the grid. In the high-usage scenario with a larger PV system, the LCOE remains financially viable, showing a 9.1% increase compared to the low-usage case, driven by higher energy demand and greater reliance on grid electricity. However, in the high-usage scenario with a smaller PV system, the LCOE rises further, reflecting a 16.9% increase compared to the low-usage scenario and a 7.1% increase relative to the high-usage case with the larger PV system. This increase highlights the impact of reduced PV capacity, which limits energy production and spreads fixed costs over a smaller output.
Figure 8 from the ROI analysis reveals that net metering consistently outperforms net billing across all usage cases, particularly under favorable conditions like yearly reconciliation, where surplus energy offsets cost on a 1:1 basis. In contrast, net billing undervalues exported energy, leading to comparatively lower returns. Yearly reconciliation achieves the highest ROI for both policies by aggregating surplus energy over an extended period, significantly reducing costs. However, as reconciliation intervals shorten to quarterly, monthly, or daily, ROI declines due to surplus energy being penalized or unused, which diminishes its cost-saving potential. For instance, in the High Usage scenario under net metering, ROI decreases from 2.29 (yearly) to 1.89 (daily), marking a 17.4% drop. When it comes to maximizing the financial benefits of the investment, the analysis also highlights the importance of appropriately selecting the PV system size under the constraint of covering the building’s energy needs. As observed in the High Usage Low PV case, the payback period is 6.01 years (yearly), and ROI is significantly higher compared to the full High Usage scenario, underscoring the importance of appropriately sized PV systems to optimize cost-effectiveness and ensure balanced economic outcomes.

4.2. Discussion

The results of this study underscore the significant environmental and economic advantages of the kindergarten’s energy upgrade, providing critical insights into its performance under both constrained and stable operational conditions. The analysis highlights the impact of pandemic-induced operational disruptions on energy performance, emphasizing that energy efficiency measures must be evaluated across different usage patterns to fully assess their long-term viability. For the environmental KPIs, it is essential to recognize that RES alone is insufficient to achieve meaningful sustainability improvements, especially if a country’s energy mix already incorporates a high share of renewables. The real change must come from enhancing the building’s energy efficiency, which reduces overall energy demand and ensures that RES integration maximizes environmental benefits. Without such improvements in a building’s energy performance, even extensive RES installations may fail to deliver optimal sustainability gains, as the excess energy consumption will offset potential environmental benefits. This reinforces the need for a holistic approach, combining renewable energy solutions with efficiency upgrades to achieve substantial reductions in PED and GWP [5,57,64].
In Austria, where energy policy favors net billing over net metering [65], the economic outcomes of PV systems are influenced by reconciliation periods, system size, and usage conditions. Yearly reconciliation delivers the most favorable results, minimizing LCC and payback periods by effectively utilizing surplus energy credits. Conversely, shorter reconciliation periods (e.g., monthly or daily) increase costs and extend payback periods due to reduced energy balancing efficiency. PV system size also plays a critical role; smaller systems achieve higher Return on Investment (ROI) and shorter payback periods by optimizing energy production and minimizing grid reliance. Larger systems, however, lead to up to 49% higher WLC, emphasizing the need for appropriately sizing PV installations to align production with demand. These findings highlight the variability in economic benefits across consumption patterns and scenario parameters, such as electricity prices and subsidies. The complexity increases when comparing energy upgrades across countries, illustrating the challenge of establishing consistent EU-wide policy measures.
By integrating LCA and LCC with scenario-based evaluations, this study provides a robust framework for assessing the long-term impacts of renewable energy systems and retrofitting measures. Future research could build on this by exploring additional scenarios (e.g., incorporating additional operational conditions, such as seasonal demand fluctuations or hybrid usage models), incorporating real-time grid emissions and electricity price data to improve the accuracy of economic and environmental assessments under dynamic market conditions, and applying findings to larger building portfolios with different energy efficiency solutions to generalize findings across diverse contexts.

5. Conclusions

This study assessed the environmental and economic impacts of renovating a public kindergarten in Austria as part of the AURORAL project, with a focus on integrating PV systems and evaluating the outcomes of such investments under different socioeconomic conditions affecting the building’s energy profile. Using LCA and LCC methodologies, this analysis highlighted the potential benefits of renewable energy systems in reducing the building’s GWP and examined operational costs under varying usage conditions and installation sizes. By analyzing both a low-usage scenario (2021, during COVID-19) and a high-usage scenario (2024, post-pandemic), this study provides insights into how pandemic-related disruptions have the potential to affect the utilization and financial outcomes of energy sustainability measures, highlighting the need for comprehensive scenario-based analysis methodologies for the maximization of sustainability investment outcomes. During the low-usage period, the PV system met energy needs despite reduced operational demand, resulting in the lowest LCOE. However, the economic benefits were limited, as the lower energy demand reduced the revenue generated from surplus energy sold back to the grid. Under high-usage conditions, the renovation demonstrated more significant energy savings, emission reductions, and improved payback periods, emphasizing its potential for long-term economic and environmental benefits. The findings also highlighted the importance of appropriately sizing PV systems; depending on the pricing scheme and export rates, larger systems might not yield optimal economic returns over their lifetime. Furthermore, the results underscore the influence of favorable energy policies in enhancing the financial viability of PV installations and minimizing lifecycle costs, providing critical incentives for investments in RES systems.
This research contributes to the broader field of sustainable building practices by validating the importance of adaptive analysis frameworks that account for varying operational conditions and evolving energy policies. These findings are particularly relevant for municipalities and policymakers, as public buildings, such as educational facilities, represent significant energy expenditures [66,67,68]. Expanding the use of tools like VERIFY across similar projects in the public sector could accelerate the transition toward energy-efficient infrastructure, delivering cost savings and supporting climate action goals. Future research will build upon these findings by incorporating real-time energy data to enhance the accuracy of energy demand forecasts and PV system performance evaluations. Additionally, exploring the integration of energy storage solutions could help optimize self-consumption and reduce grid dependence, further improving economic feasibility. Analyzing the role of emerging energy technologies, such as battery storage and smart grid systems, could provide valuable insights into long-term energy sustainability investments. Furthermore, conducting an economic sensitivity analysis, assessing the impact of fluctuating energy prices, inflation rates, and subsidy changes, could enhance the understanding of financial risks and investment resilience in renewable energy projects. Such evaluations would help policymakers and stakeholders develop robust financial strategies for large-scale energy-efficient building renovations under dynamic economic conditions. The conclusions drawn from this study provide a robust foundation for advancing sustainability initiatives, ensuring that public buildings align with climate goals and financial efficiency benchmarks while contributing to broader sustainable city strategies and the development of sustainable, resilient infrastructure.

Supplementary Materials

The following supporting information can be downloaded at: https://www.mdpi.com/article/10.3390/app15052330/s1.

Author Contributions

Writing—original draft, G.K., G.I.; writing—review and editing, G.K., G.I., and A.S.; software, S.P. and N.-C.C.; conceptualization, A.S. and M.F.; project administration, D.A.; supervision, N.N. and D.R. All authors have read and agreed to the published version of the manuscript.

Funding

This research was funded by project AURORAL, Horizon 2020: Grant Agreement No. 101016854.

Institutional Review Board Statement

Not applicable.

Informed Consent Statement

Not applicable.

Data Availability Statement

The data presented in this study are available on request from the corresponding author. The data are not publicly available due to IP and confidentiality issues.

Conflicts of Interest

The authors declare no conflict of interest.

References

  1. Curran, M.A.; Young, S. Report from the EPA conference on streamlining LCA. Int. J. Life Cycle Assess. 1996, 1, 57–60. [Google Scholar] [CrossRef]
  2. Arulnathan, V.; Heidari, M.D.; Doyon, M.; Li, E.P.H.; Pelletier, N. Economic Indicators for Life Cycle Sustainability Assessment: Going Beyond Life Cycle Costing. Sustainability 2023, 15, 13. [Google Scholar] [CrossRef]
  3. Nicita, A.; Squadrito, G.; Maggio, G. Life-Cycle Cost (LCC) Applied to Hydrogen Technologies: A Review. Int. J. Life Cycle Assess. 2023, 29, 46–79. [Google Scholar] [CrossRef]
  4. World Economic Forum. Retrofitted Buildings: Accelerating the Energy Transition Through Sustainability. 2024. Available online: https://www.weforum.org/stories/2024/01/retrofitted-buildings-energy-transition/ (accessed on 1 September 2024).
  5. Quaschning, V. Understanding Renewable Energy Systems; Earthscan: London, UK, 2005. [Google Scholar] [CrossRef]
  6. Zulfiqar, F.; Muhammad-Sukki, F.; Abu-Bakar, S.H.; Bani, N.A.; Mas’Ud, A.A. Effect of COVID-19 on Photovoltaic Demand and Installation. IET Conf. Proc. 2023, 2023, 174–179. [Google Scholar] [CrossRef]
  7. Gui, X.; Gou, Z.; Zhang, F.; Yu, R. The Impact of COVID-19 on Higher Education Building Energy Use and Implications for Future Education Building Energy Studies. Energy Build. 2021, 251, 111346. [Google Scholar] [CrossRef]
  8. Saadé, M.; Erradhouani, B.; Pawlak, S.; Appendino, F.; Peuportier, B.; Roux, C. Combining Circular and LCA Indicators for the Early Design of Urban Projects. Int. J. Life Cycle Assess. 2022, 27, 1–19. [Google Scholar] [CrossRef]
  9. Fnais, A.; Rezgui, Y.; Petri, I.; Beach, T.; Yeung, J.; Ghoroghi, A.; Kubicki, S. The Application of Life Cycle Assessment in Buildings: Challenges, and Directions for Future Research. Int. J. Life Cycle Assess. 2022, 27, 627–654. [Google Scholar] [CrossRef]
  10. Braulio-Gonzalo, M.; Bovea, M.D. Environmental and Cost Performance of Building’s Envelope Insulation Materials to Reduce Energy Demand: Thickness Optimisation. Energy Build. 2017, 150, 527–545. [Google Scholar] [CrossRef]
  11. Bierer, A.; Götze, U.; Meynerts, L.; Sygulla, R. Integrating Life Cycle Costing and Life Cycle Assessment Using Extended Material Flow Cost Accounting. J. Clean. Prod. 2015, 108, 1289–1301. [Google Scholar] [CrossRef]
  12. Jiménez-Gómez, L.M.; Velásquez-Henao, J.D. A Comprehensive Analysis of Real Options in Solar Photovoltaic Projects: A Cluster-Based Approach. Heliyon 2024, 10, e35984. [Google Scholar] [CrossRef]
  13. Zhao, G.; Clarke, J.; Searle, J.; Lewis, R.; Baker, J. Economic Analysis of Integrating Photovoltaics and Battery Energy Storage System in an Office Building. Energy Build. 2023, 284, 112885. [Google Scholar] [CrossRef]
  14. Linssen, J.; Stenzel, P.; Fleer, J. Techno-Economic Analysis of Photovoltaic Battery Systems and the Influence of Different Consumer Load Profiles. Appl. Energy 2015, 153, 333–346. [Google Scholar] [CrossRef]
  15. Mao, D.; Yang, S.; Ma, L.; Ma, W.; Yu, Z.; Xi, F.; Yu, J. Overview of Life Cycle Assessment of Recycling End-of-Life Photovoltaic Panels: A Case Study of Crystalline Silicon Photovoltaic Panels. J. Clean. Prod. 2023, 434, 140320. [Google Scholar] [CrossRef]
  16. Khairi, N.H.M.; Akimoto, Y.; Okajima, K. Suitability of Rooftop Solar Photovoltaic at Educational Building Towards Energy Sustainability in Malaysia. Sustain. Horiz. 2022, 4, 100032. [Google Scholar] [CrossRef]
  17. Rotas, R.; Fotopoulou, M.; Drosatos, P.; Rakopoulos, D.; Nikolopoulos, N. Adaptive Dynamic Building Envelopes with Solar Power Components: Annual Performance Assessment for Two Pilot Sites. Energies 2023, 16, 2148. [Google Scholar] [CrossRef]
  18. Spudys, P.; Osadcha, I.; Morkunaite, L.; Manhanga, F.C.; Georgali, P.Z.; Klumbyte, E.; Jurelionis, A.; Papadopoulos, A.; Fokaides, P. A comparative life cycle assessment of building sustainability across typical European building geometries. Energy 2024, 302, 131693. [Google Scholar] [CrossRef]
  19. Seitaridis, A.; Mamounakis, I.; Tagkoulis, N.; Iliadis, P.; Bellos, E.; Papalexis, C.; Sougakis, V.; Nikolopoulos, N. An Innovative software platform for efficient energy, environmental and cost planning in buildings retrofitting. In IFIP International Conference on Artificial Intelligence Applications and Innovations; Maglogiannis, I., Iliadis, L., Macintyre, J., Cortez, P., Eds.; Springer International Publishing: Cham, Switzerland, 2023; pp. 217–228. [Google Scholar] [CrossRef]
  20. Skopetou, N.; Zestanakis, P.A.; Rotas, R.; Iliadis, P.; Papadopoulos, C.; Nikolopoulos, N.; Sfakianakis, A.; Koroneos, C. Energy Analysis and Environmental Impact Assessment for Self-Sufficient Non-Interconnected Islands: The Case of Nisyros Island. J. Clean. Prod. 2024, 447, 141647. [Google Scholar] [CrossRef]
  21. Bellos, E.; Iliadis, P.; Papalexis, C.; Rotas, R.; Mamounakis, I.; Sougkakis, V.; Nikolopoulos, N.; Kosmatopoulos, E. Holistic Renovation of a Multi-Family Building in Greece Based on Dynamic Simulation Analysis. J. Clean. Prod. 2022, 381, 135202. [Google Scholar] [CrossRef]
  22. BS EN 15978:2011; Sustainability of Construction Works—Assessment of Environmental Performance of Buildings—Calculation Method. BSI Standards Publication: London, UK, 2011. Available online: https://knowledge.bsigroup.com/products/sustainability-of-construction-works-assessment-of-environmental-performance-of-buildings-calculation-method?version=standard (accessed on 1 September 2024).
  23. ISO 14040:2006; Environmental Management—Life Cycle Assessment—Principles and Framework (2nd ed.). ISO: Geneva, Switzerland, 2006. Available online: https://www.iso.org/standard/37456.html (accessed on 1 September 2024).
  24. ISO 14044:2006; Environmental Management—Life Cycle Assessment—Requirements and Guidelines. ISO: Geneva, Switzerland, 2006. Available online: https://www.iso.org/standard/38498.html (accessed on 1 September 2024).
  25. BS EN 15804:2012+A2:2019; Sustainability of Construction Works—Environmental Product Declarations—Core Rules for the Product Category of Construction Products. British Standards Institution: London, UK, 2013. Available online: https://shop.bsigroup.com (accessed on 1 September 2024).
  26. BS ISO 15686-5:2017; Buildings and Constructed Assets—Service Life Planning—Part 5: Life-Cycle Costing. British Standards Institution: London, UK, 2017. Available online: https://knowledge.bsigroup.com/products/organization-and-digitization-of-information-about-buildings-and-civil-engineering-works-including-building-information-modelling-bim-information-management-using-building-information-modelling-health-and-safety-information-1?version=standard&creative=730824407410&keyword=building%20information%20modelling%20iso&matchtype=b&network=g&device=c&gad_source=1&gclid=Cj0KCQiAwtu9BhC8ARIsAI9JHalpeL9SZHKyzAEQzD6md7Y_vzMfZfV6bWQwQkLk2NEjqP3yy7DXqQ0aAjz0EALw_wcB&gclsrc=aw.ds (accessed on 1 September 2024).
  27. prEN 15459:2006; Energy Efficiency for Buildings—Economic Evaluation Procedure for Energy Systems. European Committee for Standardization: Brussels, Belgium, 2006. Available online: https://www.cen.eu (accessed on 1 September 2024).
  28. BS EN 16627:2015; Sustainability of Construction Works—Assessment of Economic Performance of Buildings—Calculation Methods. British Standards Institution: London, UK, 2015. Available online: https://www.en-standard.eu/bs-en-16627-2015-sustainability-of-construction-works-assessment-of-economic-performance-of-buildings-calculation-methods/?srsltid=AfmBOorchUHeLxVubXRAYpAatxgwcLrsbgIkSsmu78Hap37nwpsLO7Sc (accessed on 1 September 2024).
  29. Dodd, N.; Donatello, S.; Cordella, M. Level(s) Indicator 1.1: Use Stage Energy Performance User Manual: Introductory Briefing, Instructions and Guidance (Publication version 1.2). European Commission, Joint Research Centre. 2021. Available online: https://susproc.jrc.ec.europa.eu/product-bureau//sites/default/files/2021-01/UM3_Indicator_1.1_v1.1_25pp.pdf (accessed on 1 September 2024).
  30. Dodd, N.; Donatello, S.; Cordella, M. Level(s) Indicator 1.2: Life Cycle Global Warming Potential (GWP) User Manual: Introductory Briefing, Instructions, and Guidance (Publication version 1.1). European Commission, Joint Research Centre. 2021. Available online: https://susproc.jrc.ec.europa.eu/product-bureau/sites/default/files/2021-01/UM3_Indicator_1.2_v1.1_37pp.pdf (accessed on 1 September 2024).
  31. Dodd, N.; Donatello, S.; Cordella, M. Level(s) Indicator 6.1: Life Cycle Costs User Manual: Introductory Briefing, Instructions, and Guidance (Publication version 1.1). European Commission, Joint Research Centre. 2021. Available online: https://susproc.jrc.ec.europa.eu/product-bureau/sites/default/files/2021-01/UM3_Indicator_6.1_v1.1_21pp.pdf (accessed on 1 September 2024).
  32. Huang, B.; Wang, Y.; Huang, Y.; Xu, X.; Chen, X.; Duan, L.; Yu, G.; Li, Z.; Liu, H.; Kua, H.W.; et al. Life Cycle Cost Analysis of Solar Energy via Environmental Externality Monetization. Sci. Total. Environ. 2022, 856, 158910. [Google Scholar] [CrossRef]
  33. De Wolf, C.; Cordella, M.; Dodd, N.; Byers, B.; Donatello, S. Whole Life Cycle Environmental Impact Assessment of Buildings: Developing Software Tool and Database Support for the EU Framework Level(s). Resour. Conserv. Recycl. 2022, 188, 106642. [Google Scholar] [CrossRef]
  34. Amoruso, F.M.; Schuetze, T. Carbon Life Cycle Assessment and Costing of Building Integrated Photovoltaic Systems for Deep Low-Carbon Renovation. Sustainability 2023, 15, 9460. [Google Scholar] [CrossRef]
  35. Herrando, M.; Elduque, D.; Javierre, C.; Fueyo, N. Life Cycle Assessment of Solar Energy Systems for the Provision of Heating, Cooling and Electricity in Buildings: A Comparative Analysis. Energy Convers. Manag. 2022, 257, 115402. [Google Scholar] [CrossRef]
  36. PRé Sustainability. SimaPro Software for Life Cycle Assessment. 2023. Available online: https://simapro.com (accessed on 1 September 2024).
  37. Athena Sustainable Materials Institute. Athena Impact Estimator for Buildings. 2023. Available online: https://athenasmi.org/our-software-data/impact-estimator/ (accessed on 1 September 2024).
  38. Wikipedia contributors. RETScreen. Wikipedia, The Free Encyclopedia. 2024. Available online: https://en.wikipedia.org/wiki/RETScreen (accessed on 1 September 2024).
  39. One Click LCA Ltd. One Click LCA: Life Cycle Assessment Software. 2023. Available online: https://www.oneclicklca.com (accessed on 1 September 2024).
  40. KieranTimberlake Research Group. Tally: Life Cycle Assessment in Building Information Modeling. 2023. Available online: https://choosetally.com (accessed on 1 October 2024).
  41. Kitsopoulou, A.; Ziozas, N.; Iliadis, P.; Bellos, E.; Tzivanidis, C.; Nikolopoulos, N. Energy performance analysis of alternative building retrofit interventions for the four climatic zones of Greece. J. Build. Eng. 2024, 87, 109015. [Google Scholar] [CrossRef]
  42. Ziozas, N.; Kitsopoulou, A.; Bellos, E.; Iliadis, P.; Gonidaki, D.; Angelakoglou, K.; Nikolopoulos, N.; Ricciuti, S.; Viesi, D. Energy Performance Analysis of the Renovation Process in an Italian Cultural Heritage Building. Sustainability 2024, 16, 2784. [Google Scholar] [CrossRef]
  43. Kitsopoulou, A.; Zacharis, A.; Ziozas, N.; Bellos, E.; Iliadis, P.; Lampropoulos, I.; Chatzigeorgiou, E.; Angelakoglou, K.; Nikolopoulos, N. Dynamic Energy Analysis of Different Heat Pump Heating Systems Exploiting Renewable Energy Sources. Sustainability 2023, 15, 11054. [Google Scholar] [CrossRef]
  44. Apostolopoulos, V.; Mamounakis, I.; Seitaridis, A.; Tagkoulis, N.; Kourkoumpas, D.-S.; Iliadis, P.; Angelakoglou, K.; Nikolopoulos, N. An integrated life cycle assessment and life cycle costing approach towards sustainable building renovation via a dynamic online tool. Appl. Energy 2023, 334, 120710. [Google Scholar] [CrossRef]
  45. Bellos, E.; Iliadis, P.; Papalexis, C.; Rotas, R.; Nikolopoulos, N.; Kosmatopoulos, E.; Halmdienst, C. Dynamic investigation of centralized and decentralized storage systems for a district heating network. J. Energy Storage 2022, 56, 106072. [Google Scholar] [CrossRef]
  46. Violidakis, I.; Atsonios, K.; Iliadis, P.; Nikolopoulos, N. Dynamic modeling and energy analysis of renewable heating and electricity systems at residential buildings using phase change material based heat storage technologies. J. Energy Storage 2020, 32, 101942. [Google Scholar] [CrossRef]
  47. Modelica Association. Modelica: A Unified Object-Oriented Language for Physical Systems Modeling. Modelica Association. 2024. Available online: https://modelica.org/ (accessed on 1 September 2024).
  48. ecoinvent Association. Ecoinvent Database v3. Ecoinvent. 2024. Available online: https://ecoinvent.org/ (accessed on 1 September 2024).
  49. Joint Research Centre (JRC). Emission factors for CO2 equivalent (CO2-eq) emissions in EU Member States (1990–2021). European Commission. 2021. Available online: https://data.jrc.ec.europa.eu/dataset/919df040-0252-4e4e-ad82-c054896e1641 (accessed on 1 September 2024).
  50. Seber, G.A.F.; Wild, C.J. Nonlinear Regression; John Wiley & Sons: Hoboken, NJ, USA, 2003. [Google Scholar] [CrossRef]
  51. Eurostat. Electricity Prices for Household Consumers (NRG_PC_204). European Commission. 2023. Available online: https://ec.europa.eu/eurostat/databrowser/view/nrg_pc_204/default/table?lang=en (accessed on 1 September 2024).
  52. Inflation.eu. Historic Inflation Austria—CPI Inflation Austria 2021. 2023. Available online: https://www.inflation.eu/en/inflation-rates/austria/historic-inflation/cpi-inflation-austria-2021.aspx (accessed on 1 September 2024).
  53. European Central Bank. The Impact of the Pandemic and the War: Insights from the ECB’s Consumer Expectations Survey. Economic Bulleti. 2022. Available online: https://www.ecb.europa.eu/press/economic-bulletin/focus/2022/html/ecb.ebbox202204_01~68ef3c3dc6.en.html (accessed on 1 September 2024).
  54. International Energy Agency (IEA). Eco-Social Tax Reform Act (Austria ETS); IEA: Paris, France, 2024; Available online: https://www.iea.org/policies/13998-eco-social-tax-reform-act-austria-ets (accessed on 1 September 2024).
  55. Taxually. Austria VAT Rate and Compliance 2024. Taxually. 2024. Available online: https://www.taxually.com/blog/austria-vat-rate-and-compliance-2024 (accessed on 1 September 2024).
  56. Dufo-López, R.; Bernal-Agustín, J.L. A comparative assessment of net metering and net billing policies. Study cases for Spain. Energy 2015, 84, 684–694. [Google Scholar] [CrossRef]
  57. International Energy Agency (IEA). Cost of Capital by Project Type in Selected Countries; IEA: Paris, France, 2022; Available online: https://www.iea.org (accessed on 1 September 2024).
  58. Amann, C.; Torres, P.; Boldizsár, G.; Hofer, G.; Stumpf, W.; Leutgöb, K.; van Nuffel, L. Support to Primary Energy Factors Review (PEF): Final Report. European Commission Directorate-General for Energy. 2023. Available online: https://ec.europa.eu (accessed on 1 September 2024).
  59. International Energy Agency Photovoltaic Power Systems Programme (IEA-PVPS). National Survey Report of PV Power Applications in Austria 2023. 2023. Available online: https://iea-pvps.org/wp-content/uploads/2024/10/National-Survey-Report-of-PV-Power-Applications-in-Austria-2023.pdf (accessed on 1 September 2024).
  60. Wikipedia Contributors. COVID-19 Pandemic in Austria. Wikipedia, The Free Encyclopedia. 2024. Available online: https://en.wikipedia.org/wiki/COVID-19_pandemic_in_Austria (accessed on 1 September 2024).
  61. Brychkov, D.; Goggins, G.; Doherty, E.; Romero, N.; Roudil, N.; Di Trani, A.; Singh, A.; Smit, S.; McLoughlin, E.; Lima, R.d.C.R.; et al. A systemic framework of energy efficiency in schools: Experiences from six European countries. Energy Effic. 2023, 16, 21. [Google Scholar] [CrossRef]
  62. Kabeyi, M.J.B.; Olanrewaju, O.A. The levelized cost of energy and modifications for use in electricity generation planning. Energy Rep. 2023, 9, 495–534. [Google Scholar] [CrossRef]
  63. Fraunhofer Institute for Solar Energy Systems ISE. “Levelized Cost of Electricity—Renewables Clearly Superior to Conventional Power Plants Due to Rising CO2 Prices”. 2021. Available online: https://www.ise.fraunhofer.de (accessed on 1 September 2024).
  64. The Constructor. Energy Efficiency in Buildings—Need, Benefits, and Methods. 2023. Available online: https://theconstructor.org/building/buildings/energy-efficiency-building/562100/ (accessed on 1 September 2024).
  65. Energy Theory. Net Billing vs Net Metering: Key Differences and Benefits. 2024. Available online: https://energytheory.com/net-billing-vs-net-metering/ (accessed on 1 September 2024).
  66. Pachta, V.; Giourou, V. Comparative Life Cycle Assessment of a Historic and a Modern School Building, Located in the City of Naoussa, Greece. Sustainability 2022, 14, 4216. [Google Scholar] [CrossRef]
  67. Bilir, L.; Yildirim, N. Photovoltaic System Assessment for a School Building. Int. J. Hydrogen Energy 2017, 42, 17856–17868. [Google Scholar] [CrossRef]
  68. European Commission. Energy School—Guardians of Smart Energy Schools. Available online: https://ec.europa.eu/regional_policy/projects/projects-database/energy-school-guardians-of-smart-energy-schools_en (accessed on 1 September 2024).
Figure 1. Integration of INTEMA and VERIFY within AURORAL Framework for Comprehensive LCA and LCC Analysis.
Applsci 15 02330 g001
Figure 2. Daily Export and Self-Consumption Patterns for Low Usage (2021).
Applsci 15 02330 g002
Figure 3. Daily Export and Self-Consumption Patterns for High Usage (2024).
Applsci 15 02330 g003
Figure 4. Monthly Export to Grid, Self-Consumption, and Electrical Demand during Low Usage (2021).
Applsci 15 02330 g004
Figure 5. Monthly Export to Grid, Self-Consumption, and Electrical Demand Under High Usage (2024).
Applsci 15 02330 g005
Figure 6. Annual PE Demand for Low and High Usage over 25 years of analysis.
Applsci 15 02330 g006
Figure 7. Annual GHG Emissions for Low and High Usage over 25 years of analysis.
Applsci 15 02330 g007
Figure 8. ROI in Different Usage Cases and Schemes.
Applsci 15 02330 g008
Table 1. Basic Key Attributes of SBA1 Kindergarten.
ParameterDetails
Project NameSBA1 Kindergarten
LocationSouthern Burgenland, Austria (Latitude: 47.0145, Longitude: 16.4579)
Building TypePublic Kindergarten
Building StructureSingle-story, primarily brick construction
Total Floor Area168.85 m2
Operation ScheduleYear-round
External Wall MaterialBrick
Number of Floors1
Operational ParametersNet billing buyback scheme
Primary Energy SourceElectricity
Table 2. Building Components and Systems.
ComponentDetails
Heating SystemHeat Pump Air-to-Water
Thermal Rating (kW)9.6
Heating Efficiency2.5
Lifetime (years)20
Heating Purchase Cost (EUR)6720.00
Heating Maintenance Cost (EUR/year)490.56
Cooling SystemBasic Air Conditioning
Thermal Rating (kW)7.5
Cooling COP2.5
Lifetime (years)20
Cooling System Purchase Cost (EUR)1298.08
Cooling System Maintenance Cost (EUR/year)51.92
Insulation MaterialExtruded Polystyrene
Thickness (mm)100
Surface Area (m2)110.3
CoverageAll Walls
Lifetime (years)100
Insulation Purchase Cost (EUR)3131.90
Glazing TypeDouble Glazing (Double/Float 4–16–4 (Air))
Glazing Opening Surface (m2)160.61
Frame MaterialAluminium Frame (20% Frame Coverage)
Glazing Lifetime (years)40
Glazing Purchase Cost (EUR)51,652.18
Glazing Maintenance Cost (EUR/year)25.83
Tank for Domestic Hot WaterCopper Tank
Tank Capacity (L)600
Electricity Rating (kW)5
Lifetime (years)20
DHW Purchase Cost (EUR)1681.79
DHW Maintenance Cost (EUR/year)16.82
Table 3. Energy Upgrade Details (PV system).
PV System ParameterDetails
MountingRoof-slanted PV System
PV Panel MaterialPolycrystalline-Si
Reference Capacity (kWp)20.14
PV Purchase Cost (EUR)19,334.40
Lifetime of PV System (years)30
Table 4. Primary Energy Demand and GHG Emissions (Stage A) for Key Building Systems.
ComponentStage A—PE Demand (GJ)Stage A—GWP (kgCO2-eq)
Heat Pump Air-to-Water6.321526.4
Basic Air Conditioning0.05253525
Insulation74.443187.31
Glazing62.485460.74
Domestic Hot Water10.1868
PV System177011,882.6
Table 5. Country-Specific Electricity and Emissions Factors for Austria.
ParameterValueUnits
Primary Energy Factor1.91KWhP/kWh
CO2-eq Emission Factors2021: 0.281kg/kWh
2022: 0.225
2023: 0.192
2024: 0.312
Table 6. Electricity Prices and Inflation Rates of Austria (source Eurostat (https://ec.europa.eu/eurostat/databrowser/view/nrg_pc_204/default/table?lang=en (accessed on 16 October 2024))).
PricesAverage of 202120242024 (Without Subsidy)
Import Price (EUR/kWh)0.22510.27310.3878
Export Price (EUR/kWh)0.14210.29460.2946
Buyback Price (EUR/kWh)0.06350.07710.0836
Inflation Rate (%)2.763.48
Table 7. PV Characteristics Across Usage Scenarios.
CaseElectrical Demand (kWh/year)PV Production (kWh/year)CAPEX (EUR)
Low Usage773924,066.9927,158.79
High Usage (Large PV)10,608.3524,066.9929,897.83
High Usage (Small PV)13,431.6616,687.37
Table 8. Key Performance Indicators.
KPI NameEquationUnitsDescription
Environmental KPIs
Global Warming Potential (GWP) L G W P = L G H G U s e f u l   a r e a with
L G H G = I G H G + i = 1 N ( O G H G [ i ] )
kg CO2-eq/m2 L G H G : Total greenhouse gas emissions over the lifecycle
Useful Area: Building area with heating/cooling access
O G H G [ i ] : Operational GHG emissions of the building’s components in year i;
I G H G : infrastructure (embodied) GHG emissions.
Primary Energy Demand (PED) L P E = I P E + i = 1 N ( O P E [ i ] ) kWh I P E : Energy demand during infrastructure/construction phases
O P E [ i ] : Operational/maintenance energy demand during building’s use stage
Economic KPIs
Lifecycle Costs (LCC) L C C = I C + i = 1 N O N C i V R EUR I C : Infrastructure costs (CAPEX)
O N C i : operational net costs, including energy consumption and maintenance
V R : Residual value of components at end of lifecycle
Whole Life Cost (WLC) W L C = I C + i = 1 N ( O C i ) V R EUR I C : Infrastructure costs (CAPEX)
O C i : operational costs (energy consumption/maintenance and operational revenues due to electricity exports from RES
V R : Residual value of components at end of lifecycle
Renewable Energy System (RES) Payback Period T P = T L + t r Years T L : Last year before cumulative savings meet or exceed RES investment
t r : Remaining fraction of the year required for full payback of RES investment
Levelized Cost of Electricity (LCOE) L C O E = i = 1 N I C , G E N [ i ] + O C , G E N , M N [ i ] + O C , G E N . N E I [ i ] ( 1 + r ) i i = 1 N S C [ i ] + E X [ i ] ( 1 + r ) i EUR/kWh I C , G E N [ i ] : generator infrastructure costs
O C , G E N , M N [ i ] : annual generator maintenance costs (which include replacement costs if the analysis period exceeds the generators’ lifetime)
O C , G E N . N E I [ i ] : costs of fuel used for electricity generation (applicable only in the case of electricity generators using other fuel)
S C [ i ] and E X [ i ] : total energy self-consumed and exported by the building
r : project discount rate
Net Present Value (NPV) N P V = i = 0 N R i C i ( 1 + r ) i EURRi: revenue or savings in period I
Ci: cost in period i, when i = 0 the C0 is the initial investment
r: project discount rate
i: period index
Return on Investment (ROI) R O I = N P V I n i t i a l   I n v e s t m e n t ratioNPV: Net Present Value
Initial Investment: capital expenditure at the beginning of the project
Table 9. Environmental Outcomes of Low and High Usage of the kindergarten for 25 years of analysis.
Environmental KPIsWithout PVLow UsageHigh Usage
Lifetime Primary Energy Demand (kWh)
Lifetime Primary Energy Demand Per m2 (kWh/m2)
TotalAnnual Avg.TotalAnnual Avg.Total Annual Avg.
547,94121,917.63385,04015,401.61510,02420,400.98
3245.13129.812280.3791.213020.57120.82
Lifetime Global Warming Potential (kgCO2-eq)61,868.072474.7245,975.521839.0256,796.022271.84
Lifetime Global Warming Potential per m2 (kgCO2-eq/m2)366.4114.66272.2910.89336.3713.45
Table 10. Economic Outcomes of Low and High Usage of the kindergarten for 25 years of analysis.
Net Metering BuybackLife Cycle Costs (LCC, EUR) Annual Avg. LCC (EUR/year) Whole Life Cycle Costs (WLC, EUR) Annual Avg. WLC (EUR/Year) PV Payback Period (Years)Net Billing Buyback Life Cycle Costs (LCC, EUR) Annual Avg. LCC (EUR/Year) Whole Life Cycle Costs (WLC, EUR) Annual Avg. WLC (EUR/Year) PV Payback Period (Years)
High Usage
Yearly60,882.412435.3034,148.971365.969.04Yearly60,882.412435.3033,450.651338.038.9
Yearly without subsidy60,882.412435.3032,908.381248.396.34Yearly without subsidy60,882.412435.3036,190.721447.636.63
Quarterly62,971.642518.8735,648.381425.949.28Quarterly62,176.112487.0434,405.781376.239.05
Monthly67,190.232678.6138,676.011547.049.9Monthly66,668.472666.7437,722.441508.909.7
Daily71,589.032863.5641,832.961673.9610.65Daily71,320.822852.8341,157.221646.2910.28
Low Usage
Yearly58,143.372325.7431,085.441243.4212.94Yearly 58,143.37 2325.74 34,363.04 1374.52 14.46
Quarterly 58,143.372325.7431,085.441243.4212.94Quarterly 59,471.80 2378.87 35,097.94 1403.91 14,82
Monthly 59,498.15 2379.93 32,058.04 1282.32 13,31 Monthly 61,765.93 2470.63 36,366.78 1454.67 15.56
Daily 63,275.30 2531.01 34,769.67 1390.79 14.66 Daily 64,080.84 2563.23 37,647.24 1505.89 16.38
High Usage Small PV
Yearly 47,671.95 1906.88 34,446.04 1377.84 6.01 Yearly 47,671.95 1906.88 33,709.74 1348.39 5.91
Quarterly 69,072.04 2762.88 49,804.58 1992.18 9.3 Quarterly 68,796.94 2751.88 49,306.10 1972.24 9.13
Monthly 69,072.04 2762.88 49,804.58 1992.18 9.3 Monthly 68,796.94 2751.88 49,306.10 1972.24 9.13
Daily 70,683.86 2827.35 50,961.36 2038.45 9.7 Daily 70,311.96 2812.48 50,424.62 2016.99 9.5
Table 11. Levelized Cost of Electricity Results.
Scenarios LCOE (EUR/kWh)
High Usage0.0885
Low Usage0.0811
High Usage (Small PV)0.0948
Disclaimer/Publisher’s Note: The statements, opinions and data contained in all publications are solely those of the individual author(s) and contributor(s) and not of MDPI and/or the editor(s). MDPI and/or the editor(s) disclaim responsibility for any injury to people or property resulting from any ideas, methods, instructions or products referred to in the content.

