
Application of Electrical Resistivity Tomography (ERT) in Detecting Abandoned Mining Tunnels Along Expressway


Abstract
1. Introduction
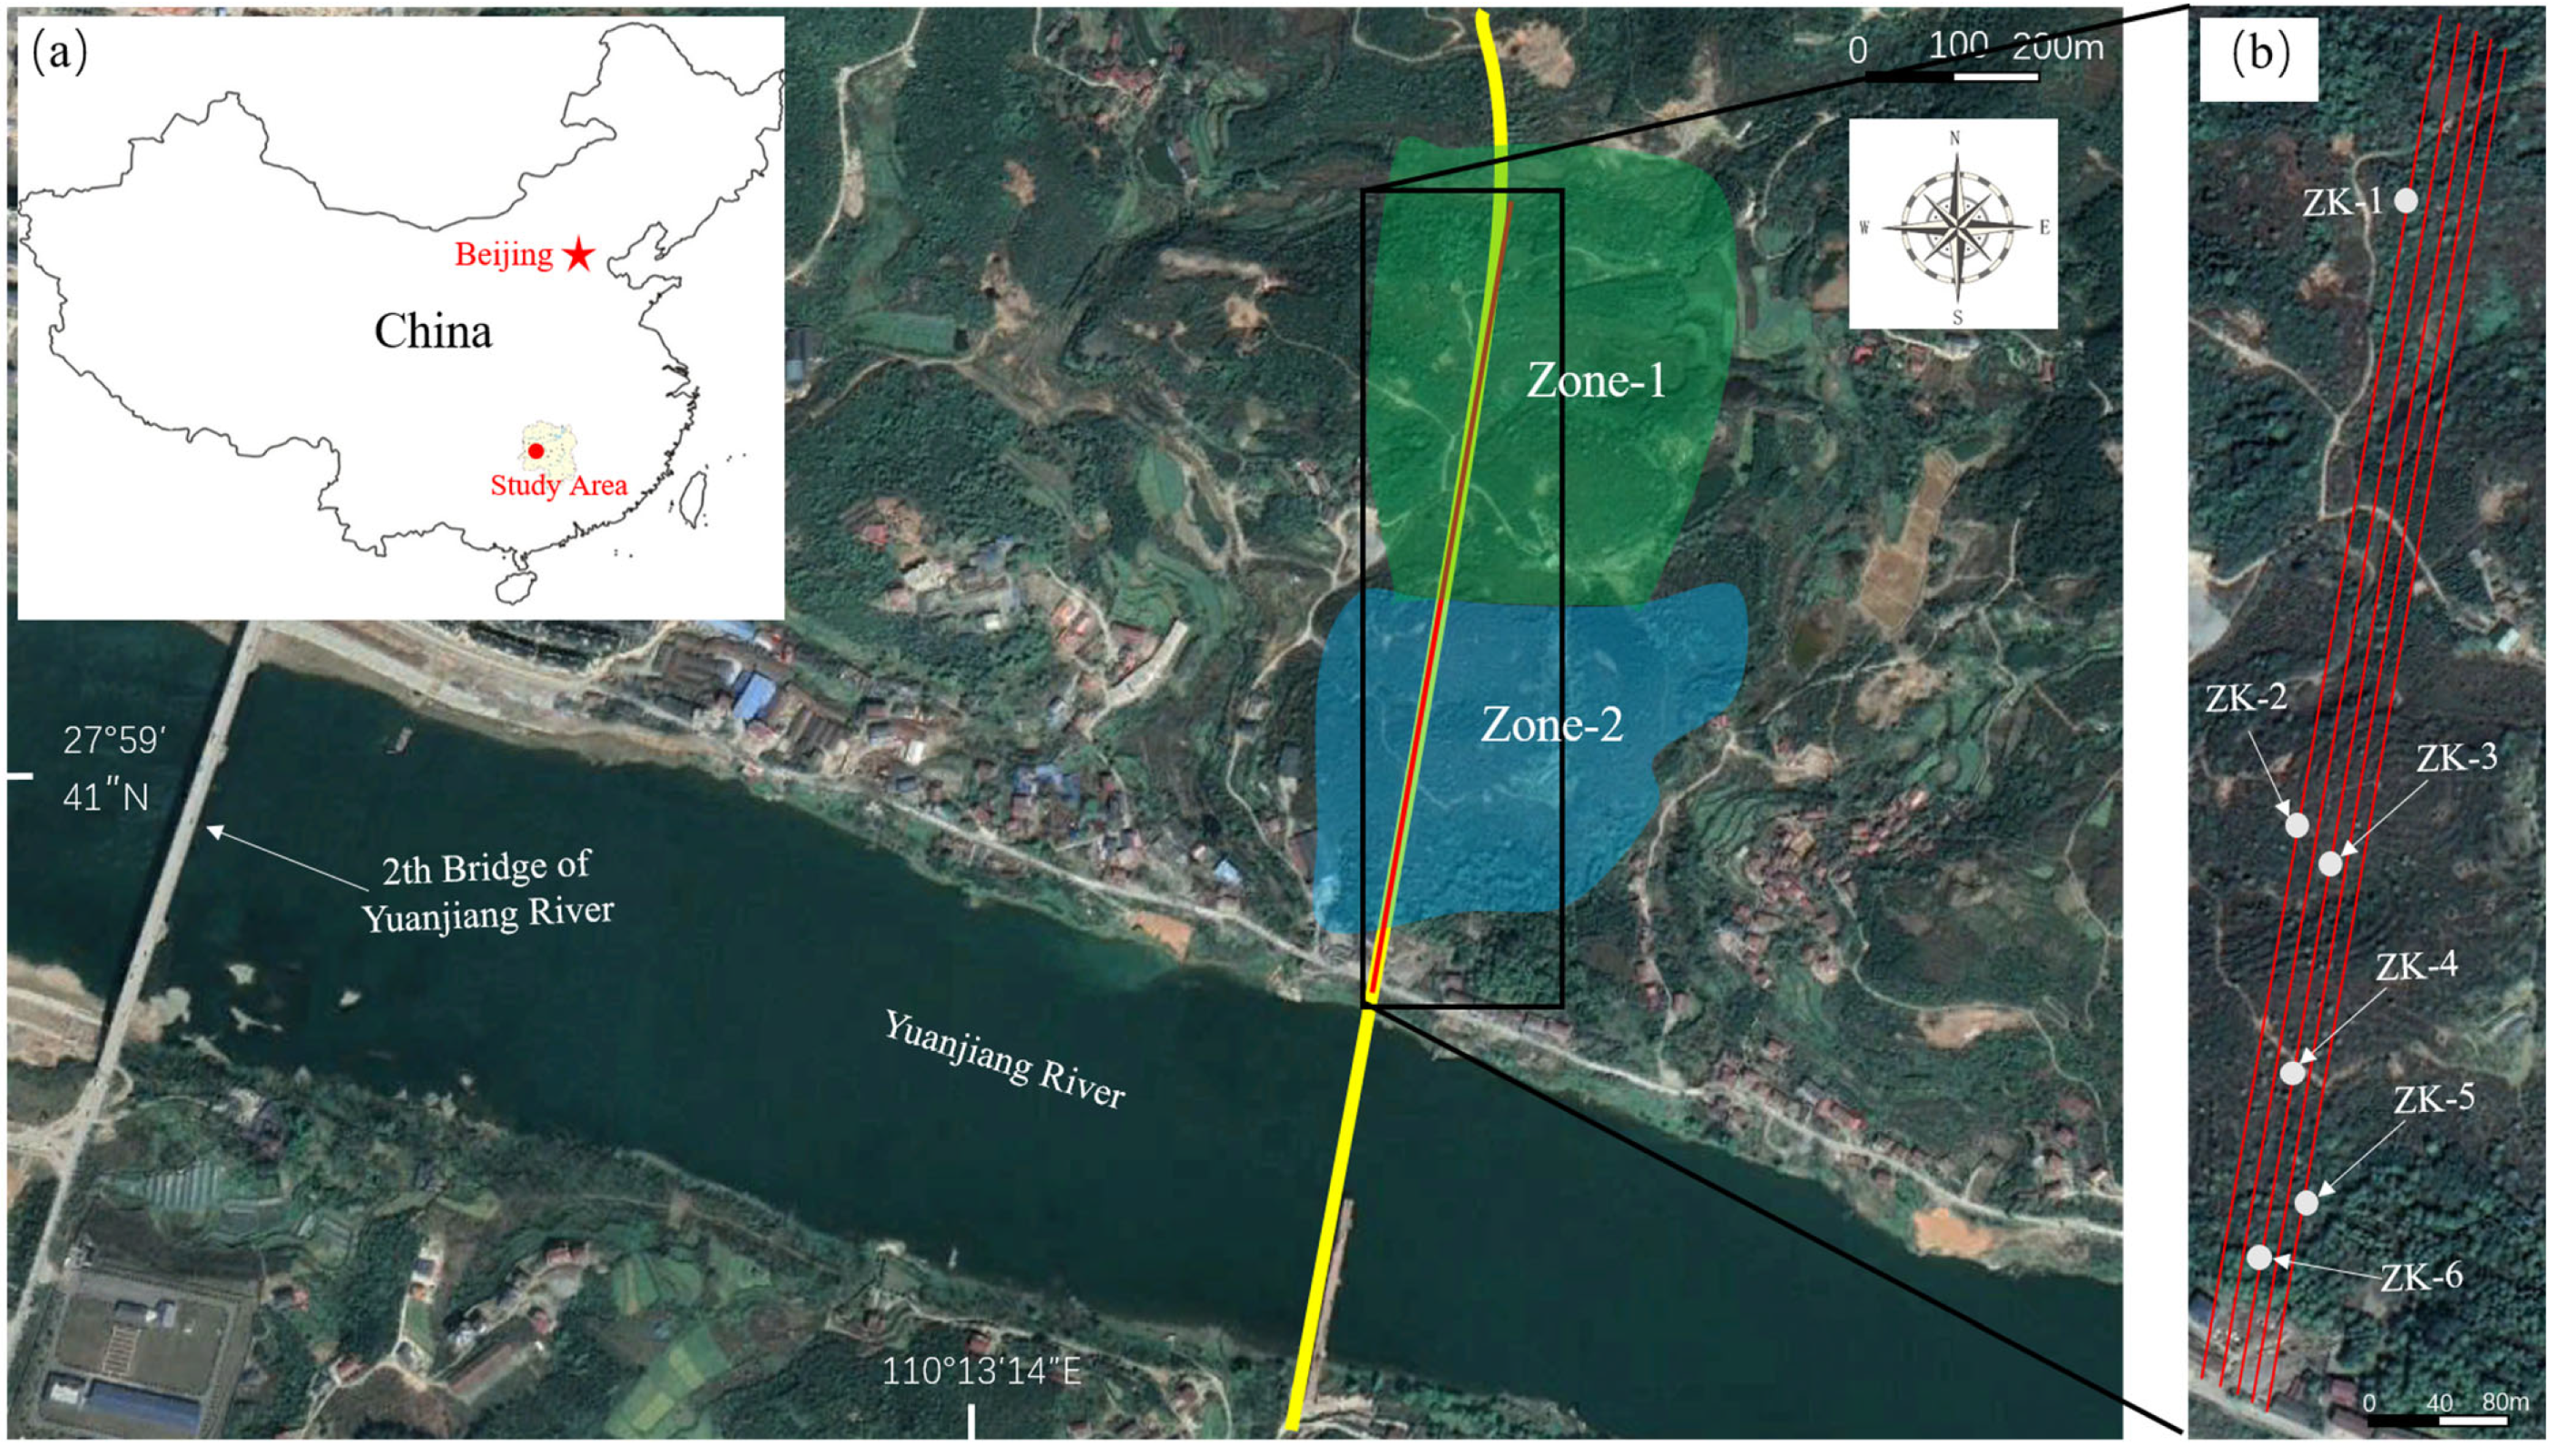
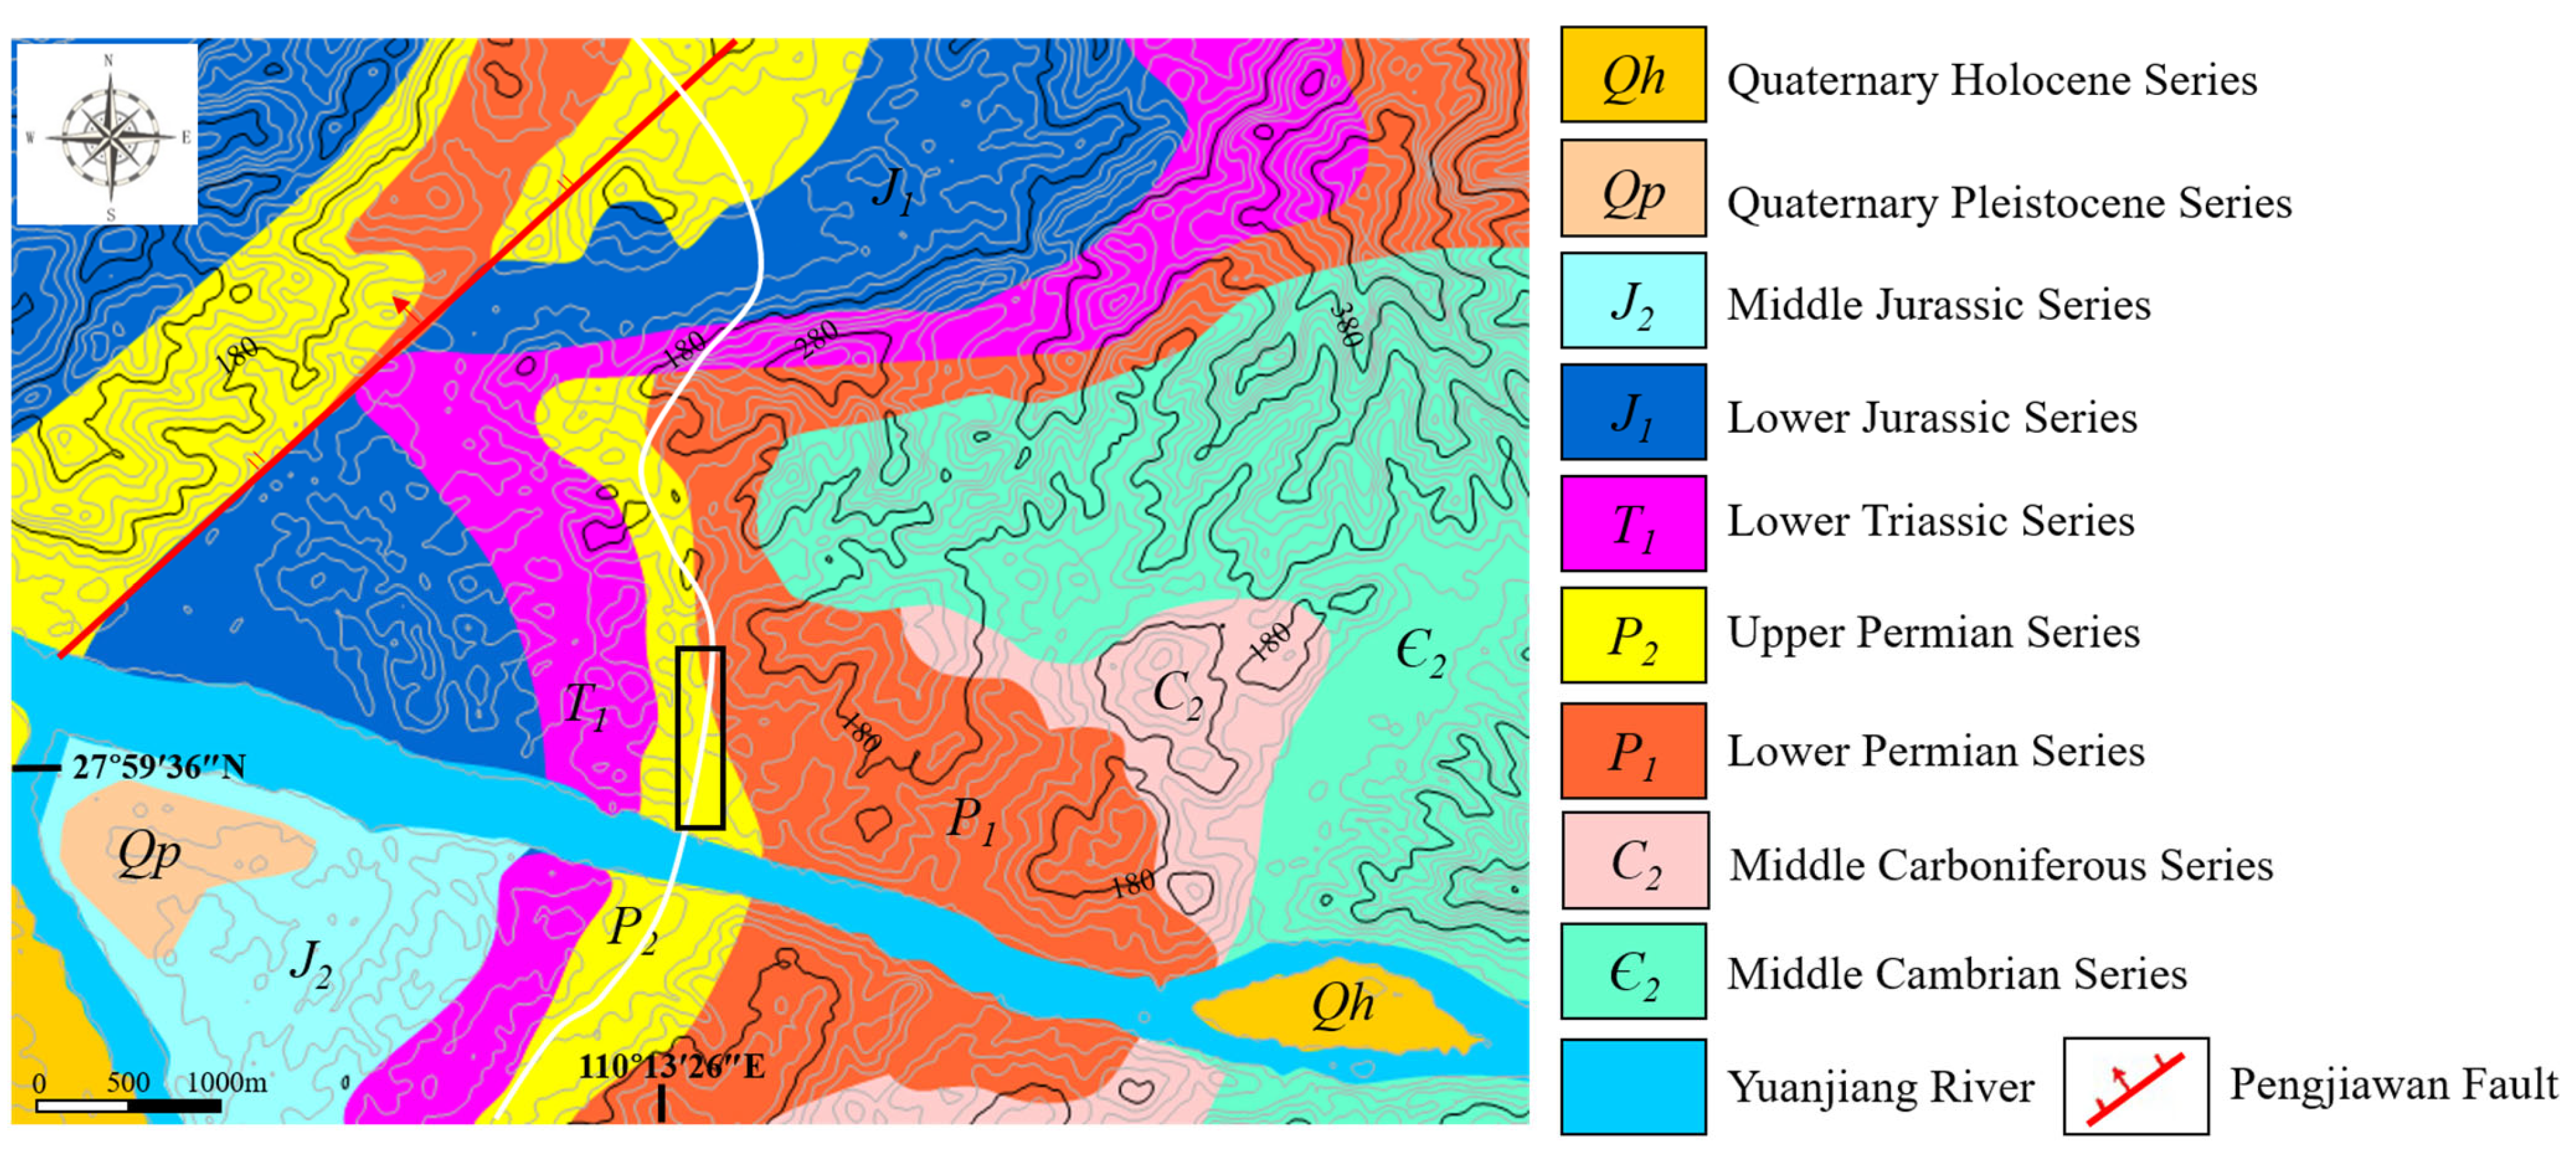
2. Study Area
3. Methodology
4. Results
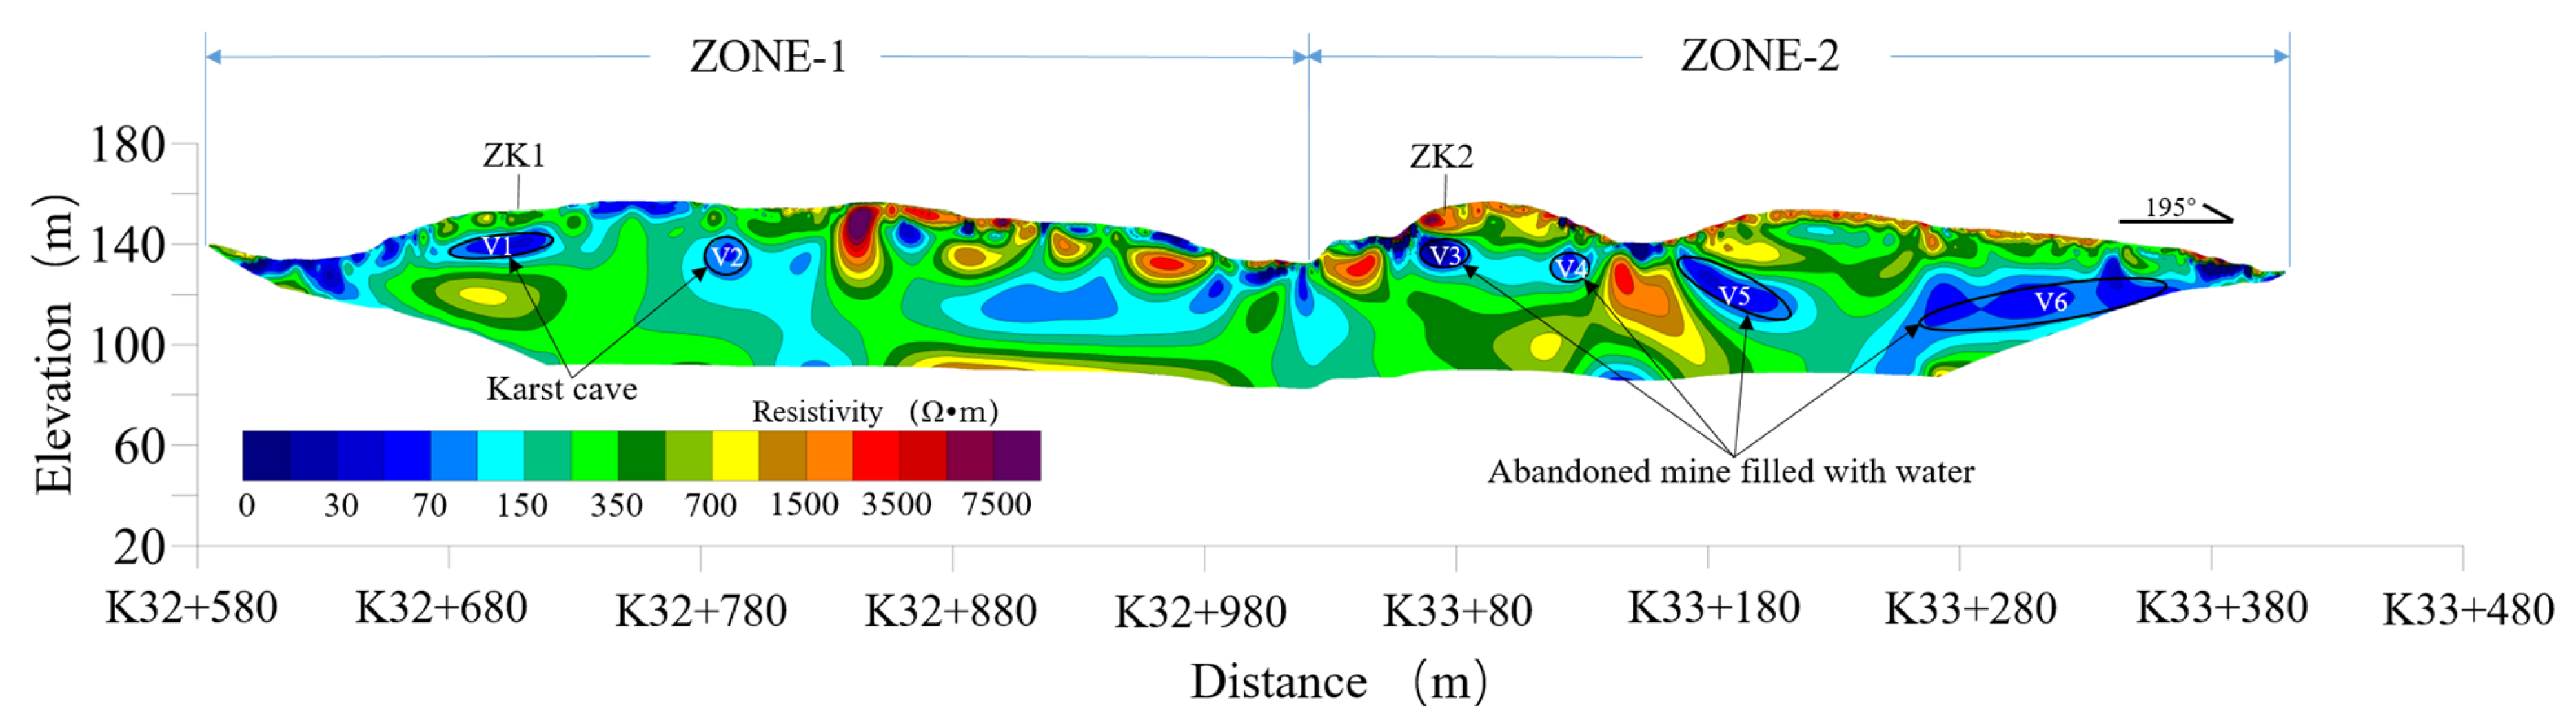
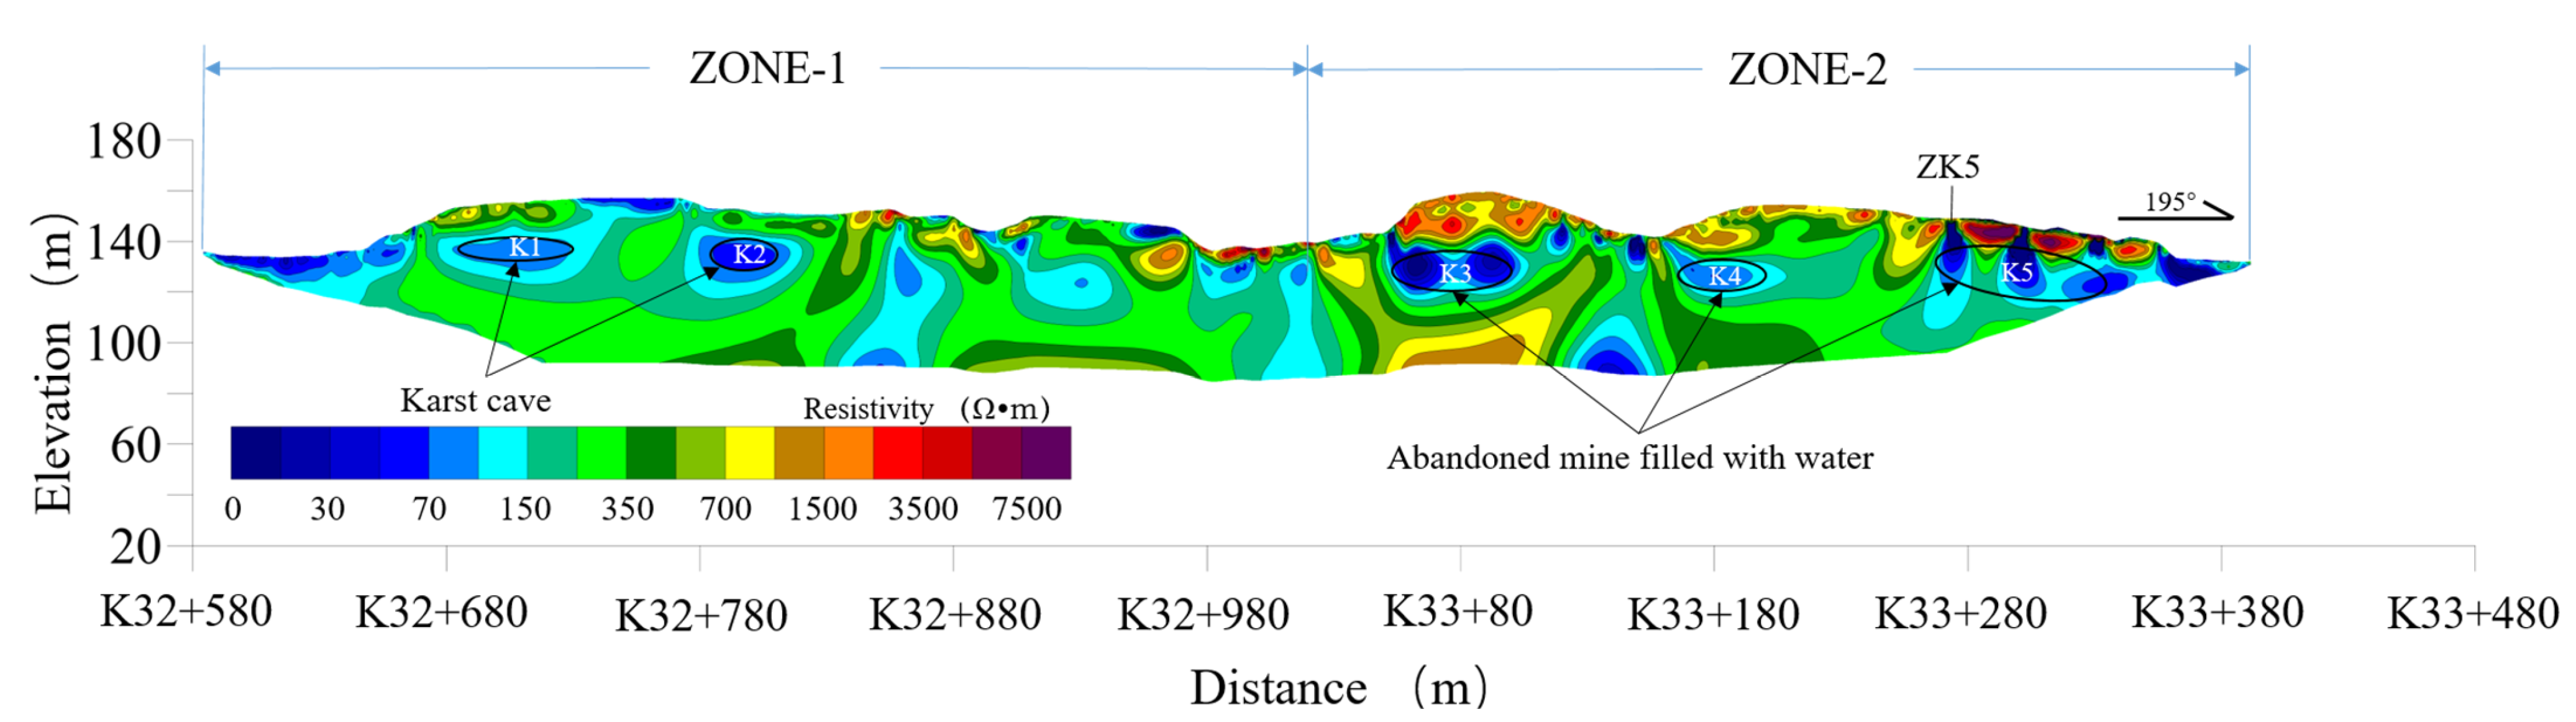
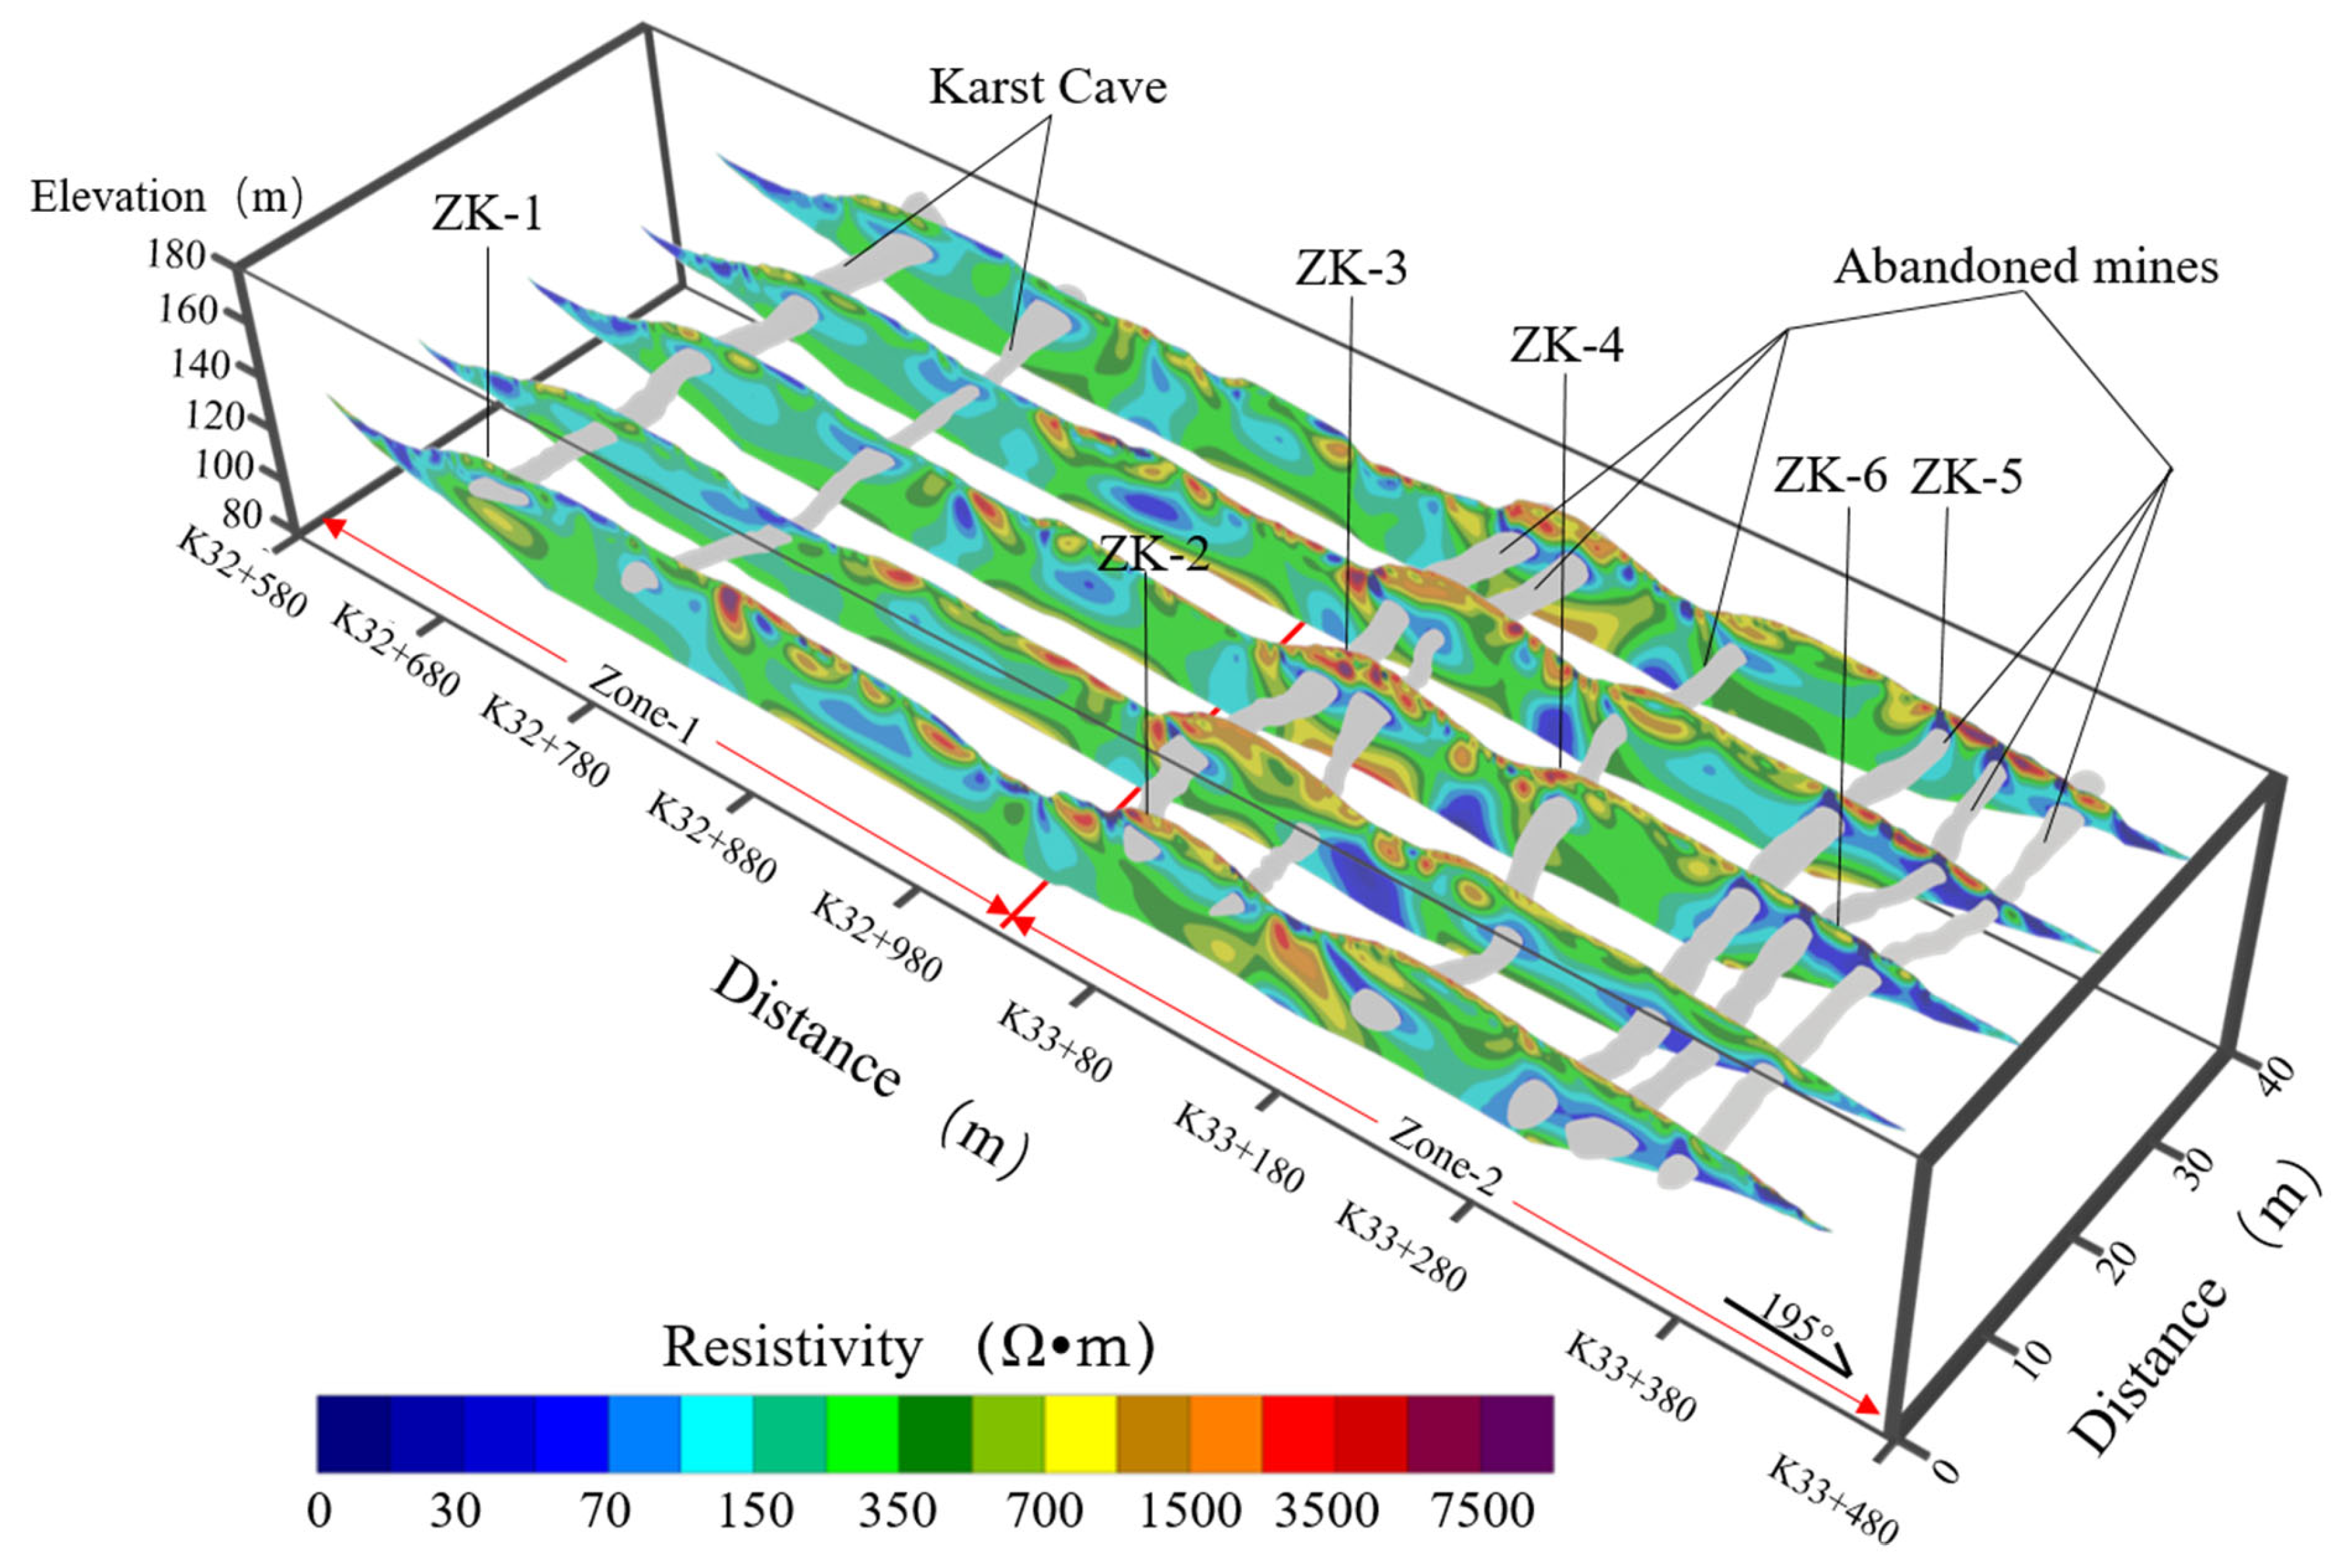
4.1. Measured Results and Geological Interpretation
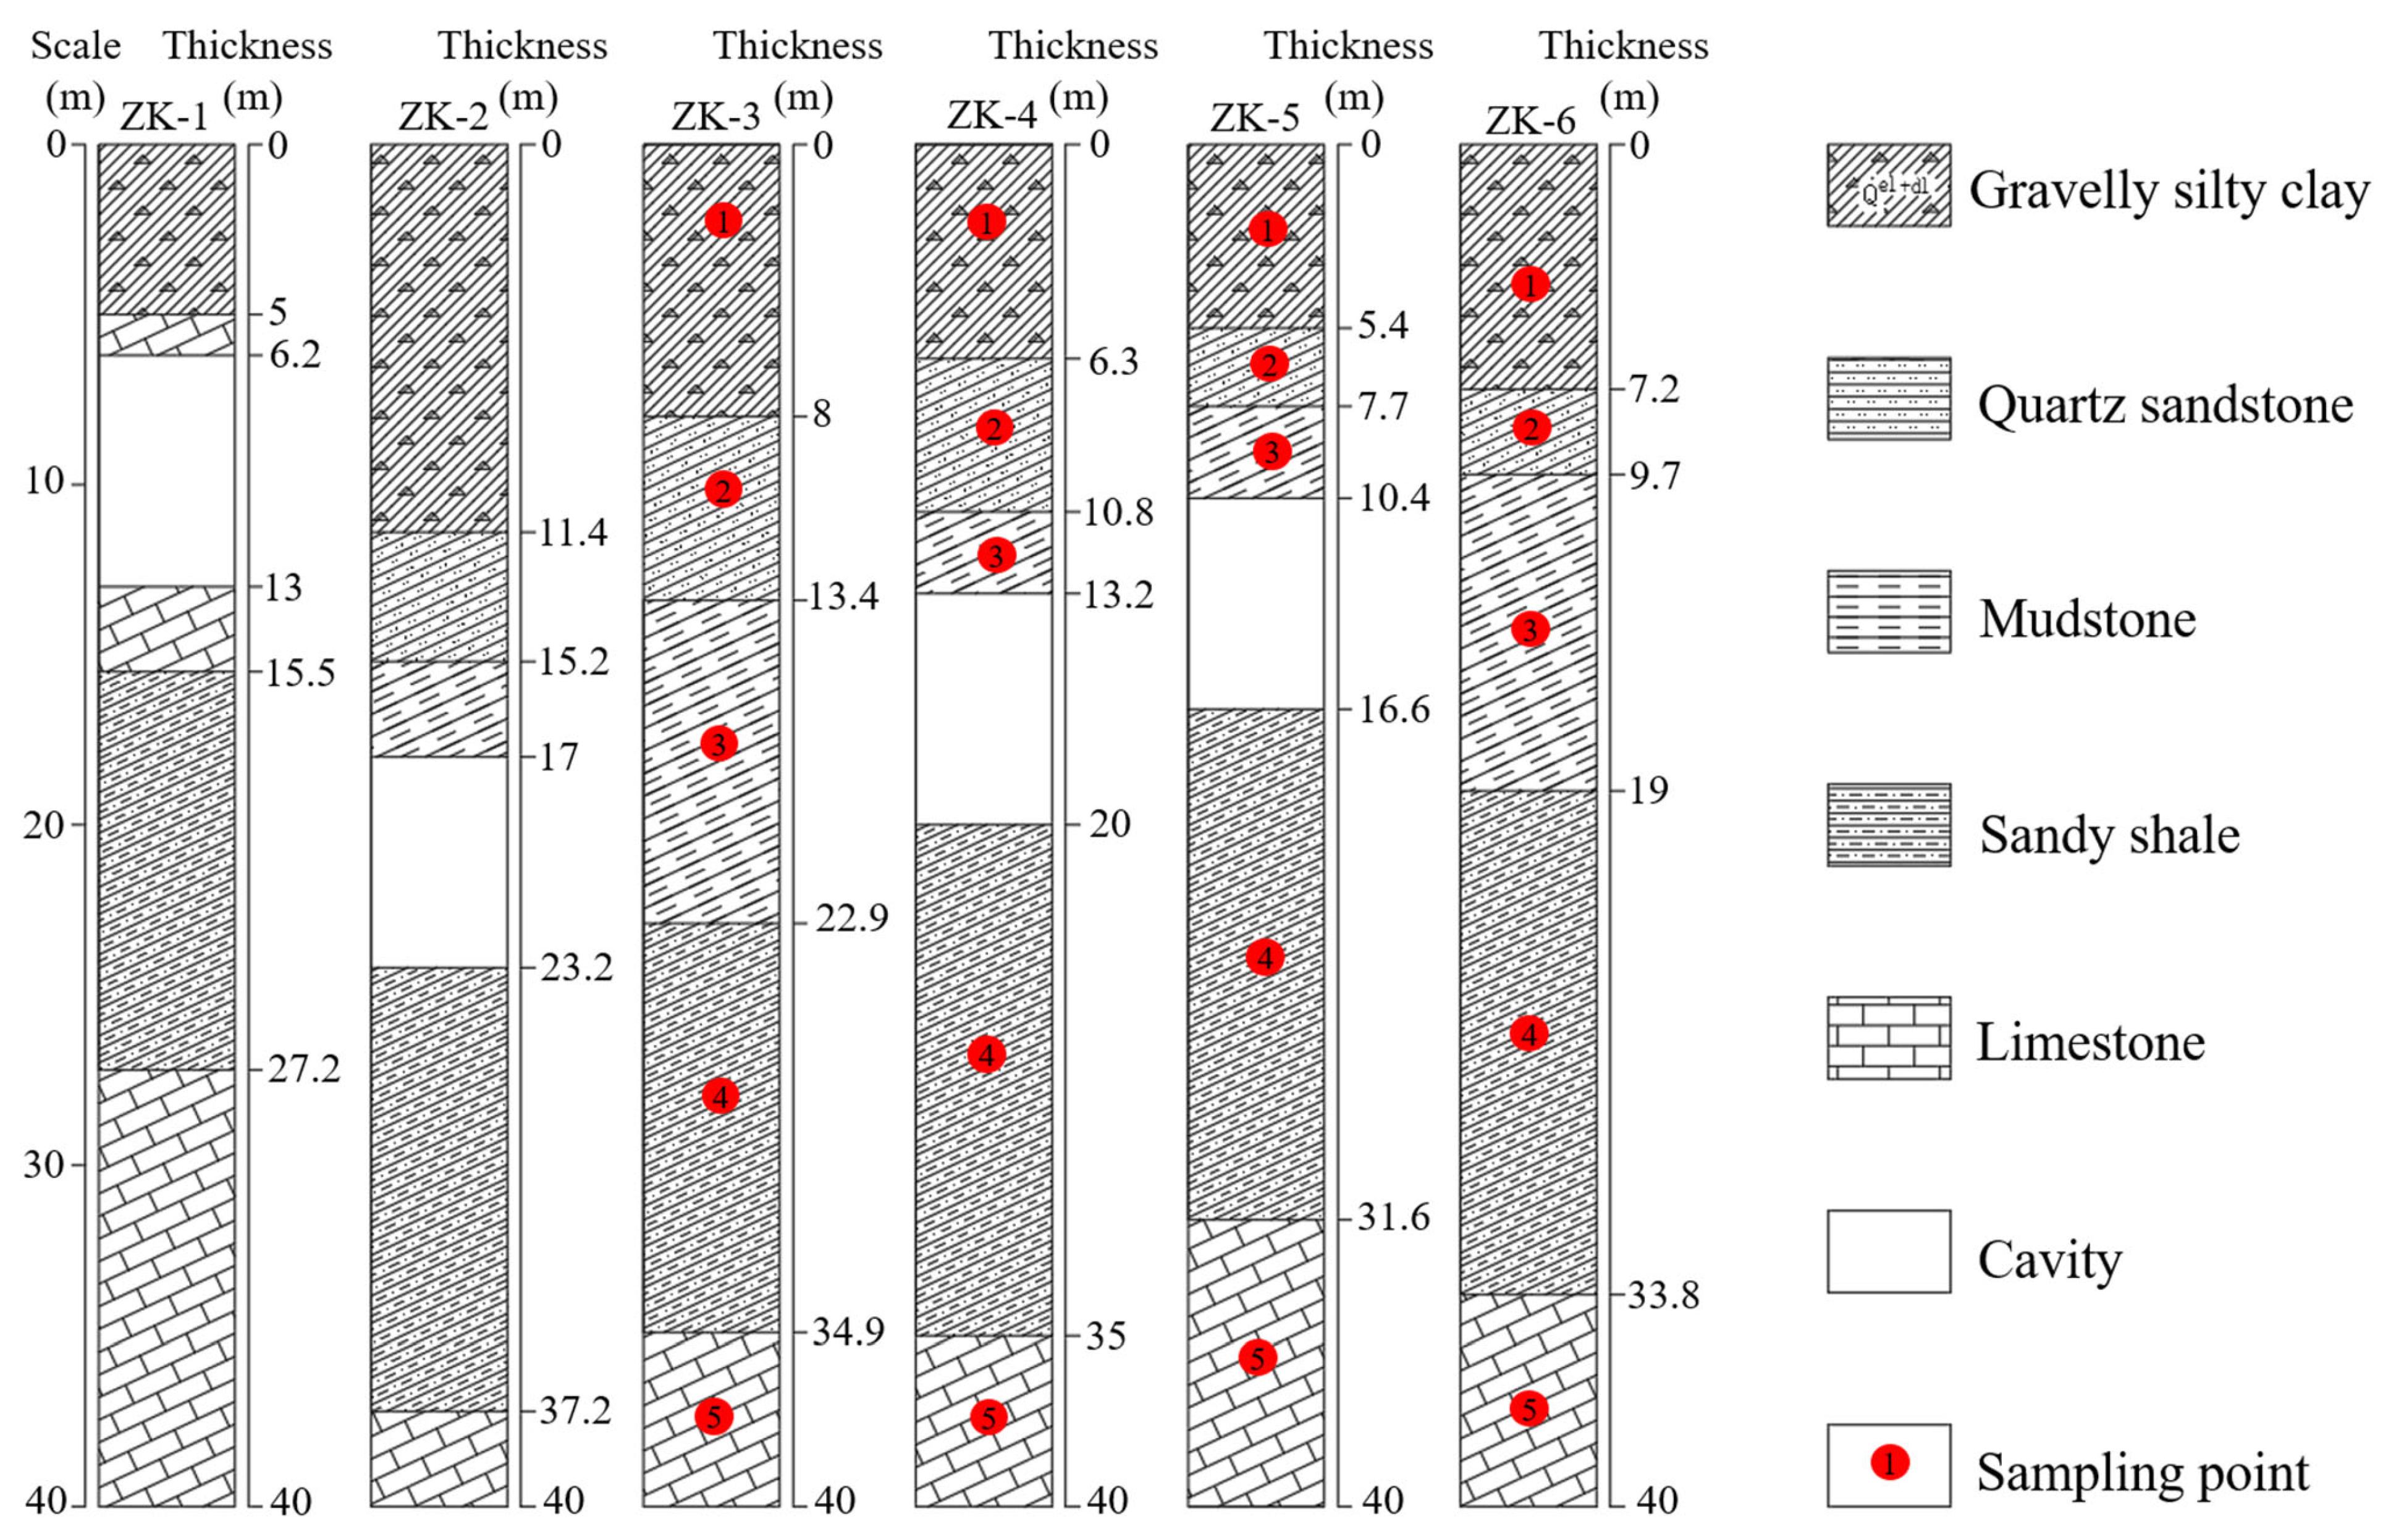
4.2. Borehole Results
5. Discussion
6. Conclusions
- The ERT profiles reveal a total of eight underground voids along the expressway route, with two in Zone-1 being identified as karst caves and six in Zone-2 being identified as abandoned mining tunnels.
- When two low-resistivity zones are large in volume and closely spaced, they may appear as a single low-resistivity zone in the inversion results.
- Boreholes not only validate the accuracy of the ERT results but also improve the precision of the ERT method.
- ERT is effective in reflecting the morphological characteristics of underground voids, providing valuable technical guidance for subsequent project construction and void treatment.
Author Contributions
Funding
Institutional Review Board Statement
Informed Consent Statement
Data Availability Statement
Conflicts of Interest
References
- Dubois, C.; Bini, A.; Quinif, Y. Karst morphologies and ghostrock karstification. Géomorphologie Relief Process. Environ. 2022, 28, 13–31. [Google Scholar] [CrossRef]
- Guo, L.; Zhang, Z.; Wang, X.; Yu, Q.; You, Y.; Yuan, C.; Xie, Y.; Gou, T. Stability analysis of transmission tower foundations in permafrost equipped with thermosiphons and vegetation cover on the Qinghai-Tibet Plateau. Int. J. Heat Mass Transf. 2018, 121, 367–376. [Google Scholar] [CrossRef]
- Qi, J.; Sheng, Y.; Zhang, J.; Wen, Z. Settlement of embankments in permafrost regions in the Qinghai-Tibet Plateau. Nor. Geogr. Tidsskr.-Nor. J. Geogr. 2007, 61, 49–55. [Google Scholar]
- Lumongsod, R.M.G.; Ramos, N.T.; Dimalanta, C.B. Mapping the karstification potential of central Cebu, Philippines using GIS. Environ. Earth Sci. 2022, 81, 449. [Google Scholar] [CrossRef]
- Butler, D.K. Detection and characterization of subsurface cavities, tunnels and abandoned mines. Near-Surf. Geophys. Hum. Act. 2008, 578–584. [Google Scholar]
- Kim, J.-G.; Ali, M.A.; Yang, H.-S. Robust design of pillar arrangement for safe room-and-pillar mining method. Geotech. Geol. Eng. 2019, 37, 1931–1942. [Google Scholar] [CrossRef]
- Nikitin, O. Mining block stability analysis for room-and-pillar mining with continuous miner in estonian oil shale mines. Oil Shale 2003, 20, 515–528. [Google Scholar] [CrossRef]
- Luan, H.J.; Lin, H.L.; Jiang, Y.J.; Wang, Y.H.; Liu, J.K.; Wang, P. Risks Induced by Room Mining Goaf and Their Assessment: A Case Study in the Shenfu-Dongsheng Mining Area. Sustainability 2018, 10, 17. [Google Scholar] [CrossRef]
- Wang, L.; Guo, Q.B.; Luo, J.; Zhang, Y.Y.; Wan, Z.S.; Wang, X.B. A Novel Evaluation Method for the Stability of Construction Sites on an Abandoned Goaf: A Case Study. KSCE J. Civ. Eng. 2022, 26, 2835–2845. [Google Scholar] [CrossRef]
- Chen, B. Stress-induced trend: The clustering feature of coal mine disasters and earthquakes in China. Int. J. Coal Sci. Technol. 2020, 7, 676–692. [Google Scholar] [CrossRef]
- Liu, J.; Liu, W.; Allechy, F.B.; Zheng, Z.; Liu, R.; Kouadio, K.L. Machine learning-based techniques for land subsidence simulation in an urban area. J. Environ. Manag. 2024, 352, 120078. [Google Scholar] [CrossRef] [PubMed]
- Mondal, D.; Roy, P. Fractal and seismic b-value study during dynamic roof displacements (roof fall and surface blasting) for enhancing safety in the longwall coal mines. Eng. Geol. 2019, 253, 184–204. [Google Scholar] [CrossRef]
- Niu, X.; Feng, G.; Liu, Q.; Han, Y.; Qian, R. Numerical investigation on mechanism and fluid flow behavior of goaf water inrush: A case study of Dongyu coal mine. Nat. Hazards 2022, 113, 1783–1802. [Google Scholar] [CrossRef]
- Zhao, Y.; Yang, T.; Bohnhoff, M.; Zhang, P.; Yu, Q.; Zhou, J.; Liu, F. Study of the rock mass failure process and mechanisms during the transformation from open-pit to underground mining based on microseismic monitoring. Rock Mech. Rock Eng. 2018, 51, 1473–1493. [Google Scholar] [CrossRef]
- Prins, C.; Thuro, K.; Krautblatter, M.; Schulz, R. Testing the effectiveness of an inverse Wenner-Schlumberger array for geoelectrical karst void reconnaissance, on the Swabian Alb high plain, new line Wendlingen–Ulm, southwestern Germany. Eng. Geol. 2019, 249, 71–76. [Google Scholar] [CrossRef]
- Srivastava, S.; Kumar, R.; Pal, S.K.; Bhattacharjee, R. Mapping of old coal mine galleries near railway track using electrical resistivity tomography and magnetic approaches in Tundu, Jogidih Colliery, Jharia Coalfield, India. J. Earth Syst. Sci. 2024, 133, 57. [Google Scholar] [CrossRef]
- Zhang, T.; Yang, Y.-L. Occurrence characteristics and treatment technologies of mine goaf in China: A comprehensive review. Environ. Earth Sci. 2024, 83, 441. [Google Scholar] [CrossRef]
- Bharti, A.; Prakash, A.; Verma, A.; Oraon, J.; Chaudhary, D.; Kumar, S.; Singh, K. Mapping of decades-old underground coal mine workings using electrical resistivity tomography. J. Earth Syst. Sci. 2022, 131, 258. [Google Scholar] [CrossRef]
- Bharti, A.K.; Pal, S.; Priyam, P.; Pathak, V.K.; Kumar, R.; Ranjan, S.K. Detection of illegal mine voids using electrical resistivity tomography: The case-study of Raniganj coalfield (India). Eng. Geol. 2016, 213, 120–132. [Google Scholar] [CrossRef]
- Diallo, M.C.; Cheng, L.Z.; Chouteau, M.; Rosa, E.; Liu, C.; Abbassi, B.; Dimech, A. Abandoned old mine excavation detection by Electrical Resistivity Tomography. Eng. Geol. 2023, 320, 107123. [Google Scholar] [CrossRef]
- El-Qady, G.; Hafez, M.; Abdalla, M.A.; Ushijima, K. Imaging subsurface cavities using geoelectric tomography and ground-penetrating radar. J. Cave Karst Stud. 2005, 67, 174–181. [Google Scholar]
- Gao, K.; Li, S.-N.; Han, R.; Li, R.-Z.; Liu, Z.-M.; Qi, Z.-P.; Liu, Z.-Y. Study on the propagation law of gas explosion in the space based on the goaf characteristic of coal mine. Saf. Sci. 2020, 127, 104693. [Google Scholar] [CrossRef]
- Putiška, R.; Nikolaj, M.; Dostál, I.; Kušnirák, D. Determination of cavities using electrical resistivity tomography. Contrib. Geophys. Geod. 2012, 42, 201–211. [Google Scholar] [CrossRef]
- Zhu, H.H.; Yan, J.X.; Liang, W.H. Challenges and Development Prospects of Ultra-Long and Ultra-Deep Mountain Tunnels. Engineering 2019, 5, 384–392. [Google Scholar] [CrossRef]
- Wu, X.; Pan, D.; Yu, J. Review in the geophysical methods for coalmine goaf prospecting. Prog. Geophys. 2022, 37, 1197–1206. [Google Scholar]
- Zhang, L.; Xu, L.; Xiao, Y.; Zhang, N. Application of comprehensive geophysical prospecting method in water accumulation exploration of multilayer goaf in integrated mine. Adv. Civ. Eng. 2021, 2021, 1434893. [Google Scholar] [CrossRef]
- Hou, F.; Rui, X.; Fan, X.; Zhang, H. Review of GPR activities in Civil Infrastructures: Data analysis and applications. Remote Sens. 2022, 14, 5972. [Google Scholar] [CrossRef]
- Panda, S.L.; Maiti, S.; Sahoo, U.K. Subsurface propagation velocity estimation methods in ground-penetrating radar: A review. IEEE Geosci. Remote Sens. Mag. 2022, 10, 70–89. [Google Scholar] [CrossRef]
- Neal, A. Ground-penetrating radar and its use in sedimentology: Principles, problems and progress. Earth-Sci. Rev. 2004, 66, 261–330. [Google Scholar] [CrossRef]
- Noon, D.A.; Stickley, G.F.; Longstaff, D. A frequency-independent characterisation of GPR penetration and resolution performance. J. Appl. Geophys. 1998, 40, 127–137. [Google Scholar] [CrossRef]
- Cardarelli, E.; Cercato, M.; De Donno, G.; Di Filippo, G. Detection and imaging of piping sinkholes by integrated geophysical methods. Near Surf. Geophys. 2014, 12, 439–450. [Google Scholar] [CrossRef]
- Fedin, K.V.; Kolesnikov, Y.I.; Ngomayezwe, L. Mapping of underground cavities by the passive seismic standing waves method: The case study of Barsukovskaya cave (Novosibirsk region, Russia). Geophys. Prospect. 2021, 69, 167–179. [Google Scholar] [CrossRef]
- Zhang, J.; Liu, S.; Yang, C.; Liu, X.; Wang, B. Detection of urban underground cavities using seismic scattered waves: A case study along the Xuzhou Metro Line 1 in China. Near Surf. Geophys. 2021, 19, 95–107. [Google Scholar] [CrossRef]
- Martínez-Moreno, F.J.; Pedrera, A.; Ruano, P.; Galindo-Zaldívar, J.; Martos-Rosillo, S.; González-Castillo, L.; Sánchez-Ubeda, J.P.; Marín-Lechado, C. Combined microgravity, electrical resistivity tomography and induced polarization to detect deeply buried caves: Algaidilla cave (Southern Spain). Eng. Geol. 2013, 162, 67–78. [Google Scholar] [CrossRef]
- Saibi, H.; Amrouche, M.; Fowler, A.-R. Deep cavity systems detection in Al-Ain City, UAE, based on gravity surveys inversion. J. Asian Earth Sci. 2019, 182, 103937. [Google Scholar] [CrossRef]
- Bharti, A.K.; Prakash, A.; Verma, A.; Singh, K.K.K. Assessment of hydrological condition in strata associated with old mine working during and post-monsoon using electrical resistivity tomography: A case study. Bull. Eng. Geol. Environ. 2021, 80, 5159–5166. [Google Scholar] [CrossRef]
- Das, P.; Pal, S.K.; Mohanty, P.R.; Priyam, P.; Bharti, A.K.; Kumar, R. Abandoned Mine Galleries Detection using Electrical Resistivity Tomography Method over Jharia Coal Field, India. J. Geol. Soc. India 2017, 90, 169–174. [Google Scholar] [CrossRef]
- Kumar, R.; Pal, S.K.; Gupta, P.K. Water seepage mapping in an underground coal-mine barrier using self-potential and electrical resistivity tomography. Mine Water Environ. 2021, 40, 622–638. [Google Scholar] [CrossRef]
- McCrackin, C.W.; Kiflu, H.G.; Kruse, S.E.; van Beynen, P.E.; Polk, J.S.; Miller, B. 3D resistivity survey over mapped caves in eogenetic karst terrane, west-central Florida, USA. J Cave Karst Stud 2022, 84, 1–13. [Google Scholar] [CrossRef]
- Wu, G.; Yang, G.; Tan, H. Mapping coalmine goaf using transient electromagnetic method and high density resistivity method in Ordos City, China. Geod. Geodyn. 2016, 7, 340–347. [Google Scholar] [CrossRef]
- Drahor, M.G. Identification of gypsum karstification using an electrical resistivity tomography technique: The case-study of the Sivas gypsum karst area (Turkey). Eng. Geol. 2019, 252, 78–98. [Google Scholar] [CrossRef]
- Fasani, G.B.; Bozzano, F.; Cardarelli, E.; Cercato, M. Underground cavity investigation within the city of Rome (Italy): A multi-disciplinary approach combining geological and geophysical data. Eng. Geol. 2013, 152, 109–121. [Google Scholar] [CrossRef]
- Bharti, A.K.; Singh, K.; Ghosh, C.; Mishra, K. Detection of subsurface cavity due to old mine workings using electrical resistivity tomography: A case study. J. Earth Syst. Sci. 2022, 131, 39. [Google Scholar] [CrossRef]
- Srivastava, S.; Pal, S.K.; Kumar, R. A time-lapse study using self-potential and electrical resistivity tomography methods for mapping of old mine working across railway-tracks in a part of Raniganj coalfield, India. Environ. Earth Sci. 2020, 79, 19. [Google Scholar] [CrossRef]
- Sun, M.; Liu, J.; Ou, J.; Liu, R.; Zhu, L. Electrical Resistivity Tomography (ERT) Investigation for Landslides: Case Study in the Hunan Province, China. Appl. Sci. 2024, 14, 3007. [Google Scholar] [CrossRef]
- Loke, M.; Papadopoulos, N.; Wilkinson, P.; Oikonomou, D.; Simyrdanis, K.; Rucker, D. The inversion of data from very large three-dimensional electrical resistivity tomography mobile surveys. Geophys. Prospect. 2020, 68, 2579–2597. [Google Scholar] [CrossRef]
- Loke, M.; Wilkinson, P.; Chambers, J. Parallel computation of optimized arrays for 2-D electrical imaging surveys. Geophys. J. Int. 2010, 183, 1302–1315. [Google Scholar] [CrossRef]


| Sample ID | MC % | Sp. Gravity | Liquid Limit % | Plastic Limit % | Plasticity Index | DD (g/cm3) | VR |
|---|---|---|---|---|---|---|---|
| 1-1 | 21.9 | 2.72 | 36.4 | 20.3 | 16.1 | 1.63 | 0.67 |
| 1-2 | 22.1 | 2.73 | 32.8 | 21.9 | 10.9 | 1.67 | 0.59 |
| 1-3 | 21.8 | 2.69 | 33.7 | 20.8 | 12.3 | 1.64 | 0.63 |
| 1-4 | 21.6 | 2.67 | 34.1 | 20.5 | 14.2 | 1.66 | 0.64 |
| Average | 21.85 | 2.70 | 34.25 | 20.9 | 13.38 | 16.50 | 0.63 |
| Sample ID | Test | Number | Average Value | Maximum Value | Minimum Value |
|---|---|---|---|---|---|
| 2 | Uniaxial compressive strength (MPa) | 4 | 25.36 | 36.25 | 16.23 |
| 3 | 4 | 10.25 | 14.58 | 6.12 | |
| 4 | 4 | 15.84 | 23.11 | 8.62 | |
| 5 | 4 | 45.17 | 62.19 | 28.42 |
Disclaimer/Publisher’s Note: The statements, opinions and data contained in all publications are solely those of the individual author(s) and contributor(s) and not of MDPI and/or the editor(s). MDPI and/or the editor(s) disclaim responsibility for any injury to people or property resulting from any ideas, methods, instructions or products referred to in the content. |
© 2025 by the authors. Licensee MDPI, Basel, Switzerland. This article is an open access article distributed under the terms and conditions of the Creative Commons Attribution (CC BY) license (https://creativecommons.org/licenses/by/4.0/).
Share and Cite
Sun, M.; Ou, J.; Li, T.; Cao, C.; Liu, R. Application of Electrical Resistivity Tomography (ERT) in Detecting Abandoned Mining Tunnels Along Expressway. Appl. Sci. 2025, 15, 2289. https://doi.org/10.3390/app15052289
Sun M, Ou J, Li T, Cao C, Liu R. Application of Electrical Resistivity Tomography (ERT) in Detecting Abandoned Mining Tunnels Along Expressway. Applied Sciences. 2025; 15(5):2289. https://doi.org/10.3390/app15052289
Chicago/Turabian StyleSun, Mengyu, Jian Ou, Tongsheng Li, Chuanghua Cao, and Rong Liu. 2025. "Application of Electrical Resistivity Tomography (ERT) in Detecting Abandoned Mining Tunnels Along Expressway" Applied Sciences 15, no. 5: 2289. https://doi.org/10.3390/app15052289
APA StyleSun, M., Ou, J., Li, T., Cao, C., & Liu, R. (2025). Application of Electrical Resistivity Tomography (ERT) in Detecting Abandoned Mining Tunnels Along Expressway. Applied Sciences, 15(5), 2289. https://doi.org/10.3390/app15052289