1. Introduction
In recent years, coal mining in China has entered the stage of deep mining. As mining depth increases, problems with roadway support arise. The primary factor is the elevated in situ stress within the deep rock masses. Certain roadways are located near weak surrounding rock or structural zones, where they experience significantly higher structural stresses than other areas. This results in severe underground pressure, considerable rock deformation, and even damage to the surrounding rock. Consequently, the stability of roadways surrounding such rock becomes worse, the support cost increases, and there are safety risks [
1,
2,
3,
4,
5]. In situ stress, as the primary datum representing the mechanical state of the rock mass, is a key factor in assessing the surrounding rock’s stability and guiding the design and decision-making for subsurface engineering. Therefore, the accurate assessment and management of in situ stress in deep mining are crucial for ensuring support effectiveness, reducing costs, and maintaining safety [
6,
7,
8,
9].
Recent studies by numerous scholars have focused on the deformation and failure mechanisms of weak surrounding rock in roadways, as well as control technologies, leading to significant advancements in the field. He et al. [
10,
11,
12] proposed that the failure of weak surrounding rock in roadways results from the decoupling between the support system and the surrounding rock, and introduced a coupling support design method utilizing anchor cables and nets, grounded in the nonlinear mechanics of deep soft rock. Zhang et al. [
13] conducted a comprehensive study of the internal fracturing process in the surrounding rock of weak roadways. Utilizing extensive on-site mine investigations and rock mechanics experiments, they delineated the law governing the staged and non-uniform fracturing fissures in the surrounding rock of typical soft rock roadways and they formulated targeted control technologies tailored to specific stages and regions. Xiao et al. [
14,
15] empirically confirmed the relationship between acoustic emission characteristics and rock damage through the analysis of acoustic emission signals during coal sample failure and the examination of stress–strain curves in cyclic loading and unloading experiments. They proposed that the release rate of effective elastic energy could serve as an indicator of impact propensity. The research team led by Ma [
16,
17] focused on circular roadways as the research subject and suggested that the failure of surrounding rock in soft rock roadways exhibits distinct plastic zone configurations. They provided discrimination criteria for these failure types, thereby offering guidance for the development of control techniques. Wang [
18] posited that the instability of soft rock roadways is attributed to the malignant expansion of the plastic zone, which is exacerbated by an unbalanced stress field within the surrounding rock and the consequent high levels of deviational stress. Drawing upon the principle, he advanced corresponding control techniques. Zhu [
19] believed that the stability of the roadway roof is affected by many factors, and the nonlinear relationship between these factors leads to differences in roadway roof stability. Roof stability was systematically classified by a BP neural network, which provides a reference for roadway roof zoning and graded support. Hou [
20] conducted a thorough analysis on floor heave in soft rock roadways, and categorized the characteristics of floor heave as “two points and three zones” and formulated a control principle for addressing floor heave within the roadway, stipulating that floor anchor bolts and the depth of slip-casting holes must extend below the “zero displacement point” of the floor rock layer. Xie et al. [
21], in response to the problem of support failure caused by the large deformation of a roadway above a soft coal seam under high-level stress, analyzed the in situ stress distribution. They proposed an optimized support scheme composed of H-G anchor cable, high-strength anchor bolt, W-shaped steel belt, net, and shotcrete, which achieved good results. Kang et al. [
22], aiming at the floor heave problem caused by high horizontal stress, proposed a solution of combining concrete-filled steel tube corner piles with floor grouting through theoretical derivation. Simulations and tests demonstrated that this solution effectively improves the performance of the floor. Chen et al. [
23] utilized comprehensive research methods such as mechanical experiments, in situ stress measurements, and numerical simulations to systematically study the deformation and failure characteristics of deep surrounding rock in the Wanbei mining area. They proposed a coordinated support technology integrating reinforcement support and grouting, which has achieved good results in on-site applications.
Therefore, this work takes Ronghua No.1 Mine as the research background and adopts research methods of on-site measurement, numerical simulation, and on-site application. By conducting in situ stress tests in the mining area, the distribution characteristics of the in situ stress around the roadway are obtained. Meanwhile, the stability of the surrounding rock of the roadway is explored in combination with the angle between the direction of the maximum horizontal principal stress and the roadway strike, as well as the lateral pressure coefficient. According to the research results, the principle of controlling the stability of the surrounding rock in the high horizontal stress roadway is proposed, and an optimized support scheme is formulated. The roadway support is improved by comparing the numerical simulation effects before and after optimization. Subsequently, the optimized support scheme is applied on-site, and data monitoring is carried out for a period of 6 months. By comparing the deformation amounts of the roof, two sides, and the floor, the feasibility of the obtained support scheme is judged, providing reliable technical support and practical guidance for the roadway support in Ronghua No.1 Mine.
2. General Situation of the Engineering and Analysis of In Situ Stress
Ronghua No.1 Mine is located within the territory of Yonghe Town, Jidong County, Heilongjiang Province. The strike length measures 8.5 km, with an inclined width of 8.7 km, covering an area of 74.25 km
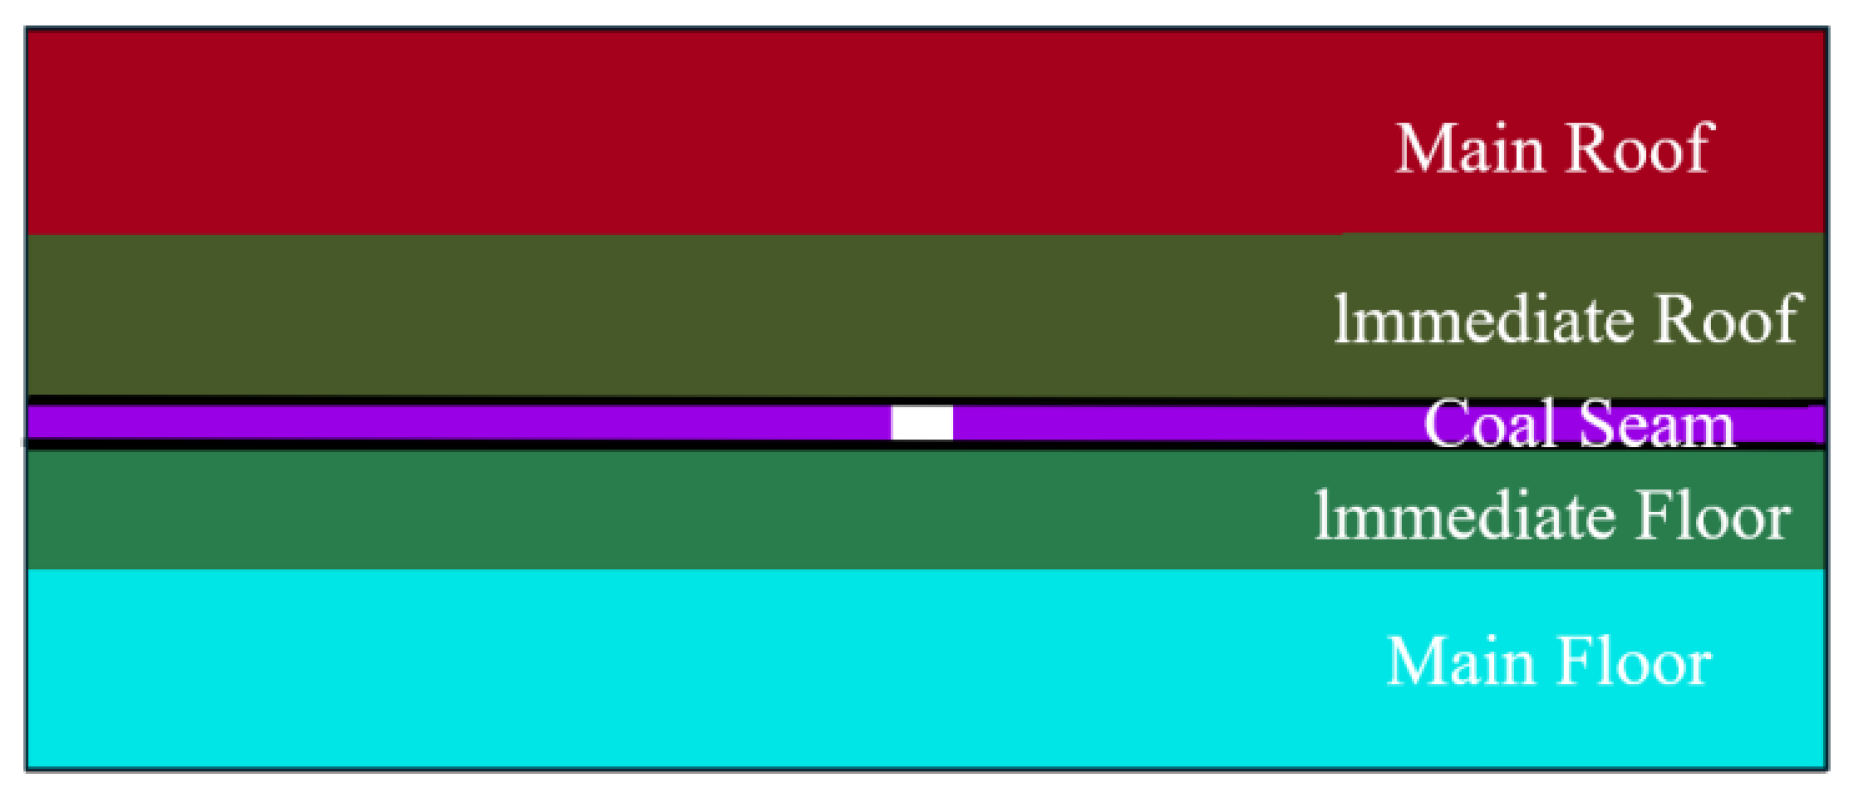
2, and has an output capacity of 2.1 million tons per year. Currently, the primary coal seam under exploitation is the 6A# coal seam, which has an approximate thickness of 3 to 4 m. The column diagram of the rock strata is presented in
Figure 1.
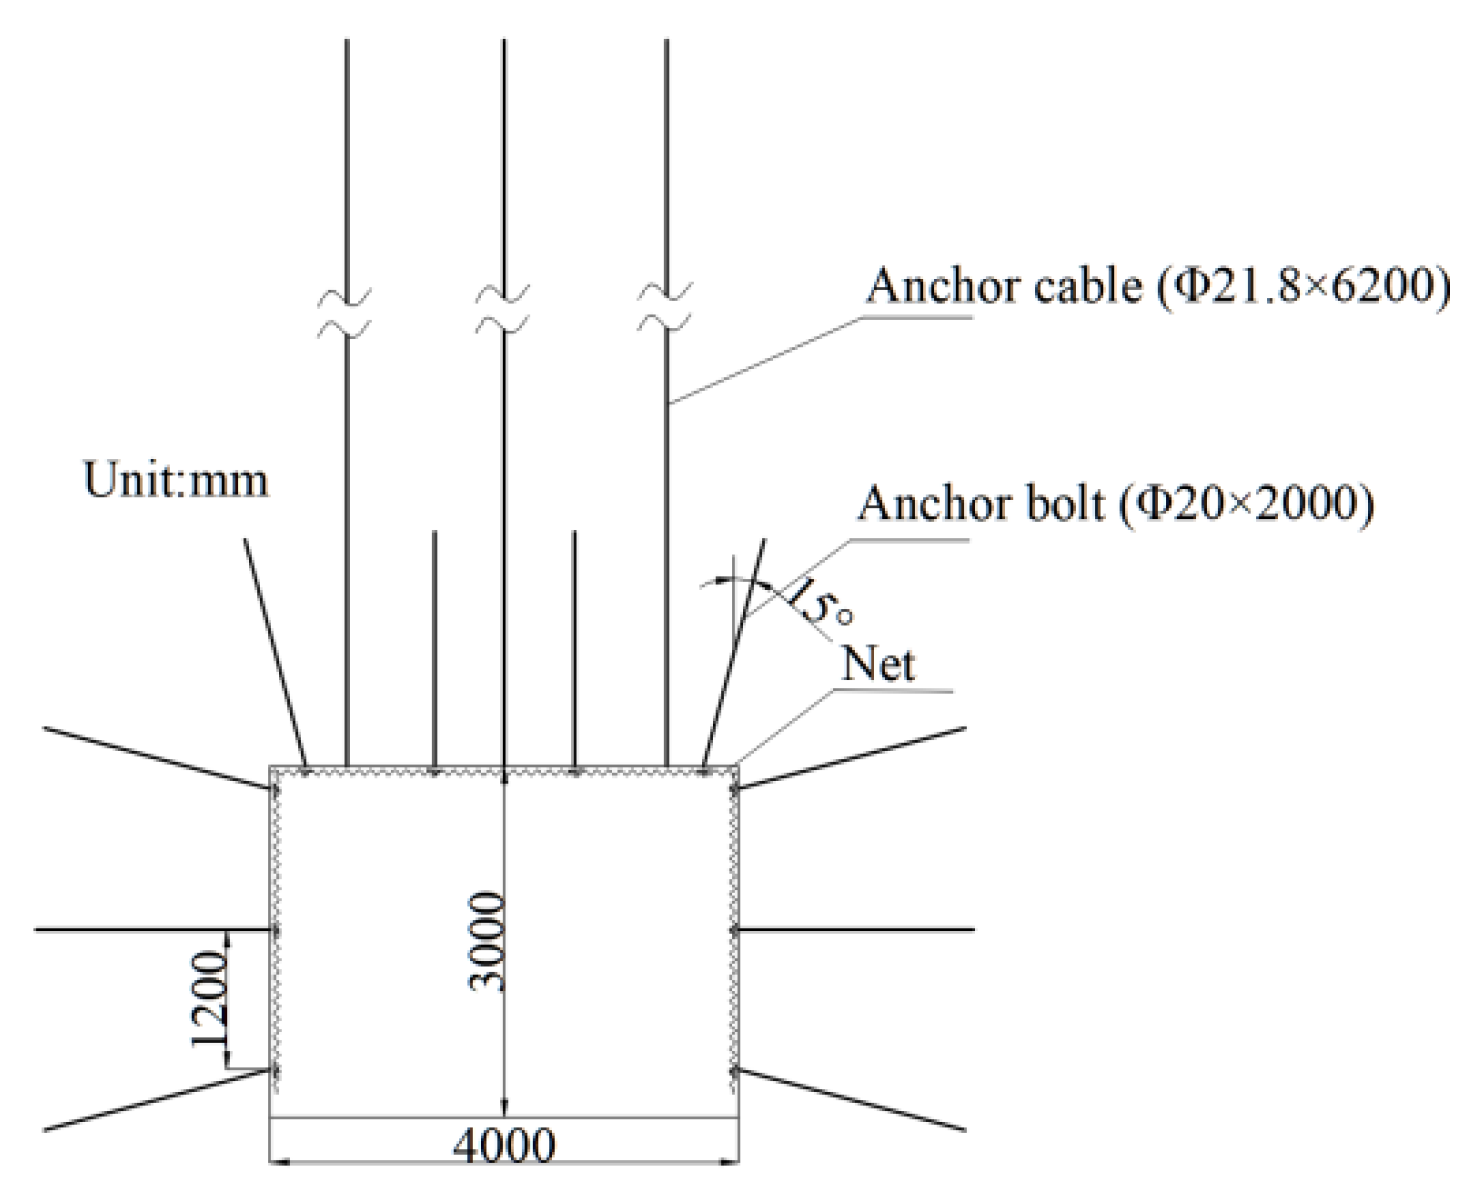
The 6A# left 2nd roadway in the East First Mining Area of Ronghua No. 1 Mine is a coal roadway, buried at an approximate depth of 850 m. The vertical distance between the goaf above the roadway roof and the coal seam is relatively large, exceeding the effective influence range of mine pressure manifestation. At the same time, the coal bodies on both sides of the roadway show good integrity, not affected by the goaf, and are in the original stress state. The cross-sectional dimension of the roadway excavation is 4 m × 3 m. The anchor bolts are reinforced steel anchor bolts of Φ20 mm × 2000 mm, with a pattern of 1200 mm × 1000 mm; the anchor cables are steel strand anchor cables of Φ21.8 mm × 6200 mm, with a pattern of 1200 mm × 1000 mm. The roadway support employs a combined support scheme of anchor bolts—anchor cables—nets, as illustrated in
Figure 2.
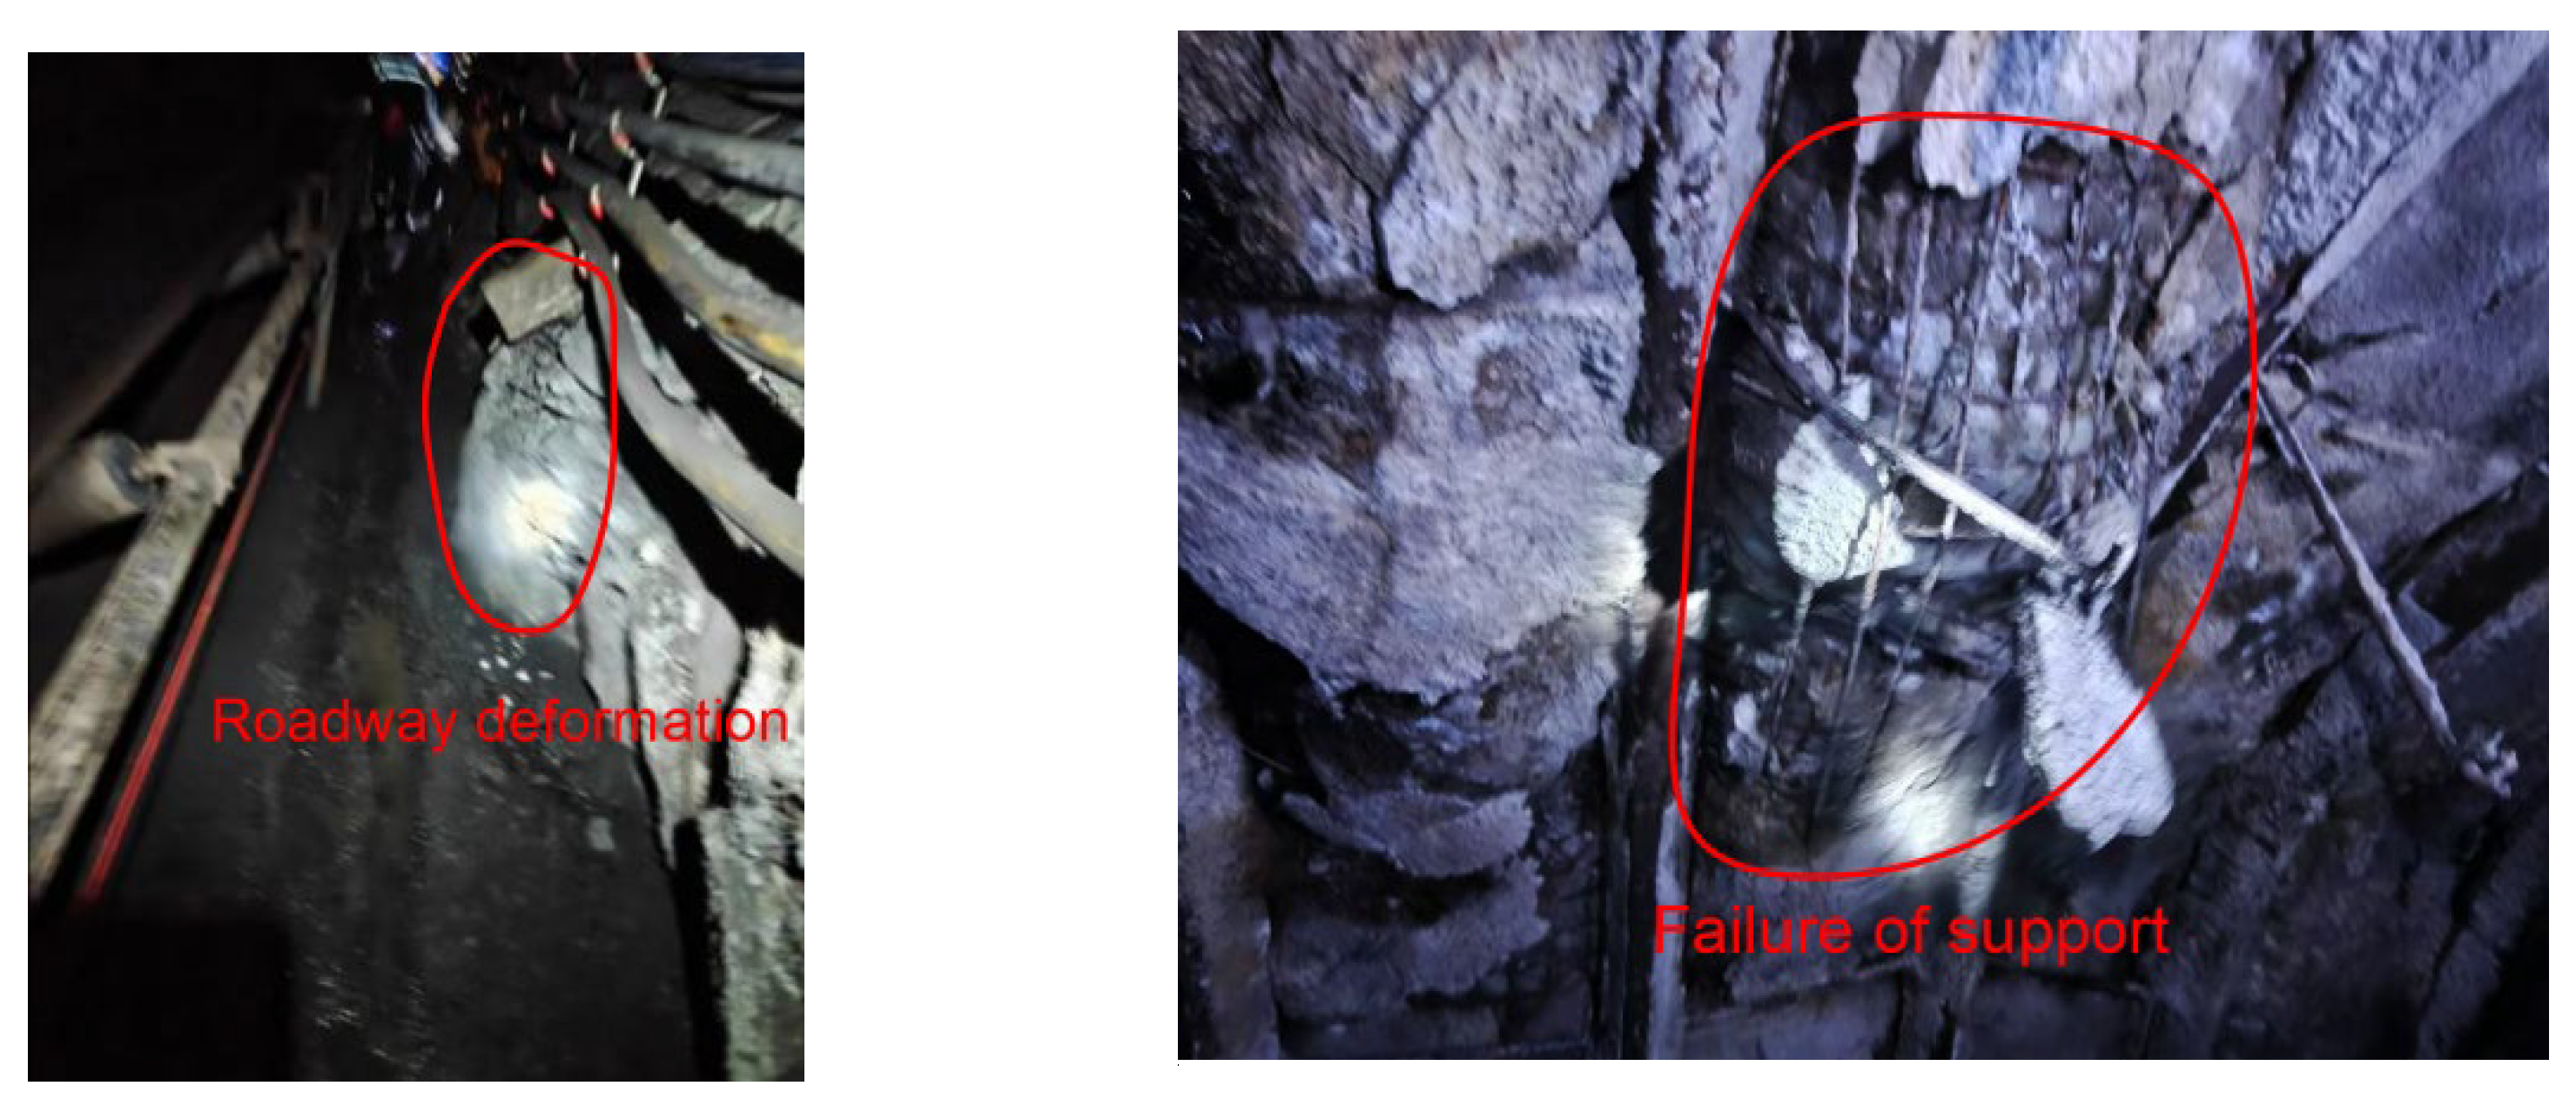
After supporting the roadway for some time, the deformation of the surrounding rock is serious: the roadway roof has obvious sinking damage, the anchor bolts and nets appear close to failure, the two sides of the roadway have contracted, and there is section reduction, all of which seriously affects production. The roadway deformation is shown in
Figure 3.
The results of on-site statistical analysis reveal that the roadway roof deformation is marked, with substantial two-sided displacement observed. It has been preliminarily ascertained that the roadway is subject to high-stress conditions, characterized by a horizontal principal stress that exceeds the vertical principal stress, exhibiting typical features of a tectonic stress field. To clarify the distribution characteristics of the stress field around the roadway, it is planned to conduct in situ stress testing work.
The in situ stress testing method adopted in this work is the hollow inclusion stress relief method. By means of the hollow inclusion stress gauge, this method can accurately obtain the magnitude of the in situ stress within the surrounding rock. The testing process is as follows: First, drill holes in the side of the roadway. The drilling angle should be controlled within 3–5°, and the depth should reach 6–7 m to ensure that it is not affected by the surrounding rock stress field. Subsequently, place the hollow inclusion stress gauge into the hole and use glue to firmly bond the stress gauge to the hole wall, ensuring a stable mechanical connection between them. After the stress gauge is installed, let it stand for 24 h. After the glue is fully cured, carry out the over-coring stress relief drilling operation according to the pre-determined graded depths. The drilling depth of each grade is set to 3 cm. Immediately stop drilling after completing the over-coring stress relief of each grade, and read and record the data. Based on the fundamental principles for the layout of initial rock stress measurement points, and considering both underground production and construction activities as well as the mining area of Ronghua No. 1 Mine, three measurement points were selected for the actual measurement of initial rock stress within the exposed section of the existing roadway. The three test points are, respectively, the middle parking lot of the first mining area in the east, the transportation roadway of the third mining area in the middle, and the main west transportation roadway. The measurement point locations are depicted in
Figure 4.
The in situ stress values at the three measurement points were obtained from the data of the hollow inclusion stress meter. The specific results are presented in
Table 1.
After analyzing the magnitudes and directions of the stresses at each point in
Table 1, it can be discovered that in situ stress in Ronghua No. 1 Mine exhibits the following laws:
- (1)
Angles of the σ1 of the three points are 265.72°, 106.57°, and 95.62°, respectively. As the mining area is relatively large, point 1 is located on the east side of the mining area, and points 2 and 3 are located on the west side. Consequently, the maximum horizontal principal stress (σH) in the east side of the mining area is inclined to be nearly north-south, while the σH in the west side of the mining area is generally inclined to be south-north.
- (2)
The σ1 is predominantly concentrated in the horizontal direction, varying approximately between 1.81 and 2.14 times the magnitude of the vertical stress, indicating that the in situ stress field within this region is predominantly influenced by horizontal tectonic stresses.
- (3)
The σ1 of the three measurement points, ranked in ascending order, are as follows: point 1 is 24.1 MPa; point 2 is 47.0 MPa; and point 3 is 54.1 MPa. The σv, ranked in ascending order, are as follows: point 1 is 13.3 MPa; point 2 is 22.4 MPa; and point 3 is 25.3 MPa. The σ3, ranked in ascending order, are as follows: point 1 is 8.8 MPa; point 2 is 14.9 MPa; and point 3 is 21.2 MPa.
- (4)
In the depth range of the three measuring points, the stress gradients reveal values of 0.03 MPa/m for the σH, 0.012 MPa/m for the σV, and 0.012 MPa/m for the σh.
3. Stability Analysis of Roadways Under High Horizontal Stress Conditions
By examining the distribution characteristics of the in situ stress field, the stability law of the roadway under different angles between the direction of the σH and the roadway orientation can be observed. Furthermore, the effects of different lateral pressure coefficients are considered. The analysis aims to offer a reference for the excavation and support strategies for upcoming excavations at the Ronghua No. 1 Mine.
3.1. Numerical Simulation Scheme
Based on the borehole log, a FLAC3D numerical model for the 6A# Left 2nd Roadway was established. The model dimensions are as follows: in the X direction, it is 120 m long; in the Y direction, it corresponds to the roadway’s mining face strike, extending over 40 m; and in the Z direction, it represents the rock stratum’s vertical extent, with a height of 80 m. The total number of zone units in the model amounts to 348,950.
Figure 5 presents a schematic diagram of the model. The Mohr-Coulomb model is used for this numerical simulation. The parameters are shown in
Table 2. The measured in situ stress field is applied to the model, that is, a uniform load of 20.3 MPa is applied to the model top. The displacement constraints are applied to the surrounding and bottom boundaries of the model.
In combination with the geological conditions of Ronghua No. 1 Mine, the design of the support scheme needs to comprehensively take into account the influences of factors such as burial depth, the angles between the direction of the σH and the roadway orientation, the lateral pressure coefficient, the strength of the rock, and the excavation-induced disturbance. However, following substantial roadway deformation, an analysis of the stress field in the surrounding rock reveals that both the angle and the lateral pressure coefficient significantly affect the 6A# Left 2nd Roadway. Therefore, this work focuses on discussing the influences of the angle and the lateral pressure coefficient on the stability of the surrounding rock. We discuss the influence patterns of the two factors on roadway stability using the controlling variable method. The specific research plan is outlined as follows:
- (1)
The angles between the direction of the σH and the roadway orientation: Seven groups of schemes are set at 0°, 15°, 30°, 45°, 60°, 75°, and 90°, respectively. The displacement and the horizontal stress are analyzed to elucidate the influence law.
- (2)
The lateral pressure coefficient: Four groups of schemes are set at 1.8, 1.9, 2.0, and 2.1, respectively. The displacement and the horizontal stress are analyzed to elucidate the influence law.
3.2. Stability Analysis of Surrounding Rock Under Different Stress Angles
To discuss the condition of the horizontal stress when the included angle between the direction of the σ
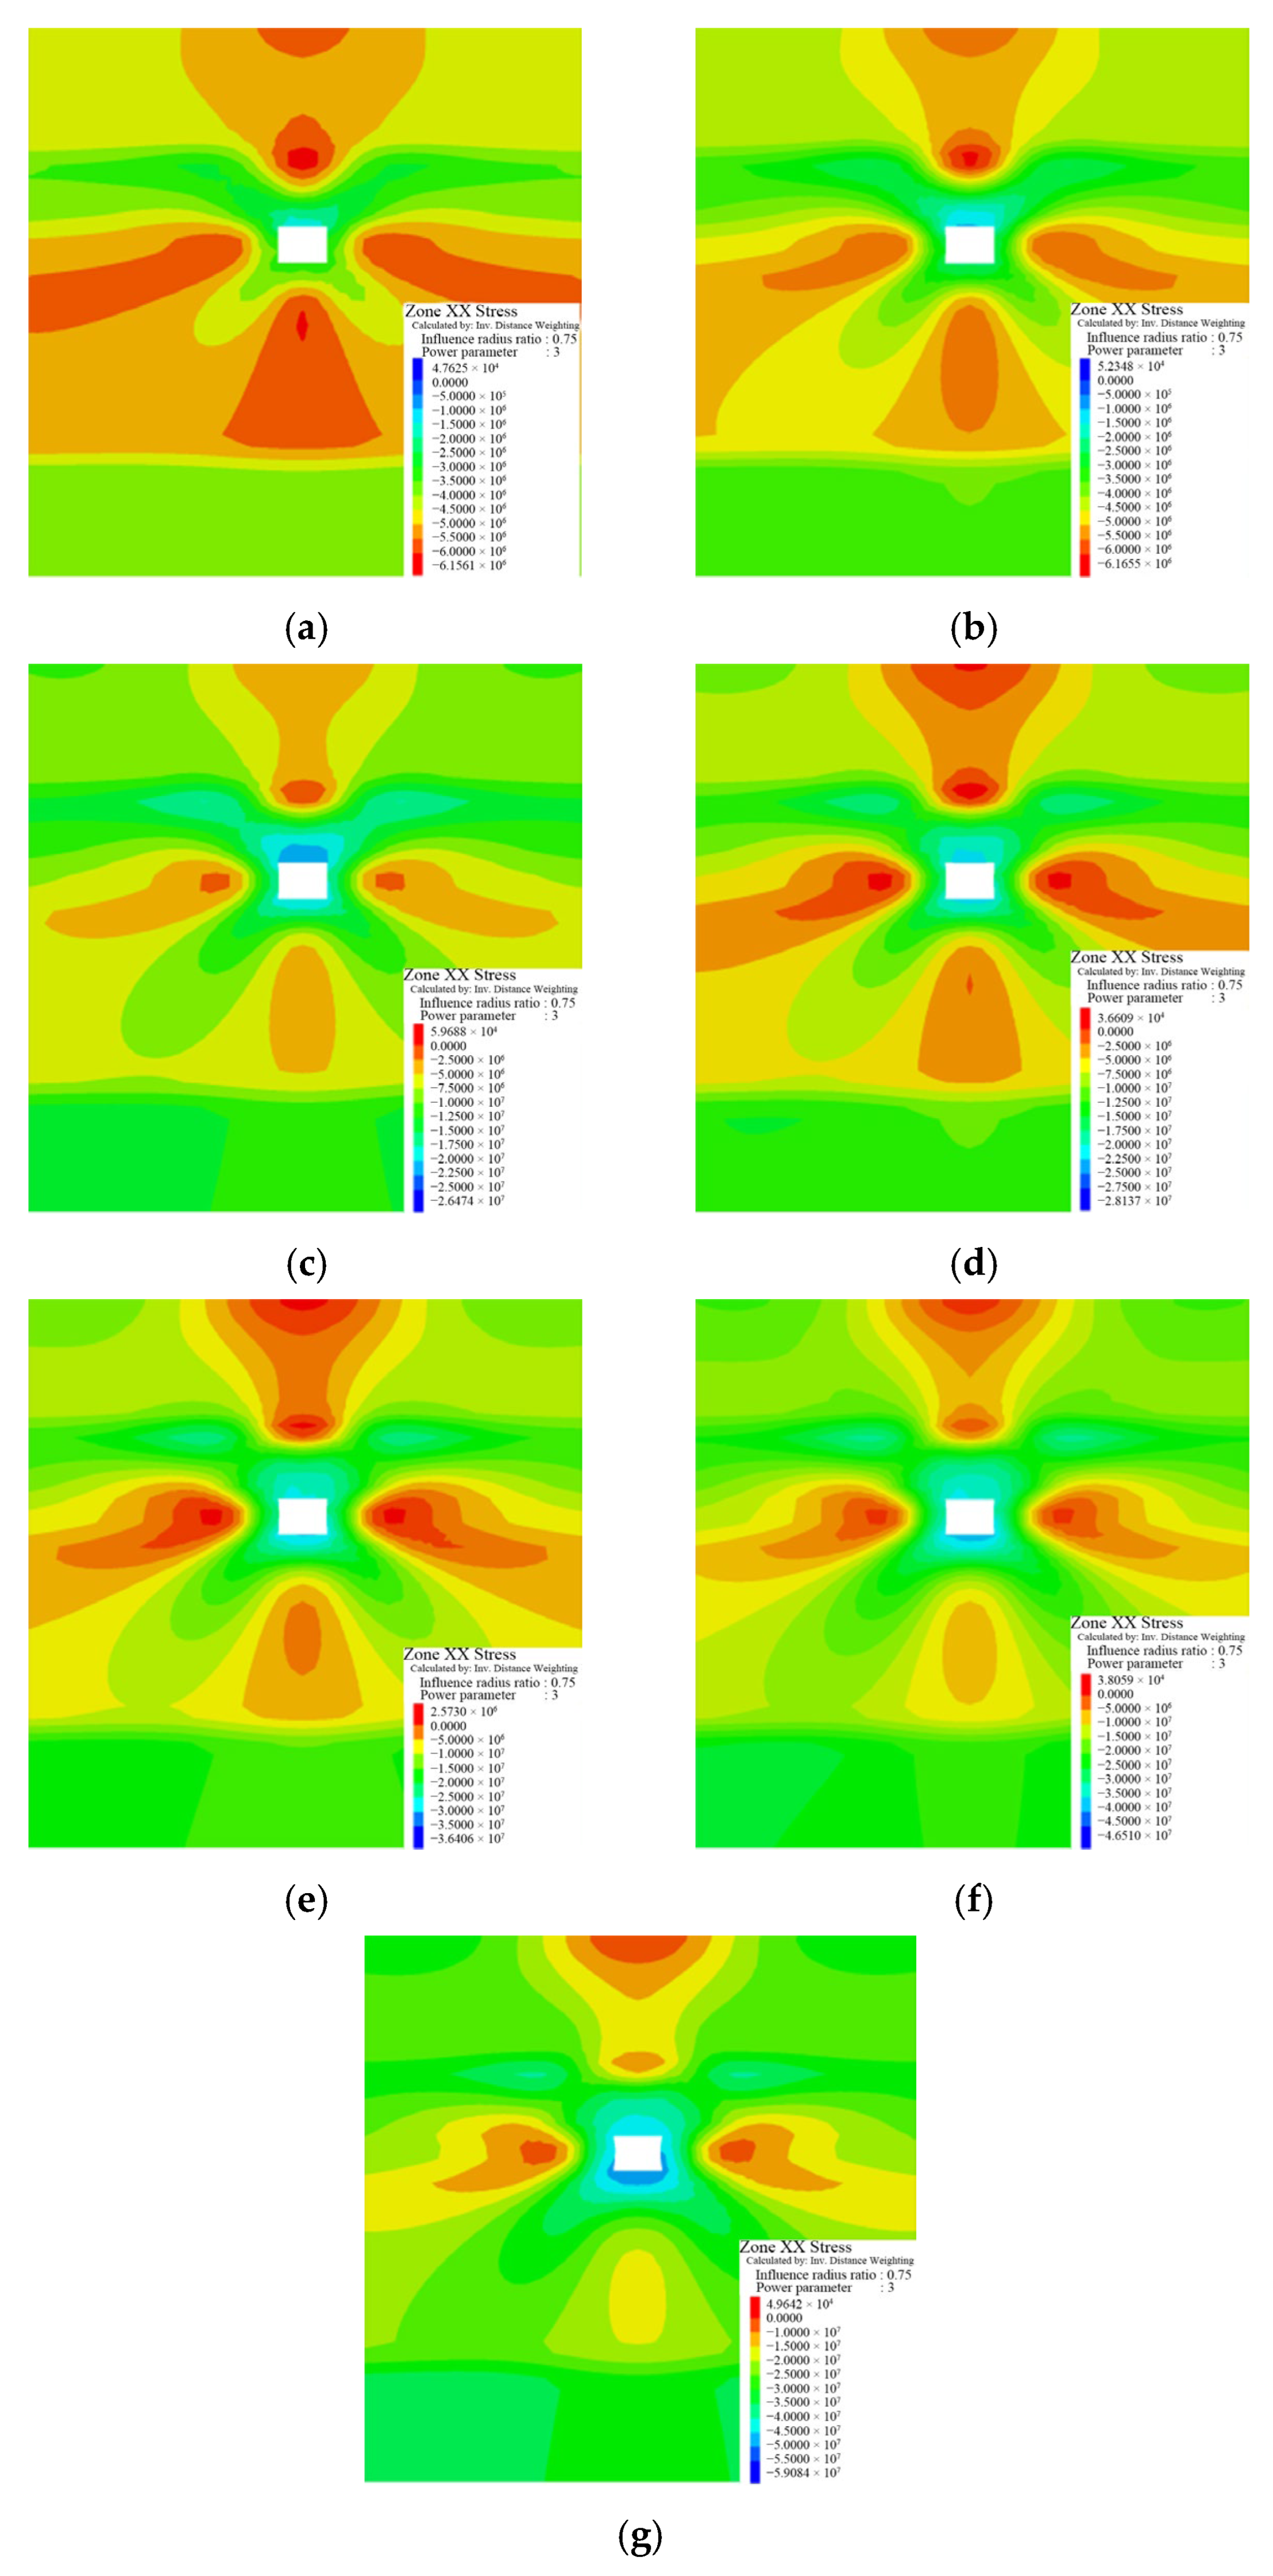
H and the roadway strike varies, numerical simulations are carried out for seven included angles of 0°, 15°, 30°, 45°, 60°, 75°, and 90°, respectively. The simulation results are shown in
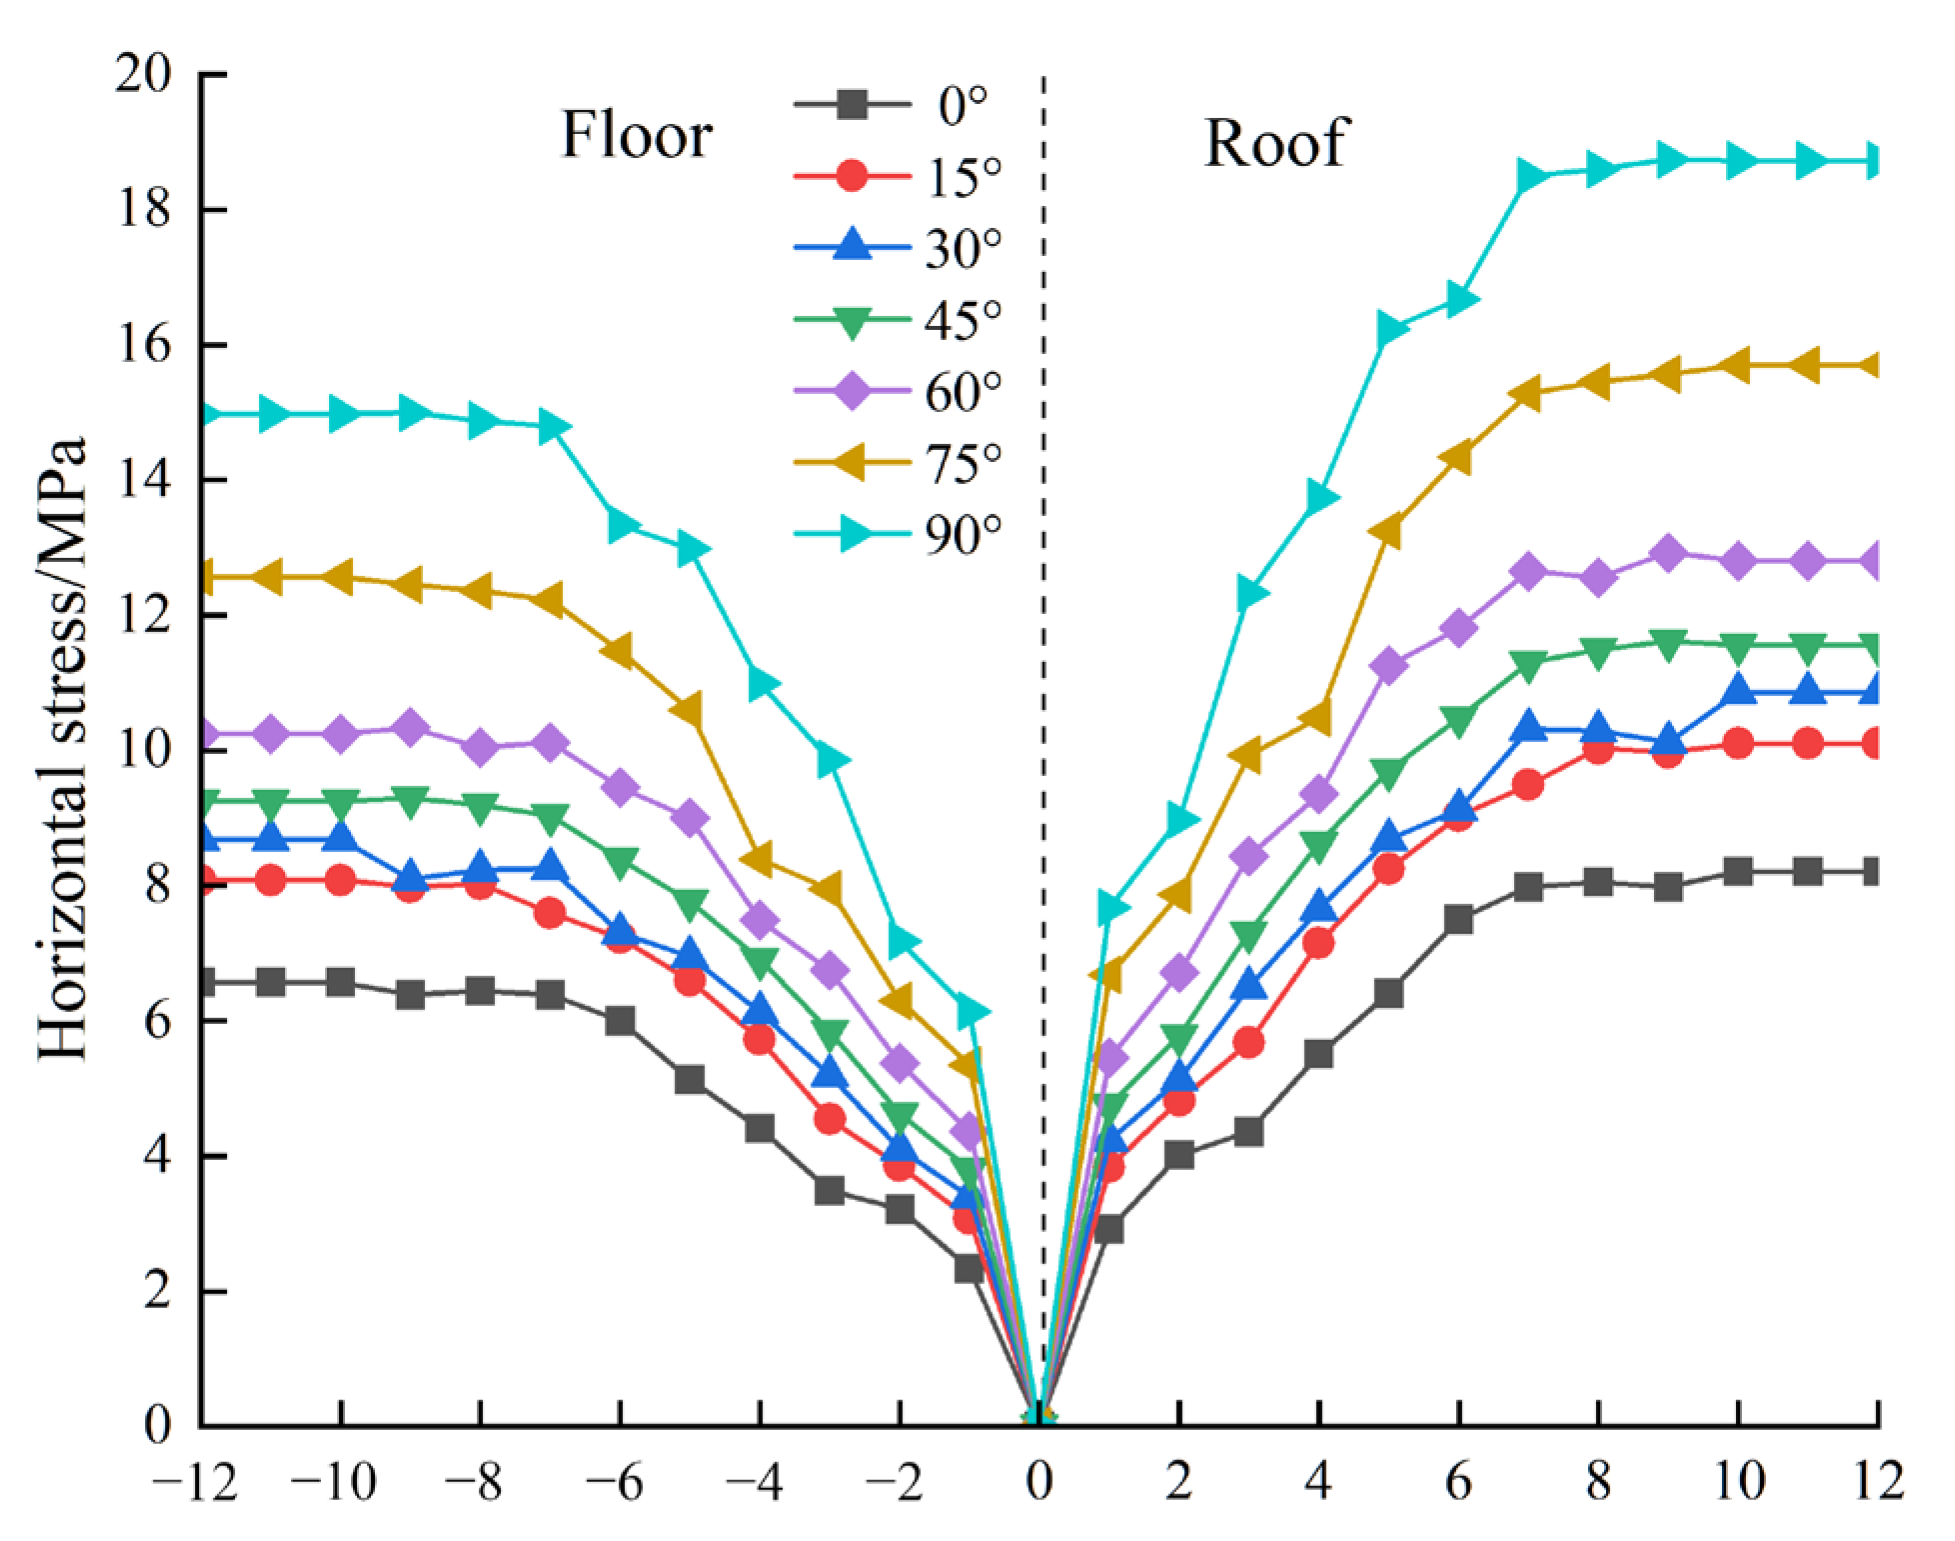
Figure 6. Based on the simulation results, the curves of the horizontal stress varying with the distance from the roof and floor under different angles are plotted, as shown in
Figure 7.
- (1)
The horizontal stress generally presents a butterfly distribution, the area of stress concentration gradually increases, the peak stress shifts to both sides of the roadway as the included angle increases, the peak position gradually moves away from the roadway center, the stress concentration phenomenon becomes more and more significant, and the roadway stability weakens.
- (2)
With increasing angle, the peak value of the horizontal stress also increases. When the angle is 0°, the horizontal stress is at its minimum, 6.5 MPa, and the roadway is the most stable at this time. When the included angle is 90°, the peak value reaches 18.8 MPa, approximately twice the initial rock stress, and at this point, the stability of the roadway is the worst.
- (3)
As the distance from the roof and floor increases, the horizontal stress increases accordingly. Within 4 m of the roof and floor, the horizontal stress increases rapidly and slows down when it exceeds 4 m. The horizontal stress tends to stabilize when the distance from the roof and floor is beyond 6–8 m. When the angle is between 0° and 60°, the horizontal stress stabilizes and does not exceed the vertical stress at the roadway’s position. At this point, the roadway’s stability is relatively good. When the angle exceeds 60°, the horizontal stress exceeds the vertical stress, and the roadway is greatly affected by the horizontal structural stress field. The roadway’s stability significantly decreases, and instability and failure are prone to occur.
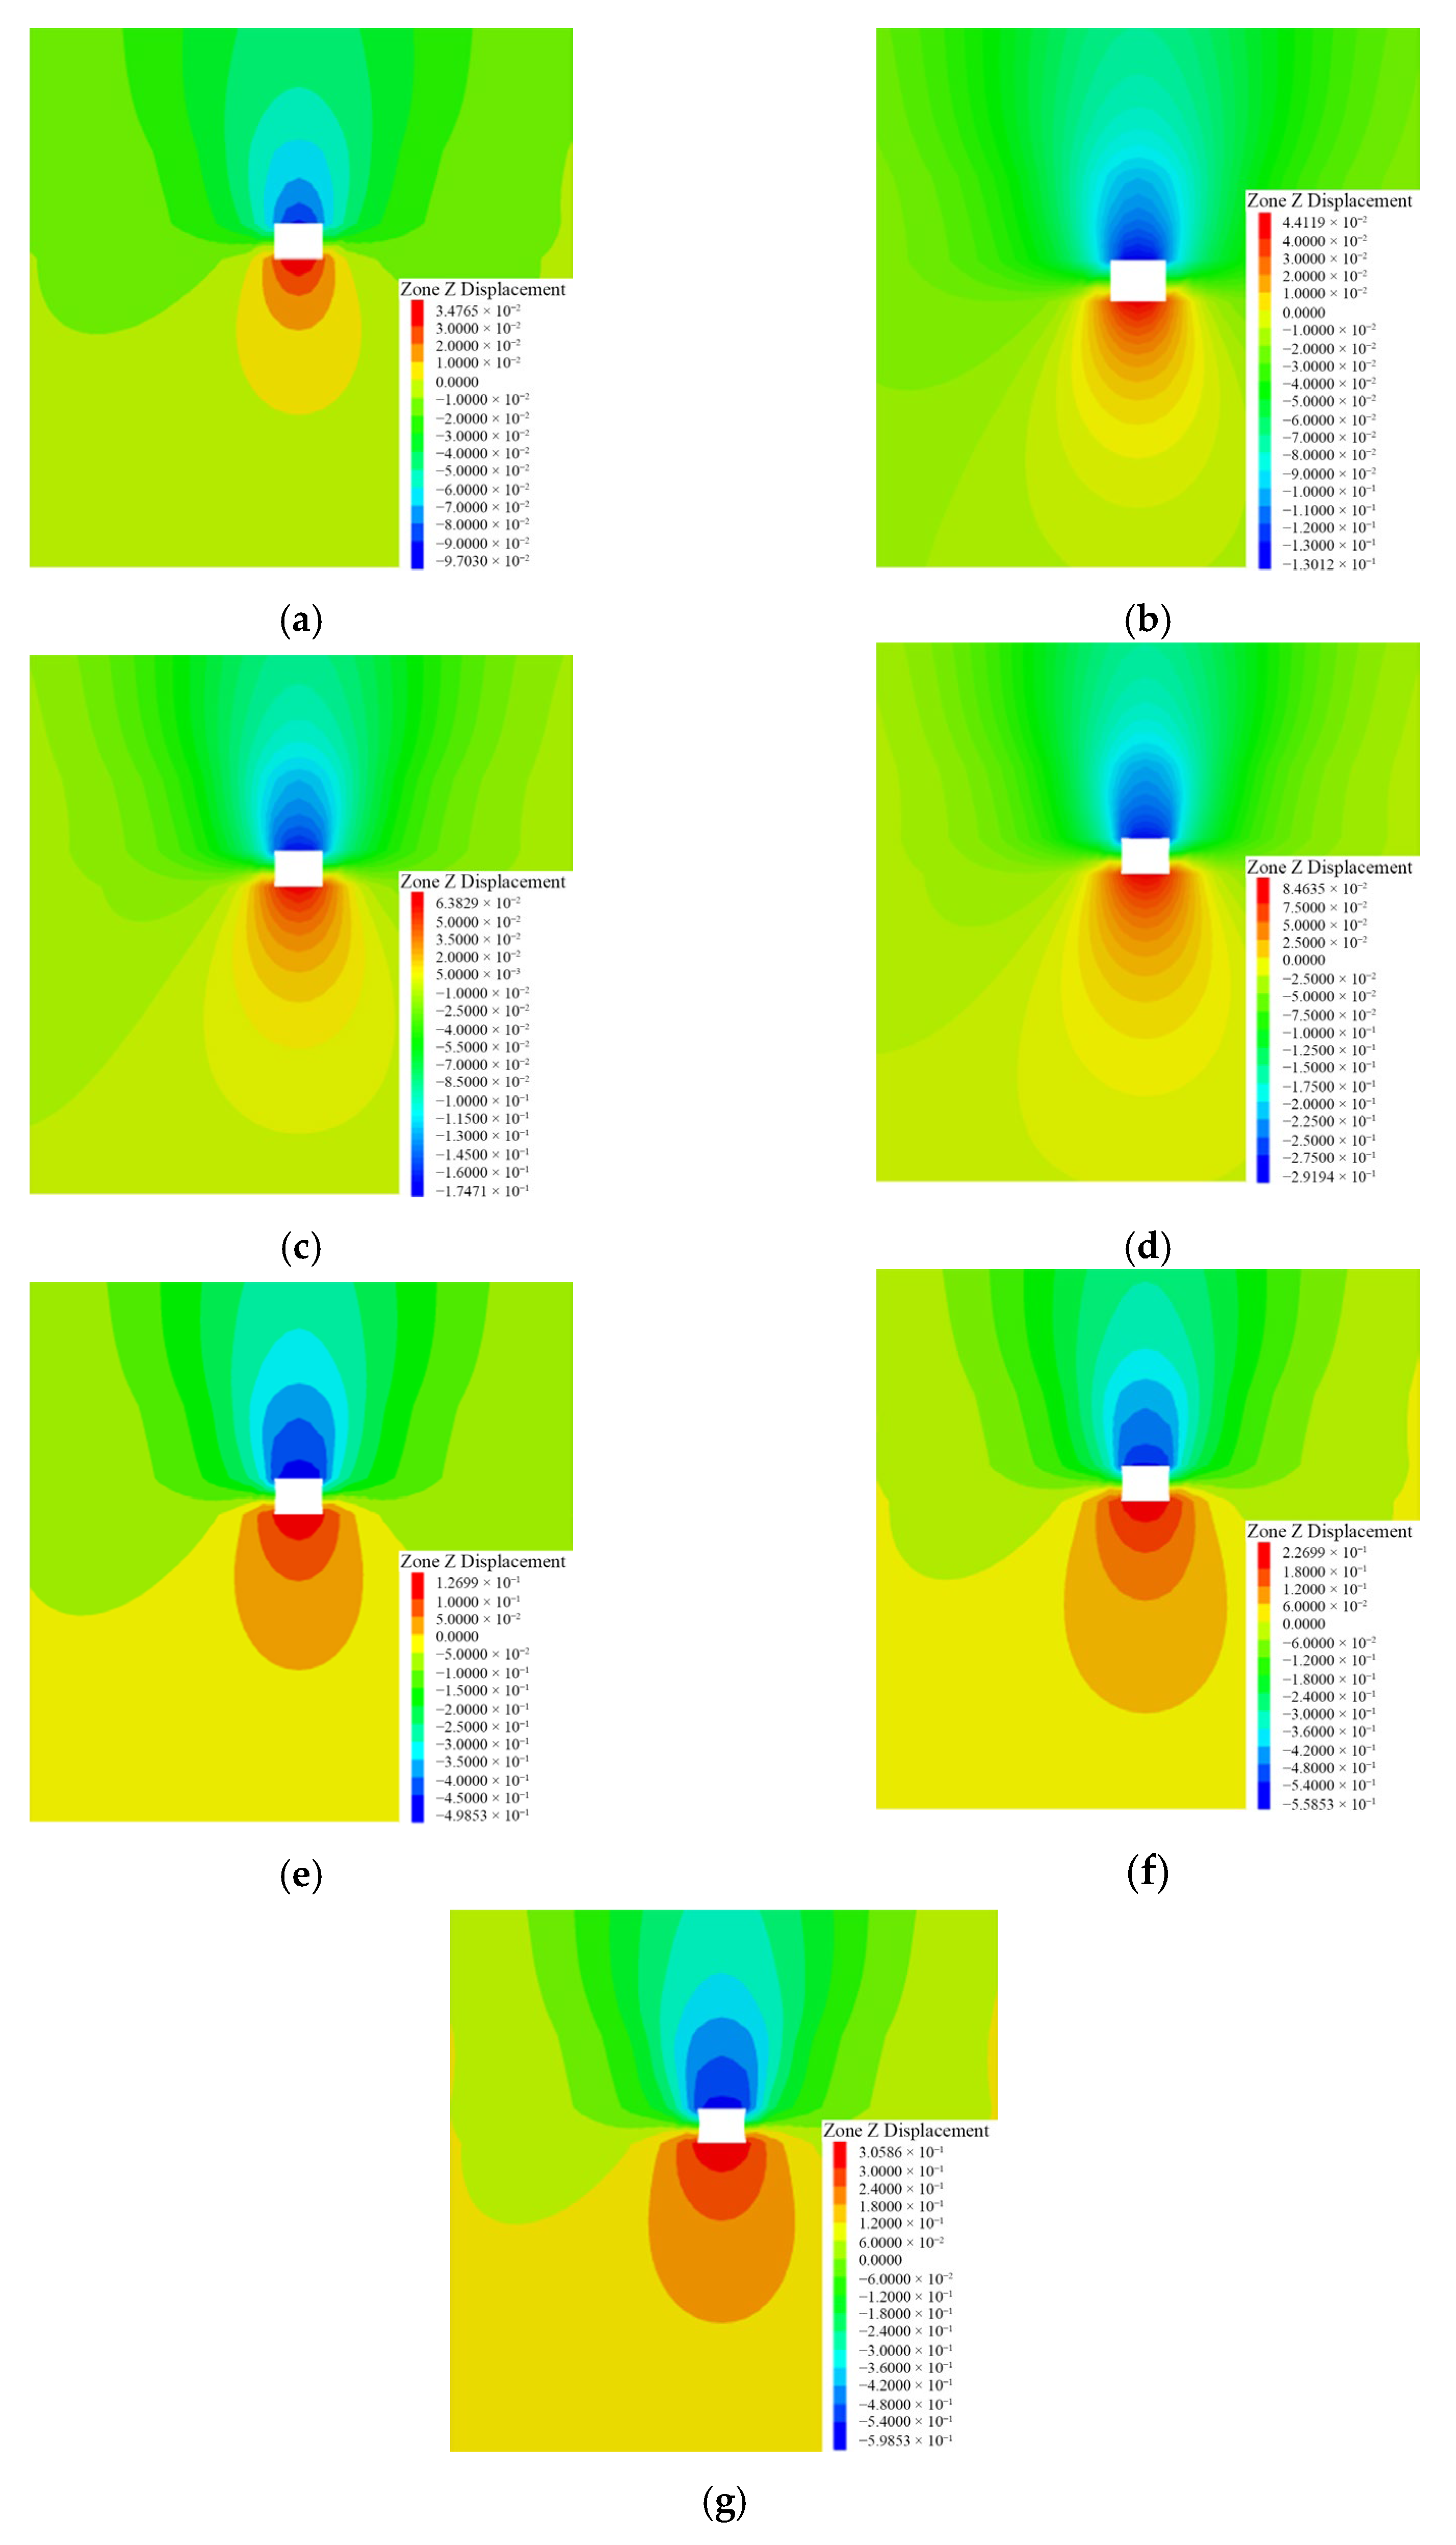
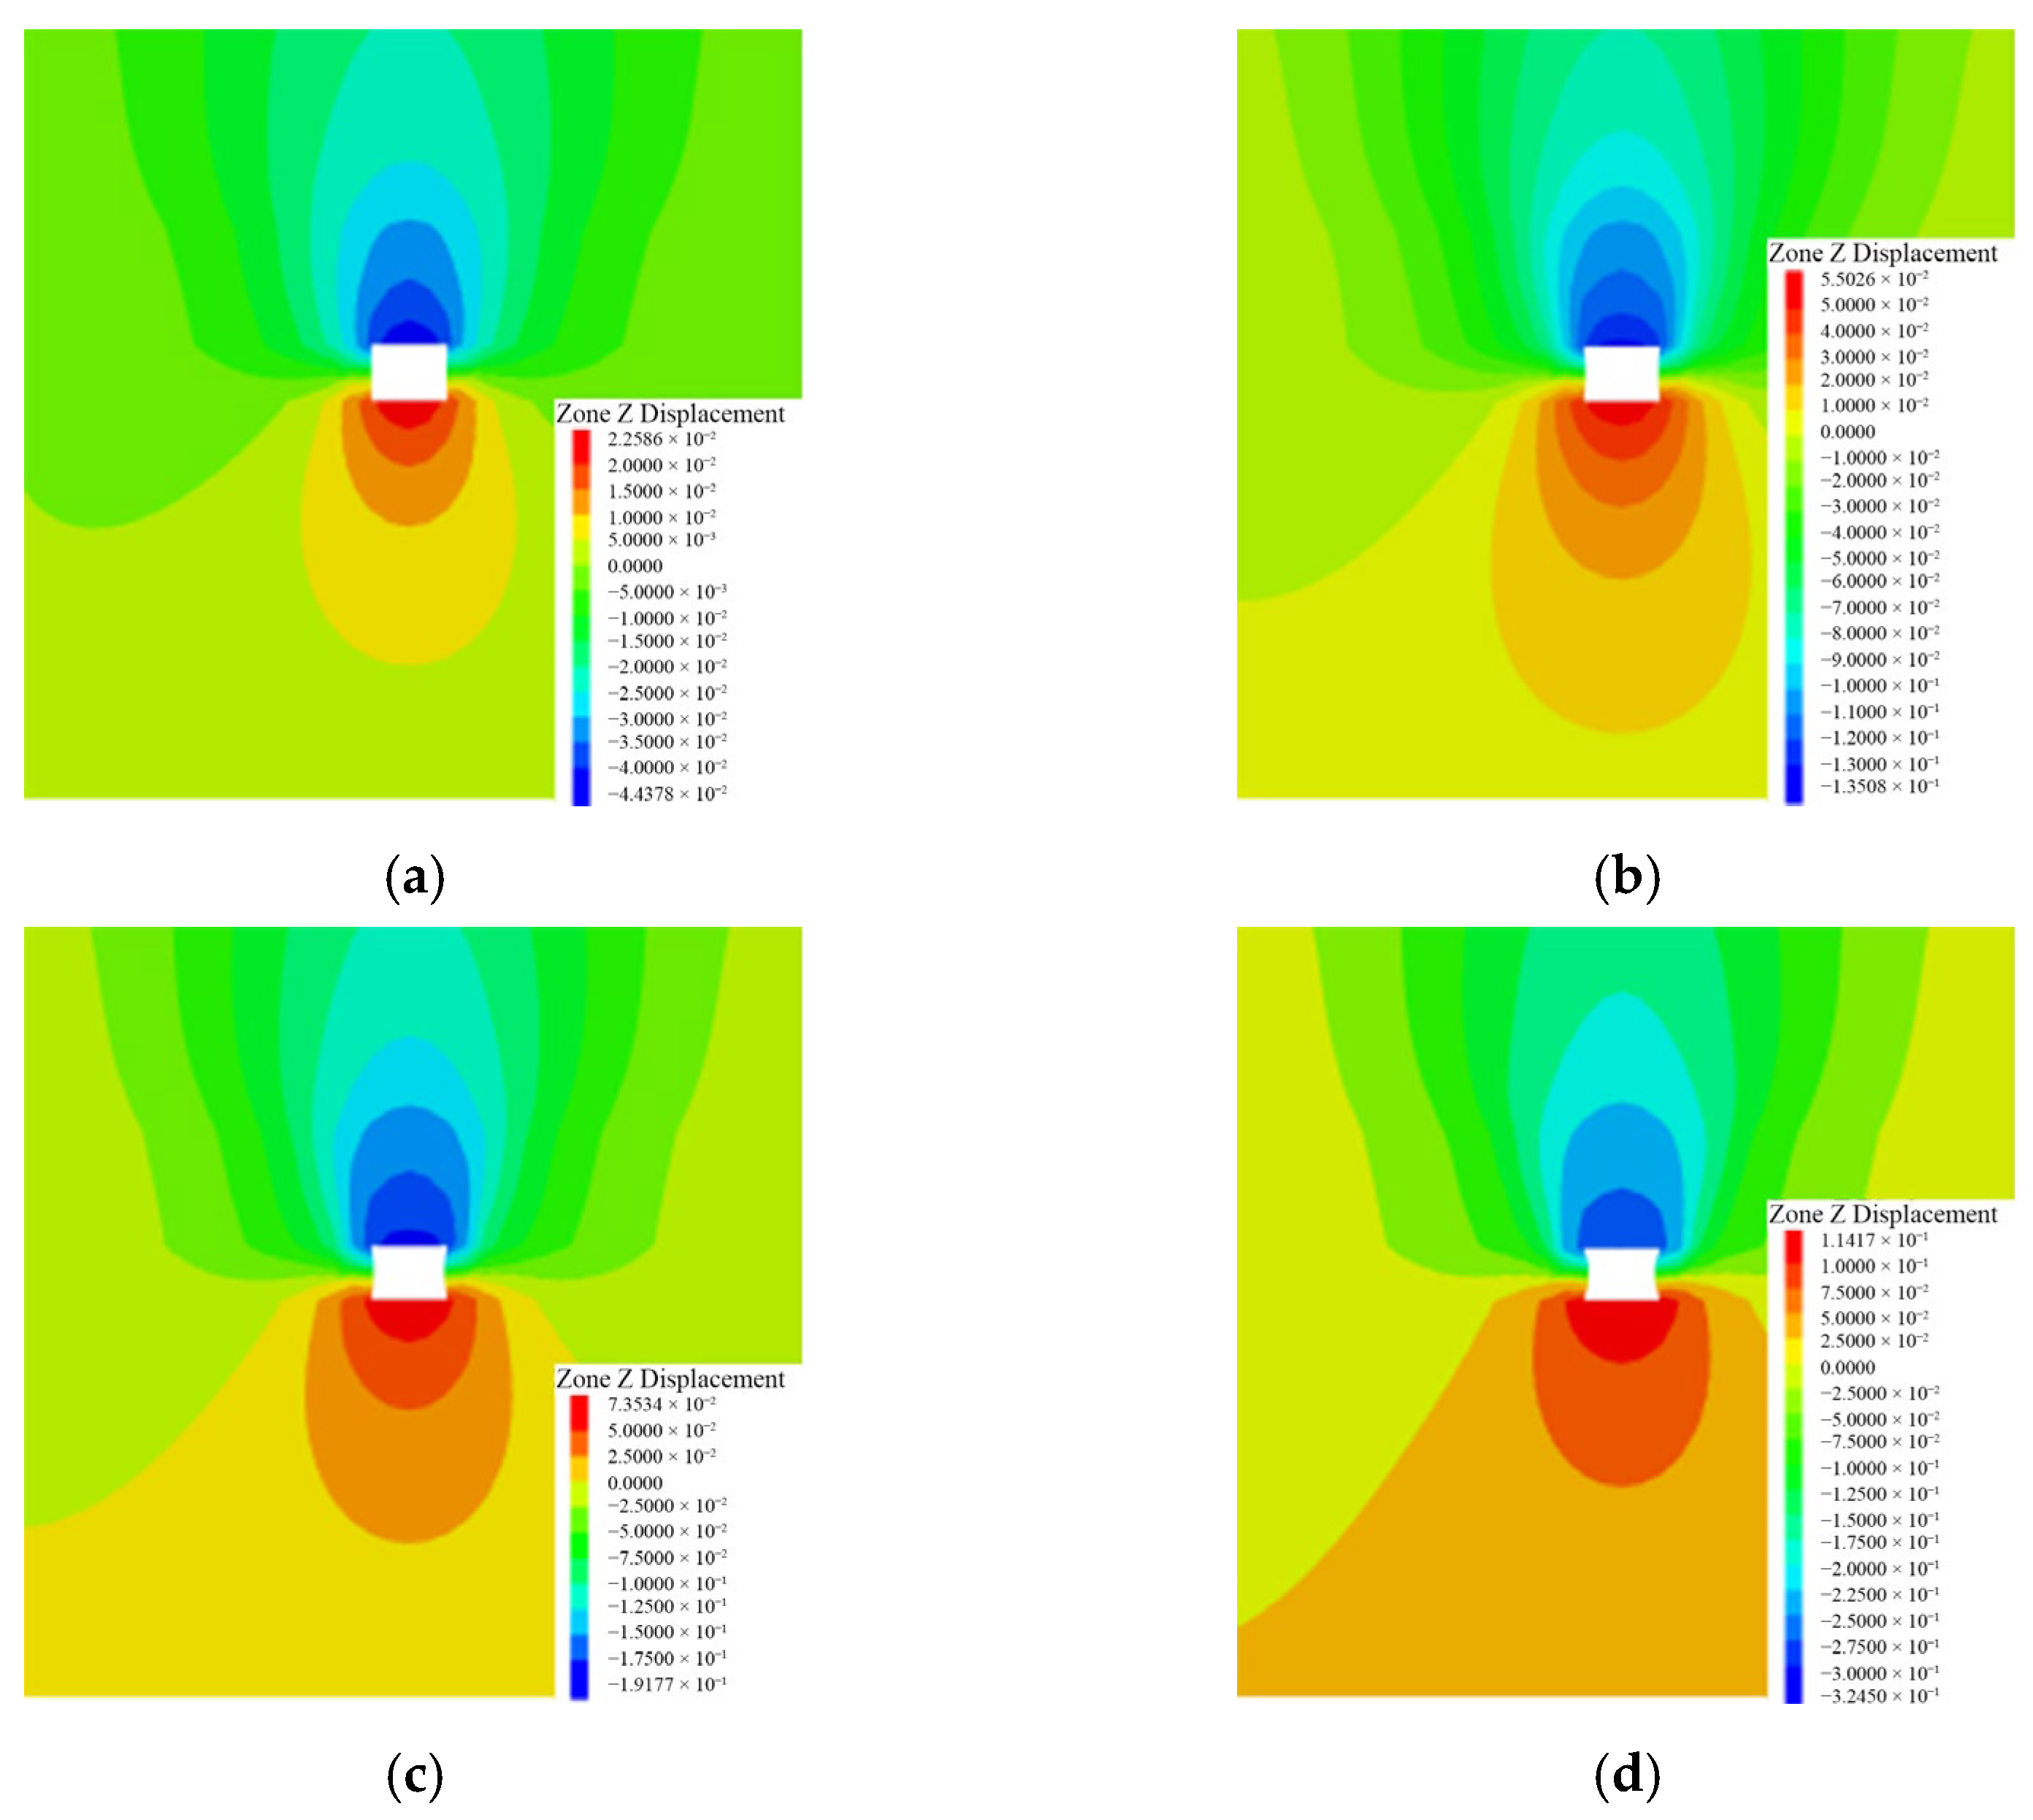
To discuss the deformation of the surrounding rock when the angle varies, numerical simulations were carried out respectively for seven angles of 0°, 15°, 30°, 45°, 60°, 75°, and 90°. The simulation results are shown in
Figure 8. Based on the simulation outcomes presented in
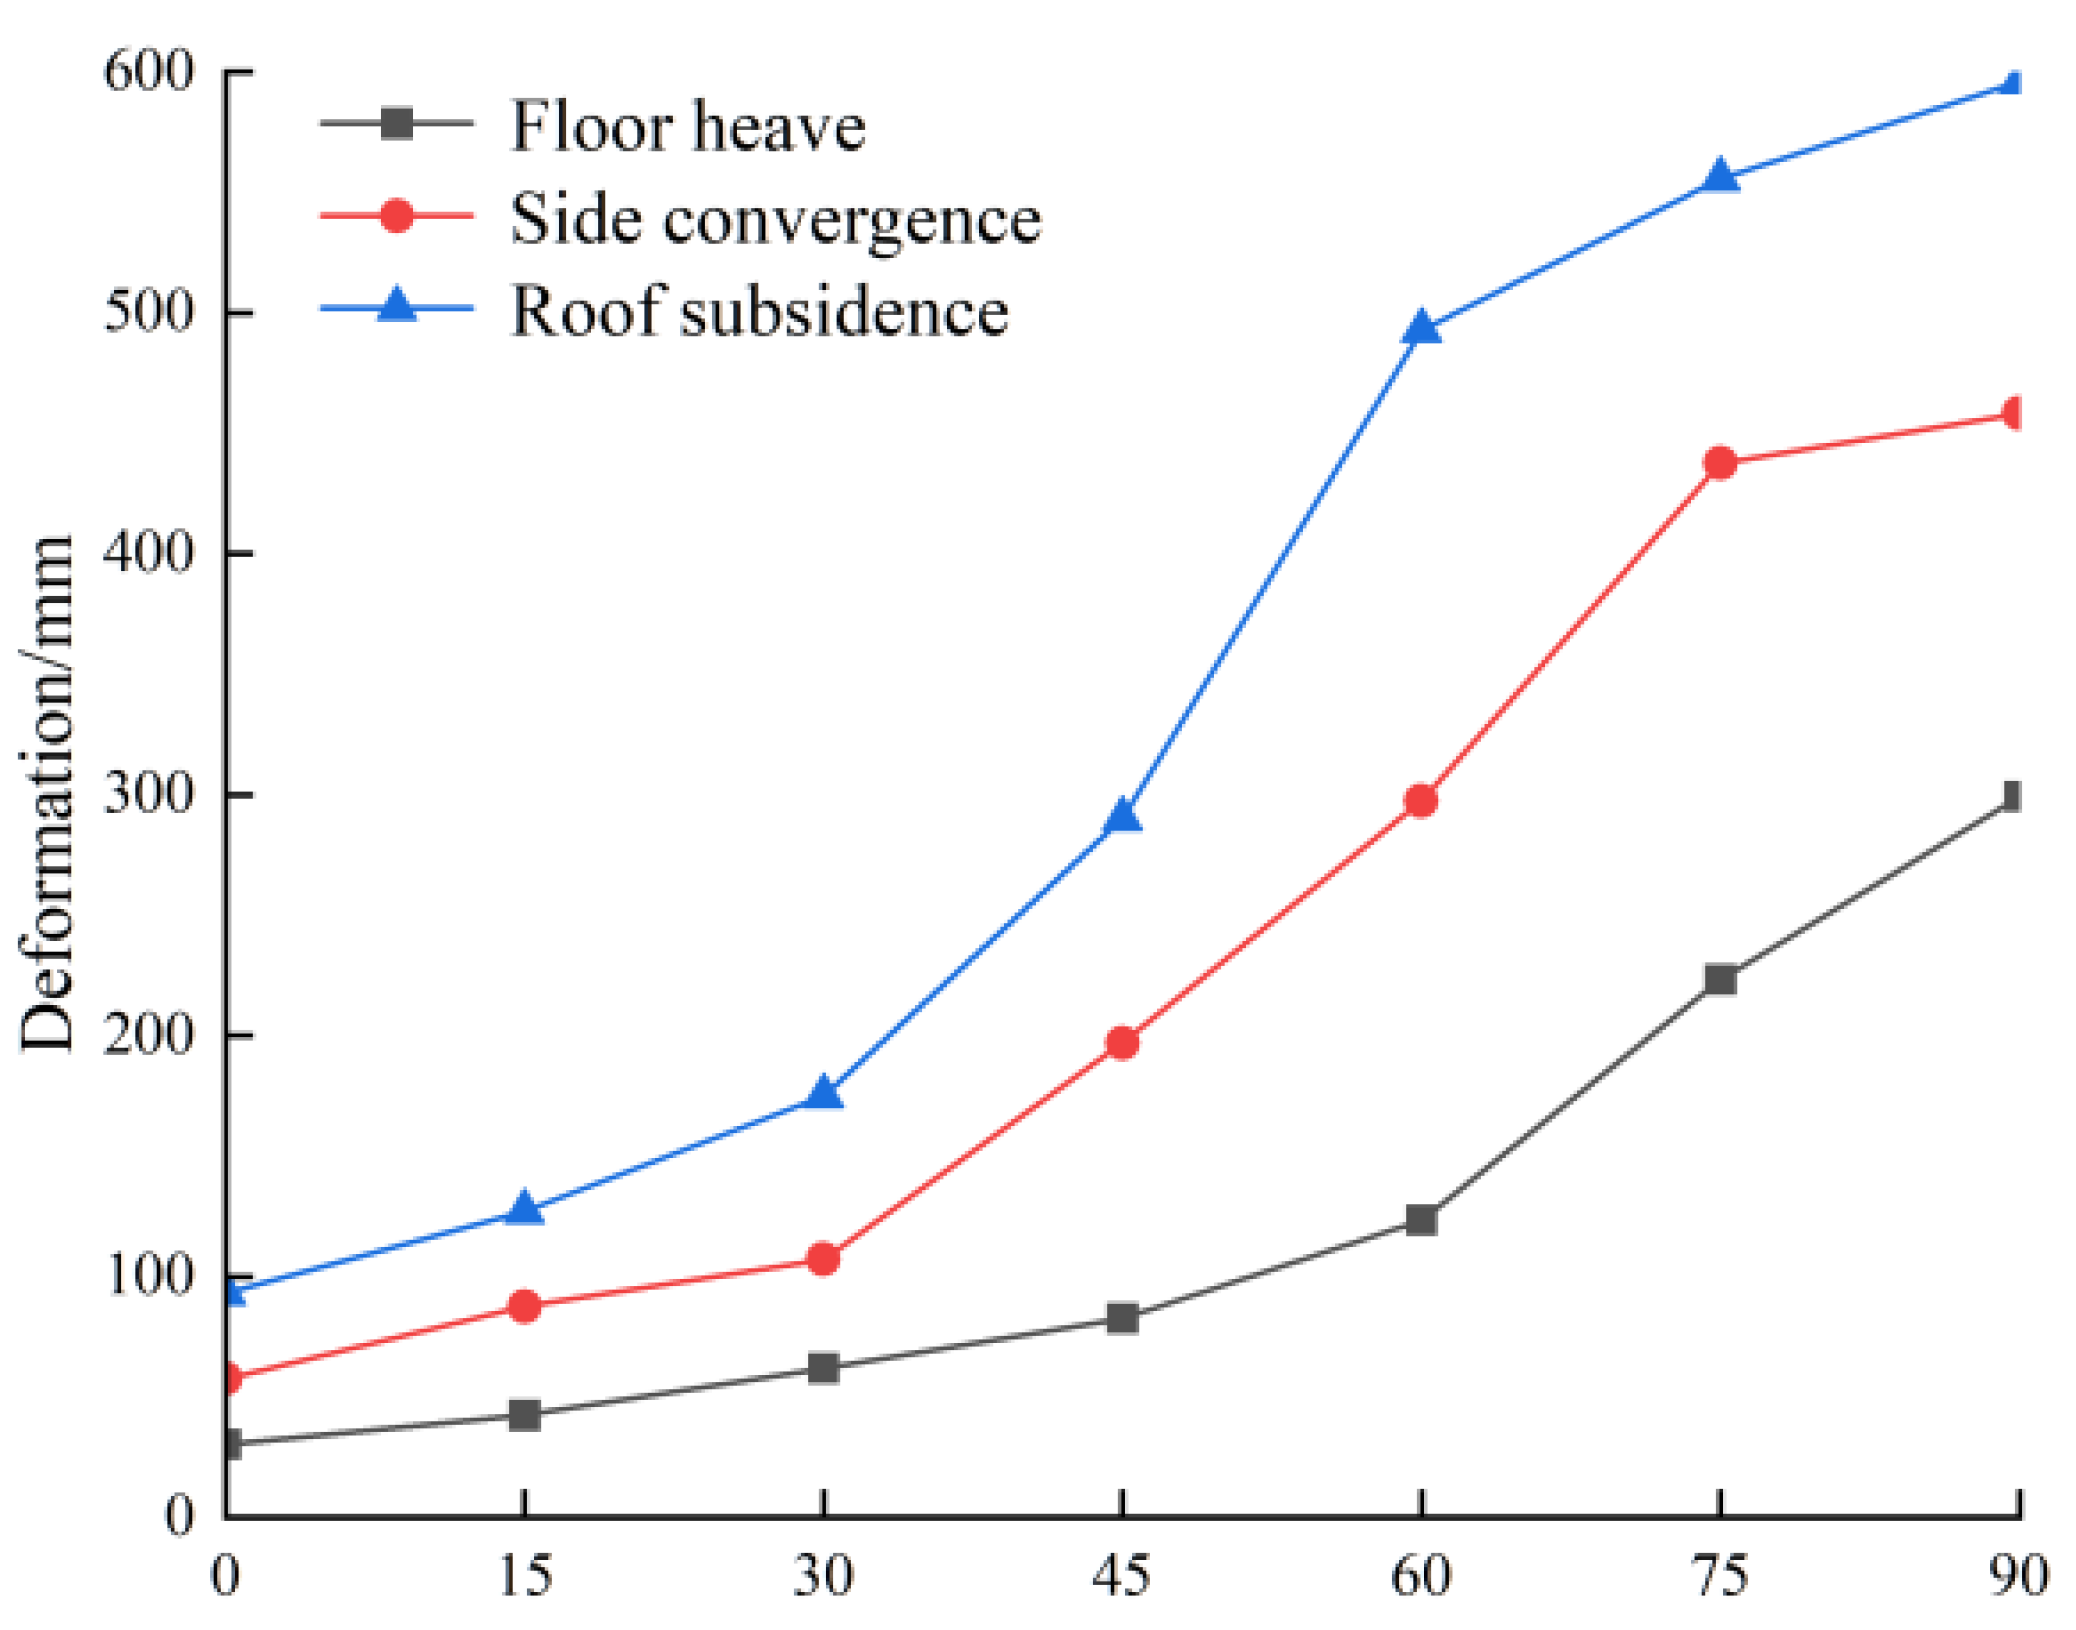
Figure 8, the curves of deformation under different angles are plotted, as depicted in
Figure 9.
- (1)
When the angle varies, the roadway deformation is significantly different, the roof subsidence is the largest, followed by the floor heave, and the overall trend is increasing. Therefore, during roadway excavation, the direction with the smallest angle to the principal stress direction should be selected, whenever possible, to enhance the stability of the roadway.
- (2)
When the angle ranges from 0° to 15°, the deformation is relatively small, and the roadway remains generally stable. As the angle increases to 30–75°, the deformation increases rapidly, leading to phenomena such as roof separation and side spalling. When the angle reaches 90°, the deformation is maximized, the roadway is severely damaged, and its support becomes more difficult.
Based on the above results, when the direction of σH is parallel to the strike of the roadway, the horizontal stress in the surrounding rock is minimized, and the deformation is also minimized. When the horizontal stress exceeds the strength of the surrounding rock, roof separation and side spalling appear, and significant deformation of the surrounding rock occurs, making the roadway very unstable. Therefore, when the roadway is laid out, positions with a large angle to the direction of the σH should be avoided.
3.3. Stability Analysis of Surrounding Rock Under Different Side Pressure Coefficients
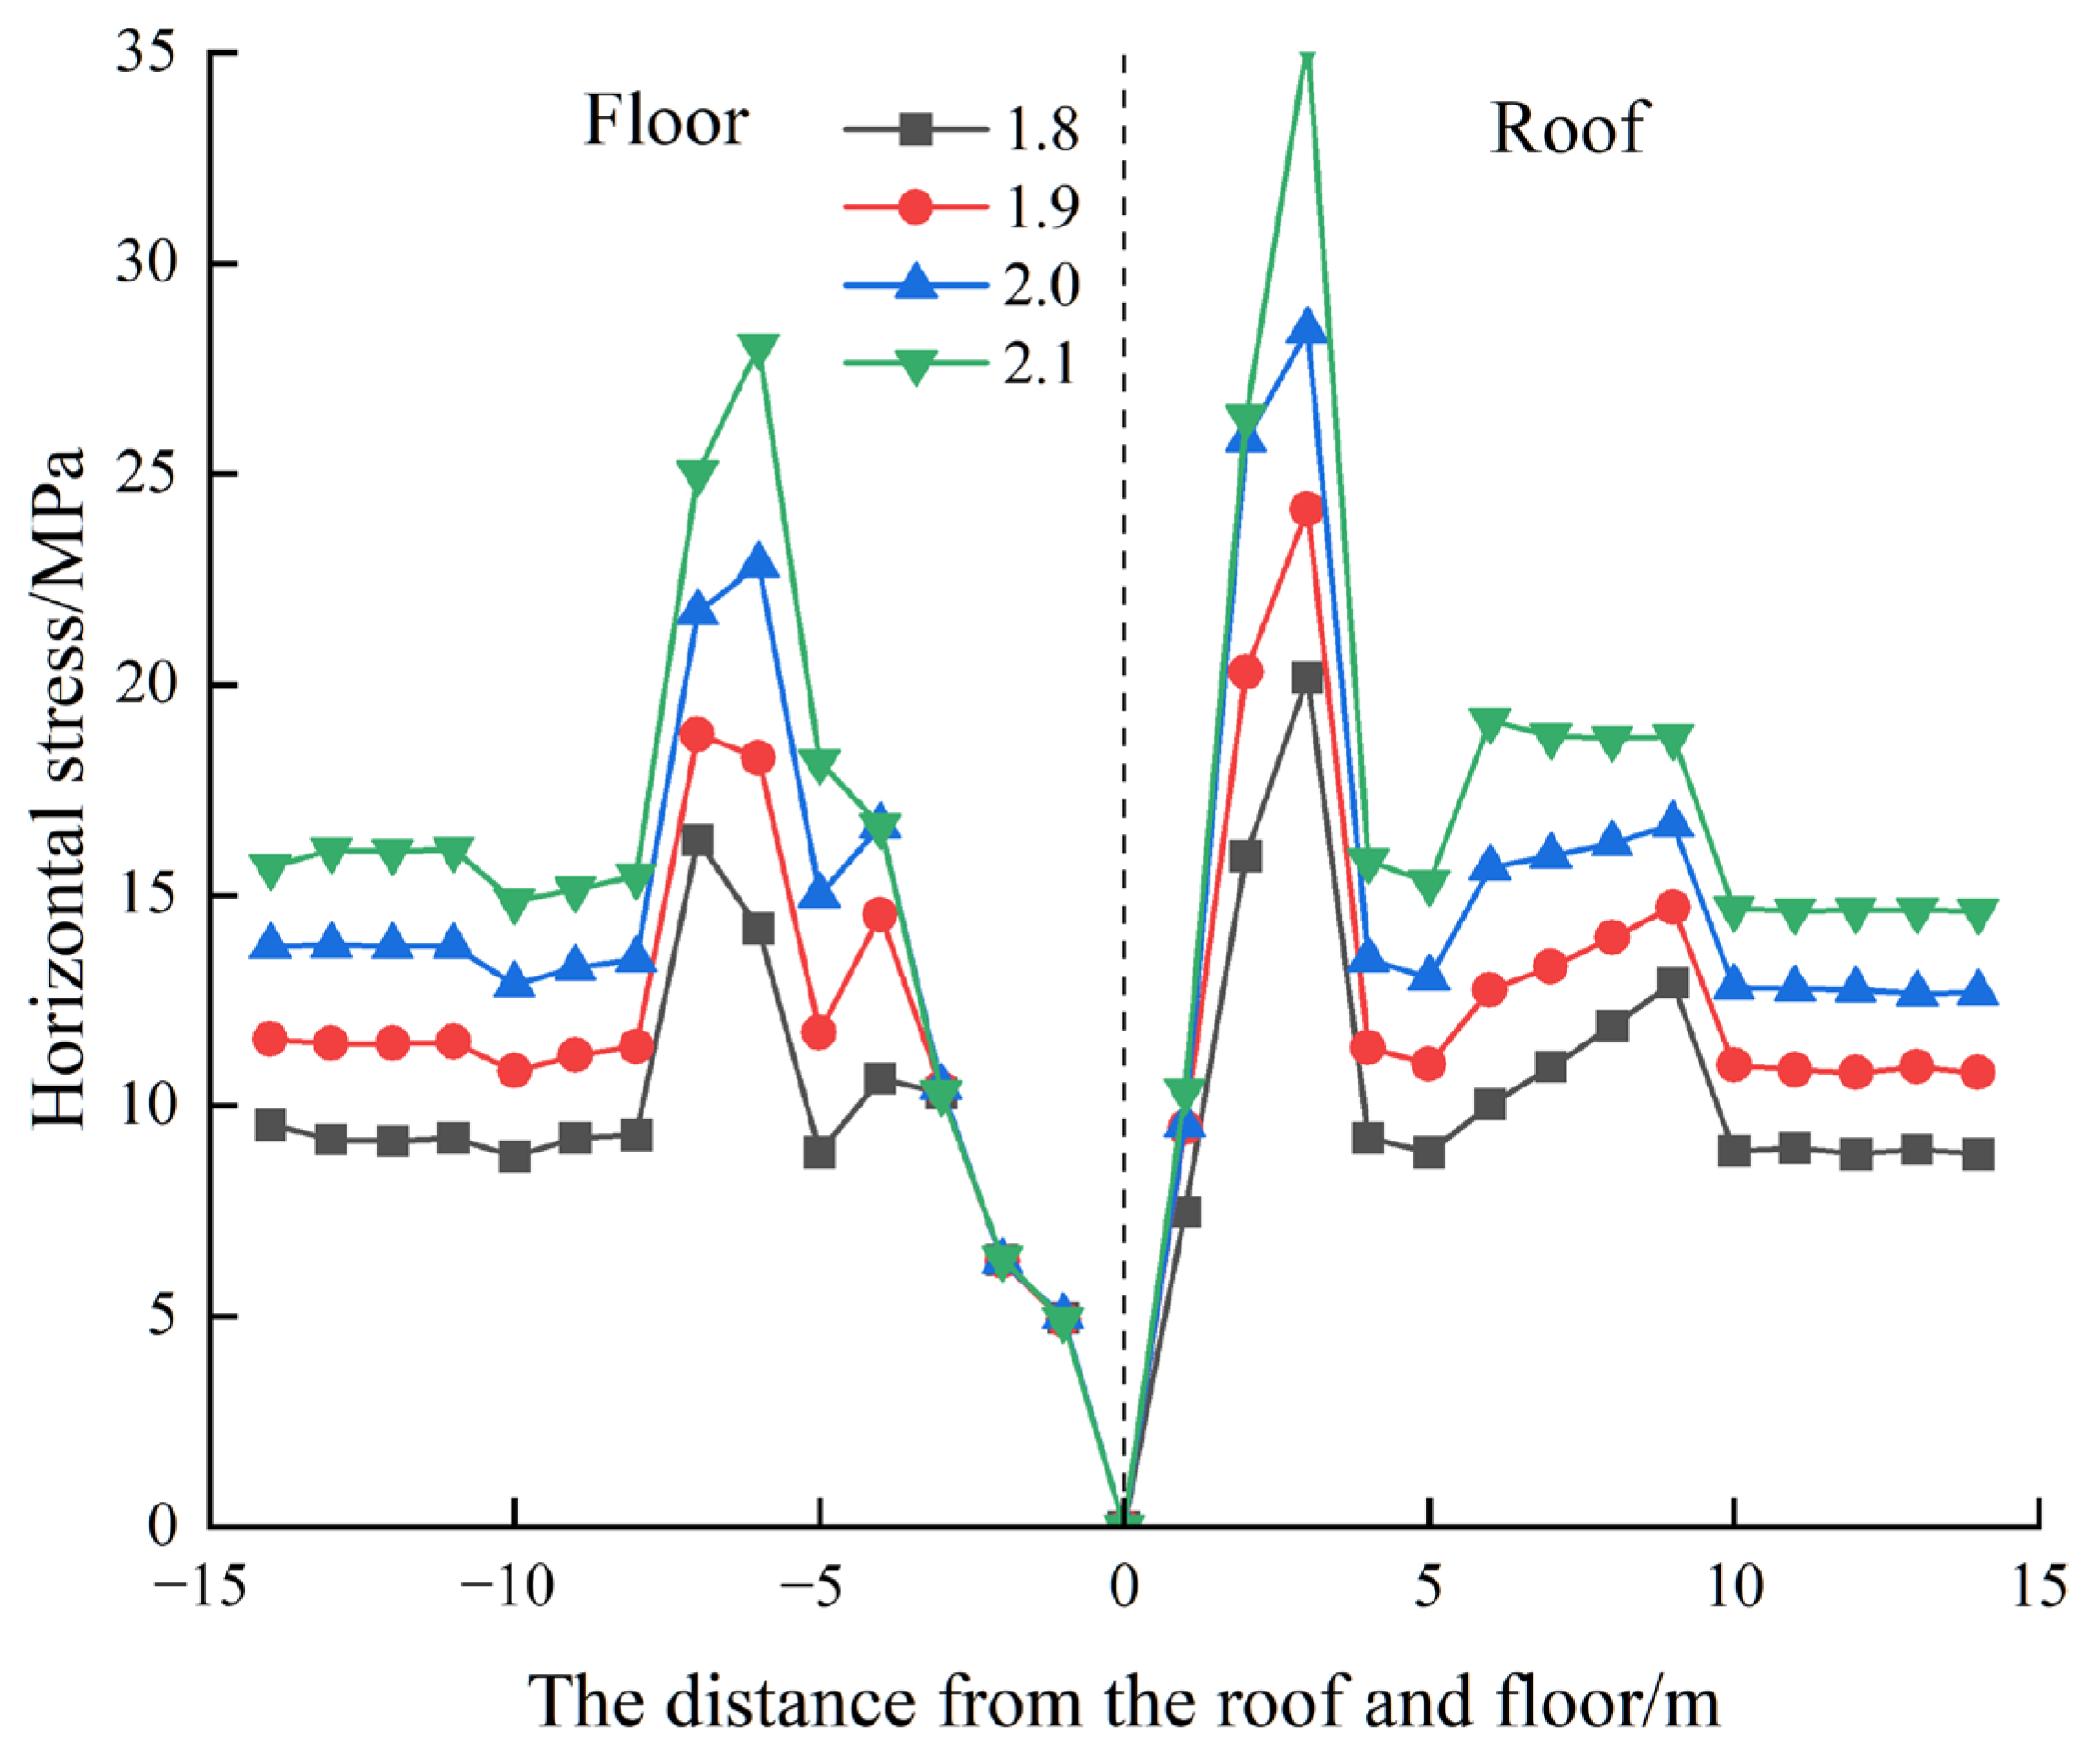
To examine the distribution of horizontal stress in the surrounding rock under different lateral pressure coefficients, numerical simulations are conducted for four conditions: 1.8, 1.9, 2.0, and 2.1. The simulation results are shown in
Figure 10. Based on the simulation results, the curves of horizontal stress variation with distance from the roof and floor of the roadway under different lateral pressure coefficients are plotted, as shown in
Figure 11.
- (1)
As the lateral pressure coefficient increases, the horizontal stress in the surrounding rock also increases. The peak value of the horizontal stress on the roof ranges from 21.2 MPa to 34.9 MPa, occurring 3 m from the roof. The peak value of the horizontal stress on the floor ranges from 17.2 MPa to 27.6 MPa, occurring 6 to 7 m from the floor.
- (2)
As the distance between the roof and floor increases, the horizontal stress also increases. The horizontal stress reaches its peak at 4 m from the roof and 6 m from the floor. After reaching the peak stress, the horizontal stress rapidly drops to about half of the peak stress. Then, after stabilizing at a distance of 2–3 m, the stress increases slightly and remains stable, while the stress above the roof decreases after stabilizing over 4 to 5 m. Finally, the stress gradually stabilizes at positions 10 m from the roof and 8 m from the floor.
To examine the deformation of the roadway under varying lateral pressure coefficients, numerical simulations are conducted for four conditions: 1.8, 1.9, 2.0, and 2.1. The simulation results are shown in
Figure 12. Based on the simulation results, the deformation curves for different lateral pressure coefficients are plotted in
Figure 13.
- (1)
As the lateral pressure coefficient increases, the deformation generally exhibits an upward trend. The deformation increases sharply when the lateral pressure coefficient rises from 2.0 to 2.1. The roof subsidence is 44 mm, 135 mm, 192 mm, and 325 mm, respectively; the floor heave is 23 mm, 55 mm, 74 mm, and 114 mm; and the side convergence is 30 mm, 70 mm, 100 mm, and 200 mm.
- (2)
When the side pressure coefficient is 1.8, the overall deformation of the roadway is small, and the surrounding rock is within the control range. With the increase of the side pressure coefficient, the deformation of the roof increases most obviously, while the increase of the floor and the two sides is small. However, when the side pressure coefficient is from 2.0 to 2.1, the deformation of the surrounding rock increases greatly. The deformation of the roadway roof and sides shows a positive correlation with the lateral pressure coefficient, indicating that controlling the roof and sides will become significantly more difficult.
Numerical simulation analysis of roadway excavation shows that the included angle between the direction of the σH and the strike of the roadway, along with the lateral pressure coefficient, has a significant influence on stability. Consequently, for roadways subjected to high levels of stress, developing a rational support scheme is crucial to ensuring the safety and stability of the roadway.
4. Support Optimization for High-Level Stressed Mining Roadway
By analyzing the effects of different included angles and lateral pressure coefficients on the horizontal stress and deformation of the surrounding rock, the variation law governing the stability of the surrounding rock is revealed. These laws serve as an important reference for designing roadway layouts and support schemes. Building on these stability laws, the support design of the on-site roadway is further optimized to enhance its safety and stability.
4.1. The Principle of Surrounding Rock Stability Control in High Horizontal Stress Roadways
The deformation of roadways with high horizontal stress is significant, the support difficulty is high, and stability is challenging to maintain. Therefore, the following countermeasures are proposed to enhance the stability of the roadway:
- (1)
Strengthen the bearing capacity of the roof. After roadway excavation, the initial rock stress is redistributed, changing the stress state from the initial triaxial stress to a bidirectional stress state. A crushing zone forms in the roadway, and as a discontinuous loose medium, the bearing capacity of the roof is reduced. Therefore, to enhance the bearing capacity of the roof, high-strength prestressed anchor cables are used to reinforce the surrounding rock in the fractured roof area, creating a unified load-bearing structure.
- (2)
Strengthen control of key areas. Under the influence of high horizontal stress, the plastic zone adopts a “butterfly” shape, with the butterfly’s wings located at the two shoulders (maximum size) of the roof and the arch foot of the floor, respectively. The butterfly’s wings represent a potential crushing area. As the service life progresses, once the deformation rate reaches the unstable stage, the butterfly’s wings enter the crushing stage, and the stability of the roadway rapidly declines. High-strength prestressed anchor cables are installed above the roadway, and high-strength prestressed anchor bolts are placed at the arch foot of the roof. The “anchor bolt-anchor cable-anchor net-steel belt” support structure is adopted to enhance the stability of the surrounding rock.
4.2. Support Optimization Design
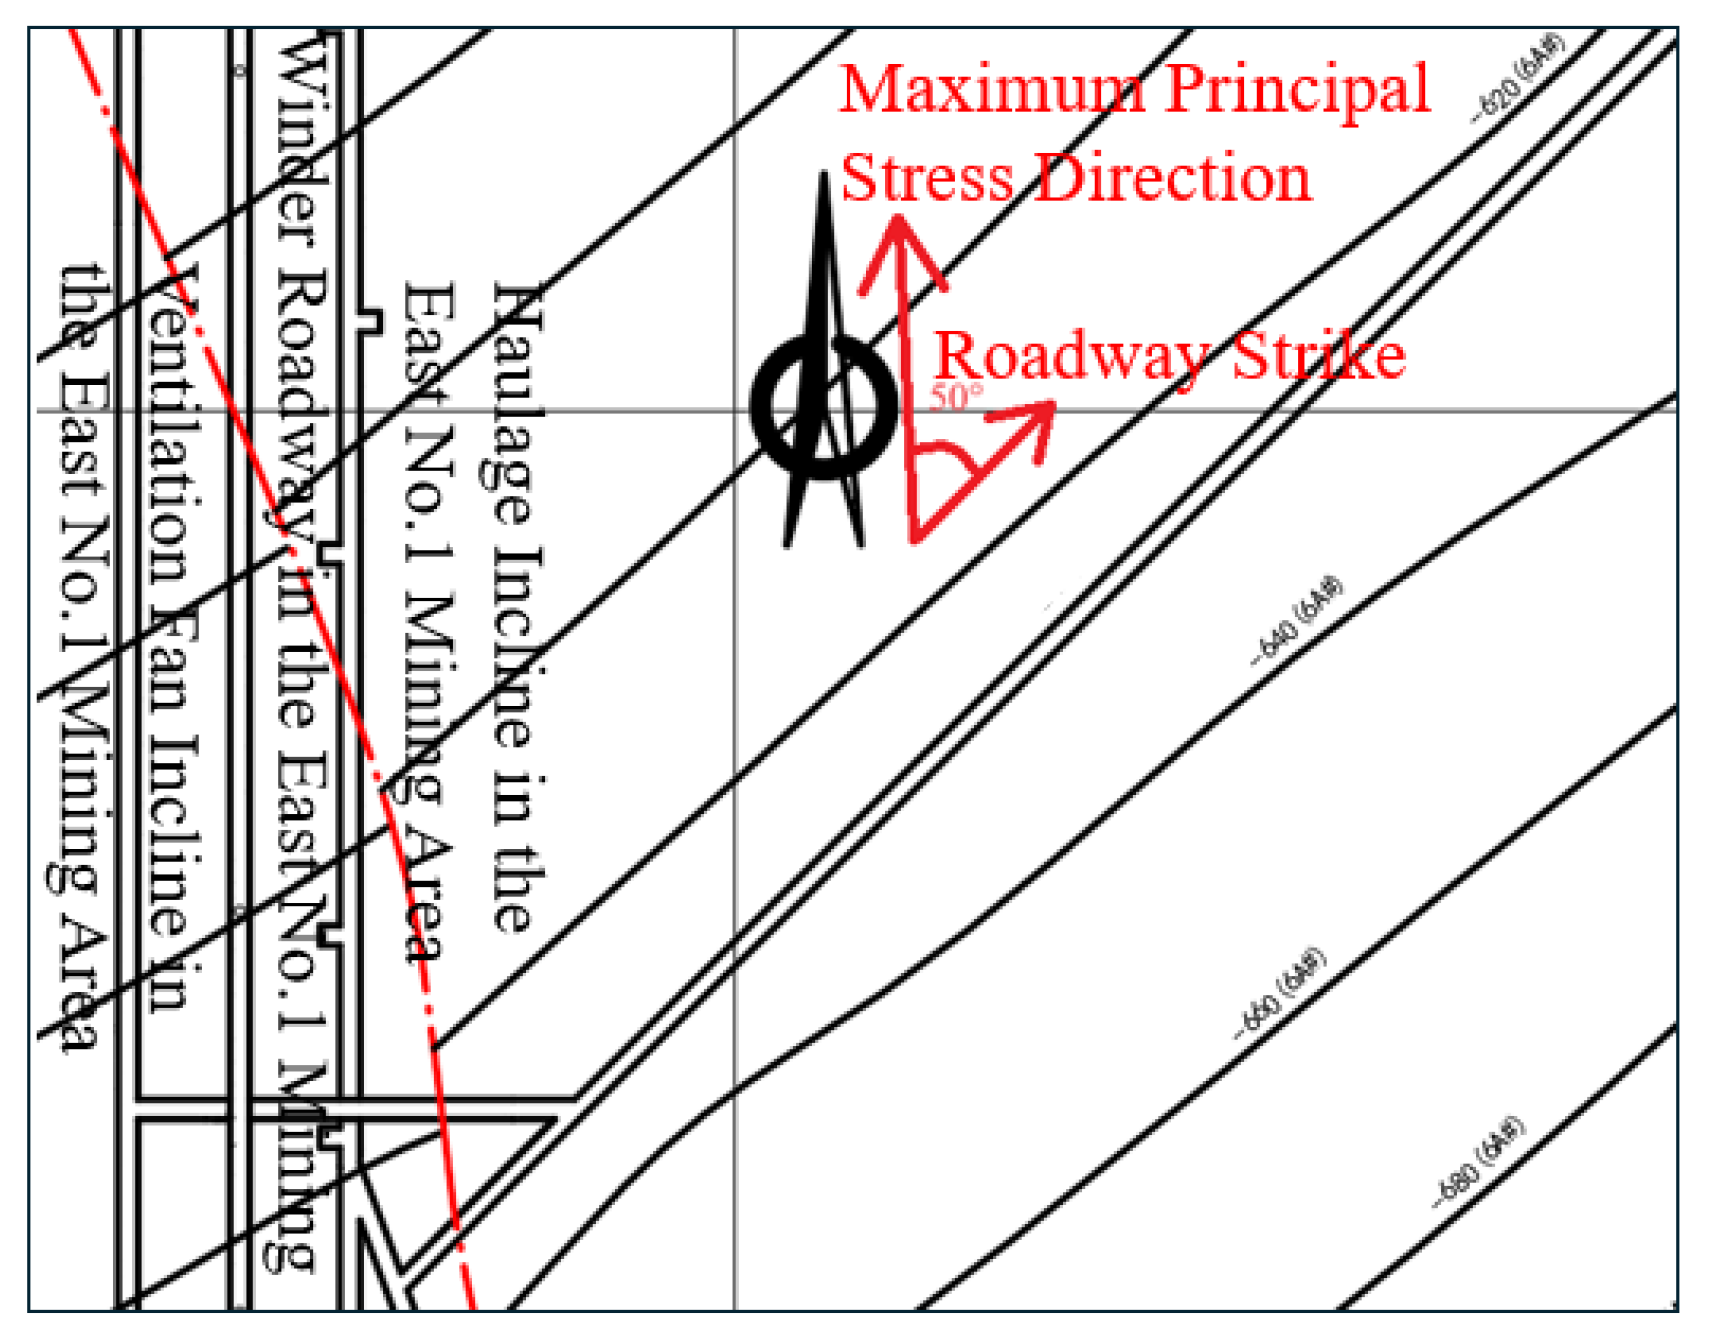
The “anchor bolt-anchor cable-net” support structure is the original support scheme. However, this scheme is inadequate for addressing high horizontal stress. By comparing the direction of the σ
H with the strike of the 6A# Left 2nd Roadway, it is observed that the included angle between the roadway and the maximum principal stress direction is approximately 50°. The specific direction is illustrated in
Figure 14.
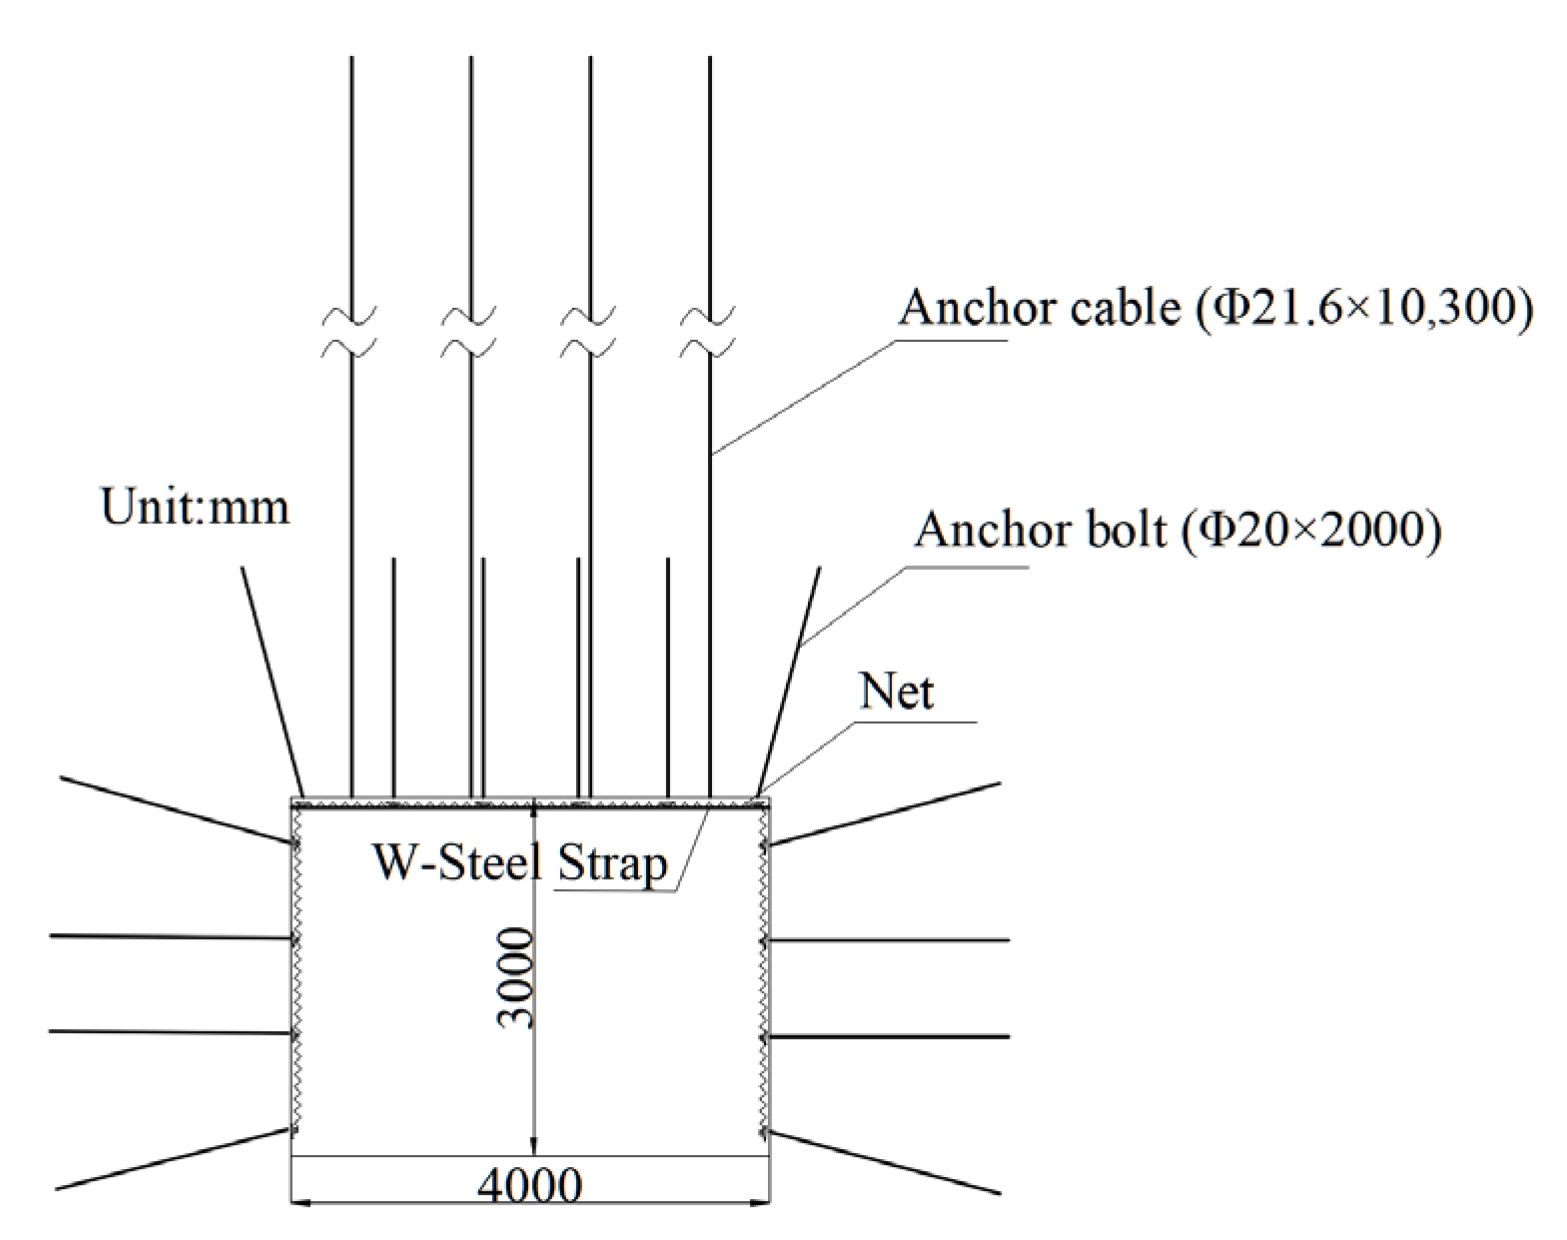
Taking Ronghua No. 1 Mine as the study subject and building on research on roadway surrounding rock stability, an optimized support scheme is proposed: The spacing distance between the anchor bolts in the roof and the two sides is reduced from 1200 mm to 800 mm, and the length of the roof anchor cables is increased from 6200 mm to 10,300 mm. Additionally, anchor bolts or anchor cables are added at the junctions of the roof and the two sides for reinforcement, and W steel strips are placed on the roof to enhance the stability and integrity of the roof. The schematic of the optimized roadway support system is shown in
Figure 15.
Building on the original support scheme, the optimized scheme is proposed, and numerical simulation software FLAC3D 5.0 is used for modeling and analysis. The specific details are shown in
Table 3.
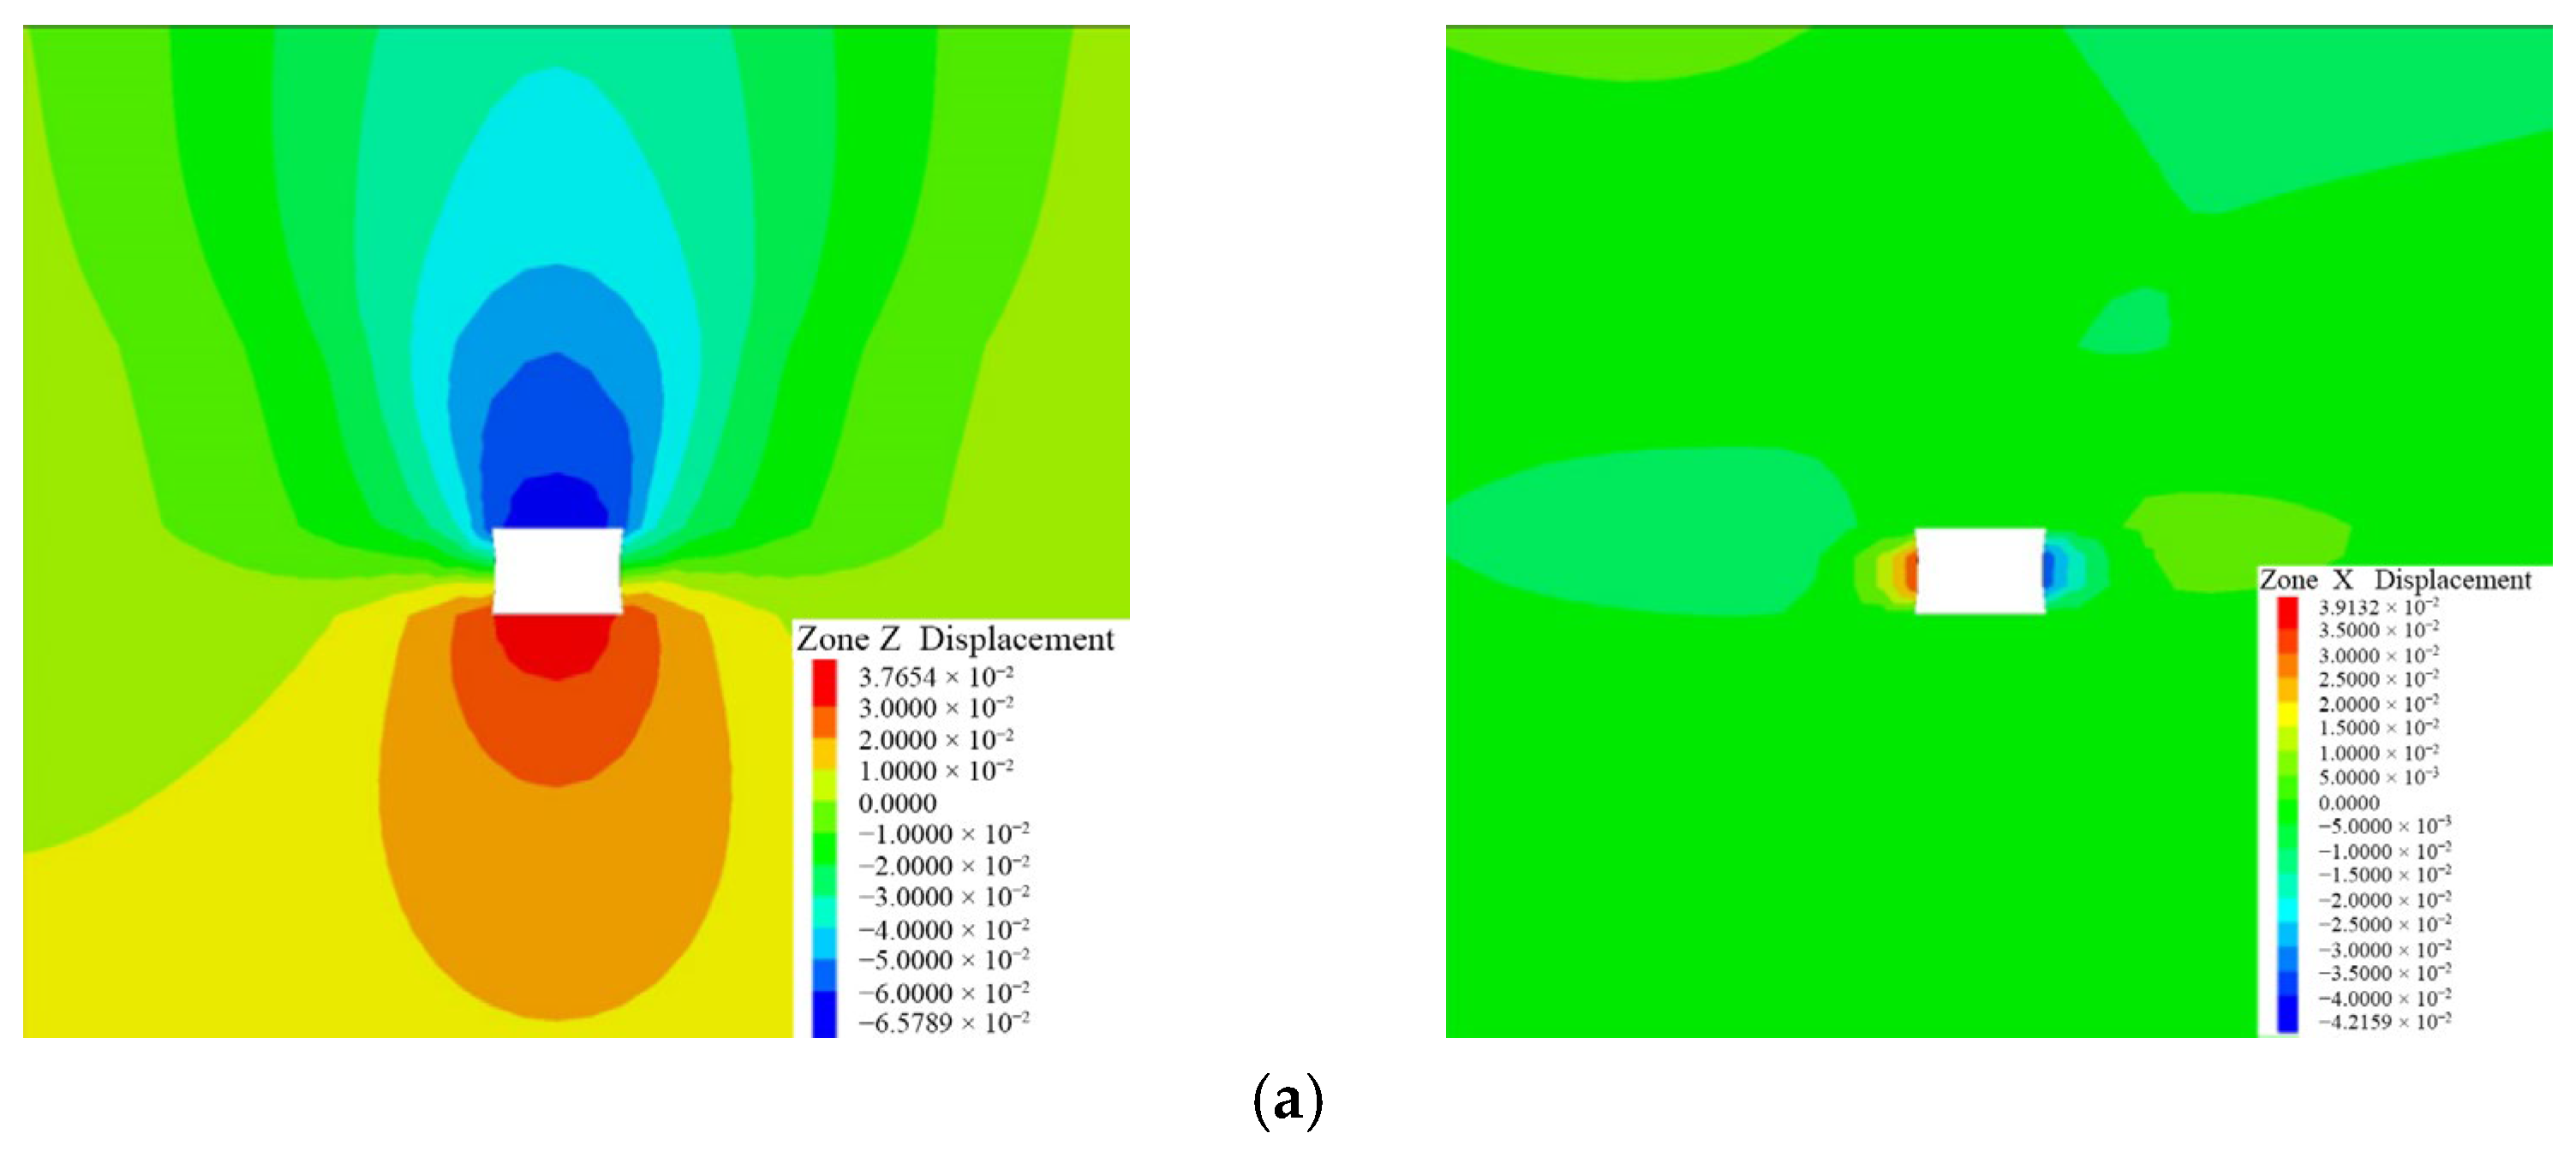
A roadway model for the 6A# Left 2nd Roadway is established. By simulating factors such as the spacing of the optimized anchor bolts and anchor cables, the addition of W steel strips on the roof, and the support angles at the junctions of the sidewalls with the roof and floor, the vertical and horizontal deformations exerted on the roadway are analyzed. The optimized support scheme is obtained by fully meeting the safety requirements for roadway support and considering factors such as economy.
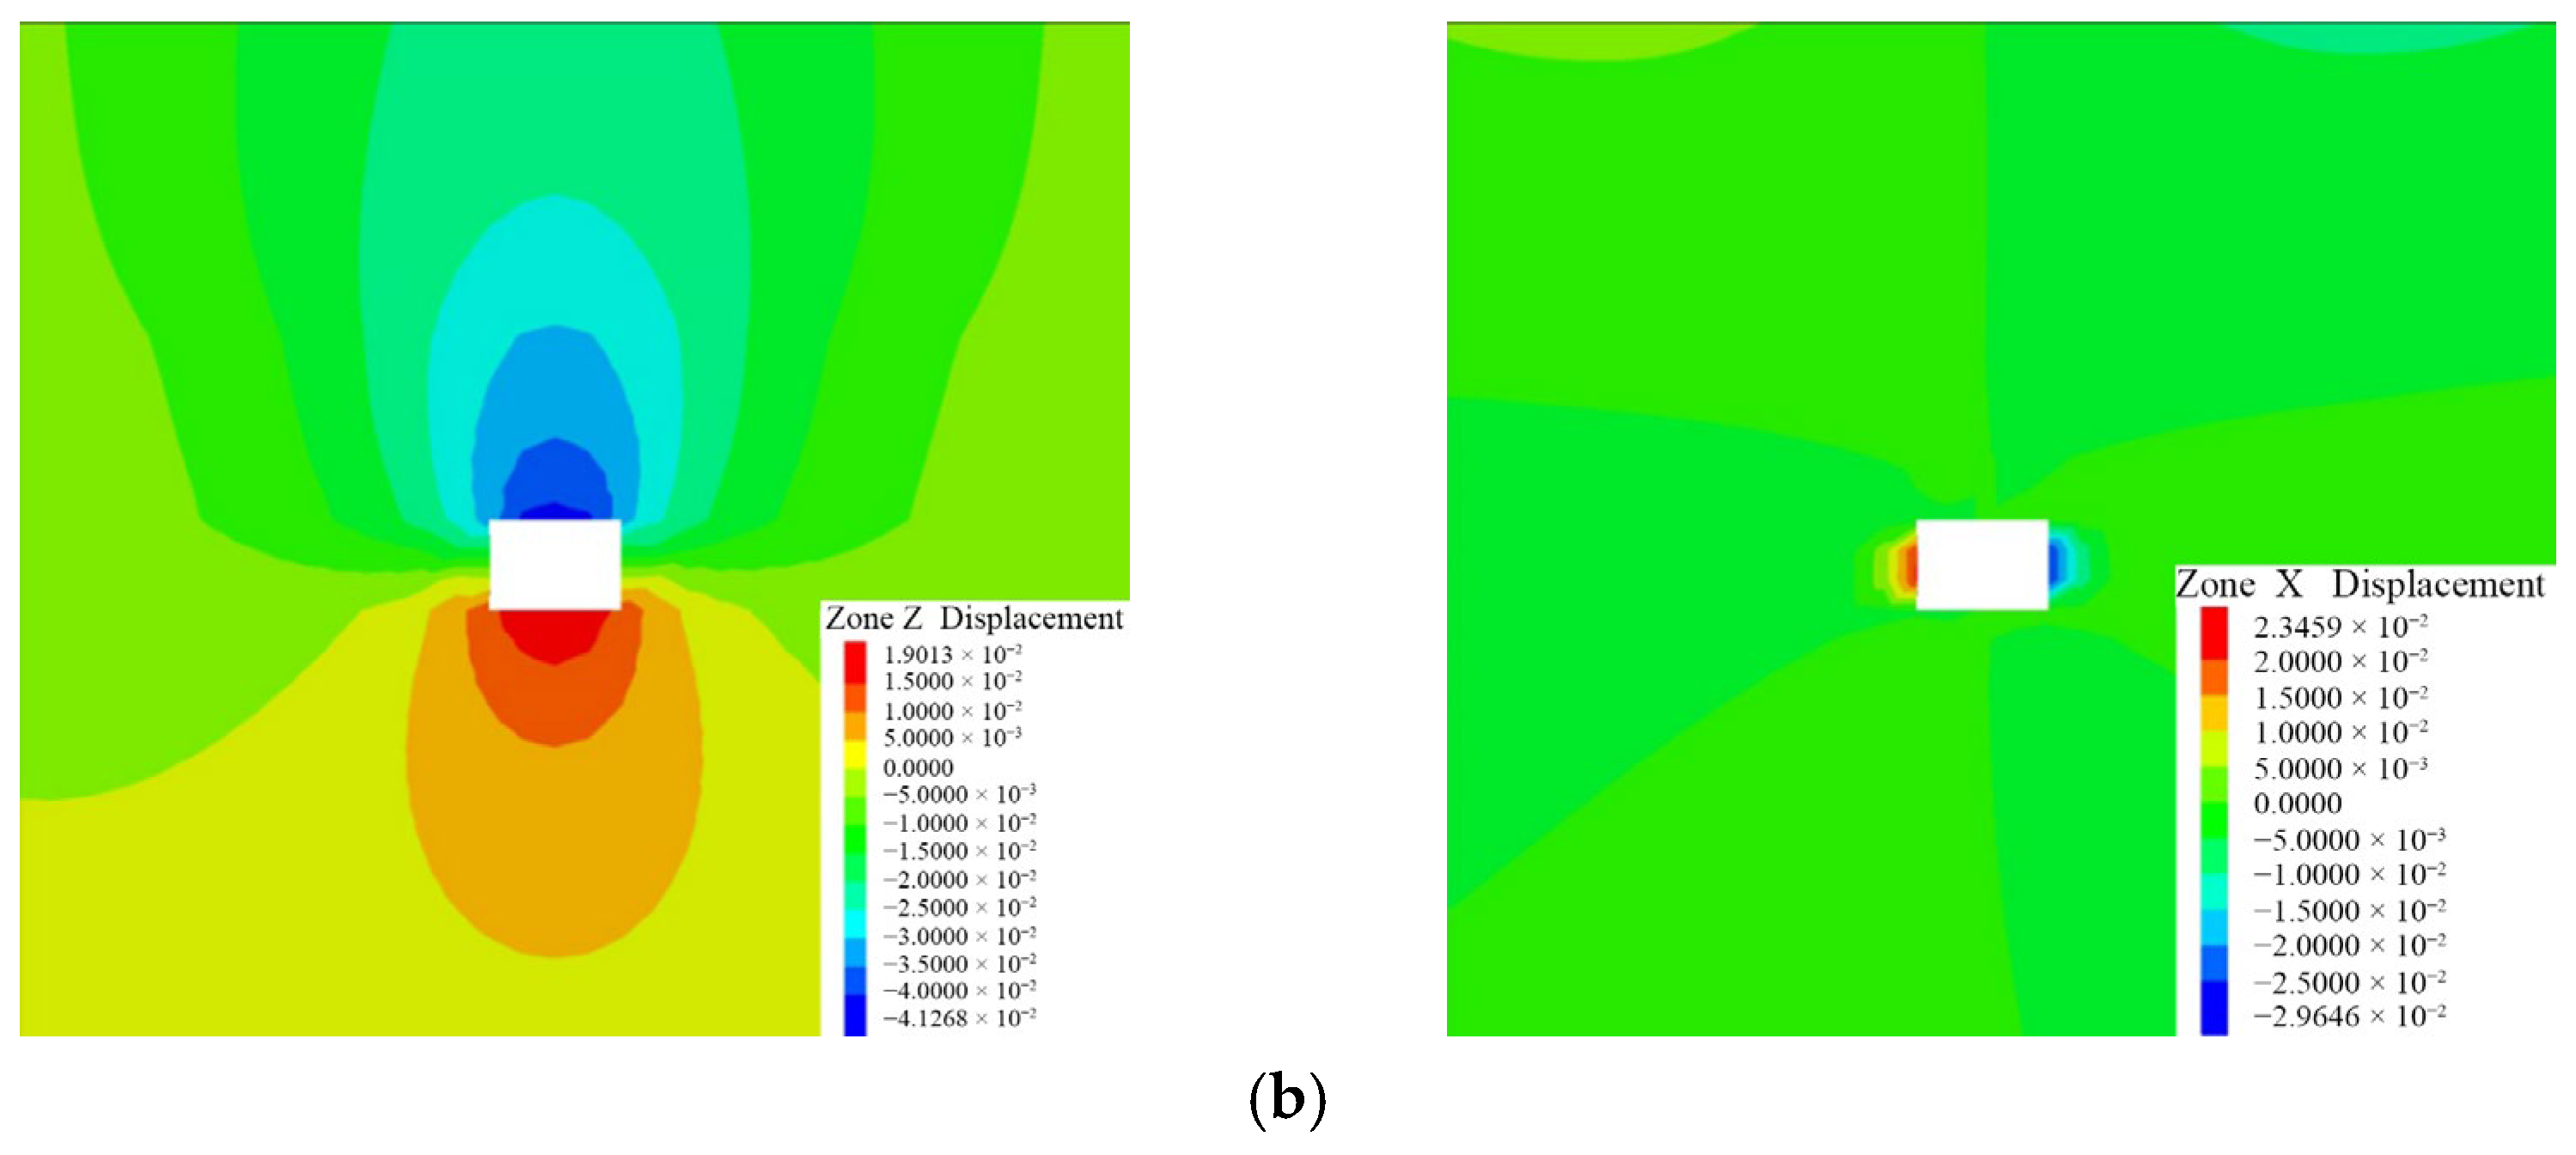
As seen from
Figure 16, the deformation in the optimized scheme is significantly reduced: the roof subsidence decreases from 66 mm to 41 mm, a decrease of 37.3%, the floor heave reduces from 38 mm to 19 mm, a decrease of 49.5%, and the side convergence decreases from 81 mm to 53 mm, a decrease of 34.7%. This indicates that the optimized scheme is highly effective in enhancing roadway stability.
5. Field Application and Effect Analysis
Based on the results of the optimized scheme and the actual conditions of the 6A# Left 2nd Roadway, an optimized support design is developed. The optimized support scheme utilizes a combined support system consisting of “anchor bolt-anchor cable-net-steel belt”. This support system can enhance the self-bearing capacity of the surrounding rock and improve its stability by re-optimizing the design parameters of anchor bolt and anchor cable, and adjusting key indicators such as anchorage length, spacing, and pre-tightening force. Meanwhile, a steel belt is added to construct a combined support structure. By taking advantage of the tensile properties of the steel belt, it can effectively compensate for the instability of and damage to the roof caused by factors such as stress concentration, further strengthen the integrity of the roof, and comprehensively enhance the stability of the roadway.
The specific support parameters are as follows:
Roof anchor bolts: The diameter is 20 mm, the length is 2000 mm. The row and line space is 800 mm × 1000 mm. The initial anchoring force is no less than 40 kN, and the anchoring force is no less than 102 kN. The matching devices include a 120 mm × 120 mm × 8 mm butterfly-shaped tray, a 2600 mm × 145 mm × 2.75 mm W-shaped steel strap, and a 4000 mm × 1600 mm cold-drawn wire mesh with a diameter of 3.5 mm.
Anchor cables: The diameter is 21.6 mm, the length is 10,300 mm. The row and line space is 1000 mm × 1000 mm. The initial anchoring force is no less than 170 kN, and the anchoring force is no less than 320 kN. The matching devices include a 300 mm × 300 mm × 14 mm butterfly-shaped tray and 23 mm × 260 mm resin capsules.
Side anchor bolts: The parameters are identical to those of the roof anchor bolts.
Net: A cold-drawn wire mesh, with dimensions of 4000 mm × 1600 mm and a wire diameter of 3.5 mm, is used.
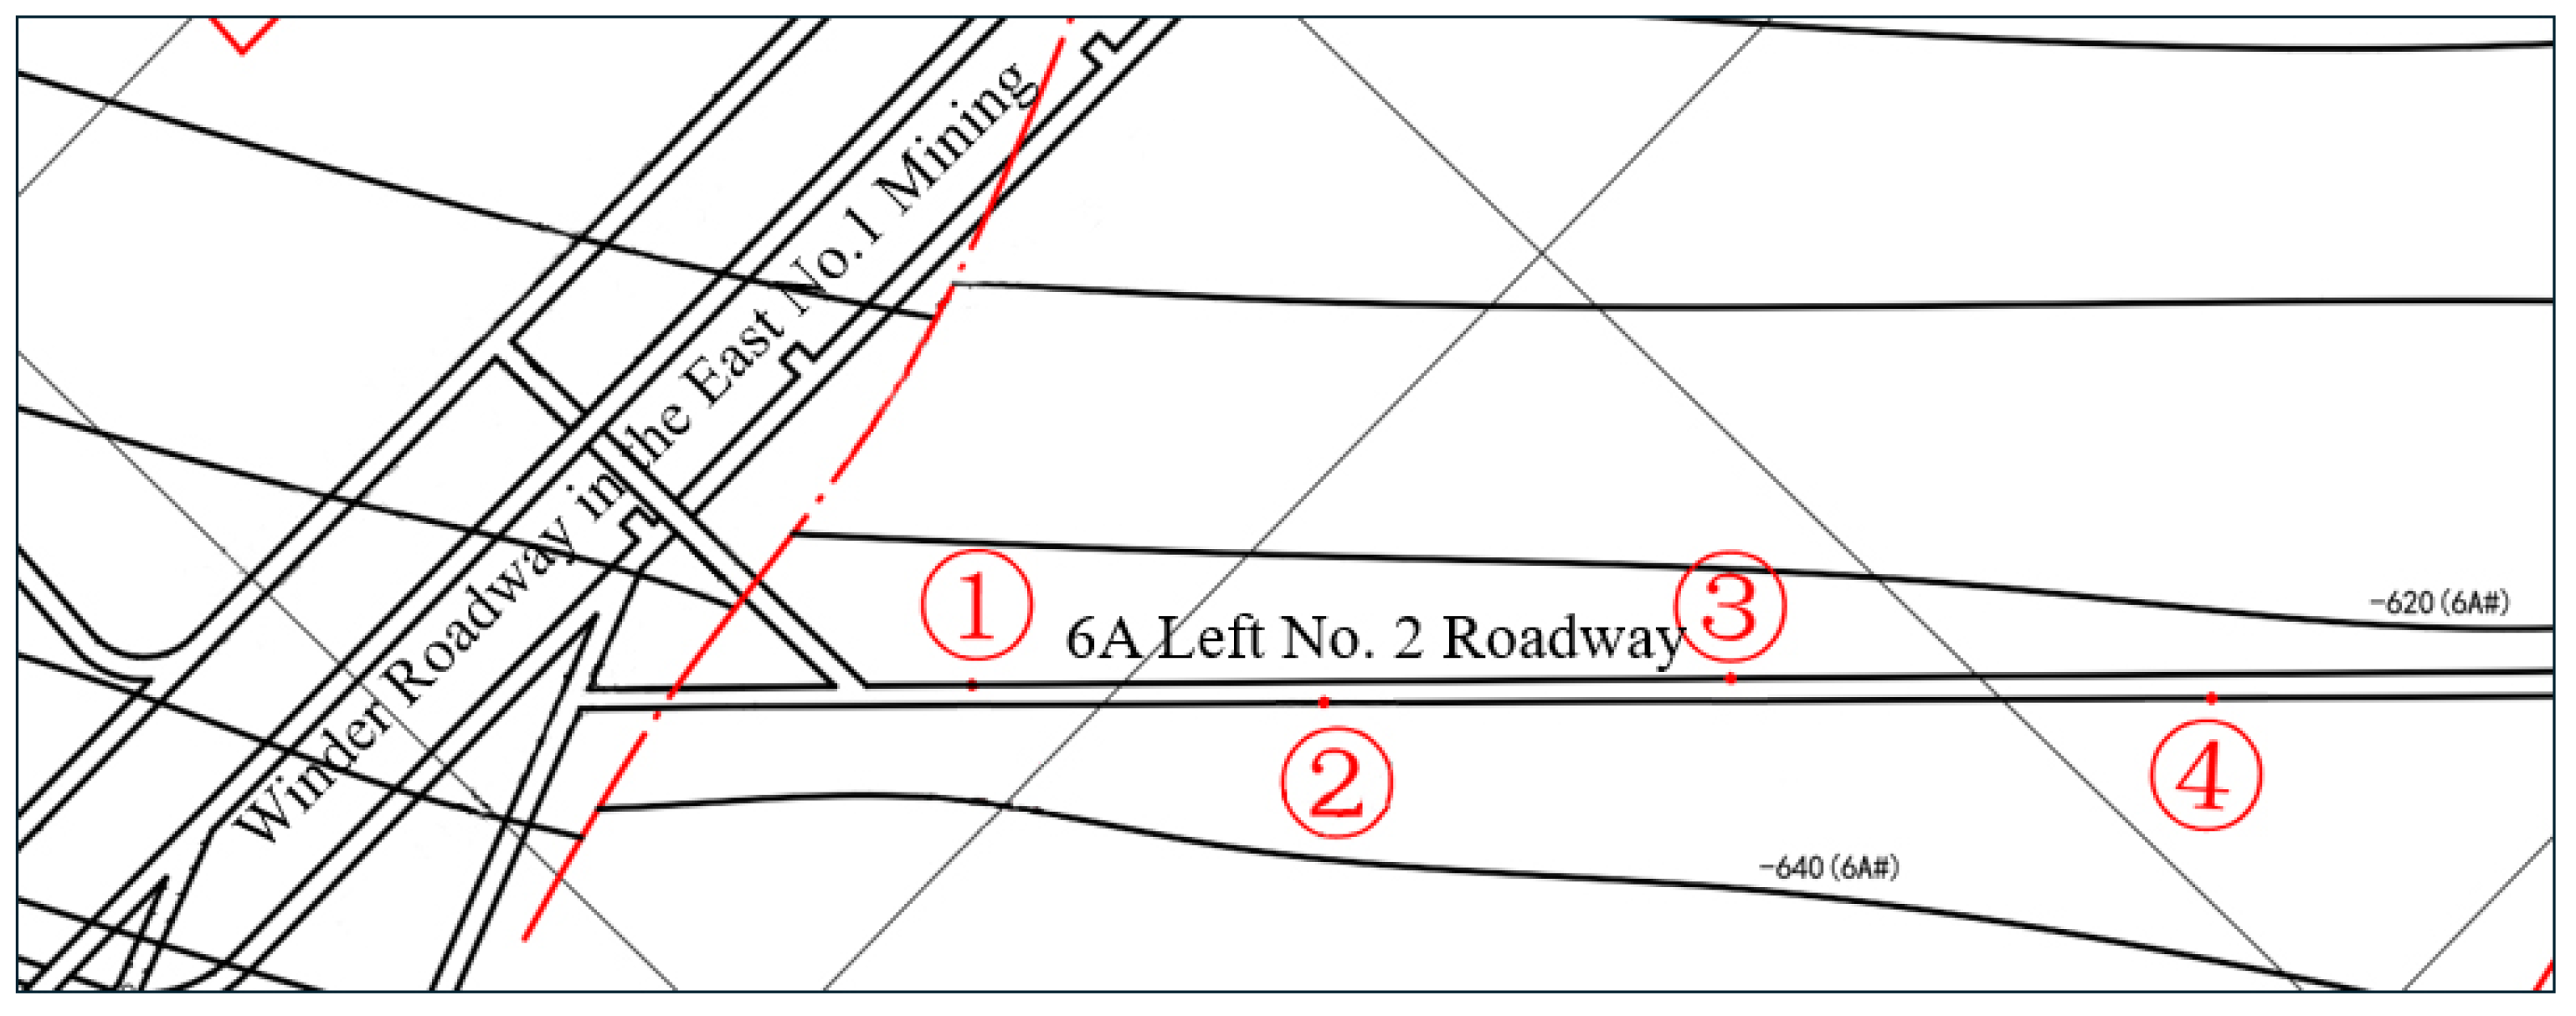
To ensure the safety and effectiveness of the optimization plan and fully meet the stability requirements of the roadway, the optimization support scheme was verified. Several monitoring stations were installed in the 6A# Left 2nd Roadway to record deformation data in real time. Measuring station ① was arranged 30 m away from the transport uphill roadway, with a measuring station every 30 m, and a total of four measuring points ①–④. The specific arrangement is illustrated in
Figure 17.
After six months of monitoring during the engineering application, the monitoring data of surrounding rock surface displacement in Lane 6A# Left 2nd Roadway was collected and plotted as a curve graph. Data analysis reveals that the deformation of Lane 6A# Left 2nd Roadway decreased, and its deformation was effectively controlled. The analysis is as follows:
According to the monitoring curve, after 180 days, the floor heave at Monitoring Station ① is 74 mm, the side convergence is 140 mm, and the roof subsidence is 185 mm; the floor heave at Monitoring Station ② is 82 mm, the side convergence is 102 mm, and the roof subsidence is 179 mm; the floor heave at Monitoring Station ③ is 75 mm, the side convergence is 127 mm, and the roof subsidence is 164 mm; the floor heave at Monitoring Station ④ is 84 mm, the side convergence is 132 mm, and the roof subsidence is 176 mm. The deformation at monitoring stations remains within the normal range, indicating effective control of roadway deformation. The monitoring data are illustrated in
Figure 18.
The monitoring station data indicate that the optimized support scheme successfully controls roadway deformation within a reasonable range. The displacement data from the surrounding rock at all four monitoring points stabilized after approximately 50 days. The average floor heave across the four monitoring stations was 82 mm, the average side convergence was 127 mm, and the average roof subsidence was 176 mm.
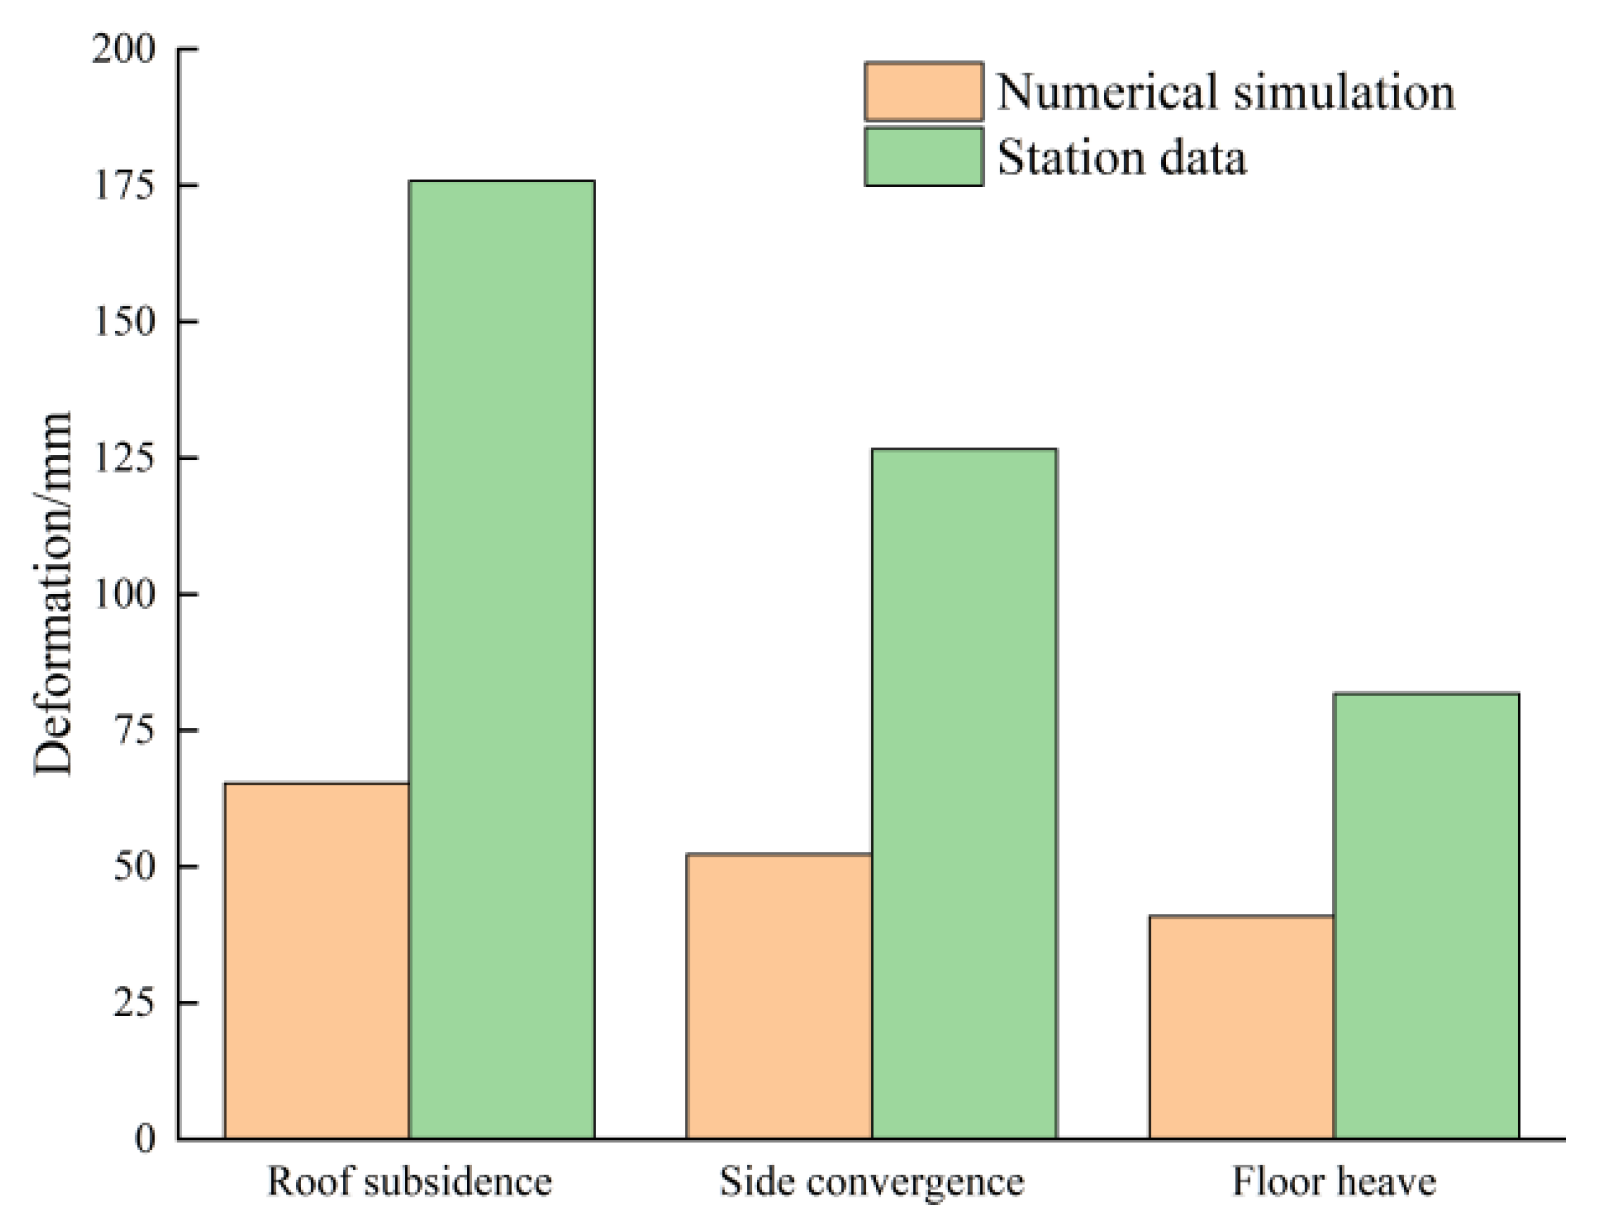
By analyzing the measured data from the four monitoring points, a comparison is drawn between the calculated roadway deformation results from the numerical simulation and the average measured values. The comparison of deformation between numerical simulation and field application is illustrated in
Figure 19. The figure shows that although the optimized scheme does not fully achieve the expected results from the numerical simulation in practical engineering applications, its overall effectiveness exceeds 50%. Since the implementation of the optimized scheme, the deformation of the roadway has been significantly reduced, the stability of the surrounding rock has been notably improved, and the safety and protection efficiency of the roadway have been ensured.
6. Discussion
- (1)
At present, research on the distribution law of in situ stress around the roadway is still insufficient. In situ stress testing relies on large-scale professional equipment, and there are significant difficulties in its deployment and operation at different locations. The detailed distribution of the in situ stress around the roadway cannot be accurately depicted by the in situ stress test at only three points, so the analysis of the distribution characteristics of the in situ stress in the rock mass around the roadway is not accurate enough and can only reveal its general trend. Therefore, when on-site construction conditions and spatial layout permit, it is necessary to conduct more elaborate in situ tests and analyses in specific areas to obtain more detailed and accurate in situ stress data, providing a reliable basis for roadway engineering design and stability analysis.
- (2)
This work explores the influence of high horizontal stress on the deformation and instability of the roadway. Among the numerous factors affecting roadway stability, the impact of other factors on the formation of high horizontal stress is relatively small. Therefore, the horizontal stress angle and the lateral pressure coefficient are taken as the key analysis objects. However, other factors also have a certain influence on roadway stability, and these factors are set as values that can truly reflect the on-site conditions. In subsequent research, emphasis can be placed on incorporating multiple factors into the roadway stability analysis to deeply explore the causes of high horizontal stress.
- (3)
The numerical simulation only analyzed the horizontal stress and vertical displacement, and the distribution law of vertical stress, horizontal displacement and plastic zone were not discussed, which failed to fully reveal the stress and deformation characteristics of roadway. Subsequent studies can further expand the analytical dimension of the numerical simulation and comprehensively consider more mechanical parameters and deformation indexes to obtain a more comprehensive stability assessment of the roadway.
- (4)
The difference between numerical simulation results and field measurements may be due to the complexity of geological structures, the diversity of rock mechanical properties, and the dynamic changes of field conditions. In order to make the simulation results closer to the actual roadway deformation results, subsequent research should be combined with the secondary development of the numerical simulation to improve the accuracy of the numerical simulation and provide a more reliable theoretical basis for support optimization.
7. Conclusions
This work uses FLAC3D numerical simulations, based on the in situ stress distribution law, to investigate the influence of the angle between the directions of maximum horizontal principal stress and the roadway orientation, as well as the lateral pressure coefficient, on the horizontal stress and deformation of the roadway. The study then optimizes the roadway support scheme. The optimized scheme, derived from simulation and analysis, was implemented in the corresponding roadway, and its effectiveness was evaluated by monitoring roof subsidence, floor heave, and side convergence over six months. The conclusions are as follows:
- (1)
By using the hollow body stress relief method, the in situ stress distribution at three measurement points is obtained, showing that σH > σv > σh, with the maximum principal stress being horizontal.
- (2)
The angle between the directions of maximum horizontal principal stress and the roadway orientation and the lateral pressure coefficients are directly proportional to the horizontal stress and deformation of the surrounding rock.
- (3)
The original support scheme is optimized. Simulations indicate that the roadway deformation was significantly reduced: the roof subsidence was reduced by 37.3%, the floor heave was reduced by 49.5%, the side convergence was reduced by 34.7%, and the stability of the surrounding rock was greatly improved.
- (4)
The optimized support scheme was applied to the 6A# Left 2nd Roadway in the Ronghua No. 1 Mine. On-site monitoring shows that the roadway deformation has significantly decreased, and stability has improved.
Author Contributions
Conceptualization, F.X.; validation, S.L.; formal analysis and investigation, B.W., Y.W. and F.X.; data curation, H.L., L.S. and K.X.; writing—original draft preparation, B.W. and H.L.; writing—review and editing, S.L., F.X. and K.X.; supervision, F.X. All authors have read and agreed to the published version of the manuscript.
Funding
This work was supported by the Natural Science Foundation of Heilongjiang Province (ZD2021E006) and the Scientific and Technological Key Project of “Revealing the List and Taking Command” in Heilongjiang Province (2021ZXJ02A03, 2021ZXJ02A04).
Institutional Review Board Statement
Not applicable.
Informed Consent Statement
Not applicable.
Data Availability Statement
The original contributions presented in the study are included in the article, further inquiries can be directed to the corresponding author.
Conflicts of Interest
The authors declare no conflicts of interest.
References
- Lu, Y.; Zou, X.Z.; Liu, C.Y.; Bo, J.B. Road way layout in tectonic stress field. J. Min. Saf. Eng. 2008, 25, 144–149. [Google Scholar]
- Lv, J.G.; Nan, C.Q.; Zhang, Y.; Qiao, Y.G.; Tang, Z. Coal bump mechanism in Yima coalfield mining near thrust fault. J. Min. Saf. Eng. 2018, 35, 567–574. [Google Scholar] [CrossRef]
- Alber, M.; Fritschen, R.; Bischoff, M.; Meier, T. Rock mechanical investigations of seismic events in a deep longwall coal mine. Int. J. Rock Mech. Min. Sci. 2009, 46, 408–420. [Google Scholar] [CrossRef]
- Qin, T.; Duan, B.Y.; Duan, Y.W.; Ni, Y.Z.; Hou, X.G.; Ma, P.Y.; Yang, Y. “Migrate-Transfer-Control” support system of surrounding rock in the deep roadway and its application. Appl. Sci. 2023, 13, 6325. [Google Scholar] [CrossRef]
- Zhu, X.G.; Yang, S.; Xia, H.C.; Xia, Q.Y.; Zhang, G.F.; Li, W. Joint support technology and its engineering application to deep soft rock tunnel with strong creep. Geotech. Geol. Eng. 2020, 38, 3403–3414. [Google Scholar] [CrossRef]
- Mu, Z.L.; Wen, Y.Y.; He, Y.; Yang, X.C.; Zhang, L.M. Analysis and control of stability of the surrounding rock of roadways disturbed by mining-induced tremors. Disaster Adv. 2013, 6, 126–135. [Google Scholar]
- Xie, S.R.; Pan, H.; Zeng, J.C.; Wang, E.; Chen, D.D.; Zhang, T.; Peng, X.J.; Yang, J.H.; Chen, F.; Qiao, S.X. A case study on control technology of surrounding rock of a large section chamber under a 1200-m deep goaf in Xingdong coal mine. Eng. Fail. Anal. 2019, 104, 115–125. [Google Scholar] [CrossRef]
- Wang, S.W.; Ju, W.J.; Pan, J.F.; Lu, C. Mechanism of energy partition evolution of excavation roadway rock burst in coal seam under tectonic stress field. J. China Coal Soc. 2019, 44, 2000–2010. [Google Scholar] [CrossRef]
- Wei, S.J.; Nan, H.; Xu, Y.H. Study on instability mechanism and control technology of mine roadway in continued breaking region. Coal Sci. Technol. 2016, 44, 39–44. [Google Scholar] [CrossRef]
- Sun, X.M.; He, M.C.; Yang, X.J. Research on nonlinear mechanics design method of bolt-net-anchor coupling support for deep soft rock tunnel. Rock Soil Mech. 2006, 27, 1061–1065. [Google Scholar]
- Wang, B.; He, M.C.; Qiao, Y.F. Resistance behavior of constant-resistance-large-deformation bolt considering surrounding rock pressure. Int. J. Rock Mech. Min. Sci. 2021, 137, 104511. [Google Scholar] [CrossRef]
- Xiao, Y.M.; He, M.C.; Qiao, Y.F.; Peng, M.L.; Li, H.R.; Cheng, T. A novel semi-analytical solution to ground reactions of deeply buried tunnels considering the nonlinear behavior of rocks. Comput. Geotech. 2023, 159, 105429. [Google Scholar] [CrossRef]
- Li, X.H.; Yao, Q.L.; Zhang, N. Fracture characteristics of a soft rock roadway: Staged and zoned control. J. China Univ. Min. Technol. 2009, 38, 618–623. [Google Scholar]
- Xiao, F.K.; Liu, G.; Shen, Z.L. Research on effective elastic energy release rate of Taoshan #90 coal seam. Chin. J. Rock Mech. Eng. 2015, 34, 4216–4225. [Google Scholar] [CrossRef]
- Xiao, F.K.; Liu, G.; Zhang, Z.; Shen, Z.L.; Zhang, F.R.; Wang, Y.F. Acoustic emission characteristics and stress release rate of coal samples in different dynamic destruction time. Int. J. Min. Sci. Technol. 2016, 26, 981–988. [Google Scholar] [CrossRef]
- Zhao, Z.F.; Ma, N.J.; Liu, H.T.; Guo, X.F. A buttertly failure theory of rock mass around roadway and its application prospect. J. China Univ. Min. Technol. 2018, 47, 969–978. [Google Scholar] [CrossRef]
- Guo, X.F.; Ma, N.J.; Zhao, X.D.; Zhao, Z.Q.; Li, Y.E. General shapes and criterion for surrounding rock mass plastic zone of round roadway. J. China Coal Soc. 2016, 41, 1871–1877. [Google Scholar] [CrossRef]
- Wang, W.J.; Guo, G.Y.; Zhu, Y.J.; Yu, W.J. Malignant development process of plastic zone and control technology of high stress andsoft rock roadway. J. China Coal Soc. 2015, 40, 2747–2754. [Google Scholar] [CrossRef]
- Zhu, Y.J.; Feng, T. Research on dynamic stability classification of bolt support forsuper-long coal roadway roof. J. China Coal Soc. 2012, 37, 565–570. [Google Scholar] [CrossRef]
- Hou, C.J. Key technologies for surrounding rock control in deep roadway. J. China Univ. Min. Technol. 2017, 46, 970–978. [Google Scholar] [CrossRef]
- Xie, X.P.; Liu, H.Y.; Fang, X.Q.; Yang, J.W.; Liu, J.G.; Liang, M.F.; Wu, G. Deformation Mechanism and Control Technology of Surrounding Rock of Three-Soft Coal Roadways under High Horizontal Stress. Energies 2023, 16, 728. [Google Scholar] [CrossRef]
- Kang, X.C.; Guo, D.M.; Lu, Z.Y. Mechanism of Roadway Floor Heave Controlled by Floor Corner Pile in Deep Roadway under High Horizontal Stress. Adv. Civ. Eng. 2021, 2021, 6669233. [Google Scholar] [CrossRef]
- Chen, D.H.; Yuan, Y.Q.; Ma, L. Deformation and Failure Characteristics and Control Technology of Surrounding Rocks in Deep High-Horizontal Stress Rock Roadways in the Wanbei Mining Area. Front. Earth Sci. 2022, 10, 886221. [Google Scholar] [CrossRef]
Figure 1.
Stratigraphic column.
Figure 1.
Stratigraphic column.
Figure 2.
Support scheme diagram of 6A# Left 2nd Roadway.
Figure 2.
Support scheme diagram of 6A# Left 2nd Roadway.
Figure 3.
Deformation of surrounding rock in the roadway.
Figure 3.
Deformation of surrounding rock in the roadway.
Figure 4.
Layout of initial rock stress monitoring points. (a) Point 1. (b) Point 2. (c) Point 3.
Figure 4.
Layout of initial rock stress monitoring points. (a) Point 1. (b) Point 2. (c) Point 3.
Figure 6.
Horizontal stress in surrounding rock at different roadway angles. (a) 0°. (b) 15°. (c) 30°. (d) 45°. (e) 60°. (f) 75°. (g) 90°.
Figure 6.
Horizontal stress in surrounding rock at different roadway angles. (a) 0°. (b) 15°. (c) 30°. (d) 45°. (e) 60°. (f) 75°. (g) 90°.
Figure 7.
Distribution law of horizontal stress in surrounding rock under different roadway angles.
Figure 7.
Distribution law of horizontal stress in surrounding rock under different roadway angles.
Figure 8.
Surrounding rock deformation under different roadway angles. (a) 0°. (b) 15°. (c) 30°. (d) 45°. (e) 60°. (f) 75°. (g) 90°.
Figure 8.
Surrounding rock deformation under different roadway angles. (a) 0°. (b) 15°. (c) 30°. (d) 45°. (e) 60°. (f) 75°. (g) 90°.
Figure 9.
Surrounding rock deformation curve under different roadway angles.
Figure 9.
Surrounding rock deformation curve under different roadway angles.
Figure 10.
Horizontal stress in surrounding rock under different lateral pressure coefficients. (a) 1.8. (b) 1.9. (c) 2.0. (d) 2.1.
Figure 10.
Horizontal stress in surrounding rock under different lateral pressure coefficients. (a) 1.8. (b) 1.9. (c) 2.0. (d) 2.1.
Figure 11.
Distribution law of horizontal stress in surrounding rock under different lateral pressure coefficients.
Figure 11.
Distribution law of horizontal stress in surrounding rock under different lateral pressure coefficients.
Figure 12.
Surrounding rock deformation under different lateral pressure coefficients. (a) 1.8. (b) 1.9. (c) 2.0. (d) 2.1.
Figure 12.
Surrounding rock deformation under different lateral pressure coefficients. (a) 1.8. (b) 1.9. (c) 2.0. (d) 2.1.
Figure 13.
Surrounding rock deformation curve under different lateral pressure coefficients.
Figure 13.
Surrounding rock deformation curve under different lateral pressure coefficients.
Figure 14.
Included angle between roadway strike and the direction of maximum principal stress.
Figure 14.
Included angle between roadway strike and the direction of maximum principal stress.
Figure 15.
Schematic of the optimized roadway support scheme.
Figure 15.
Schematic of the optimized roadway support scheme.
Figure 16.
Deformation of surrounding rock in roadway under different support schemes. (a) Original support scheme. (b) Optimization scheme.
Figure 16.
Deformation of surrounding rock in roadway under different support schemes. (a) Original support scheme. (b) Optimization scheme.
Figure 17.
Monitoring station location distribution.
Figure 17.
Monitoring station location distribution.
Figure 18.
Data from Monitoring Stations after support optimization. (a) Point ①. (b) Point ②. (c) Point ③. (d) Point ④.
Figure 18.
Data from Monitoring Stations after support optimization. (a) Point ①. (b) Point ②. (c) Point ③. (d) Point ④.
Figure 19.
Comparison of surrounding rock deformation between numerical simulation and field application.
Figure 19.
Comparison of surrounding rock deformation between numerical simulation and field application.
Table 1.
Stress magnitude and direction at monitoring points.
Table 1.
Stress magnitude and direction at monitoring points.
| Stress Component | No. | 1 | 2 | 3 |
|---|
| H/m | 743.6 | 839.3 | 844.2 |
|---|
| Maximum principal stress (σ1) | Magnitude/MPa | 24.1 | 47.0 | 54.1 |
| Dip Direction/° | 265.7 | 106.6 | 95.6 |
| Dip Angle/° | 9.37 | 1.4 | −3.5 |
| Intermediate Principal Stress (σ2) | Magnitude/MPa | 13.8 | 22.4 | 27.8 |
| Dip Direction/° | 15.9 | −17.0 | 1.2 |
| Dip Angle/° | 64.4 | 87.5 | −51.5 |
| Minimum principal stress (σ3) | Magnitude/MPa | 8.8 | 14.9 | 21.2 |
| Dip Direction/° | 171.6 | 196.6 | 188.1 |
| Dip Angle/° | 23.6 | 2.1 | −38.3 |
| Vertical stress (σv) | Magnitude/MPa | 13.3 | 22.4 | 25.3 |
Table 2.
Parameters of each rock layer.
Table 2.
Parameters of each rock layer.
| Lithology | Density kg/m3 | Tensile Strength MPa | Cohesion MPa | Internal Friction Angle ° | Bulk Modulus GPa | Shear Modulus GPa | Thickness m |
|---|
| Siltstone | 2448 | 2.56 | 3.94 | 36.02 | 9.12 | 4.41 | 19 |
| Mudstone | 2183 | 1.47 | 3.17 | 35.84 | 3.67 | 1.92 | 18 |
| Coal Seam | 1443 | 0.85 | 1.89 | 26.65 | 1.98 | 1.02 | 3 |
| Sandy Mudstone | 2297 | 1.63 | 3.25 | 30.71 | 4.72 | 2.27 | 18 |
| Medium-grained Sandstone | 2613 | 2.79 | 4.13 | 33.56 | 8.73 | 4.65 | 22 |
Table 3.
Support scheme.
| Scheme | Anchor Bolt Parameters/mm | Anchor Bolt Row & Line Space/mm | Anchor Cable Parameters/mm | Anchor Cable Row & Line Space/mm |
|---|
| Original scheme | Φ20 × 2000 | 1200 × 1000 | Φ21.6 × 6200 | 1200 × 1000 |
| Optimized scheme | Φ20 × 2000 | 800 × 1000 | Φ21.6 × 103,000 | 1000 × 1000 |
| Disclaimer/Publisher’s Note: The statements, opinions and data contained in all publications are solely those of the individual author(s) and contributor(s) and not of MDPI and/or the editor(s). MDPI and/or the editor(s) disclaim responsibility for any injury to people or property resulting from any ideas, methods, instructions or products referred to in the content. |
© 2025 by the authors. Licensee MDPI, Basel, Switzerland. This article is an open access article distributed under the terms and conditions of the Creative Commons Attribution (CC BY) license (https://creativecommons.org/licenses/by/4.0/).


 ,
, 


