1. Introduction
In recent years, global warming has increased the frequency of tropical cyclones, including typhoons and extreme storm surges, in China’s coastal regions. Extreme weather conditions during tropical cyclones can disrupt offshore wind power output and trigger transmission line failures, threatening the safety and reliability of the power grid. Unlike other extreme weather events, tropical cyclones follow distinct spatiotemporal paths. As a tropical cyclone passes, the impact on grid equipment evolves over time, creating complex spatiotemporal patterns of grid anomalies that complicate risk assessment. Therefore, a quantitative risk assessment method is urgently needed that accounts for the spatiotemporal evolution of grid anomalies, which forms the basis for disaster emergency planning and strengthens resilience.
The primary cause of power grid operational risk is large-scale or significant disturbances. As distributed energy resources are increasingly integrated into modern power grids, operational risks have shifted from traditional overloads due to single equipment failures to multidimensional anomalies caused by complex, large-scale distributed energy disturbances. Random fluctuations in distributed flexible resources like electric vehicles [
1], photovoltaics [
2,
3], and wind power [
4,
5] can, via the amplification effect of large-scale disturbances, push the grid’s operation beyond safe stability limits. Besides the clustering effect of large-scale distributed resources on operational indicators, major disturbances can also introduce operational risks to the grid [
6]. Extreme weather events, given their frequency and destructiveness, have garnered widespread attention in power grid risk assessment in recent years [
7,
8,
9,
10].
Risk assessment of power grids under extreme weather conditions generally involves two key steps: (1) scenario set construction; and (2) risk index calculation. The first step integrates extreme weather forecasts, analyzes the abnormal characteristics of power grid equipment, and generates hypothetical scenarios describing various equipment states. The second step involves calculating risk indices such as power flow deviation, voltage deviation, and load loss under these scenarios to quantify and assess grid risk. Extreme weather factors can cause physical damage through mechanical actions, leading to equipment failures. Extreme weather factors can also cause abnormal output variations in weather-sensitive renewable energy, such as ramping in wind power. Consequently, researchers have extensively studied equipment-level mechanisms of abnormal impacts and their quantitative characterization. In studying transmission line anomalies, [
11] proposed a method for assessing risk levels by constructing a hierarchical analysis model linking meteorological factors such as lightning, icing, and strong winds to risk levels. In [
12], the authors analyzed how thermal stress from lightning contributes to line aging and breakage. In studying renewable energy anomalies, [
13] analyzed atmospheric circulation patterns that lead to ramping of wind power, demonstrating that thermally driven land–sea wind interactions may be the primary cause. In the context of tropical cyclones, [
14] quantifies the dynamic impact of extreme wind speeds on wind turbines through the analysis of offshore wind turbine results under extreme load conditions. In addition, [
15] establishes a model for calculating the instantaneous failure rate of transmission lines and towers based on a tropical cyclone wind field model. After constructing such a multi-factor interaction mechanism model, subsequent fault propagation can be simulated through a cascading model.
Modeling cascading failures in power systems is crucial for assessing grid vulnerability and developing prevention and control strategies. The traditional OPA(ORNL-PSERC-Alaska) model simulates the evolution of cascading failures based on quasi-steady-state assumptions. However, it neglects the impact of system transient dynamics on the fault sequence, making it difficult to capture chain reactions triggered by equipment transients and protection actions at short time scales [
16]. On the other hand, the cascading failure model based on DC power flow (DF-CFS) is widely applied in large-scale grid analysis due to its computational efficiency. However, it overlooks crucial factors such as voltage stability and angle dynamics [
17].
By integrating extreme weather factors with methods for quantifying abnormal equipment states, we can establish both equipment anomalies and hypothetical scenarios for the power grid. Combining the risk index values from power flow analysis under specific scenarios with accident probabilities allows for quantifying the overall operational risk of the system [
18]. A specific type of hypothetical scenario is the fault chain, where an initial disturbance leads to multiple interrelated cascading equipment failures [
19]. Reference [
20] examined the impact of extreme high temperatures on load and transmission line capacity, and developed an fault chain model that accounts for fault sequences. Fault chains have a broad impact and are highly destructive. Consequently, researchers are focusing on strategies to suppress the propagation of these chains or mitigate their risks during system planning and operation [
21].
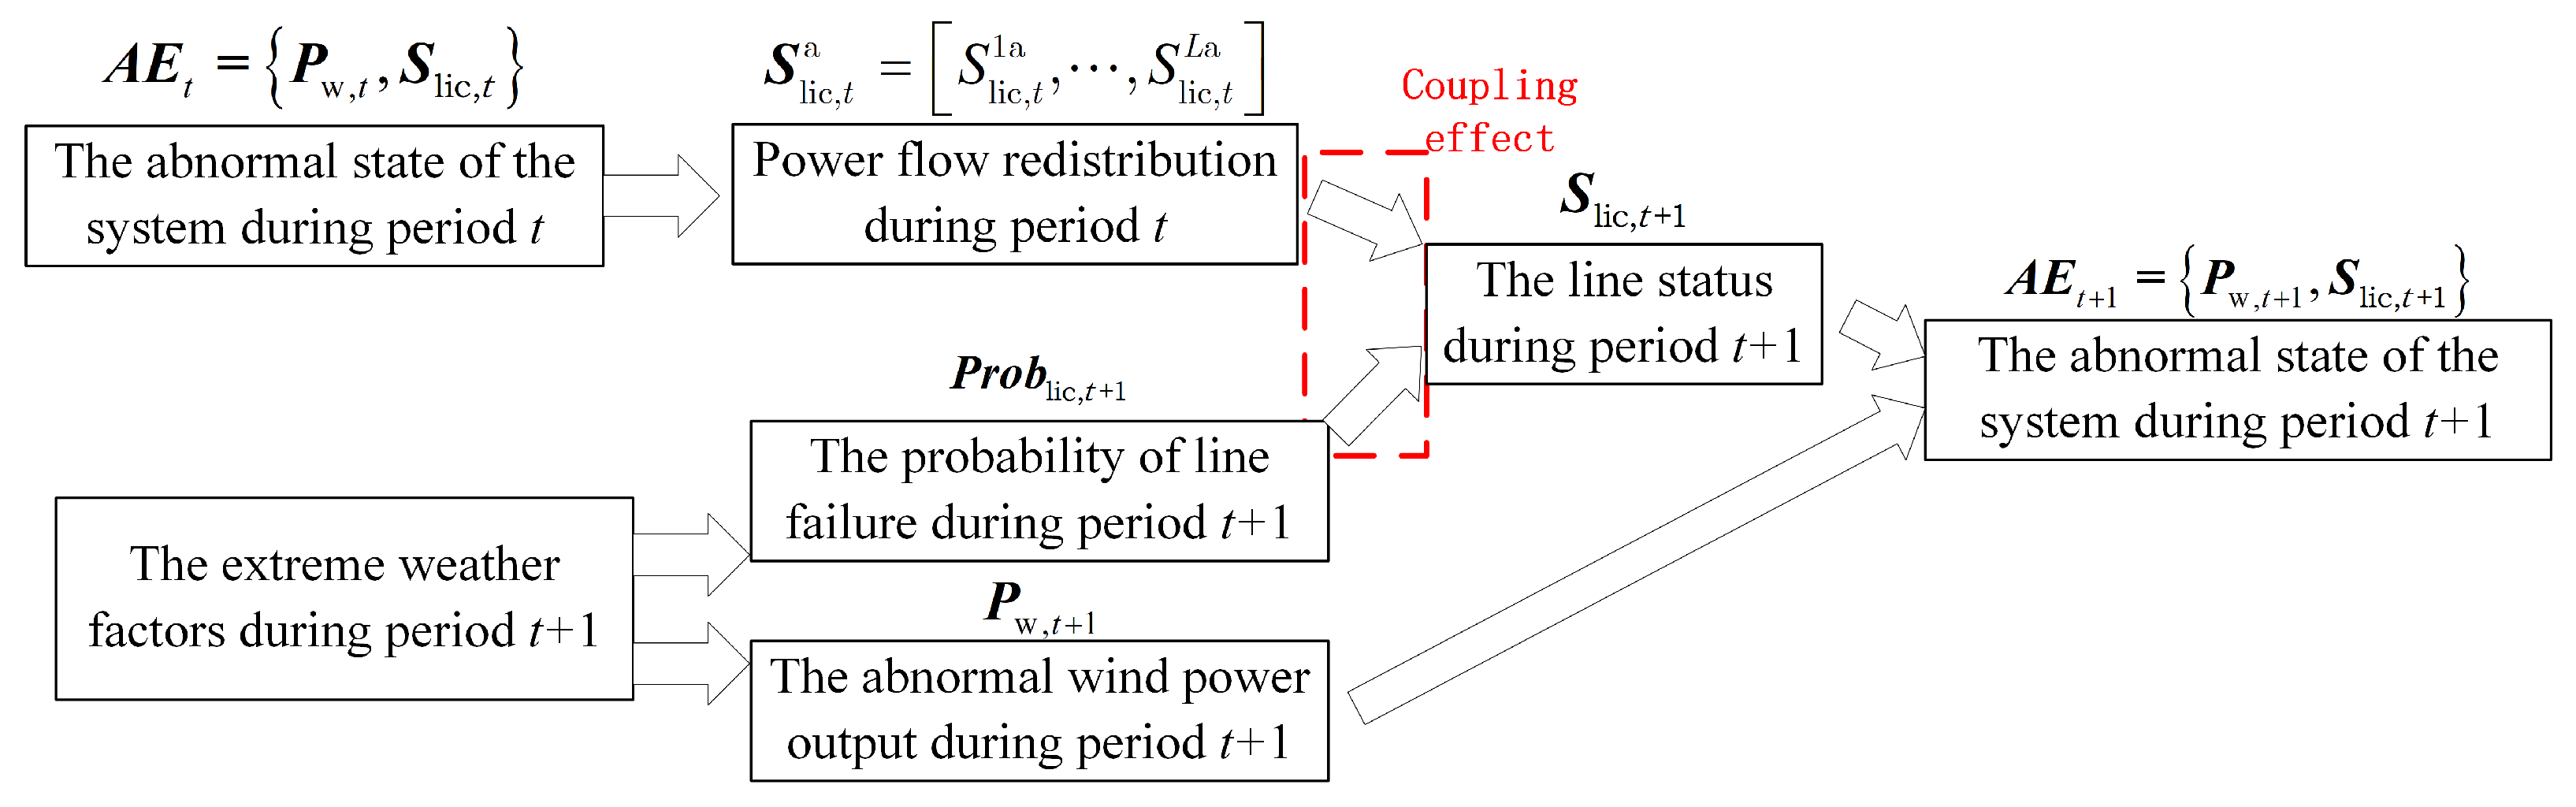
As tropical cyclones pass, the extreme meteorological factors affecting power grid equipment and the equipment’s abnormal states evolve continuously. Traditional fault chains, which previously considered only overloads and power flow risk factors, have evolved to account for the coupling of time-varying extreme weather conditions and power flow risks [
22]. To address this, we propose a risk assessment method that incorporates the spatiotemporal evolution of grid anomalies during tropical cyclones. First, the impact mechanisms of tropical cyclones on grid equipment, including transmission lines and wind power, are analyzed to identify the time-varying abnormal states of grid equipment during cyclone events. Second, the evolution patterns of system anomalies under the coupling and interaction of time-varying extreme weather factors and power flow risks are examined. Third, alternating simulations of equipment failures induced by extreme weather and power flow redistributions are conducted based on the coupling mechanism, leading to the development of methods for constructing fault chains and scenario sets during tropical cyclones. Finally, the overall system risk assessment results are presented, incorporating uncertainties in extreme weather factors and grid parameters associated with tropical cyclones.
The main contributions of the paper include the following:
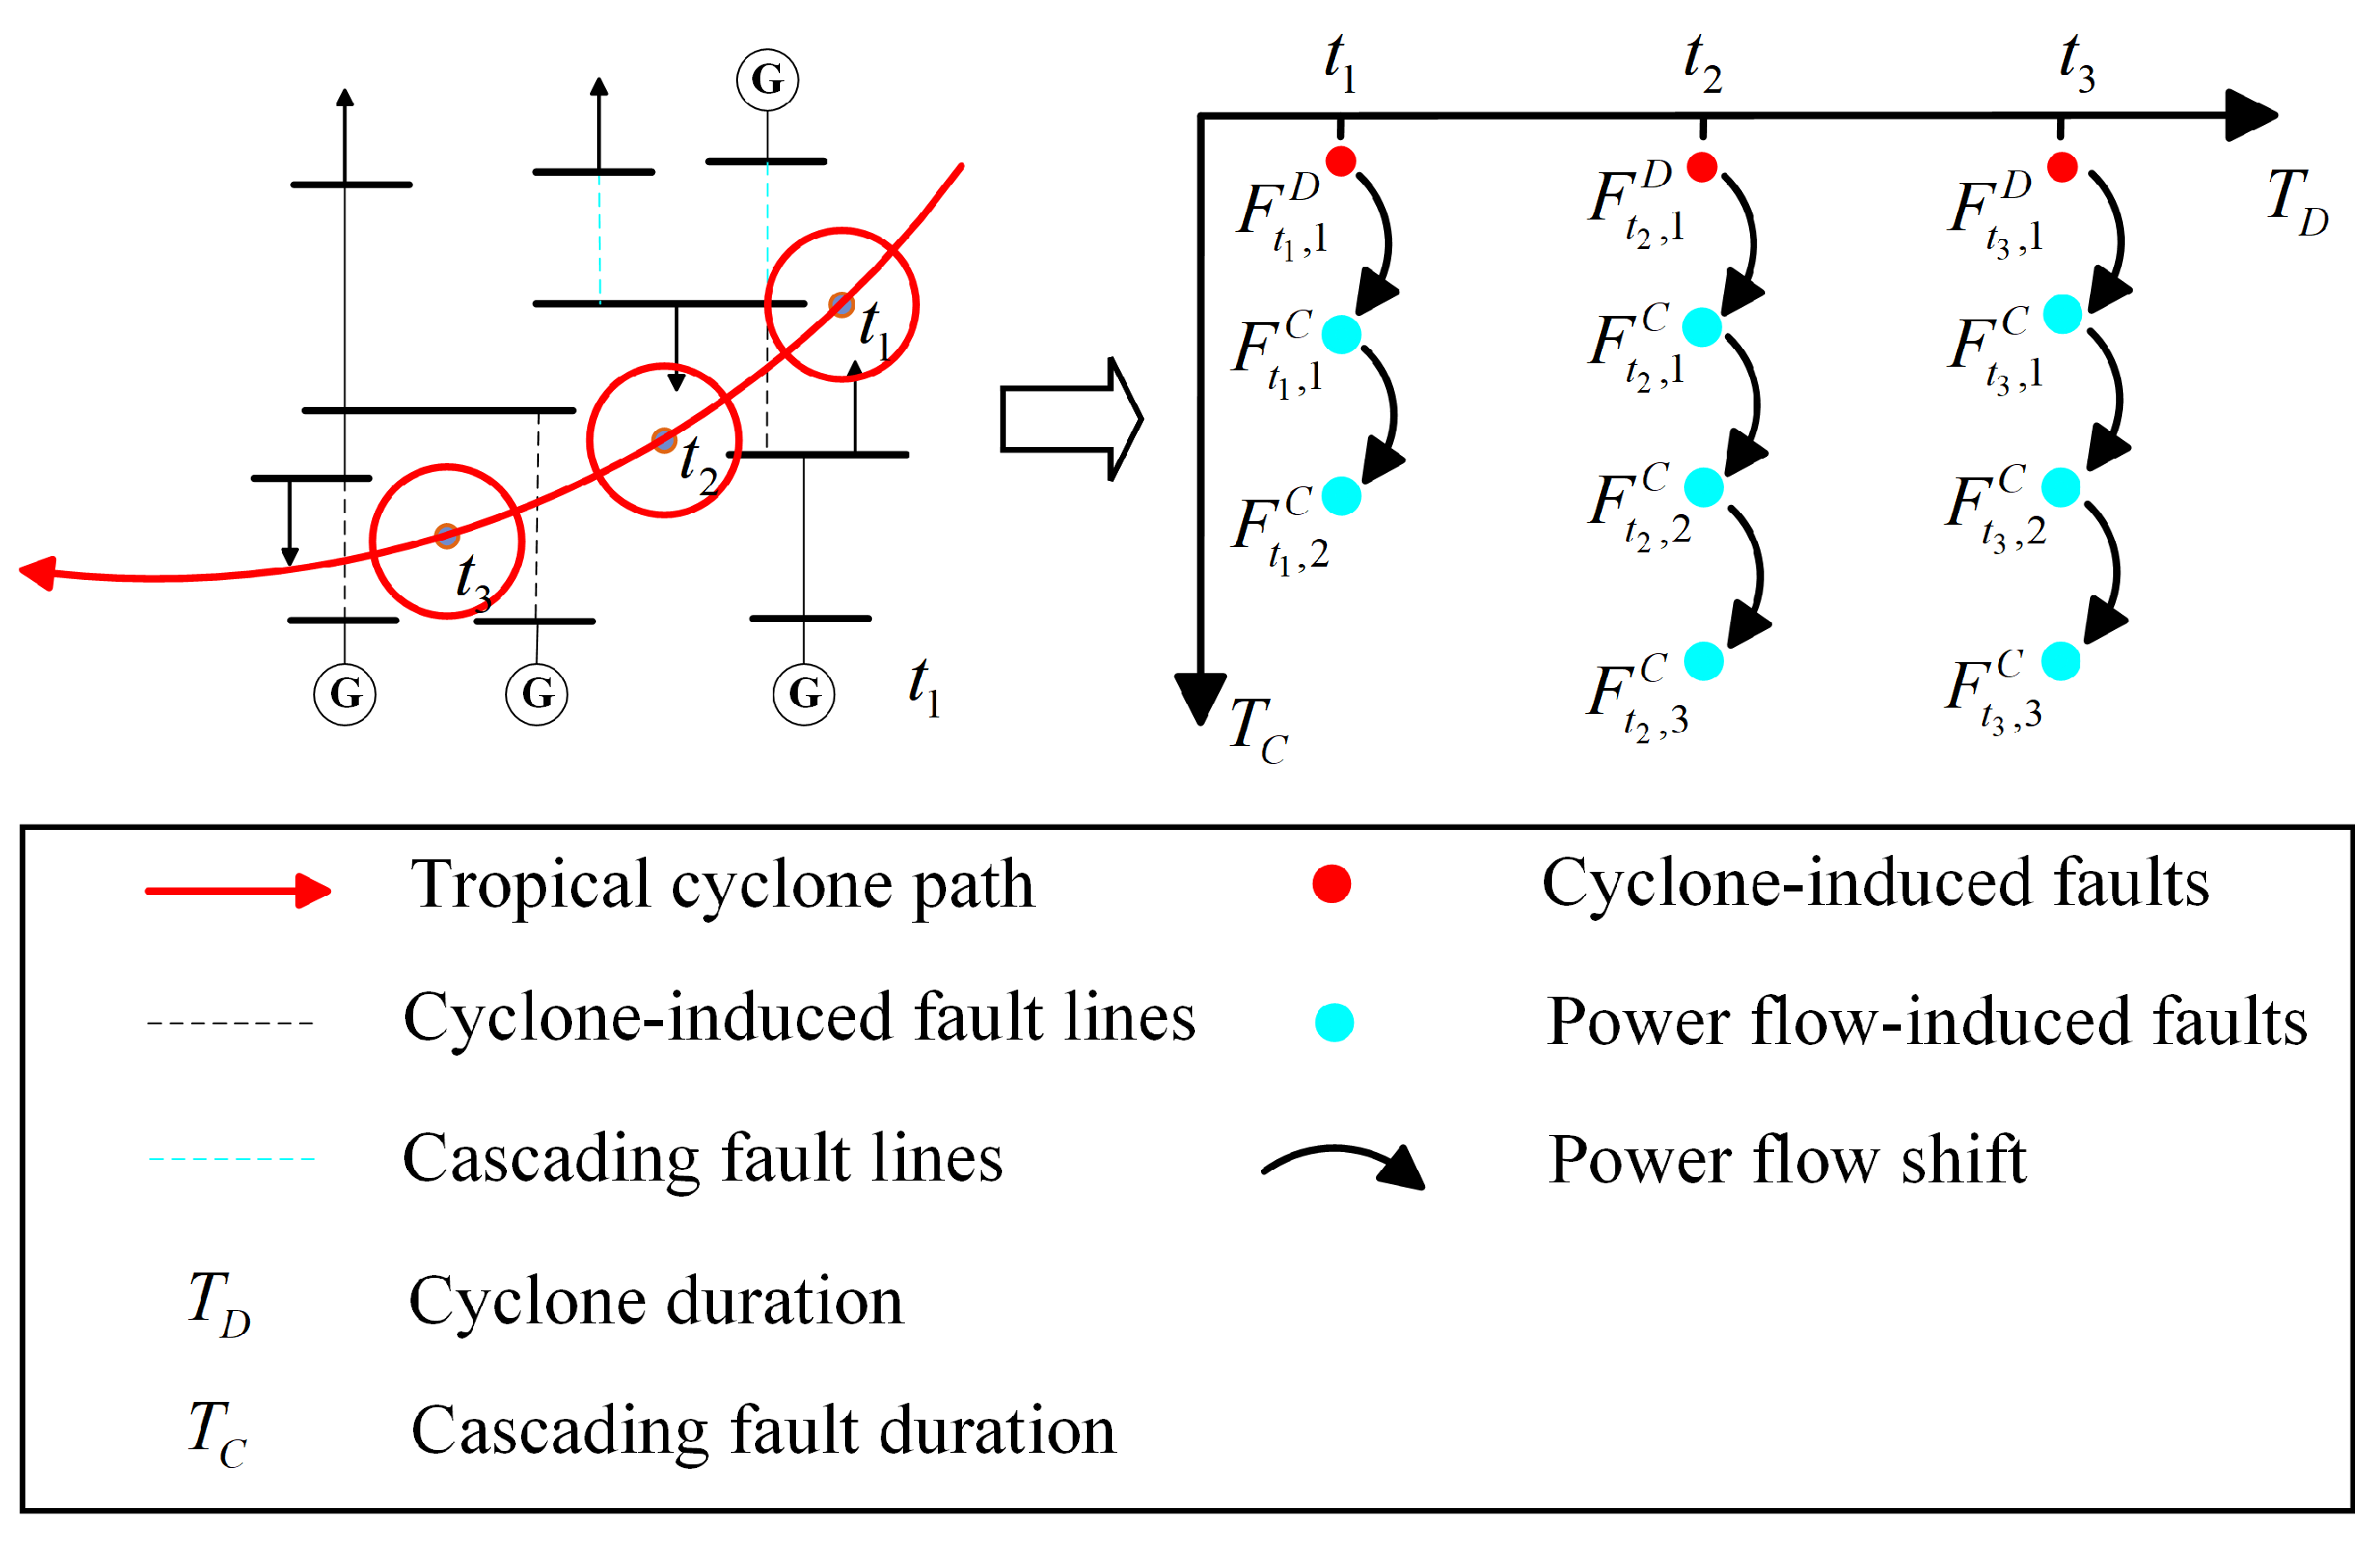
Incorporating the spatiotemporal trajectory of typhoons, this study examined the time-varying abnormal states of source-grid equipment under typhoon impacts, revealing the spatiotemporal characteristics of grid faults. Based on these characteristics, the study further analyzed the spatiotemporal evolution mechanism of grid anomalies caused by the coupling of extreme weather factors and power flow, identifying the propagation paths of grid anomalies.
This study utilizes a risk assessment method that considers the spatiotemporal evolution of grid anomalies. This method captures the time-varying states of grid components under extreme weather and power flow interactions. It models cascading failures, constructs fault chains, and calculates risk indicators, providing accurate risk quantification and guidance for disaster prevention.
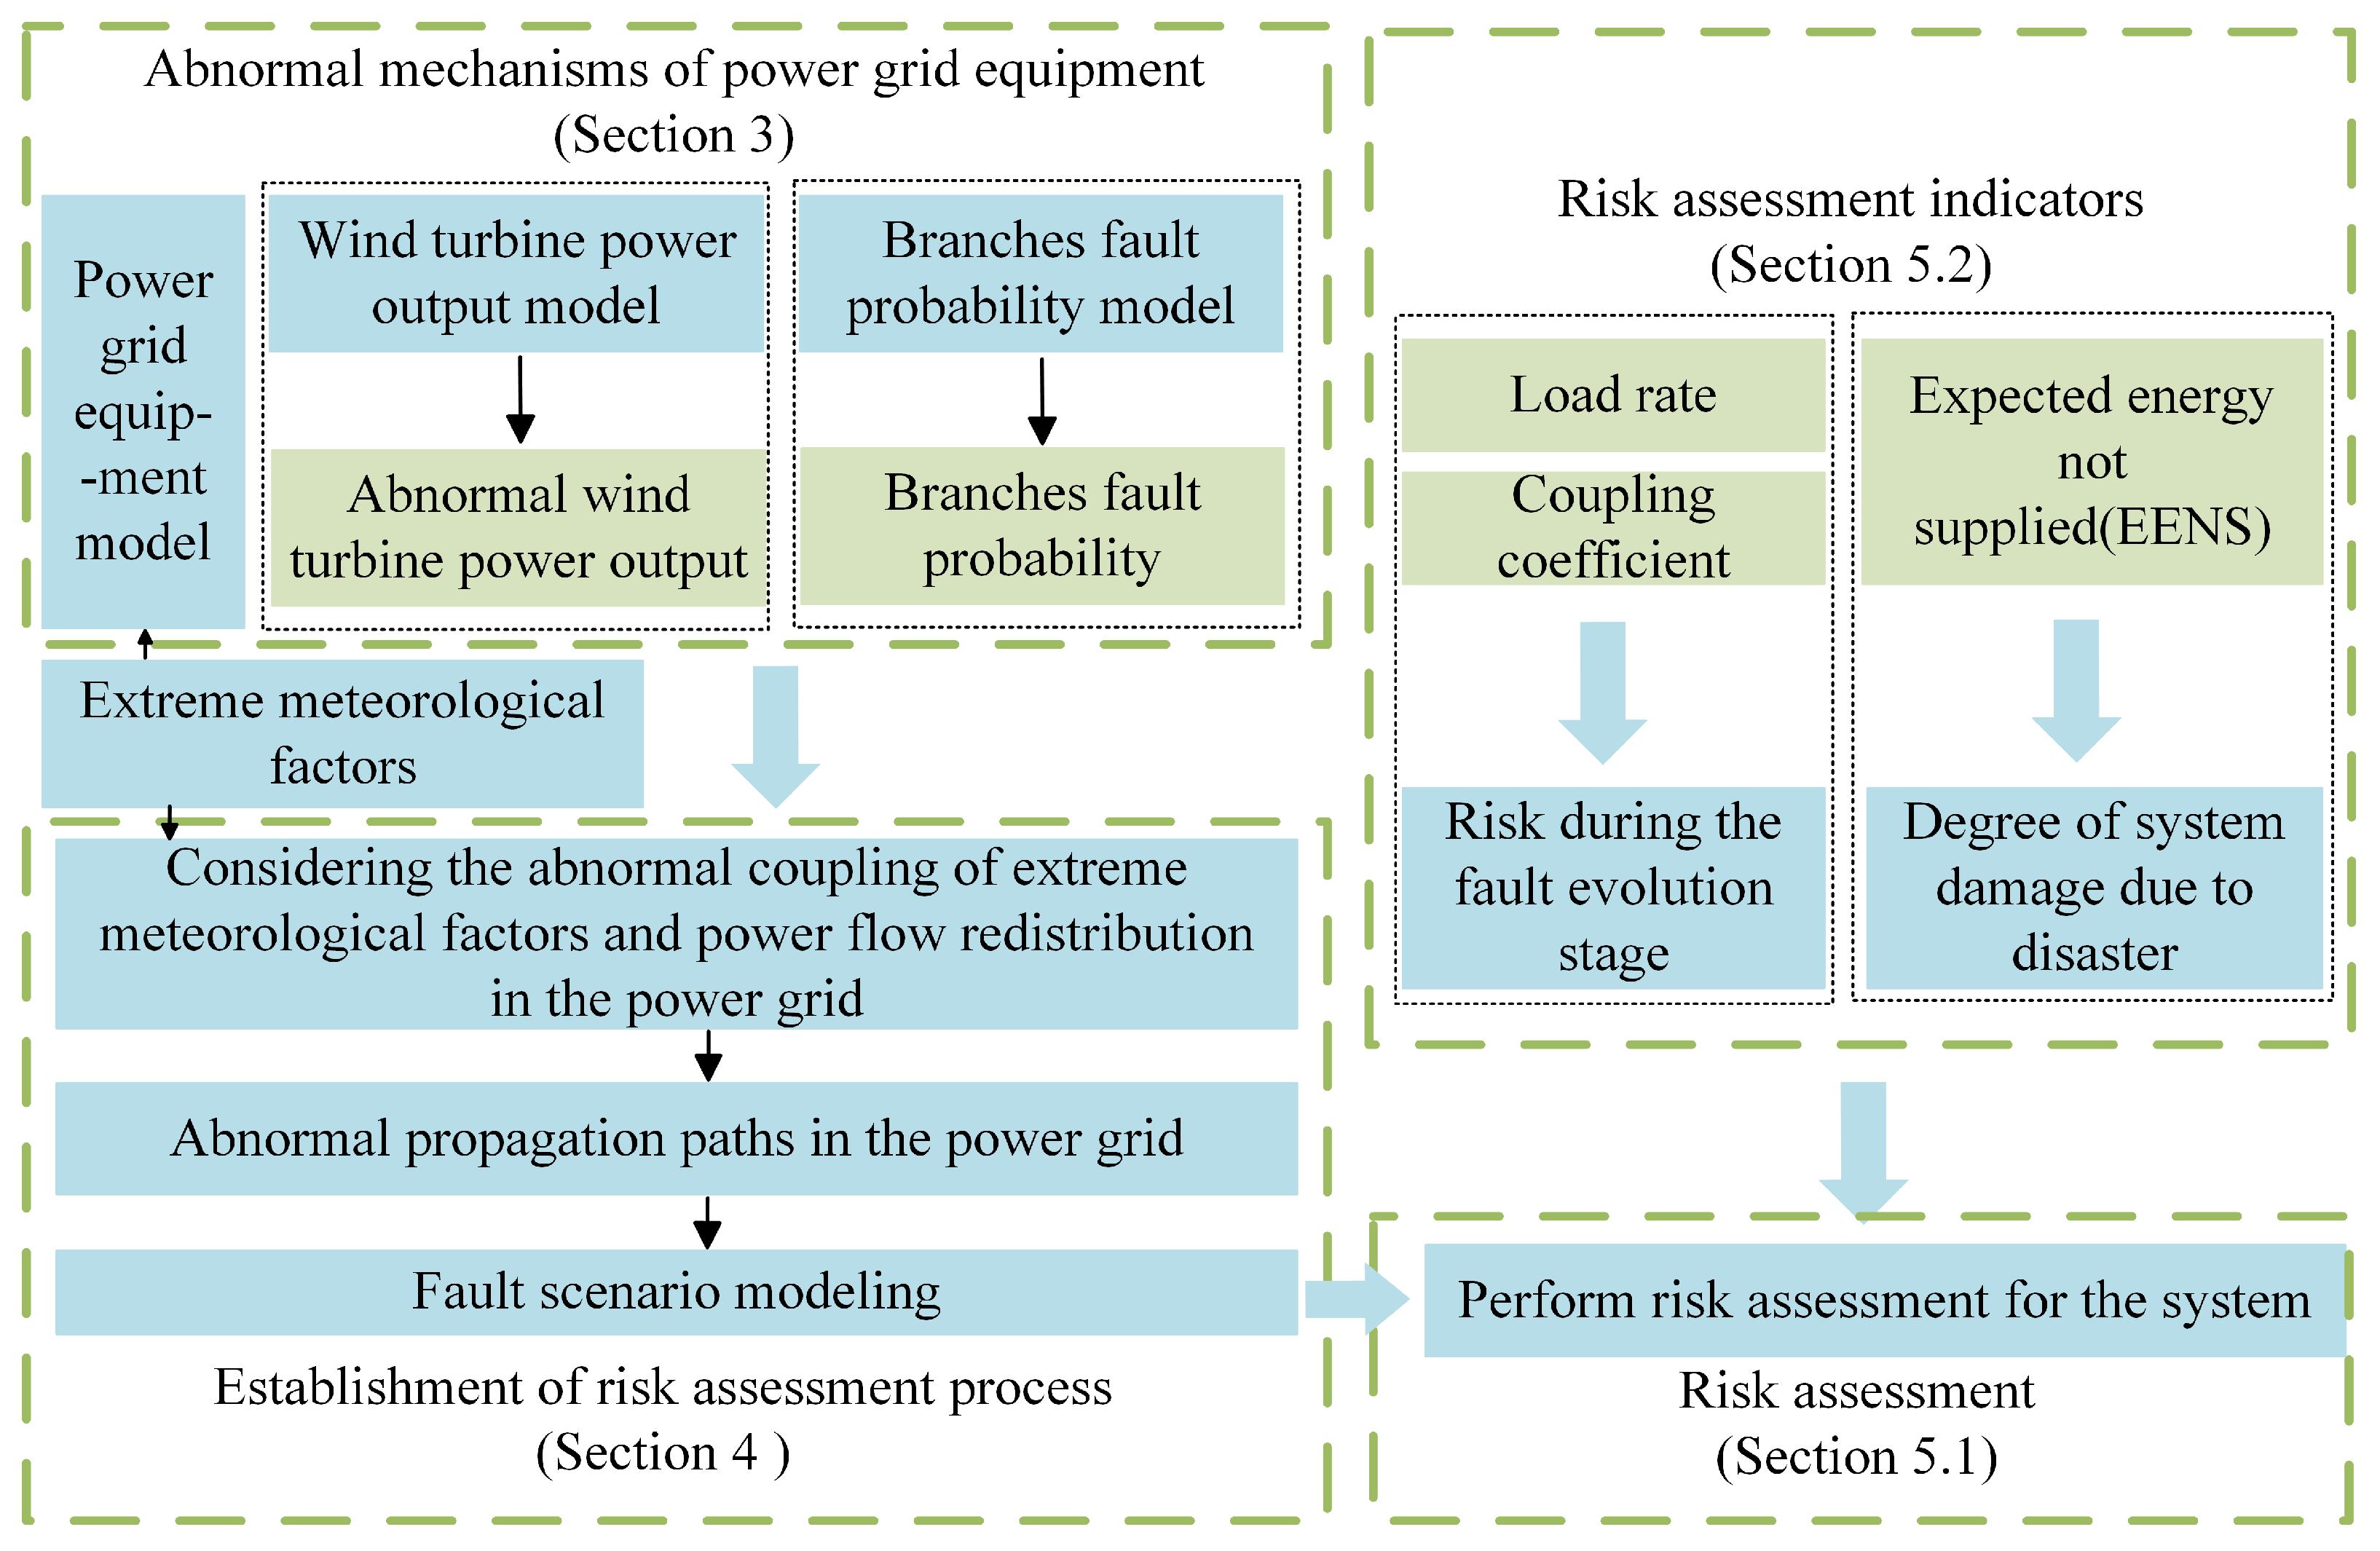
2. Risk Assessment Research Framework Considering the Spatiotemporal Evolution of Power Grid Anomalies Under Tropical Cyclones
The core goal of this study is to deeply analyze the fault evolution process of the power grid system under the influence of extreme weather such as typhoons by combining extreme meteorological factors with the dynamic changes in power grid flow. First, the physical model of source-grid equipment under extreme meteorological factors of tropical cyclones is developed, integrating the spatiotemporal trajectory information of tropical cyclones, and analyzing the failure probabilities of lines in the system and the output characteristics of wind farms under tropical cyclones. Then, the coupling mechanism between meteorological information and power flow in the grid is analyzed to determine the abnormal propagation path of the grid under tropical cyclones, providing the theoretical foundation for subsequent risk assessment.
To quantify the risk during the system failure evolution process and the degree of system damage under tropical cyclones, a risk indicator system is established based on specific failure scenarios, reflecting the grid operation risk during the occurrence of tropical cyclones from two perspectives: the grid failure evolution stage and the post-disaster system status.
Figure 1 illustrates the methodological framework of this paper.
5. Risk Assessment Considering the Coupling Effects Between Meteorological Factors and Power Flow
The analysis in
Section 3 and
Section 4 indicates that during the tropical cyclone passage, the power grid experiences abnormal propagation paths due to the interaction of meteorological factors and power flow. According to the law of large numbers, increasing the number of samples improves the accuracy with which the frequency of branch states
reflects probability
, thereby enhancing the risk assessment accuracy. In addition to being influenced by the number of branch state samples, as shown in Equations (
26)–(
32), different load curves
produce varying time series
of supply-demand imbalances, leading to distinct abnormal propagation paths through redispatching, power flow redistribution, and islanding. Assuming
M load curves need to be assessed, with each requiring
N branch state samples, a total of
simulations are necessary. To ensure accurate branch fault probability estimation,
N cannot be reduced; thus, to improve computational efficiency,
M must be reduced to decrease the number of simulations.
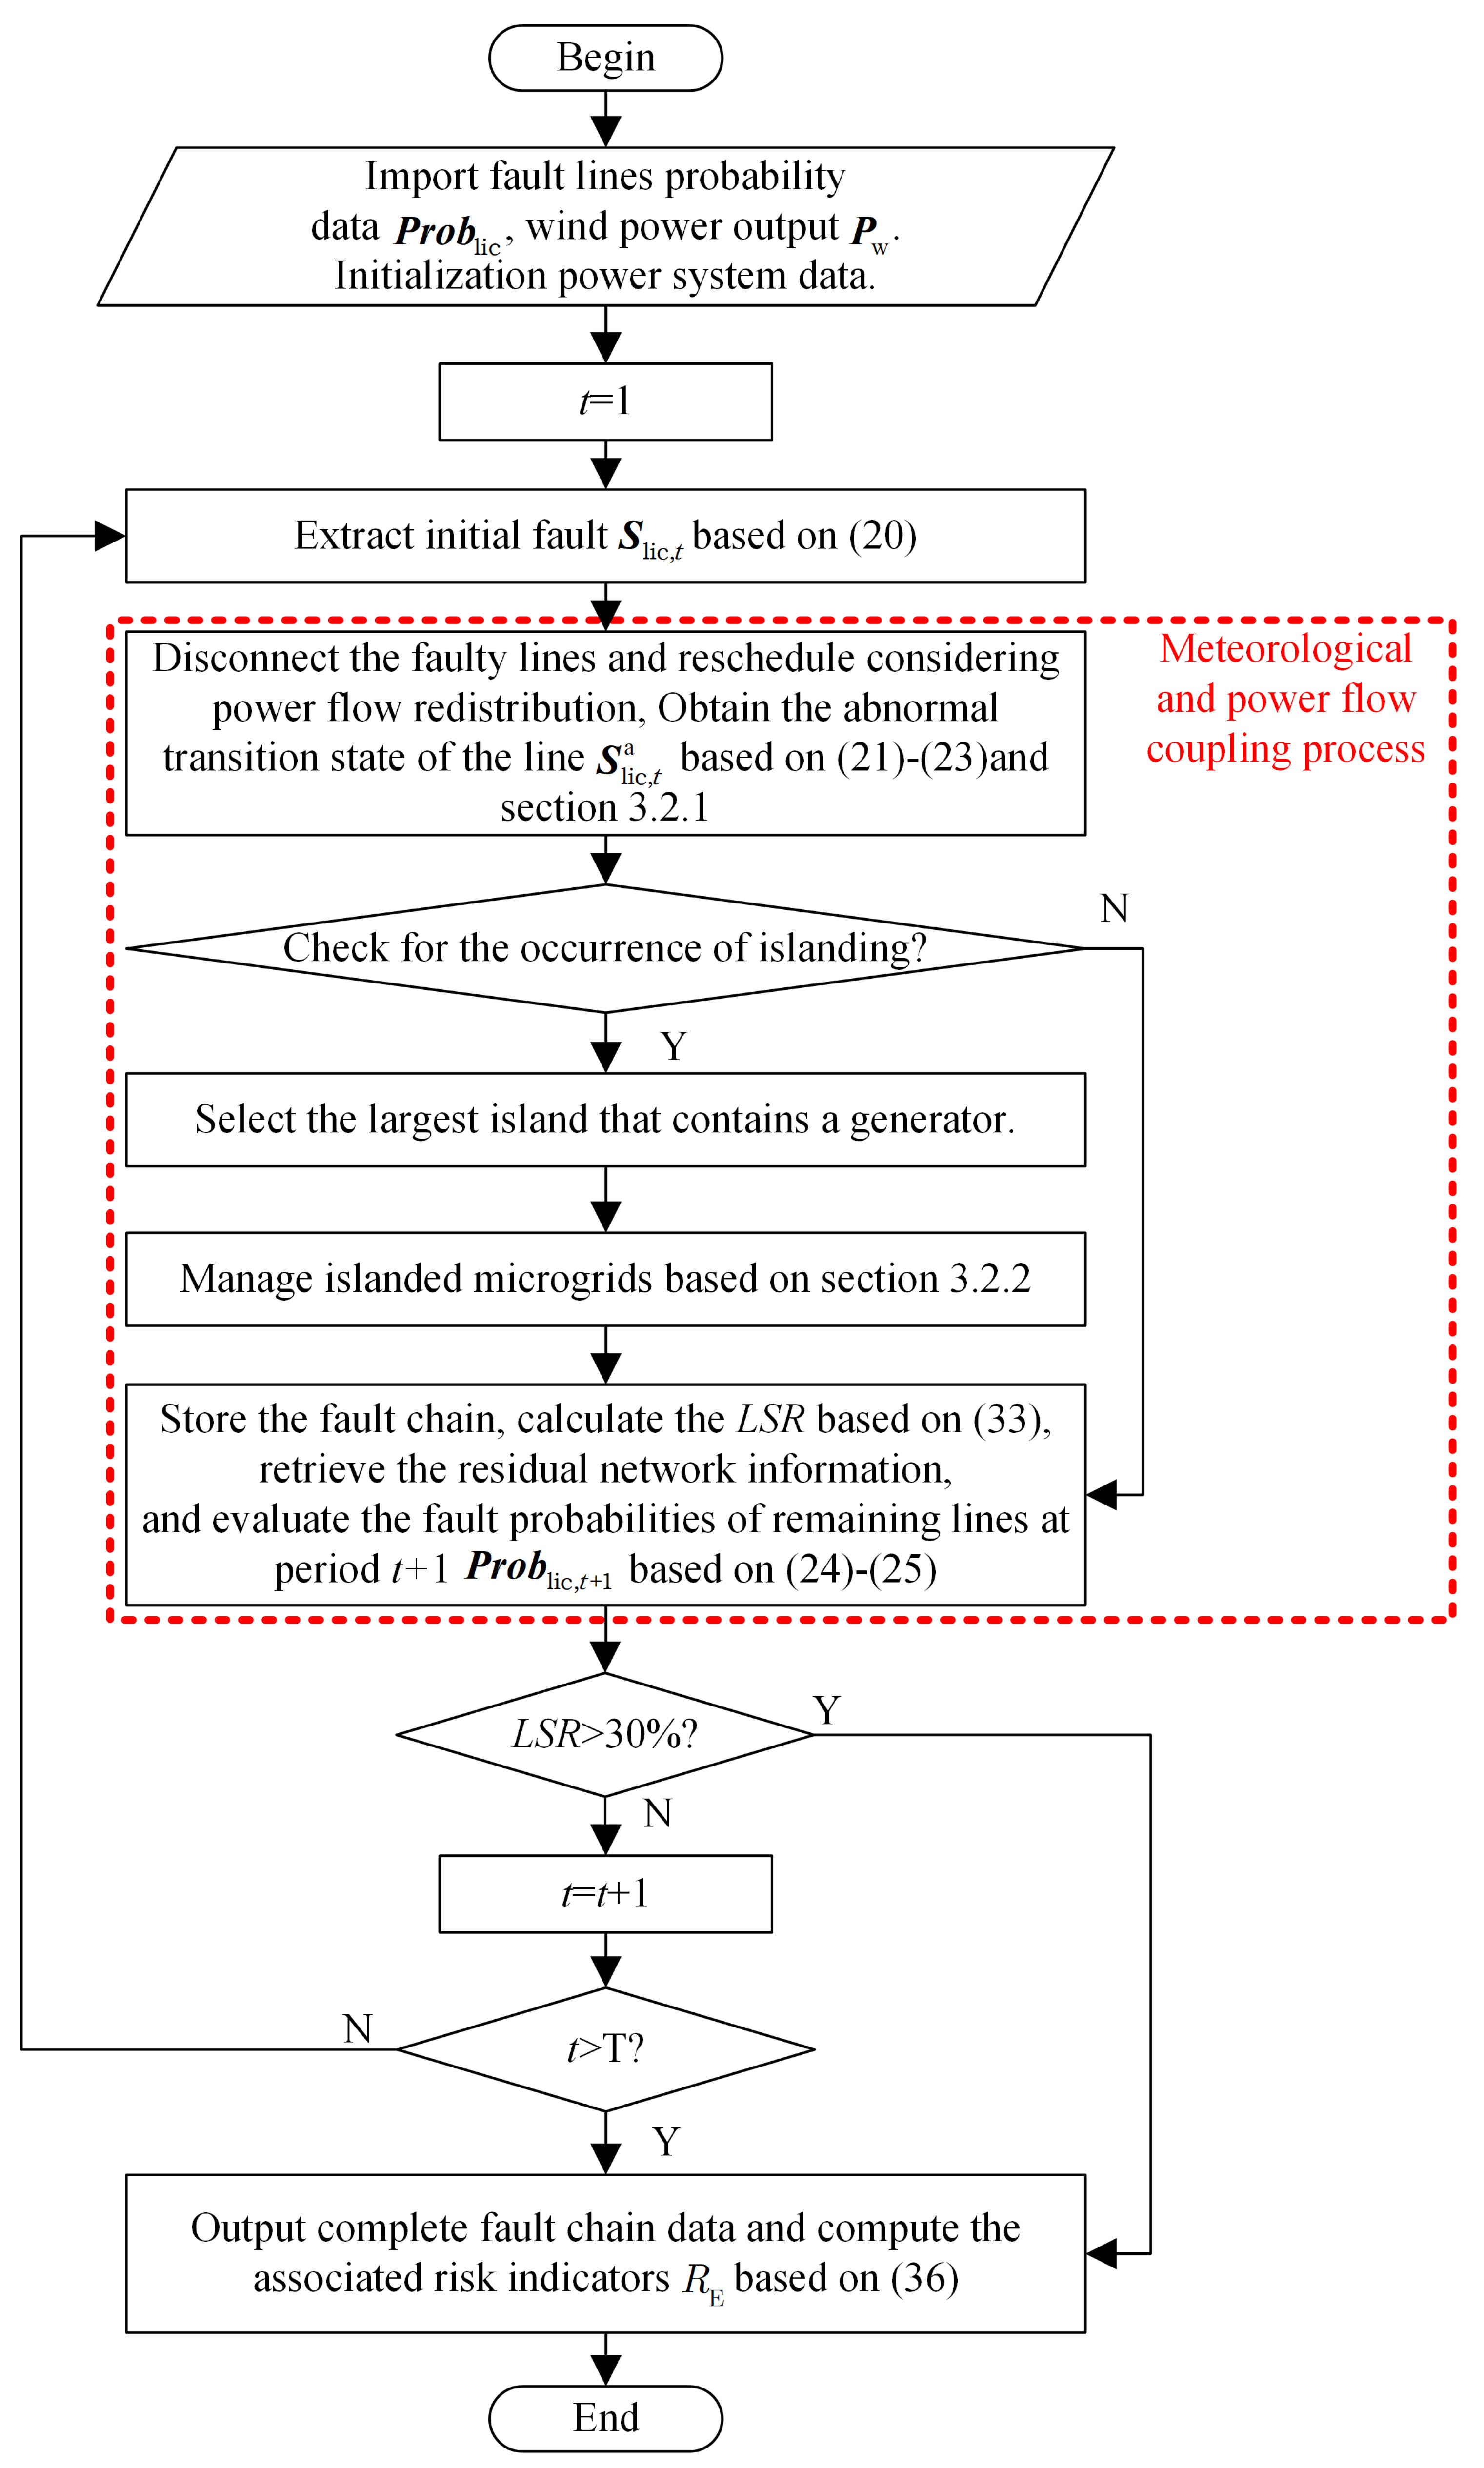
5.1. Cascading Failure Simulation
To evaluate the impact of abnormal propagation on the power grid, the load shedding rate (LSR) is chosen as a key metric in cascade fault simulations. During the simulation of cascade fault development, this metric is used to model the cutoff. It is specifically defined as the ratio of total load loss to the initial grid load.
In this equation, D and represent the sets of buses with loads in the original network and the islanded network after decoupling, respectively. and denote the remaining loads in each respective network.
Based on the above, the evolution process of the abnormal propagation path is illustrated in
Figure 4:
5.2. Risk Assessment Indicators
The objective of quantitative risk assessment is to establish metrics that represent system risk. Various metrics can be utilized for risk analysis, including overload, voltage, and branch indicators. Branch risk indicators reflect the overload characteristics of a branch caused by power flow redistribution following a disconnection, which may result in overloads on other branches. Thus, this paper employs load rate and coupling coefficient as key metrics for risk assessment. Since the economic performance of power companies is closely linked to user power losses, this paper adopts the expected energy not supplied (EENS) [
28] calculation as an additional risk metric.
(1) Load Rate
Let
be the ratio of the active power of branch
i at time periods
t and
t − 1 to its maximum allowable active power, reflecting the load level of branch
i under stable operating conditions.
In the equation, and represent the power flows of branch i during the cascading failure at time periods t and t − 1, respectively, while denotes the maximum allowable power flow of branch i.
(2) Coupling Coefficient
Due to the cumulative effect of successive branch disconnections on the remaining branches,
is defined as the ratio of the active power variation in branch
i during stages
t − 1,
t, and
t + 1 to the original active power of branch
i. Physically, the greater the power flow fluctuation caused by the disconnection of the previous branch, the larger the coupling coefficient becomes.
In this equation, , , and represent the active power on branch i during stages t − 1, t, and t + 1 of the cascading failure, respectively.
(3) Expected Energy Not Supplied(EENS)
The expected value of reduced power supply to users due to forced unit outages indicates the severity of the fault. Therefore, EENS is used as an indicator to assess and quantify the impact of typhoons within specific fault chains.
In the equation, denotes the expected value of insufficient power in the system; denotes the probability of the system state; denotes the load reduction caused by fault state s; T denotes the evaluation time frame (typically in hours); and F denotes the set of system states.
6. Case Study Analysis
To validate the risk assessment method for spatiotemporal evolution of grid anomalies under the impact of tropical cyclones proposed in this paper, the improved IEEE 14 system is used for testing. Additionally, the feasibility of this method in large-scale power grids and under extreme disaster conditions is further validated using the enhanced IEEE 118 system.
6.1. Simulation Setup
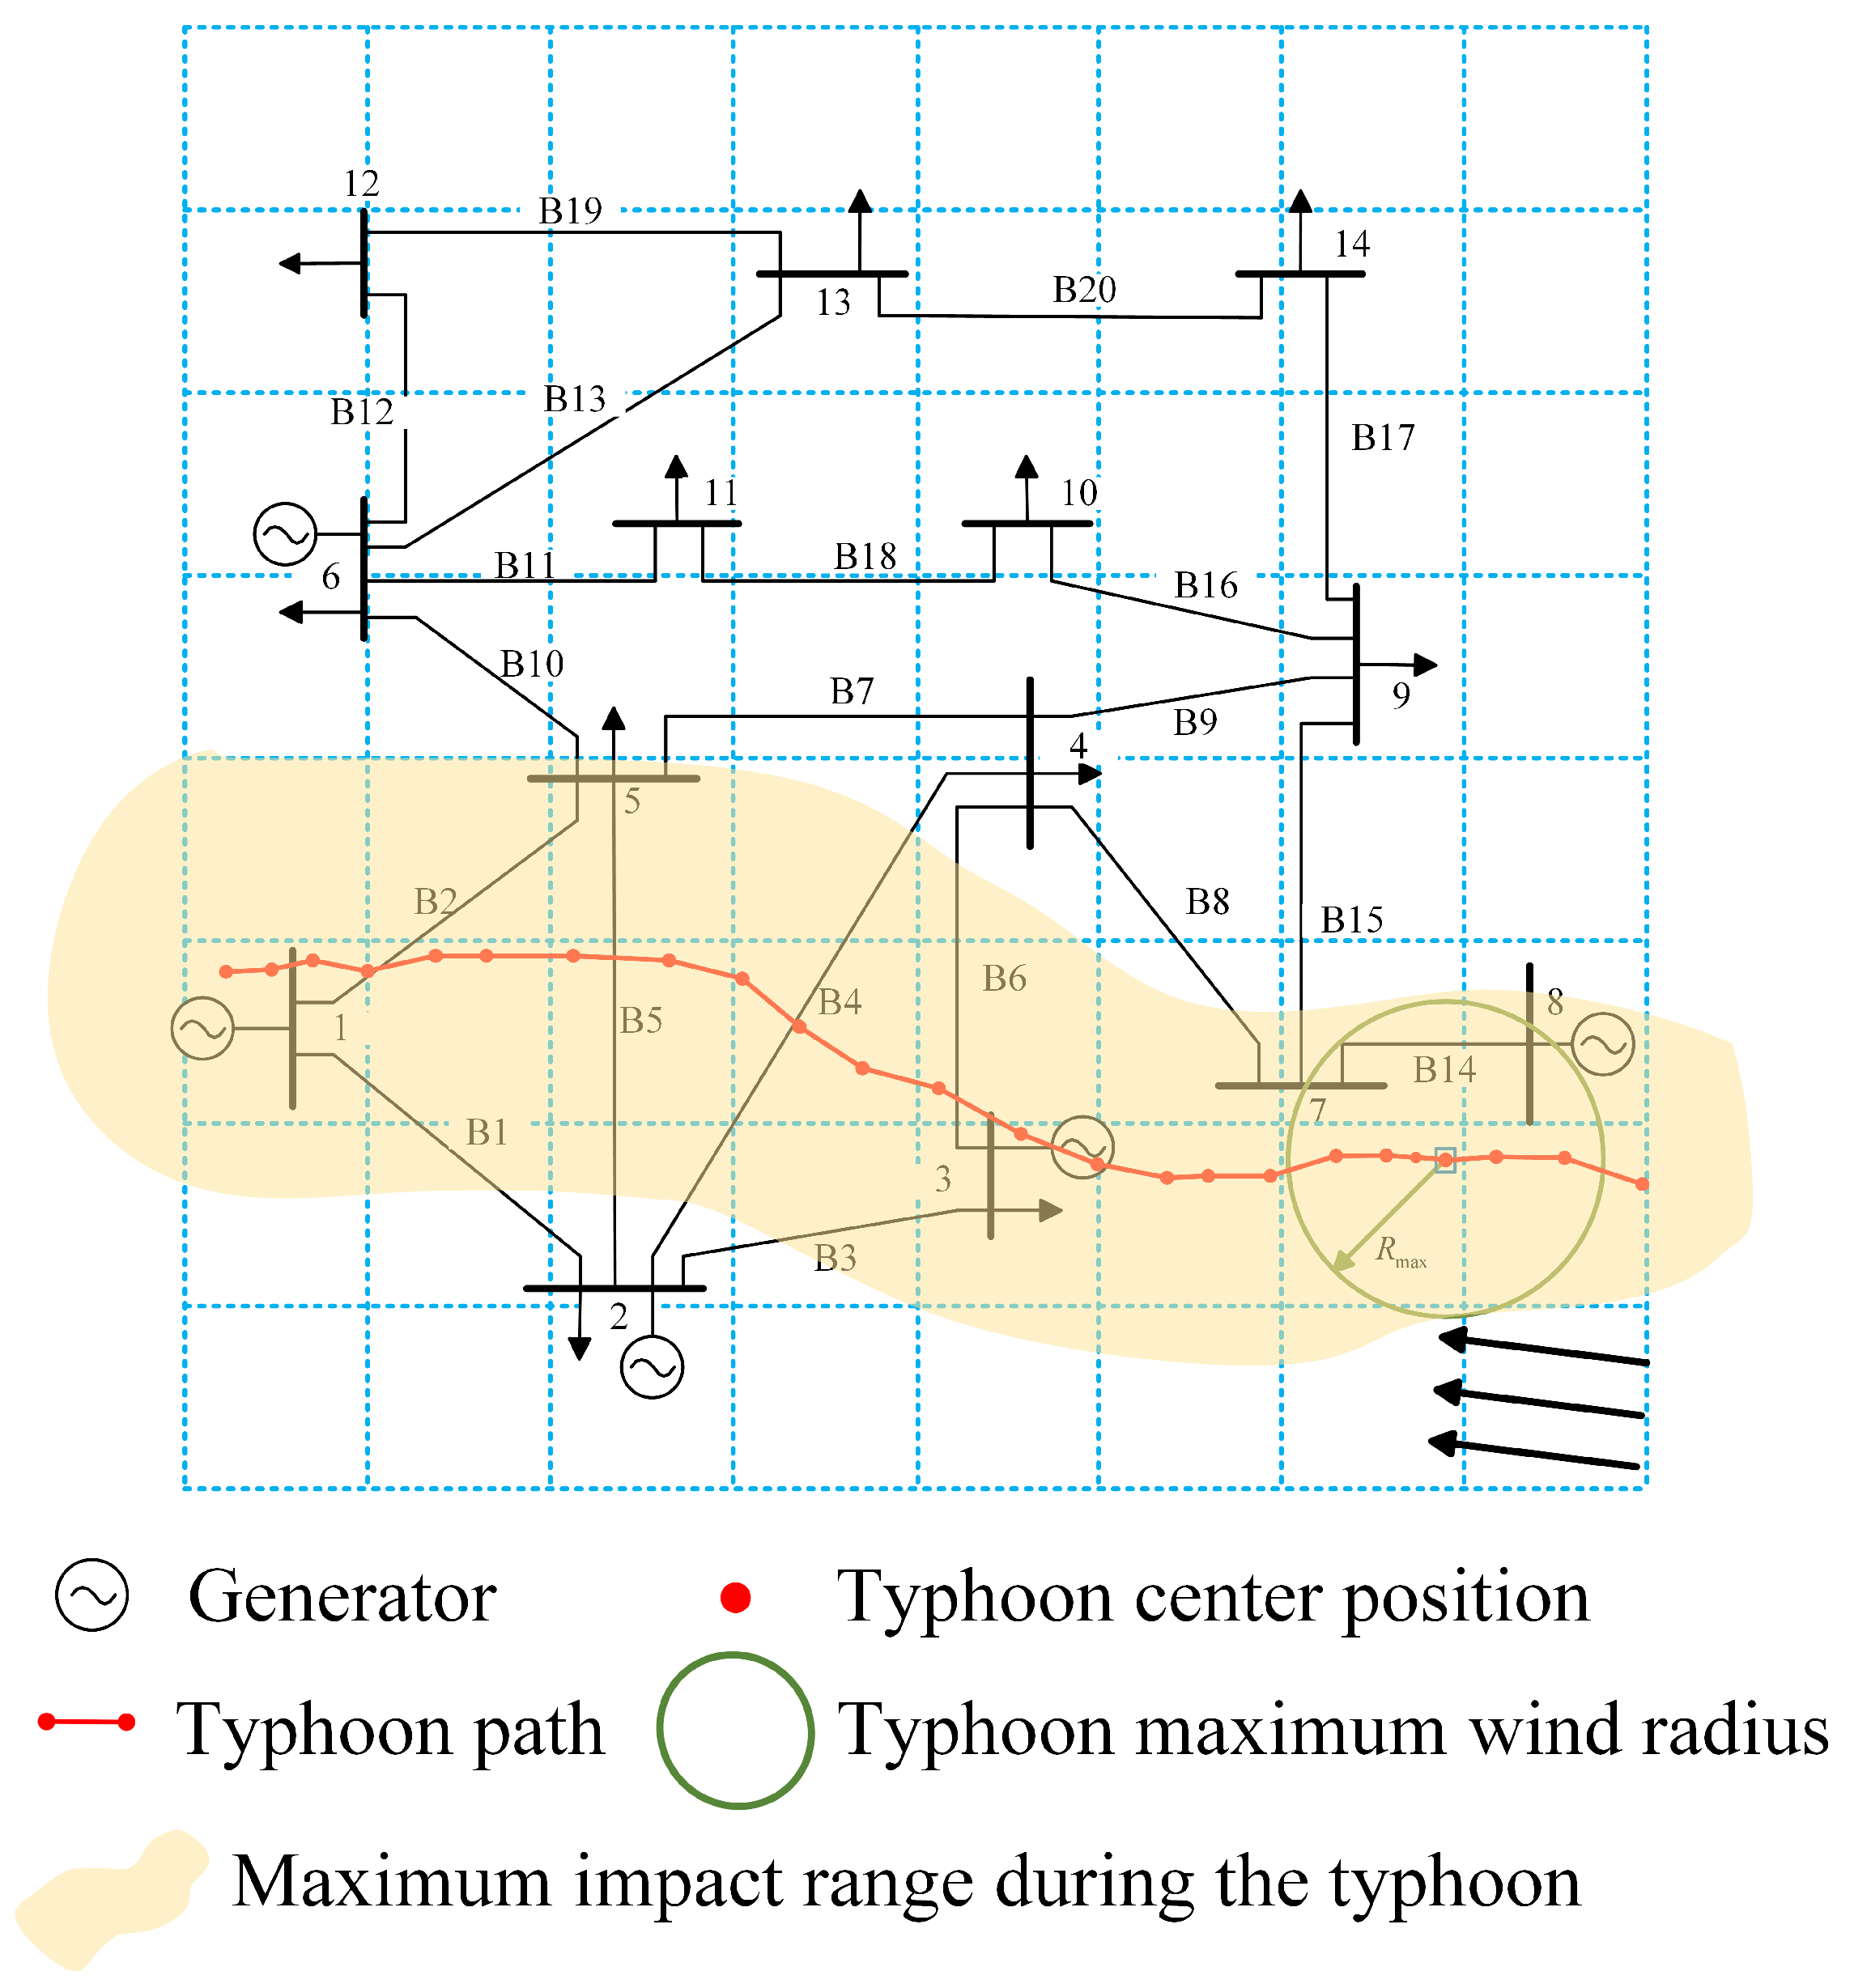
In this case study, the tropical cyclone event is validated by simulating the path of Typhoon Maria, the eighth typhoon of 2018 in China. The typhoon’s path data are mapped onto the grid topology, yielding the modified IEEE 14 system topology, with the typhoon path annotated as shown in
Figure 5. In this case study, the maximum wind speed of the wind radius (with radius
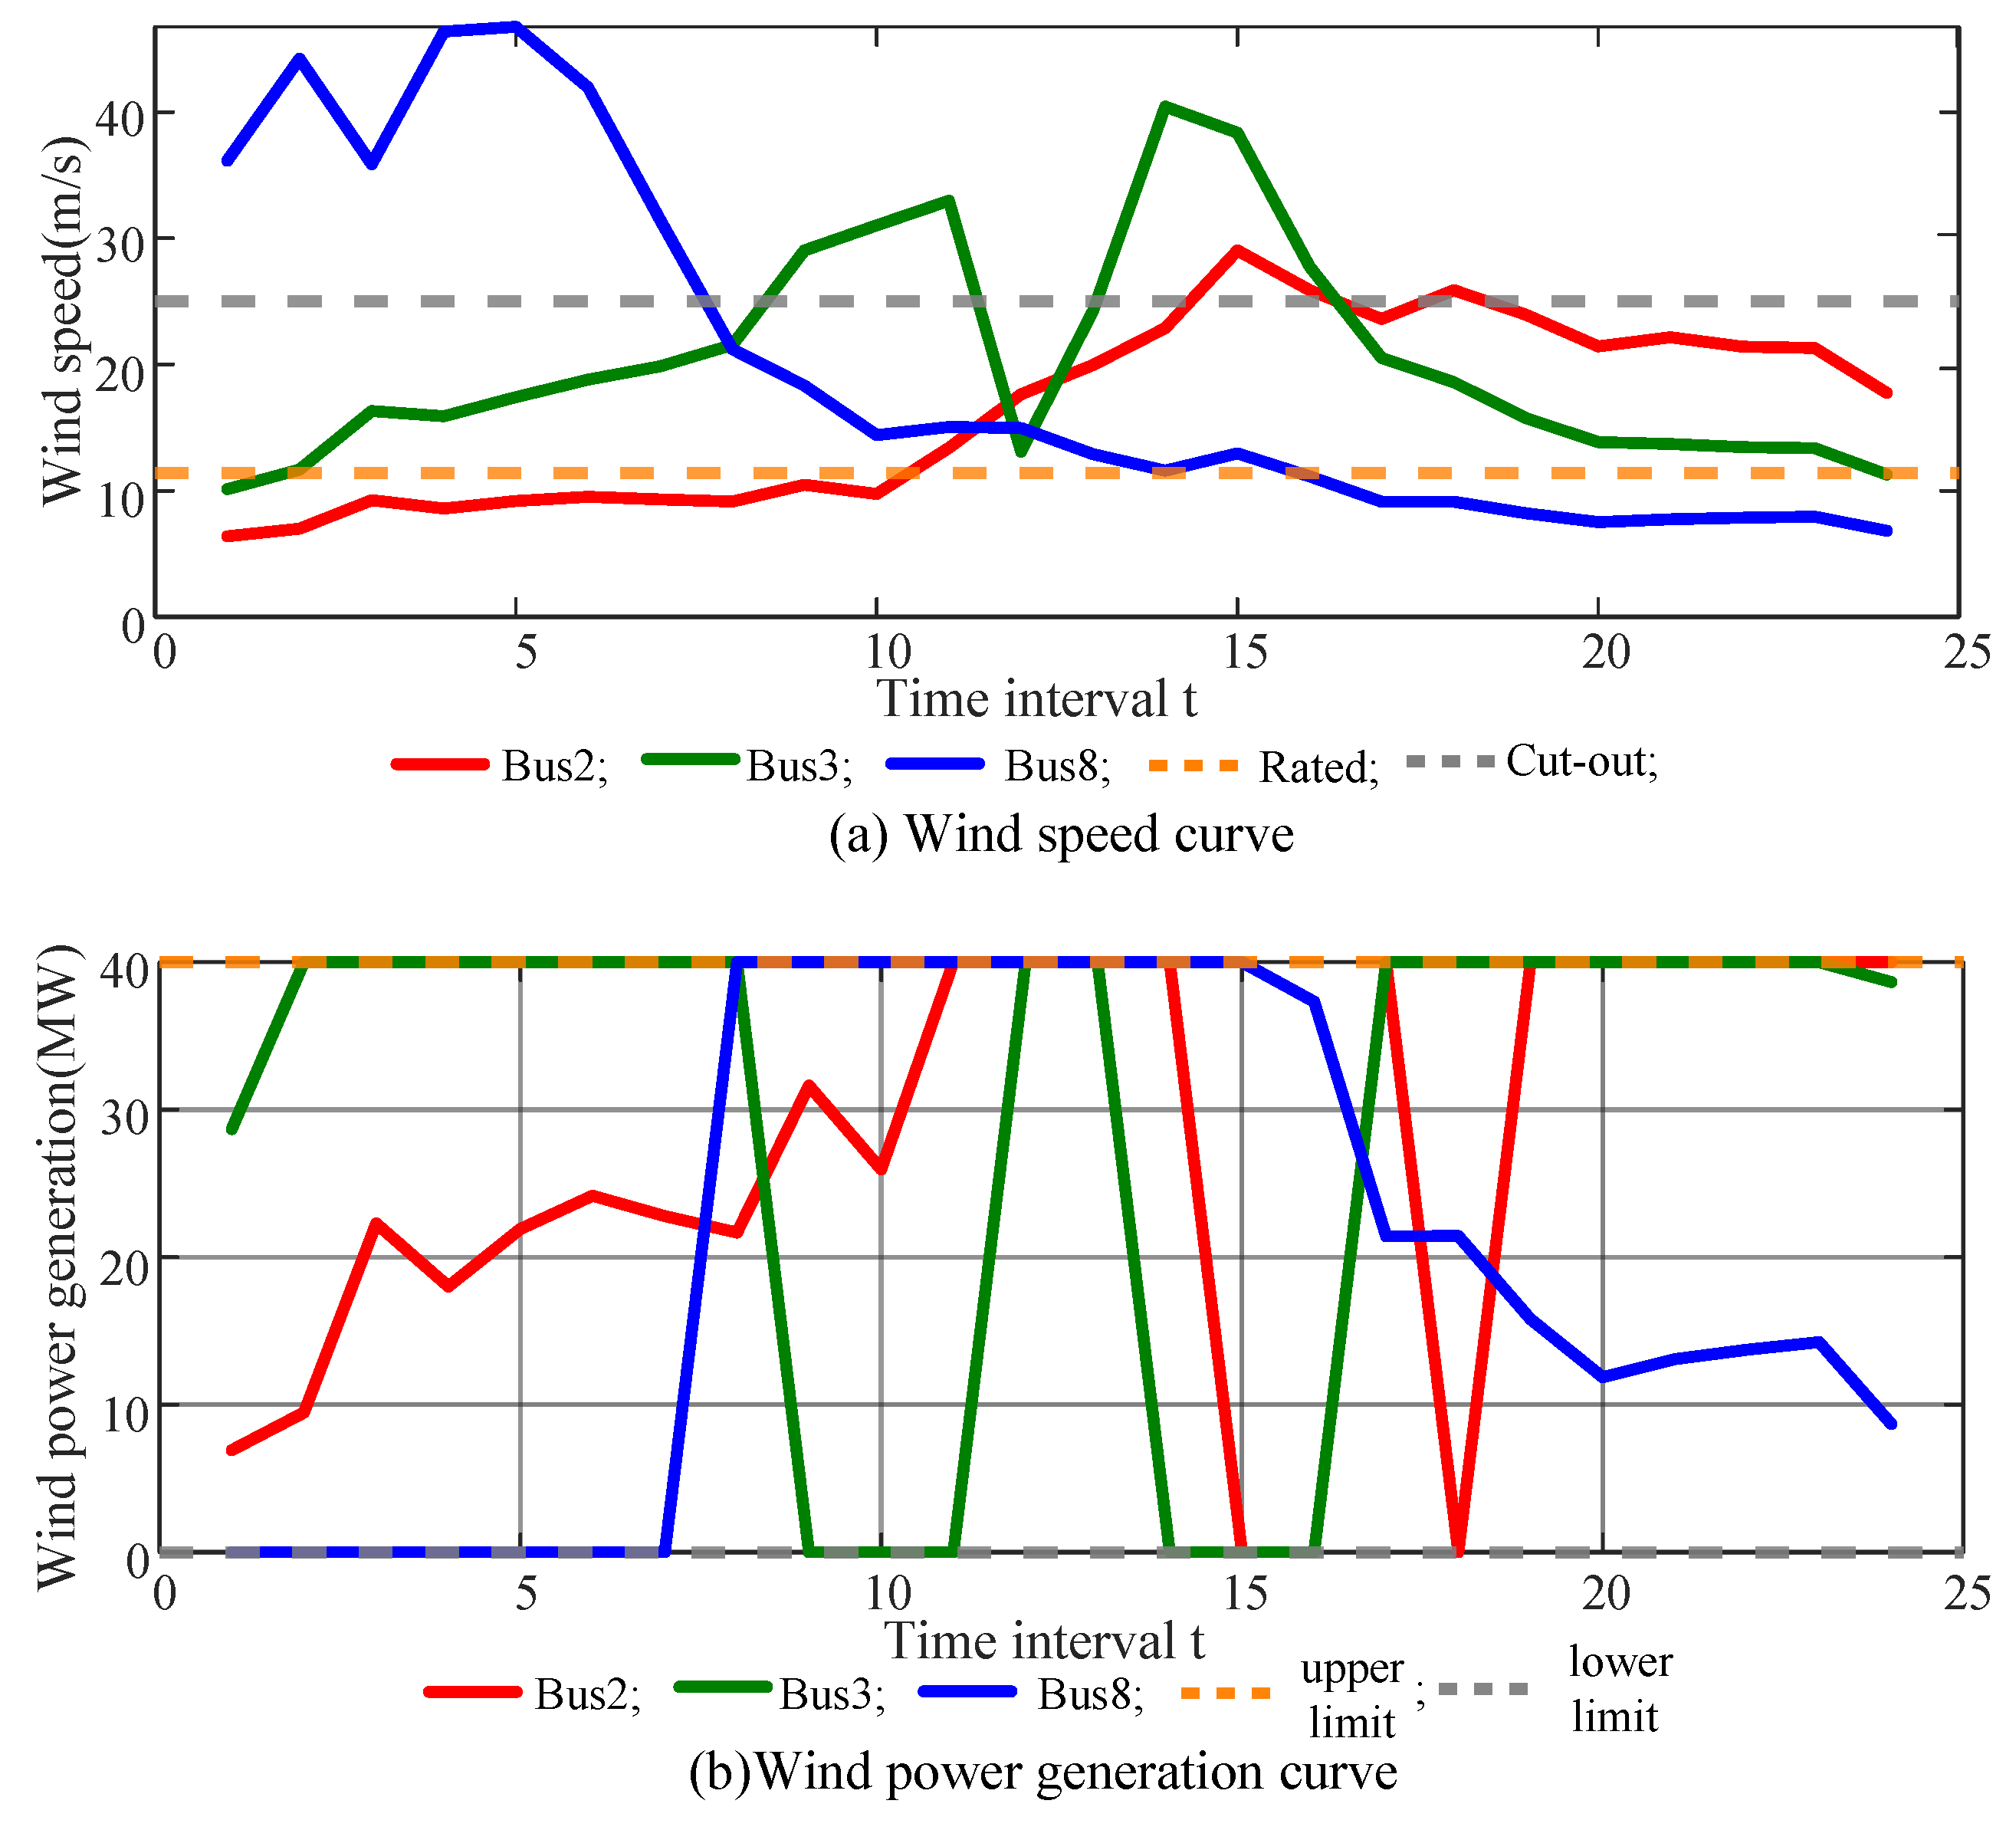
) is defined as the risk wind zone based on the critical wind speed for plastic fatigue damage. The transmission towers are constructed using Q345 material, with a unit distance of 5 km between two towers. All wind farms use the same model of wind turbine, the American NREL 5MW wind turbine. The cut-in, rated, and cut-out wind speeds of the turbine are as follows:
m/s,
m/s, and
m/s. The specific parameters of the wind turbines, towers, and transmission lines are provided in
Table 1.
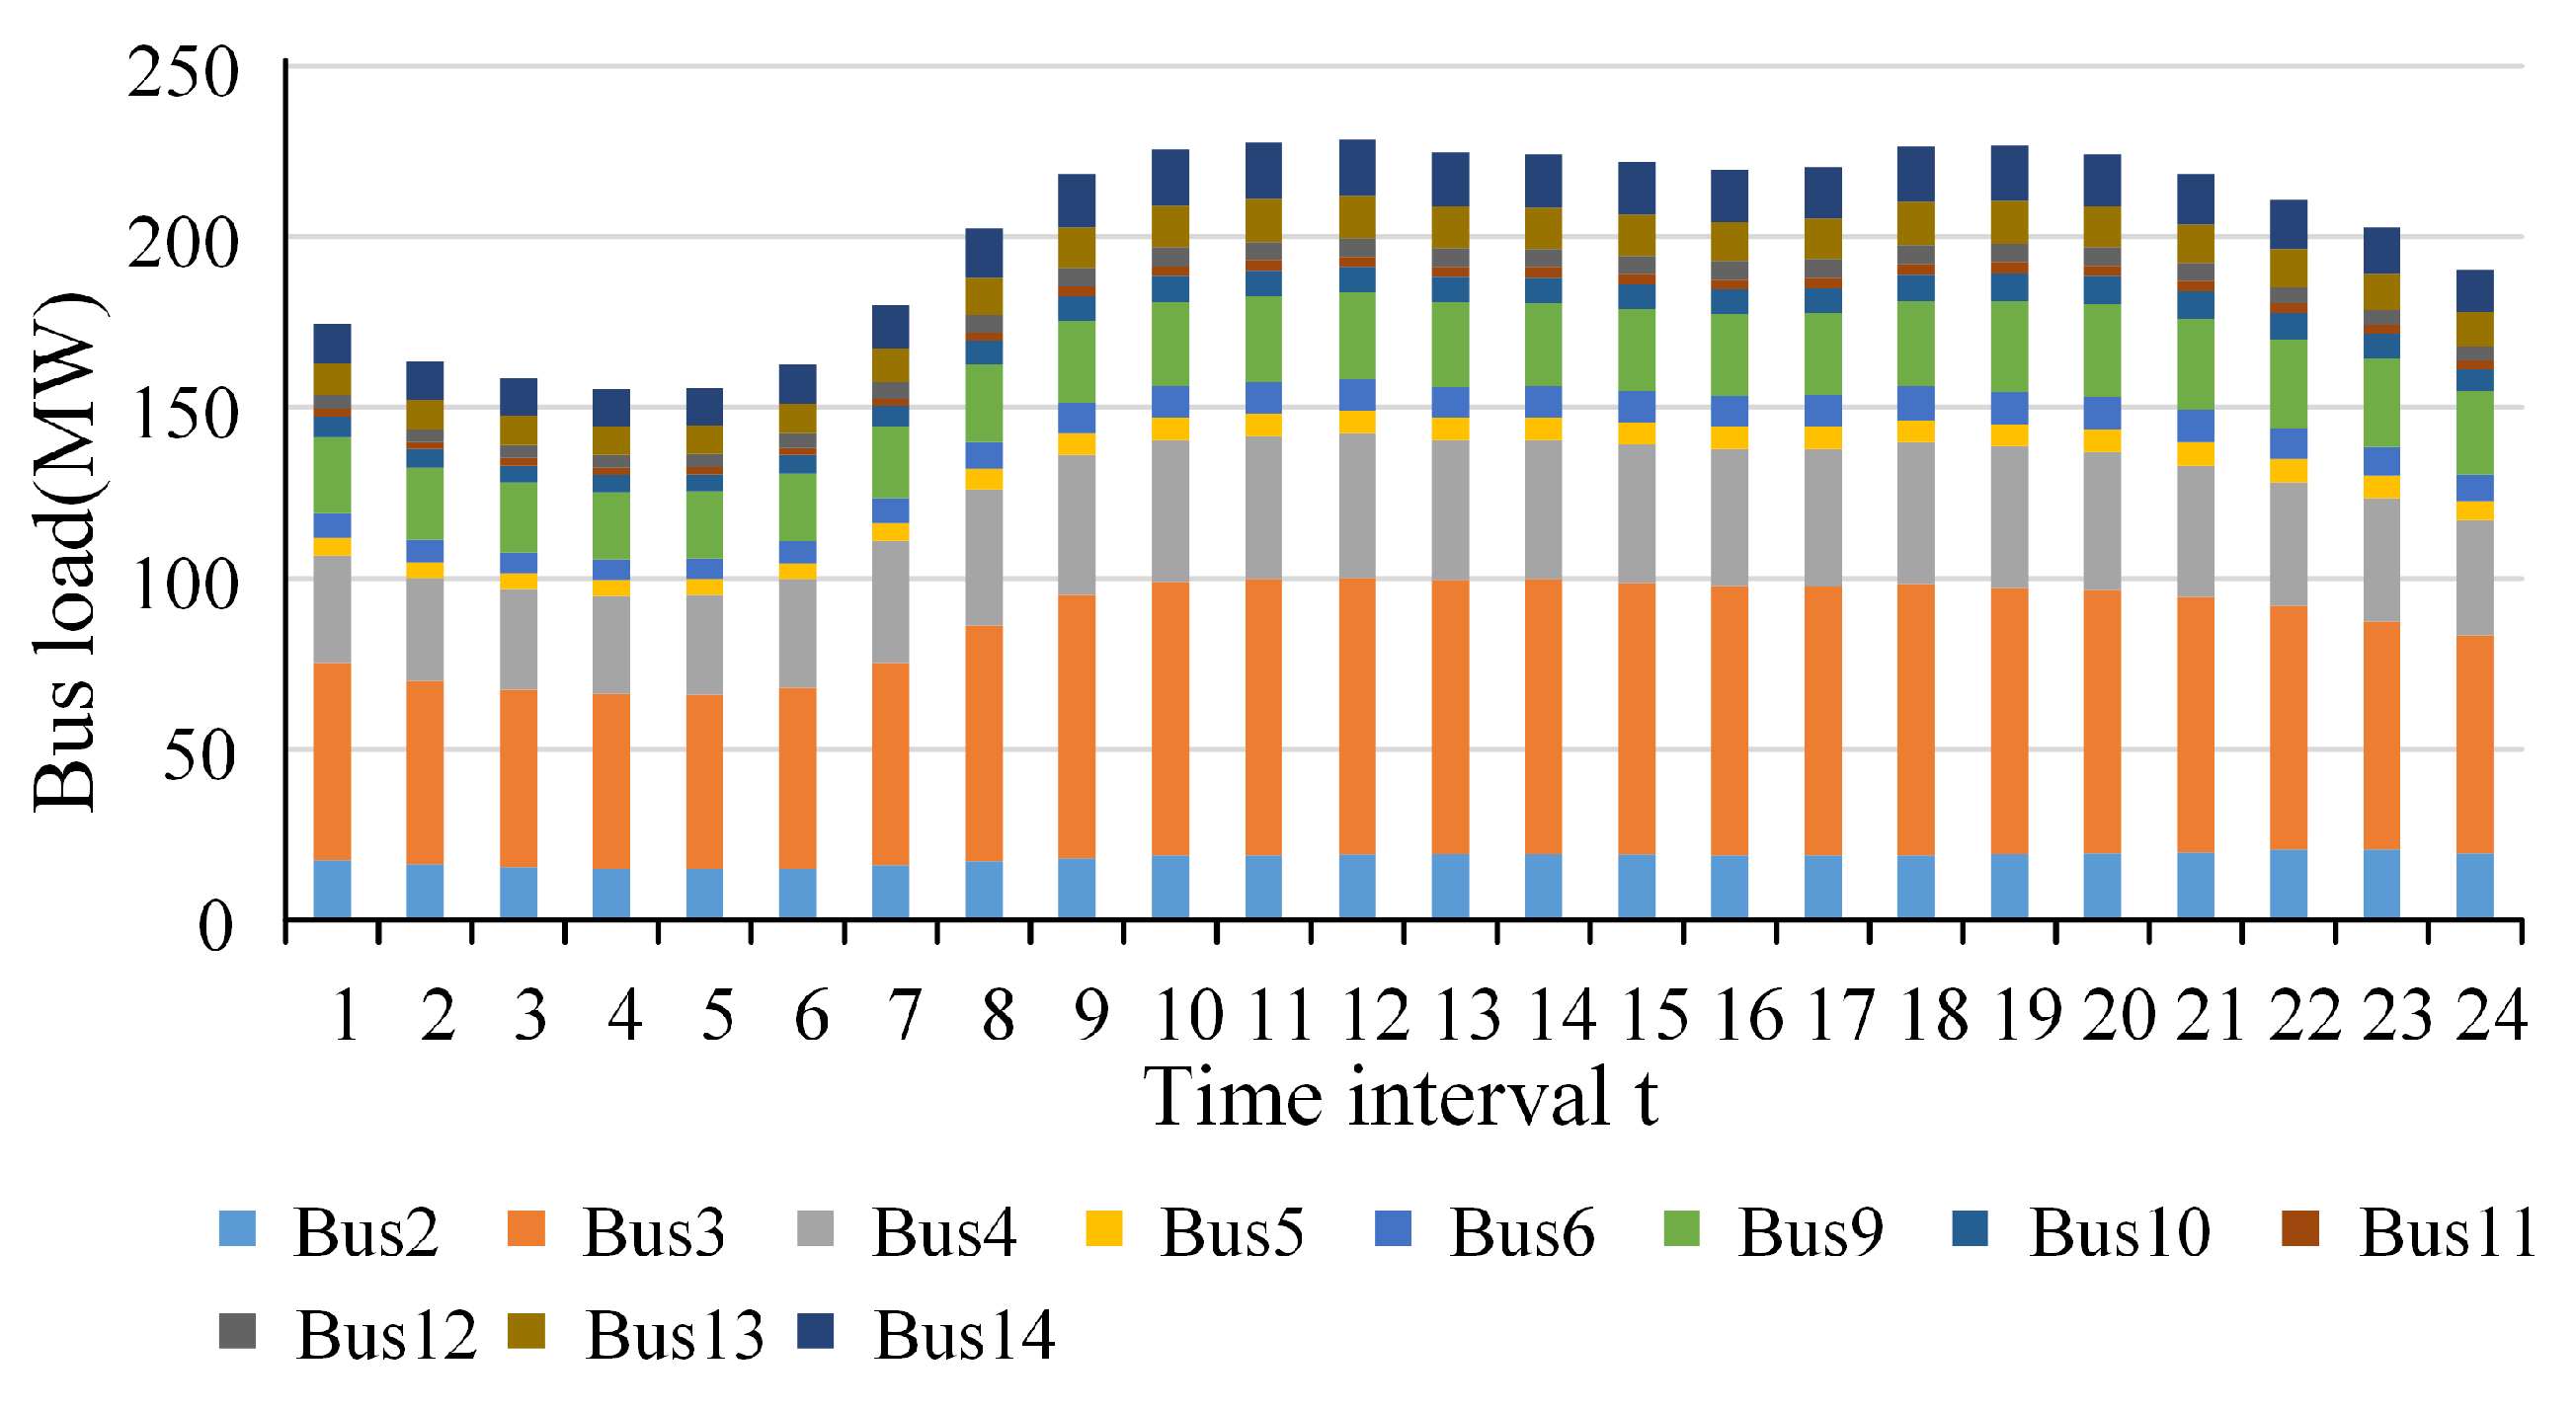
The IEEE 14 system represents a portion of the U.S. power system (located in the Midwest), including 14 buses and 20 transmission lines. In this system, the generators at nodes 2, 3, and 8 are replaced with wind farms, each with an installed capacity of 40 MW and equipped with 8 NREL 5 MW wind turbines. The load data at various time points during the passage of the typhoon are shown in
Figure 6.
6.2. Analysis of Power Grid Equipment Abnormalities Under Tropical Cyclones
Figure 7 illustrates the following trends in wind power output at bus 2: during
, the output slowly increases as the typhoon approaches; during
, as the wind farm nears and exits the risk wind circle, wind speed rises rapidly, resulting in fluctuations at high speeds that cause frequent start-stop operations and abnormal ramping of turbines; during
, as the typhoon moves away, the wind speed decreases gradually from
to
, maintaining rated power output. The wind farms at buses 3 and 8 are impacted by the typhoon earlier than at bus 2, showing a similar wind power development trend but with an “advance” phenomenon.
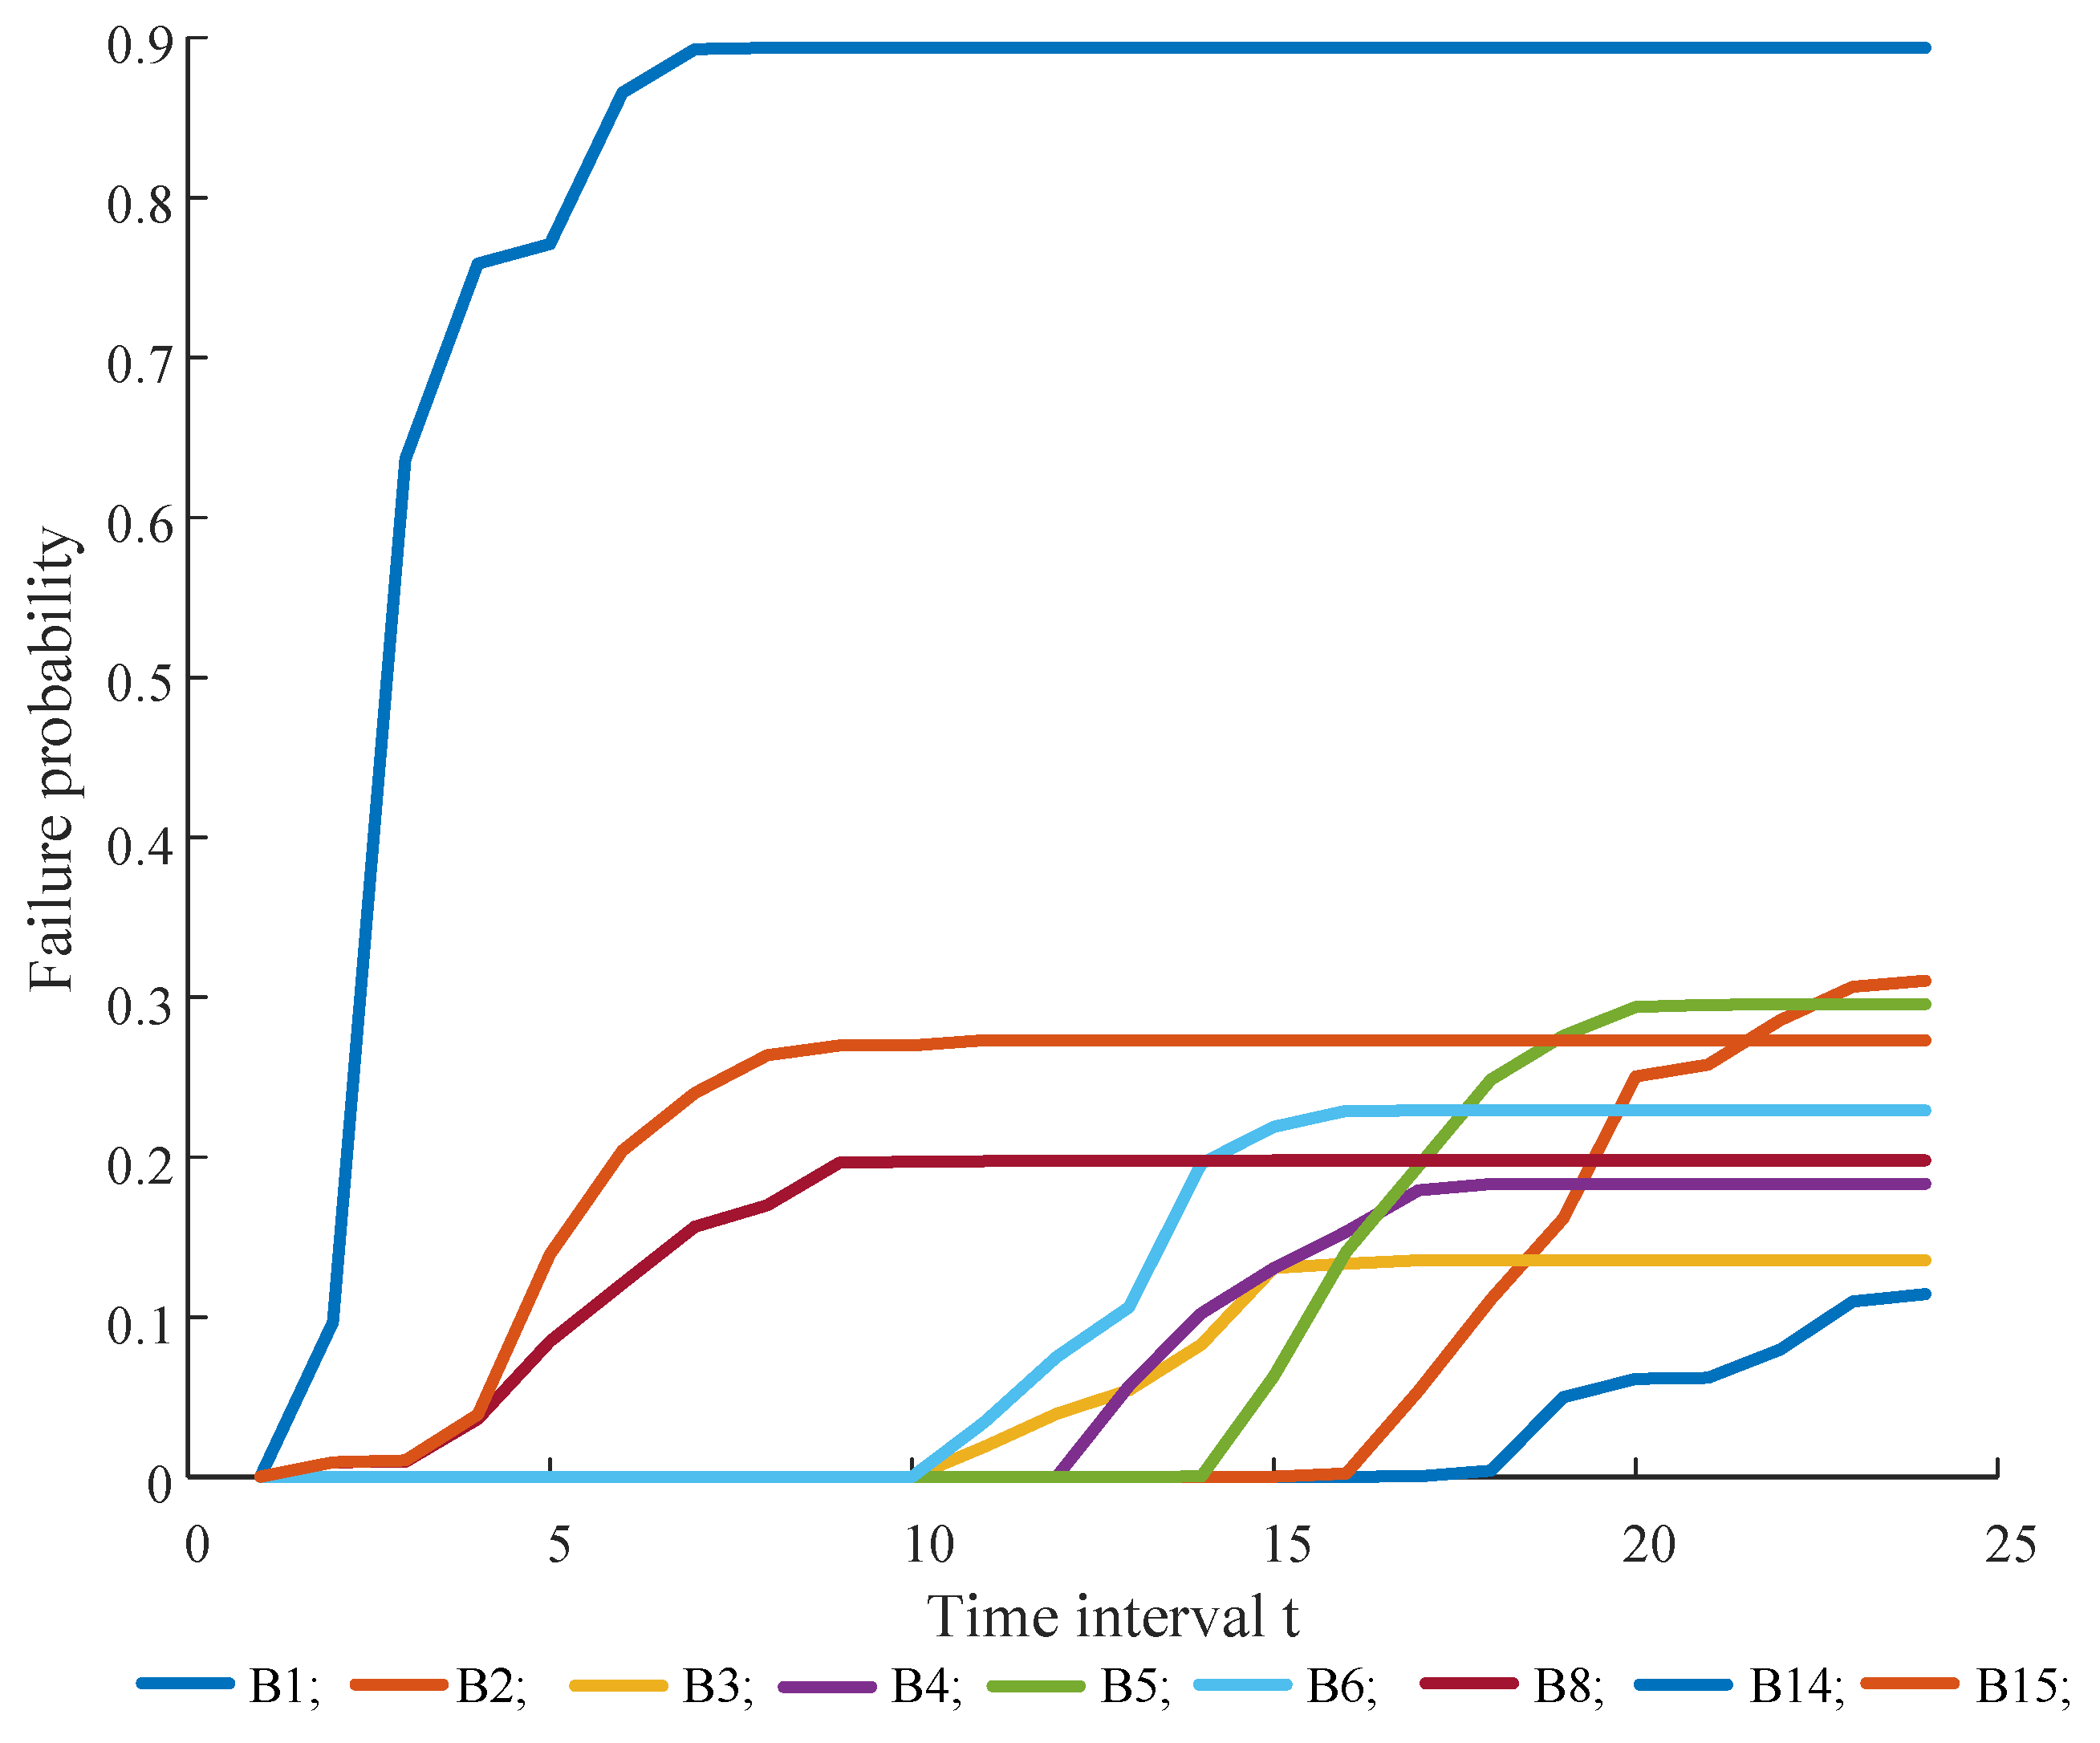
The time-varying fault probabilities of the branches are illustrated in
Figure 8. As shown in
Figure 5, the branches affected by the typhoon risk circle include branches 1–6, 8, 14, and 15. Branches 8, 14, and 15 are the first to be impacted by the typhoon, being close to the wind circle’s edge. In the period
, these branches experience high wind speeds, causing a sharp increase in cumulative fatigue damage, which results in fault probabilities of 0.1971, 0.8937, and 0.2699, respectively. In the interval
, as the typhoon moves away, the cumulative fatigue damage no longer increases, and the fault probabilities for branches 8, 14, and 15 stabilize. Compared to branch 14, branches 1–6 are further inland, where the typhoon’s intensity has decreased, resulting in lower wind speeds and, consequently, lower cumulative fatigue damage, leading to reduced fault probabilities. The remaining branches are far from the typhoon and outside the risk wind circle, resulting in a fault probability of 0.
6.3. Evolution of System Failures Considering the Coupling Effects of Power Flow and Weather
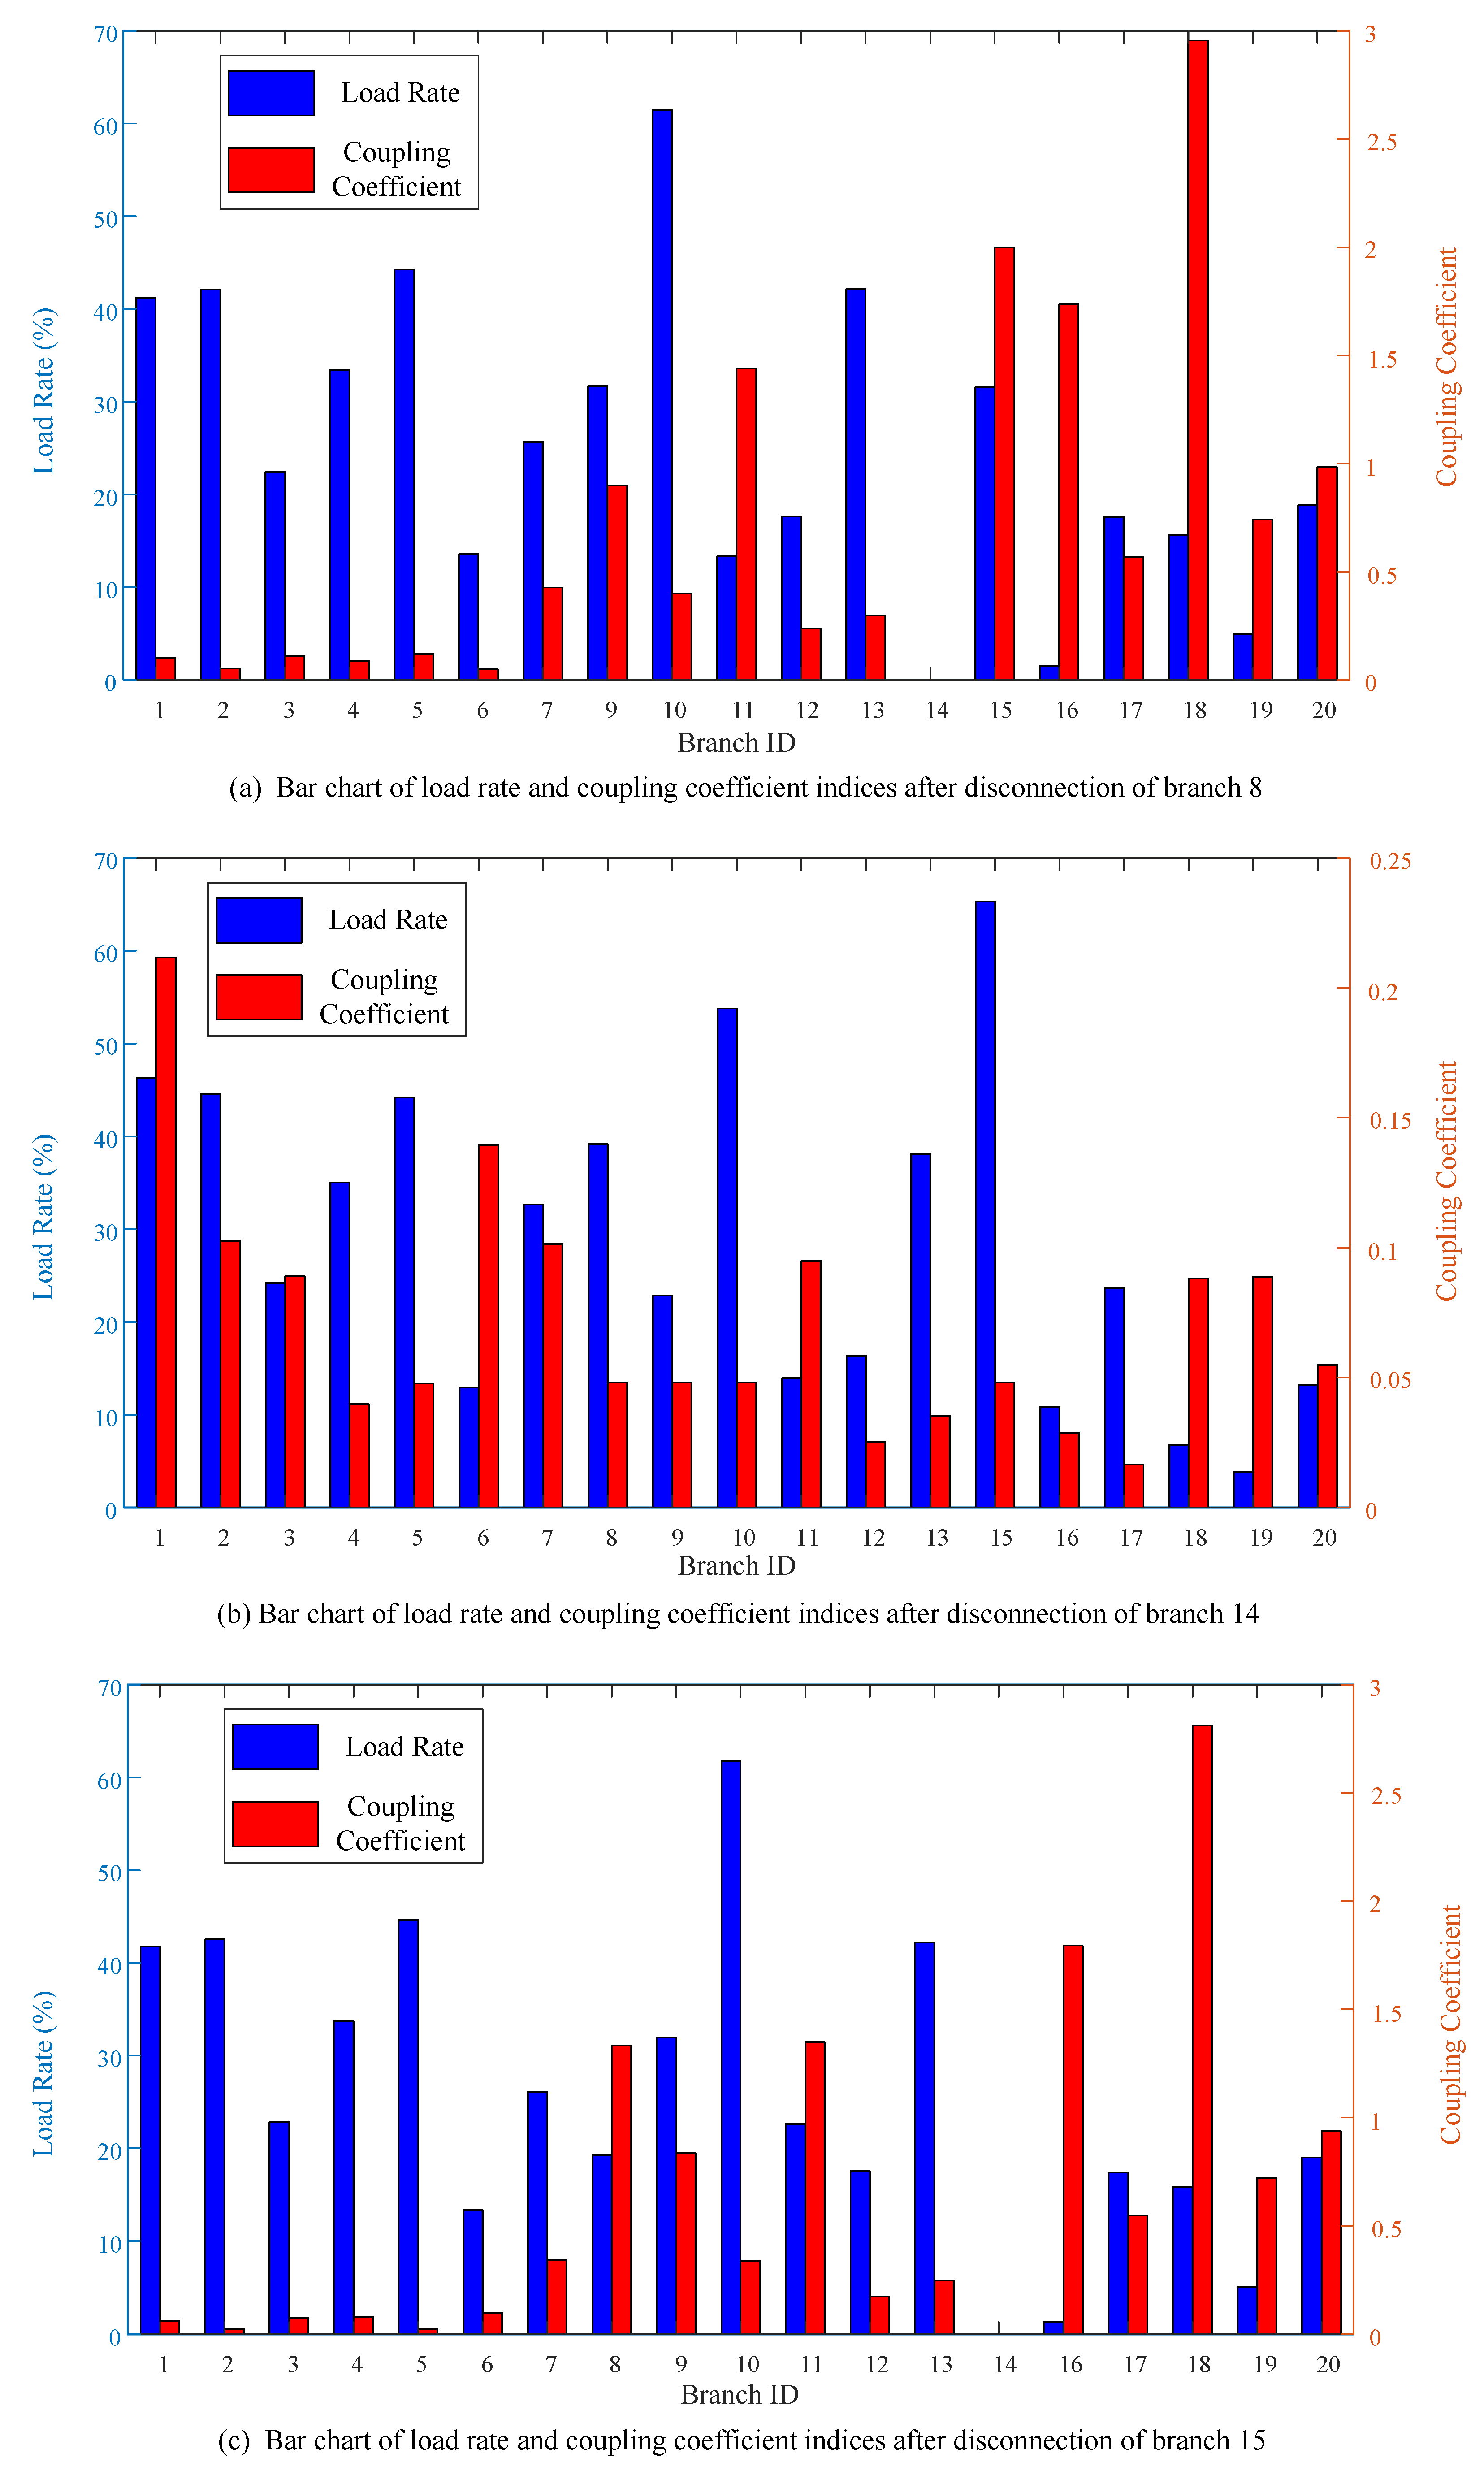
To explore the evolutionary characteristics of the system during failures, this study provides a detailed analysis of the flow and meteorological coupling effects for various branch disconnections. Observing the changes in load rates and coupling coefficients following branch disconnections allows for a better understanding of flow distribution characteristics under fault conditions and the interactions between branches. The following analysis details the system’s response to disconnections of various branches, revealing key features in the fault evolution process. The high-risk fault branches under typhoon conditions are disconnected in sequence: branch 14 at period 3, branch 15 at period 4, and branch 8 at period 5, leading to the changes in load rates and coupling coefficients after disconnection as illustrated in
Figure 9. Observing the changes in load rate indicators and coupling coefficients of other branches facilitates the preliminary assessment of the fault chain’s evolution trend.
After disconnecting branch 8, the load rate of branch 10 reached 0.6145, the highest among all branches, indicating that this disconnection significantly impacted branch 10. Additionally, the coupling coefficient of branch 18 reached 2.9550, indicating a significant impact on its flow. Following the disconnection of branch 14, branch 15 exhibited the highest load rate of 0.6532, while branch 2 had the largest coupling coefficient at 0.2117, indicating significant impacts on these branches. Finally, after the disconnection of branch 15, the load rate of branch 10 again reached a high value of 0.6180, while the coupling coefficient of branch 18 also increased to 2.8120. These data clearly illustrate that at each stage of fault development, certain branches experienced greater flow changes, highlighting the evolution of system faults.
Figure 5 and
Figure 9 indicate that disconnecting branch 14 creates a small island in the system, resulting in the failure of one generator and a significant shift in system flow. In contrast to the disconnections of branches 8 and 15, the system’s load rate and coupling coefficient indicators exhibited significant changes. Thus, in light of the impacts of extreme weather events on the power grid, particular attention should be given to critical branches that are susceptible to island effects upon disconnection, and these should be reinforced to mitigate failure risks and enhance system stability.
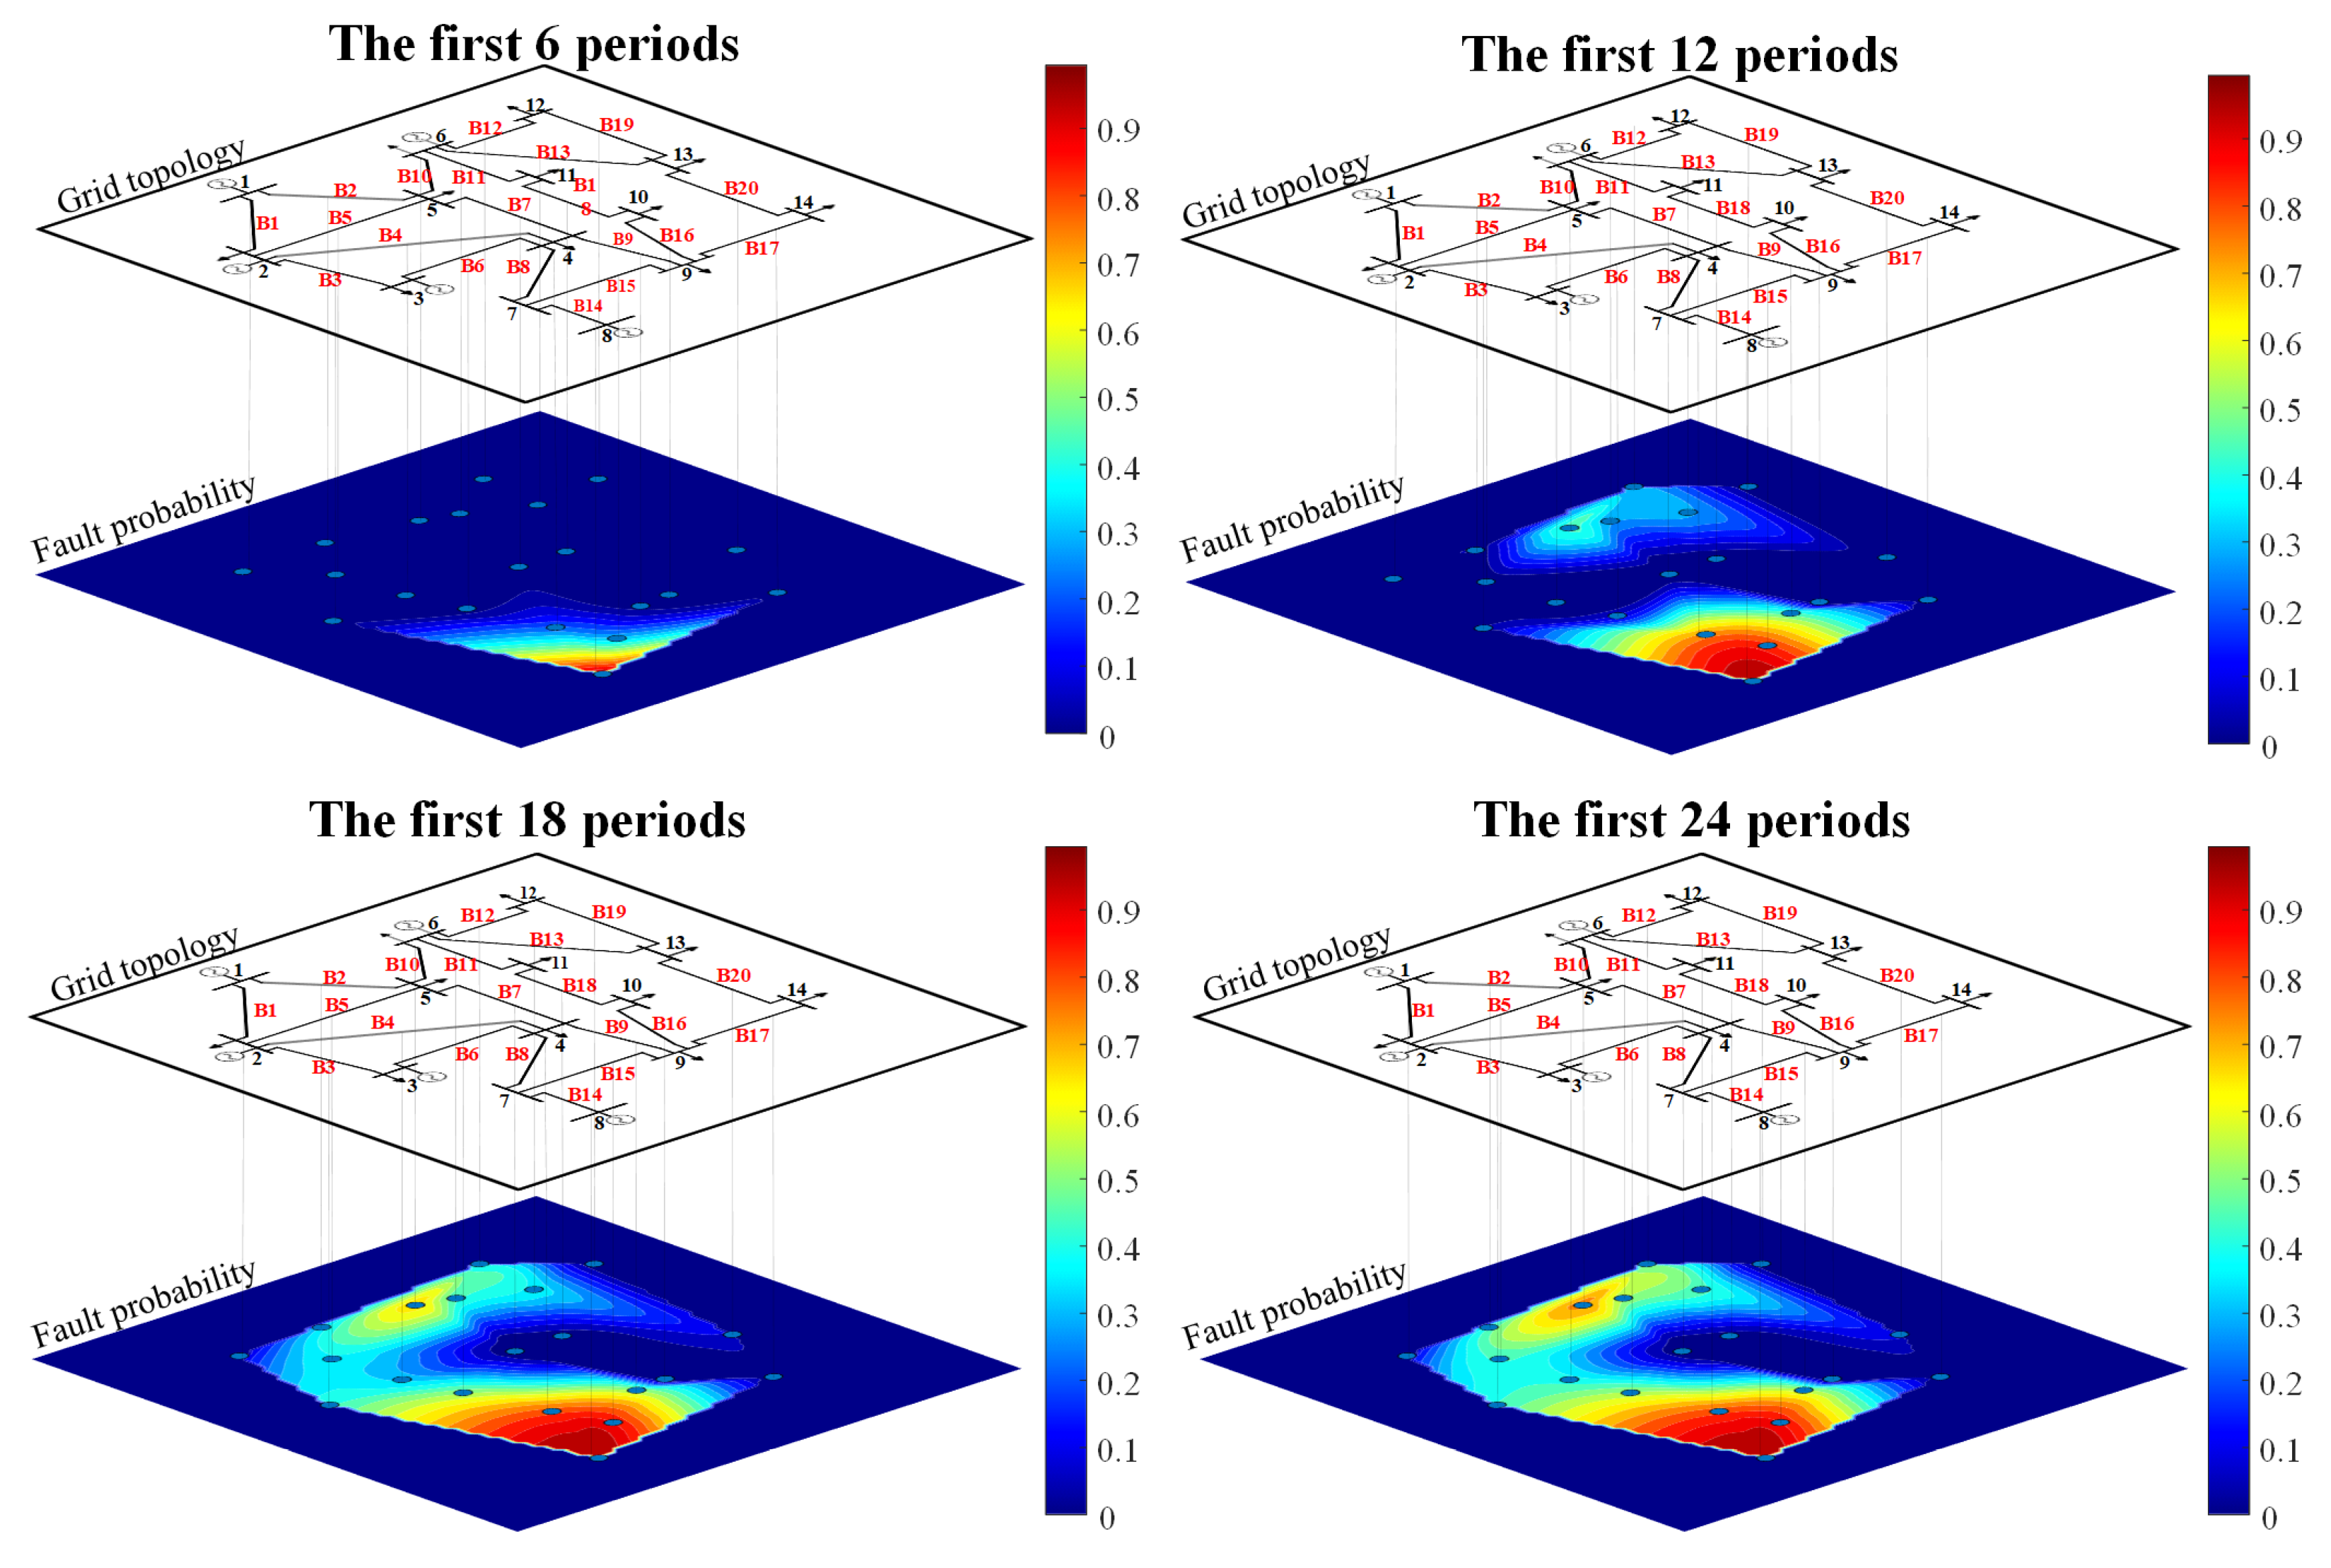
As the fault evolves, the fault probabilities of the lines caused by extreme weather and power flow redistribution are shown in
Figure 10. The color bar and numbers on the right side of the
Figure 10 indicate the total fault probability associated with the fault evolution stages caused by extreme weather and cascading failures. The red ’B’ followed by a number represents the branches in the system. Beginning at the 6th period, meteorological factors led to a gradual increase in fault probabilities for several branches. By the 12th period, the affected area within the system had significantly expanded, particularly for branches 9, 12, and 14, which exhibited fault probabilities exceeding 0.7. This indicates an intensifying impact of the typhoon on critical regions of the power grid, resulting in substantial flow transfers along these branches. During the 18th and 24th periods, the distribution of faults within the system intensified further, highlighting the increasing exposure of the power grid’s vulnerabilities due to the typhoon’s continued impact.
To tackle the problem of islands formed during typhoon passage, the maximum island handling method was implemented in the simulation. Given the high instability of island quantity and distribution during cascading failures, the maximum island handling approach effectively simplifies the problem’s complexity and ensures a reliable overall assessment of the system’s reliability. Utilizing the abnormal propagation paths outlined in
Section 4.2 and the cascading failure simulation method from
Section 5.1, we predicted the cascading fault chains in the power grid under tropical cyclone impacts. Through extensive sampling simulations, the 10 most frequently occurring fault chains are identified, and their risk indices are calculated, as summarized in
Table 2:
The analysis of the fault chain in
Table 2 indicates that the entire fault chain path reflects the cascading response of the system to the severe impact of the typhoon. Extensive sampling simulations reveal that faults initially occur in key branches such as branches 14, 15, and 8, quickly spreading to secondary branches like branches 10 and 11, resulting in multiple localized power outage areas resembling islands. Particularly in the later stages of fault propagation, significant power shortages have emerged in most areas of the system, with the overall chain failure path exhibiting specific patterns, as indicated by the fault chain paths in the table. This highlights that the vulnerability of the power grid during extreme meteorological events like typhoons mainly manifests through the overload of key branches and the island effect. Therefore, in designing preventive measures, the system should prioritize these high-risk paths and fault chains, especially reinforcing branches susceptible to island formation, to improve the overall disaster resilience of the power grid.
6.4. Comparison of Grid Abnormal Evolution Under Coupled Power Flow and Weather vs. OPA Model
The traditional OPA(ORNL-PSERC-Alaska) model neglects the influence of post-fault power flow dynamics on cascading failure chains and oversimplifies the temporal arrangement of critical events. This limitation is demonstrated through simulations performed on a modified IEEE 14-bus system.Using the abnormal conditions of power grid equipment calculated in
Section 5.1, fault sampling is performed to extract fault lines from all periods during the typhoon, resulting in a grid fault line set considering only meteorological effects. Based on these fault lines, power flow calculations are conducted to identify system overloads caused by the typhoon. Overloaded lines are removed to obtain cascading fault chains considering only meteorological effects. Through extensive sampling simulations, the 10 most frequently occurring fault chains are identified, and their risk indices are calculated, as summarized in
Table 3.
A comparative analysis of the prediction results between the proposed method, which accounts for the coupling effects of power flow and meteorological factors (Method 1), and the OPA model (Method 2), reveals that Method 1 can more accurately capture the risks of power insufficiency. Method 2 neglects the influence of power flow factors on system stability during incident development, leading to considerable deviations in expected values of power insufficiency. In scenarios with substantial wind speed fluctuations, variations in power flow can greatly impact the stability of the power system. Method 1 effectively captures these intricate dynamic changes, while Method 2 does not respond adequately, leading to an incomplete assessment of the actual risks to the power system. Method 1 more accurately represents the complexities present in real power systems, especially under conditions of strong interaction between power flow and meteorological factors, enhancing its value in power system planning and risk management. During extreme weather events, power systems may face challenges due to changes in power flow factors, which Method 2 fails to identify promptly.
6.5. Scalability Analysis of Spatiotemporal Risk Assessment Methodology for Power Grid Anomalies in Large-Scale Networks Under Extreme Disasters
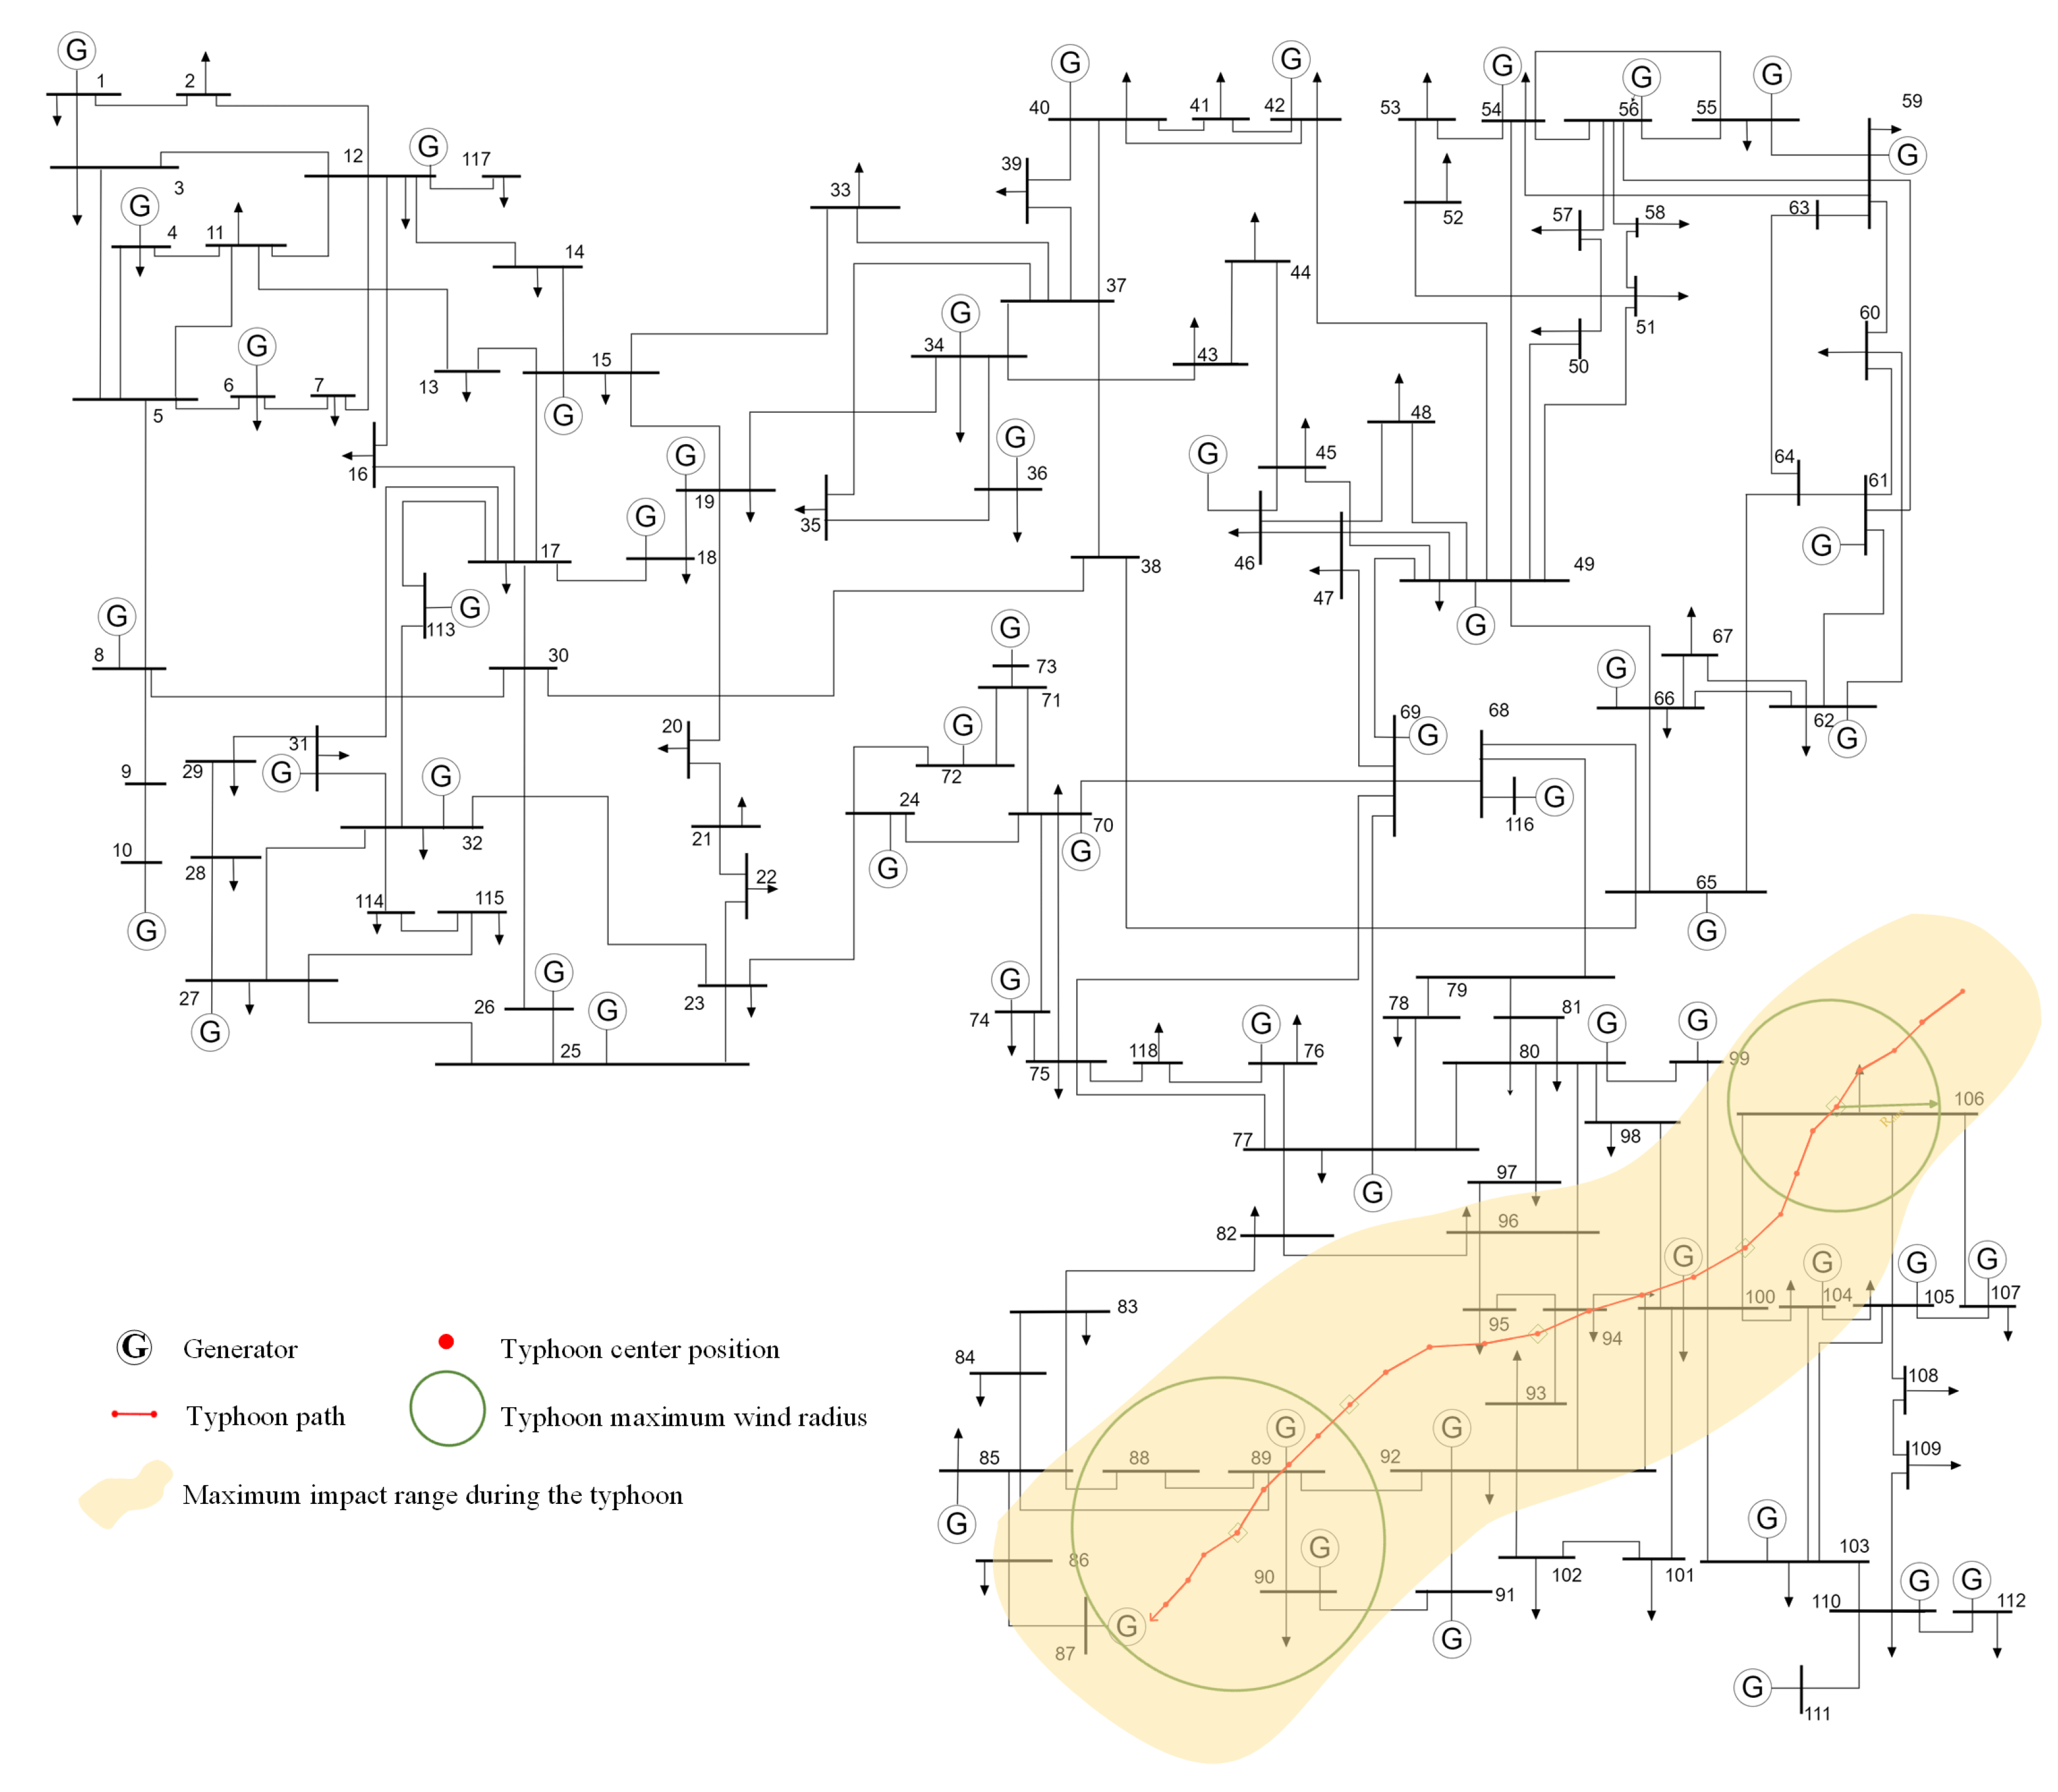
The IEEE 118 system, comprising 118 buses and 186 transmission branches, is configured with topological parameters and typhoon trajectory, as depicted in
Figure A1. Conventional generators at buses 87, 89, and 100 are retrofitted with equivalently rated wind farms, while new wind installations (50 MW, 50 MW, and 20 MW capacities) are deployed at buses 90, 92, and 104, respectively. Component parameters (including wind turbines, transmission towers, and line characteristics) maintain consistency with the IEEE 14 system, with detailed specifications provided in
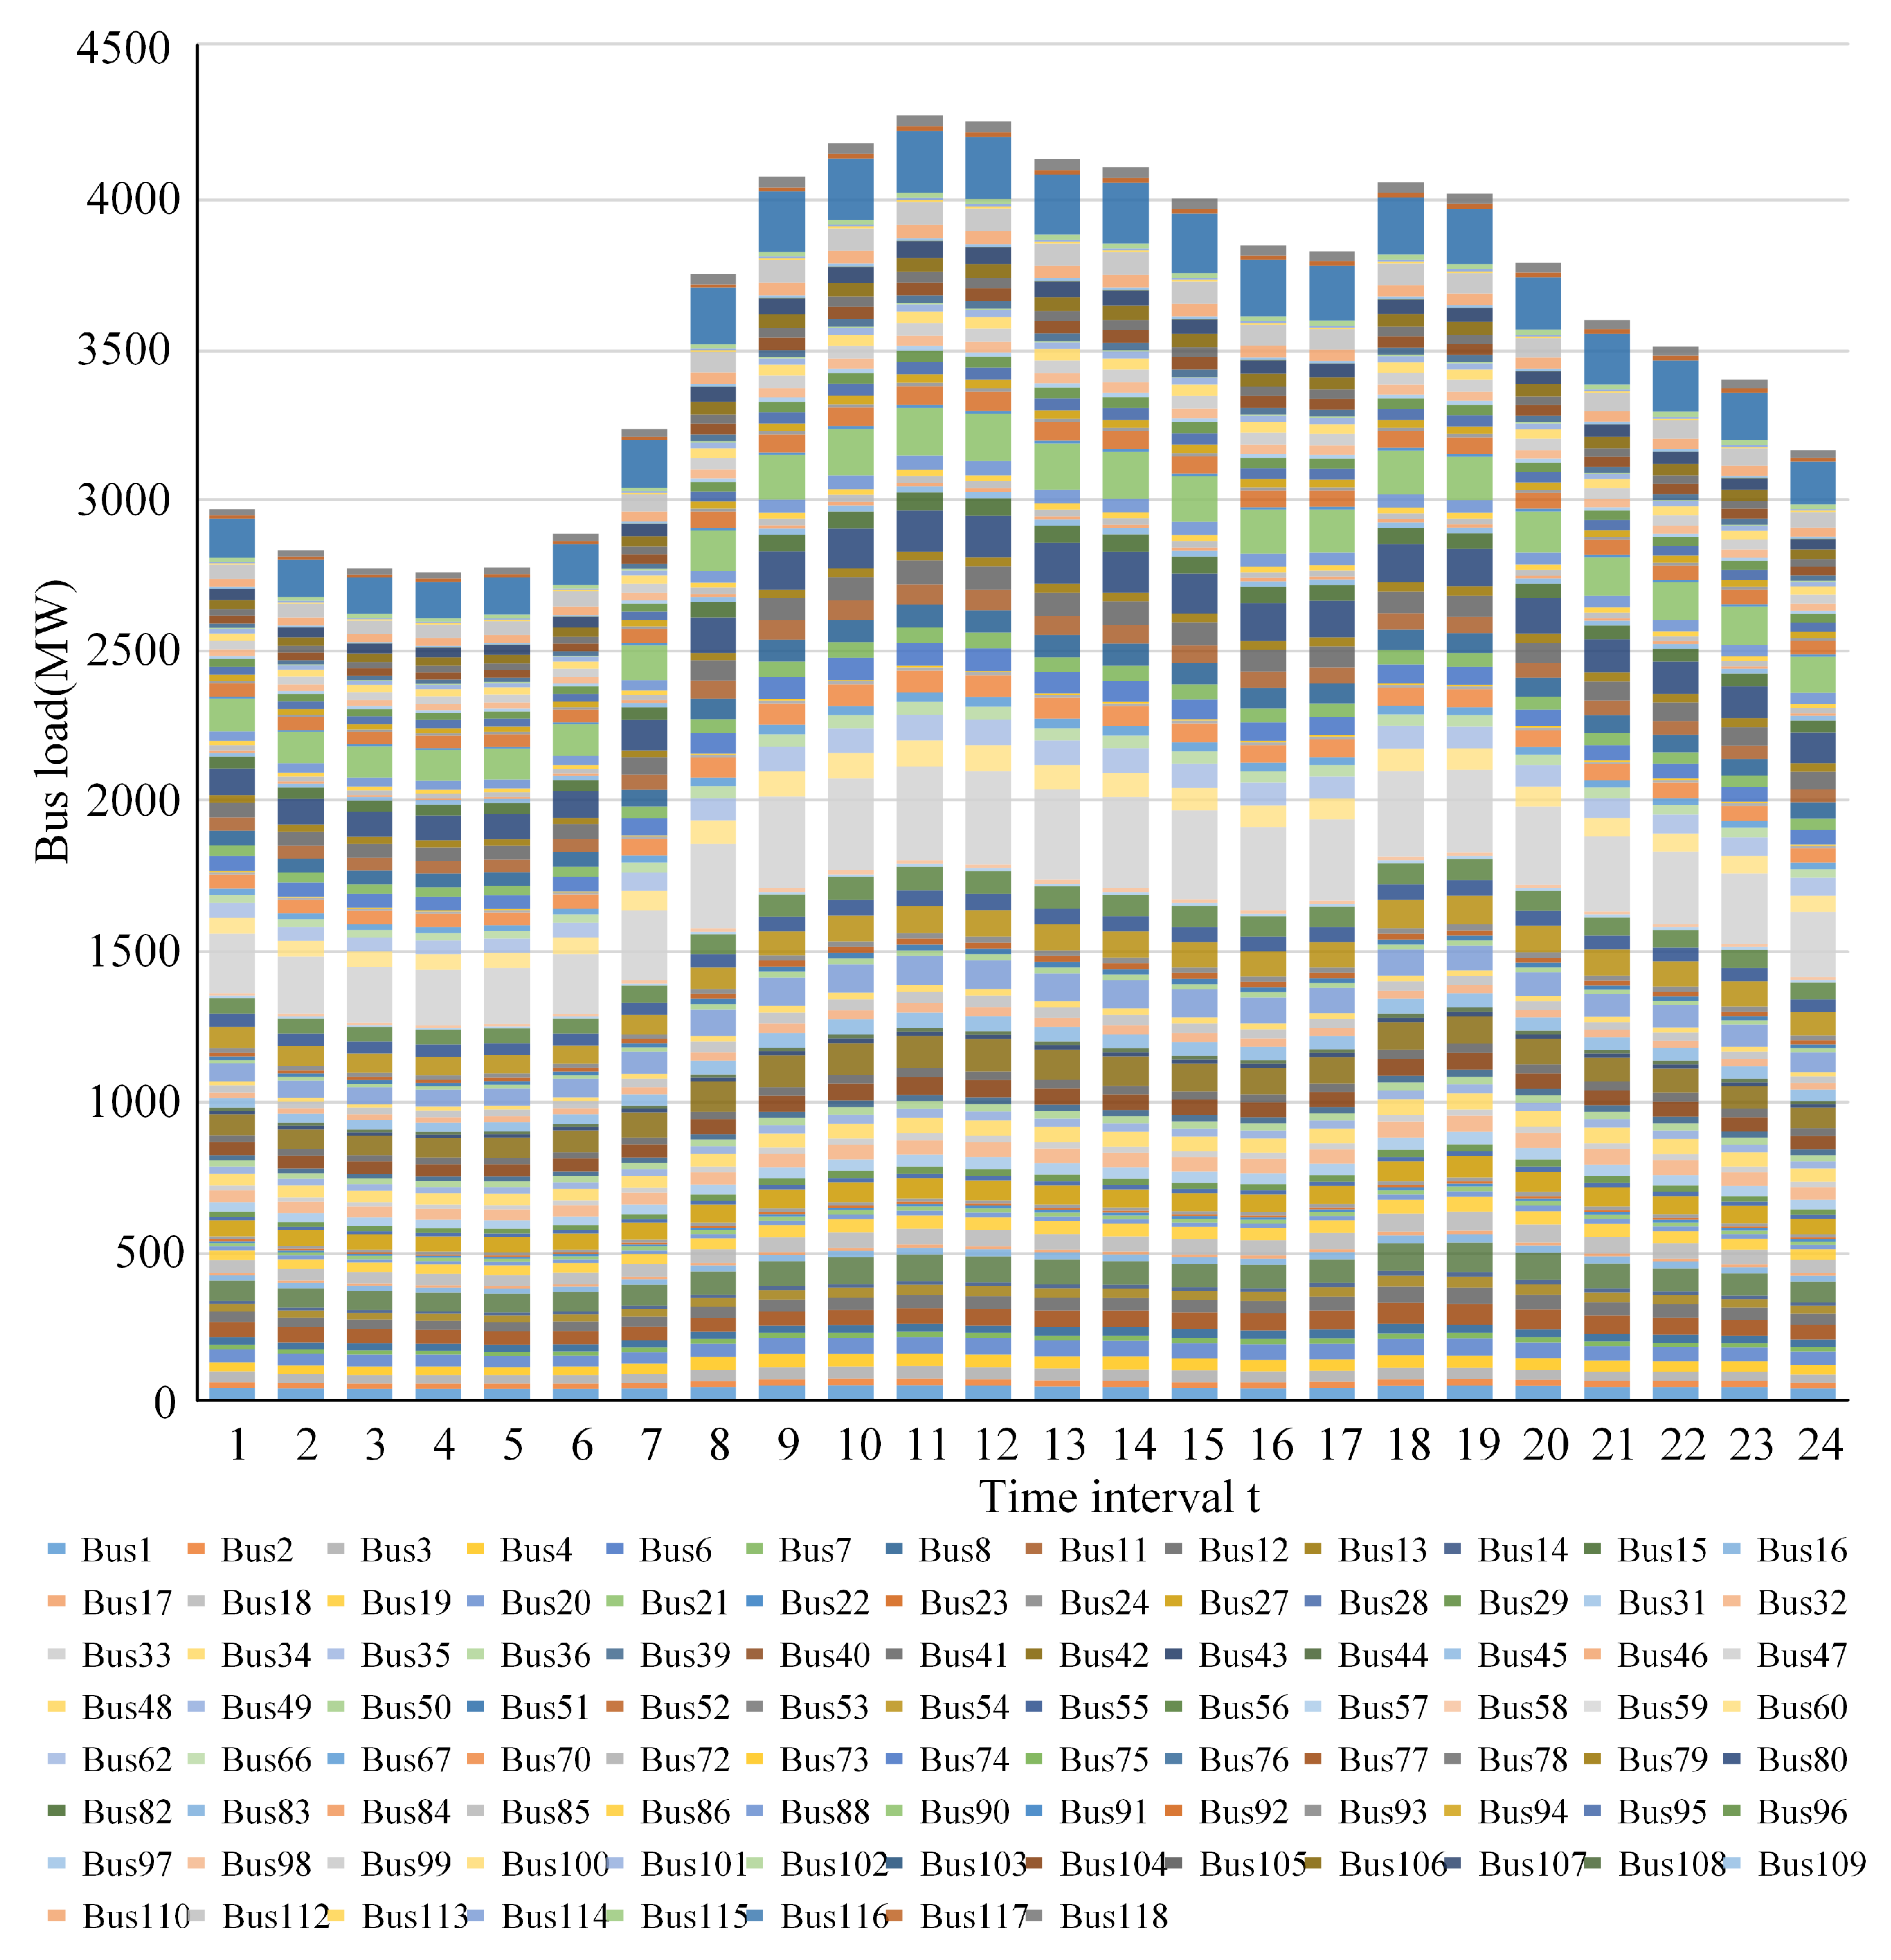
Table 1. Temporal load profiles with normalized hourly variations are illustrated in
Figure A2.
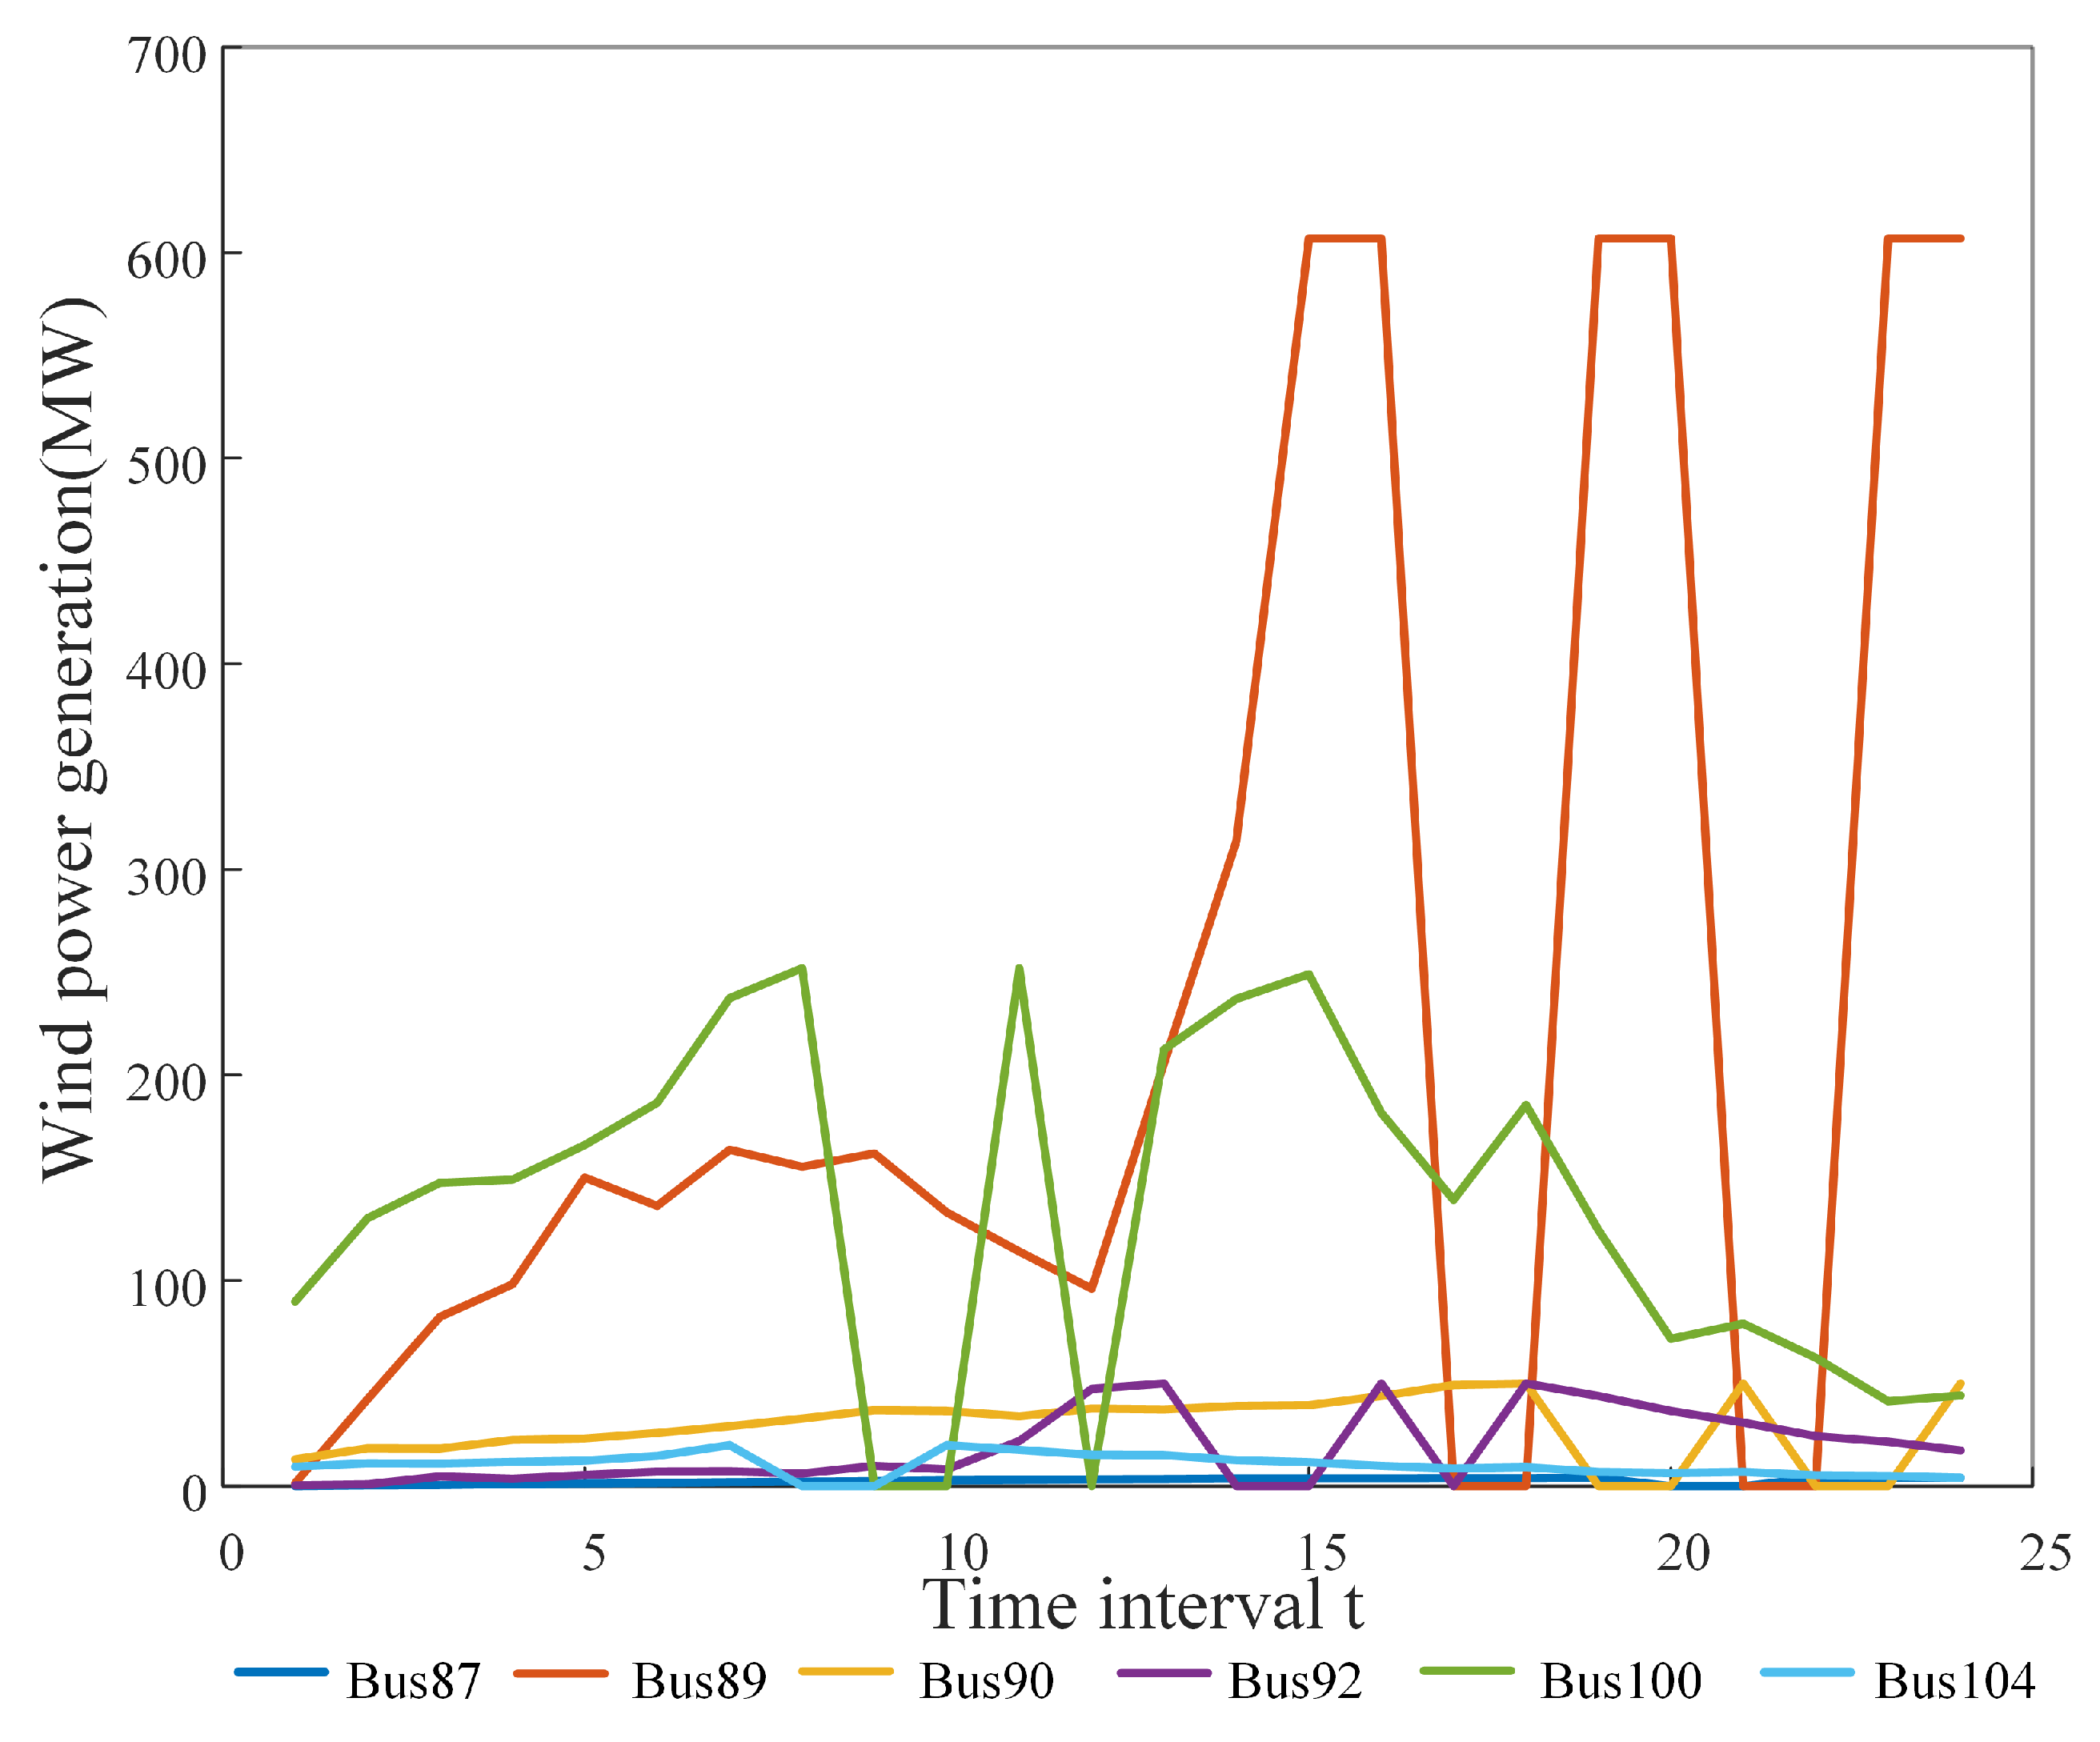
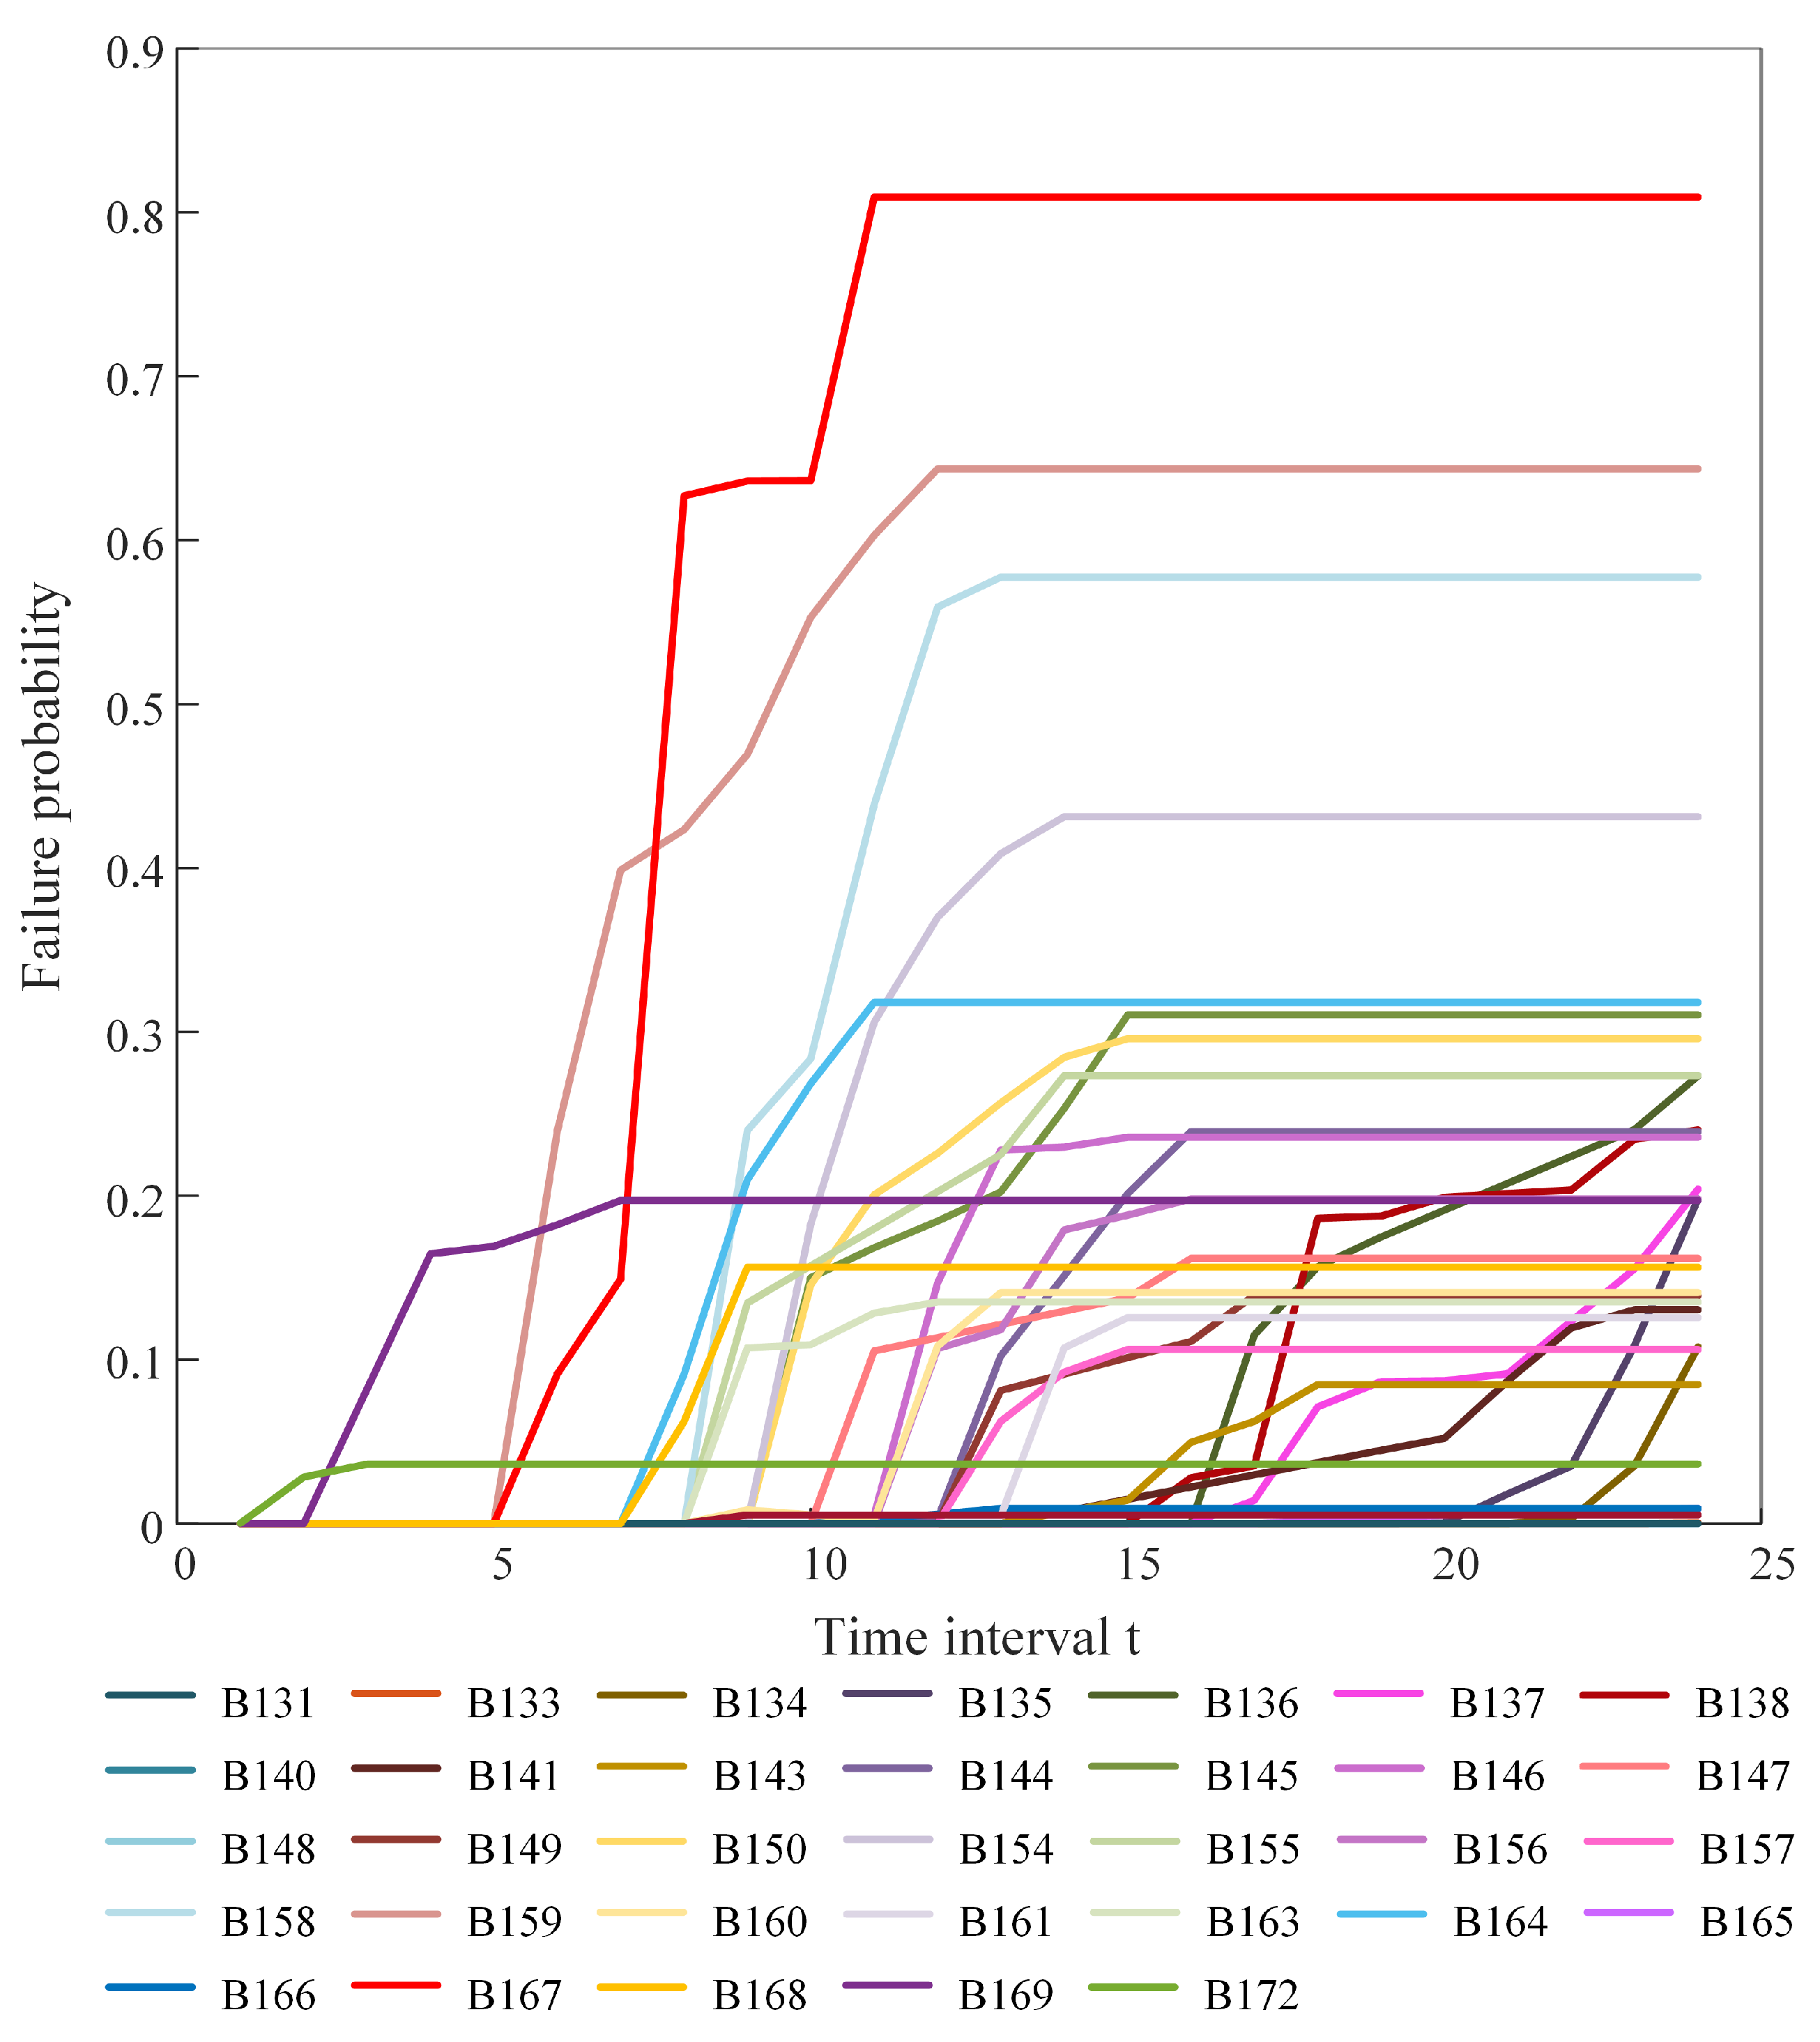
The computational results reveal wind power generation profiles (
Figure A3 and transmission line failure probabilities (
Figure A4) under typhoon conditions. Based on the anomaly propagation pathways in
Section 4.2 and cascading failure simulation methodology in
Section 5.1, the cascading fault chains are predicted under tropical cyclone. From a large number of simulation results, the 10 most frequently occurring fault chains are selected and presented in
Table 4.
Based on the fault propagation paths shown in
Table 4, when large-scale power grids face extreme weather disasters, the cascading fault evolution process exhibits the following characteristics: initial faults are concentrated in key structural branches such as 167, 169, 159, and 164, and then spread rapidly to secondary key branches like 104, 110, 30, and 106 through power flow redistribution. Notably, in the later stages of fault evolution, multi-region splitting occurs, leading to localized power supply-demand imbalances. The research results show that the risk assessment method considering the dynamic spatiotemporal evolution of the power grid can effectively handle the complex topology of large power grids. This method demonstrates strong applicability in large grid risk assessment under extreme weather conditions.
7. Conclusions
This paper proposes a spatiotemporal evolution-based risk assessment method, considering the time-varying abnormal states of source-grid equipment under the spatiotemporal trajectory of typhoons. Building on the spatiotemporal characteristics of grid faults, this study further explores the spatiotemporal evolution mechanism of grid anomalies, driven by the coupling of extreme weather factors and power flow, identifying the propagation paths of grid anomalies. This study reveals the inherent patterns of grid fault evolution under extreme weather conditions, addressing gaps in current research. The study identifies evaluation metrics that effectively reflect the grid fault evolution process and system vulnerability. Through a systematic risk assessment process, it provides a new theoretical framework and practical tools for assessing the safety of power grids during extreme weather disasters.
The proposed method outperforms traditional cascade fault models that consider only meteorological factors (e.g., the OPA model). Traditional models typically overlook the impact of power flow redistribution on grid fault evolution. In extreme weather events, the interaction between meteorological factors and power flow redistribution affects the stability of grid lines. By considering the coupling effects of meteorological factors and power flow, this study more accurately predicts the spatiotemporal evolution of grid faults, enhancing both the accuracy and timeliness of fault prediction.
The proposed method is validated through case studies of the modified IEEE 14 and IEEE 118 systems, effectively capturing the dynamic changes in grid equipment during tropical cyclone passage, particularly regarding fault characteristics under varying meteorological conditions and power flow loads. This evaluation method simulates the alternating processes of equipment failures and power flow redistribution, enabling more accurate predictions of fault chain formation and propagation. Furthermore, the method accounts for uncertainties in meteorological factors and grid parameters, enhancing the accuracy of the overall system risk assessment.
In conclusion, the method presented in this paper not only provides a scientific basis for power grid risk management under extreme weather conditions but also offers valuable insights for future disaster prevention and mitigation strategies in power grids. Future research will focus on larger-scale real-world power systems, simulating typhoons that have occurred within these systems and comparing the simulation results with actual operational data. The study will also explore fault recovery strategies during disasters, integrating recovery measures into the fault evolution scheduling process based on real grid operational patterns. Additionally, the research will extend to more tropical cyclone scenarios, including the impact of extreme weather events, such as thunderstorms, on source-grid equipment. These studies contribute to enhancing the power grid’s ability to respond to a wider range of extreme weather events.


