


Nutritional and Biochemical Characterization of White and Brown Rice (Oryza sativa) Subjected to Different Pest Control Methods

 , and
, and
Abstract
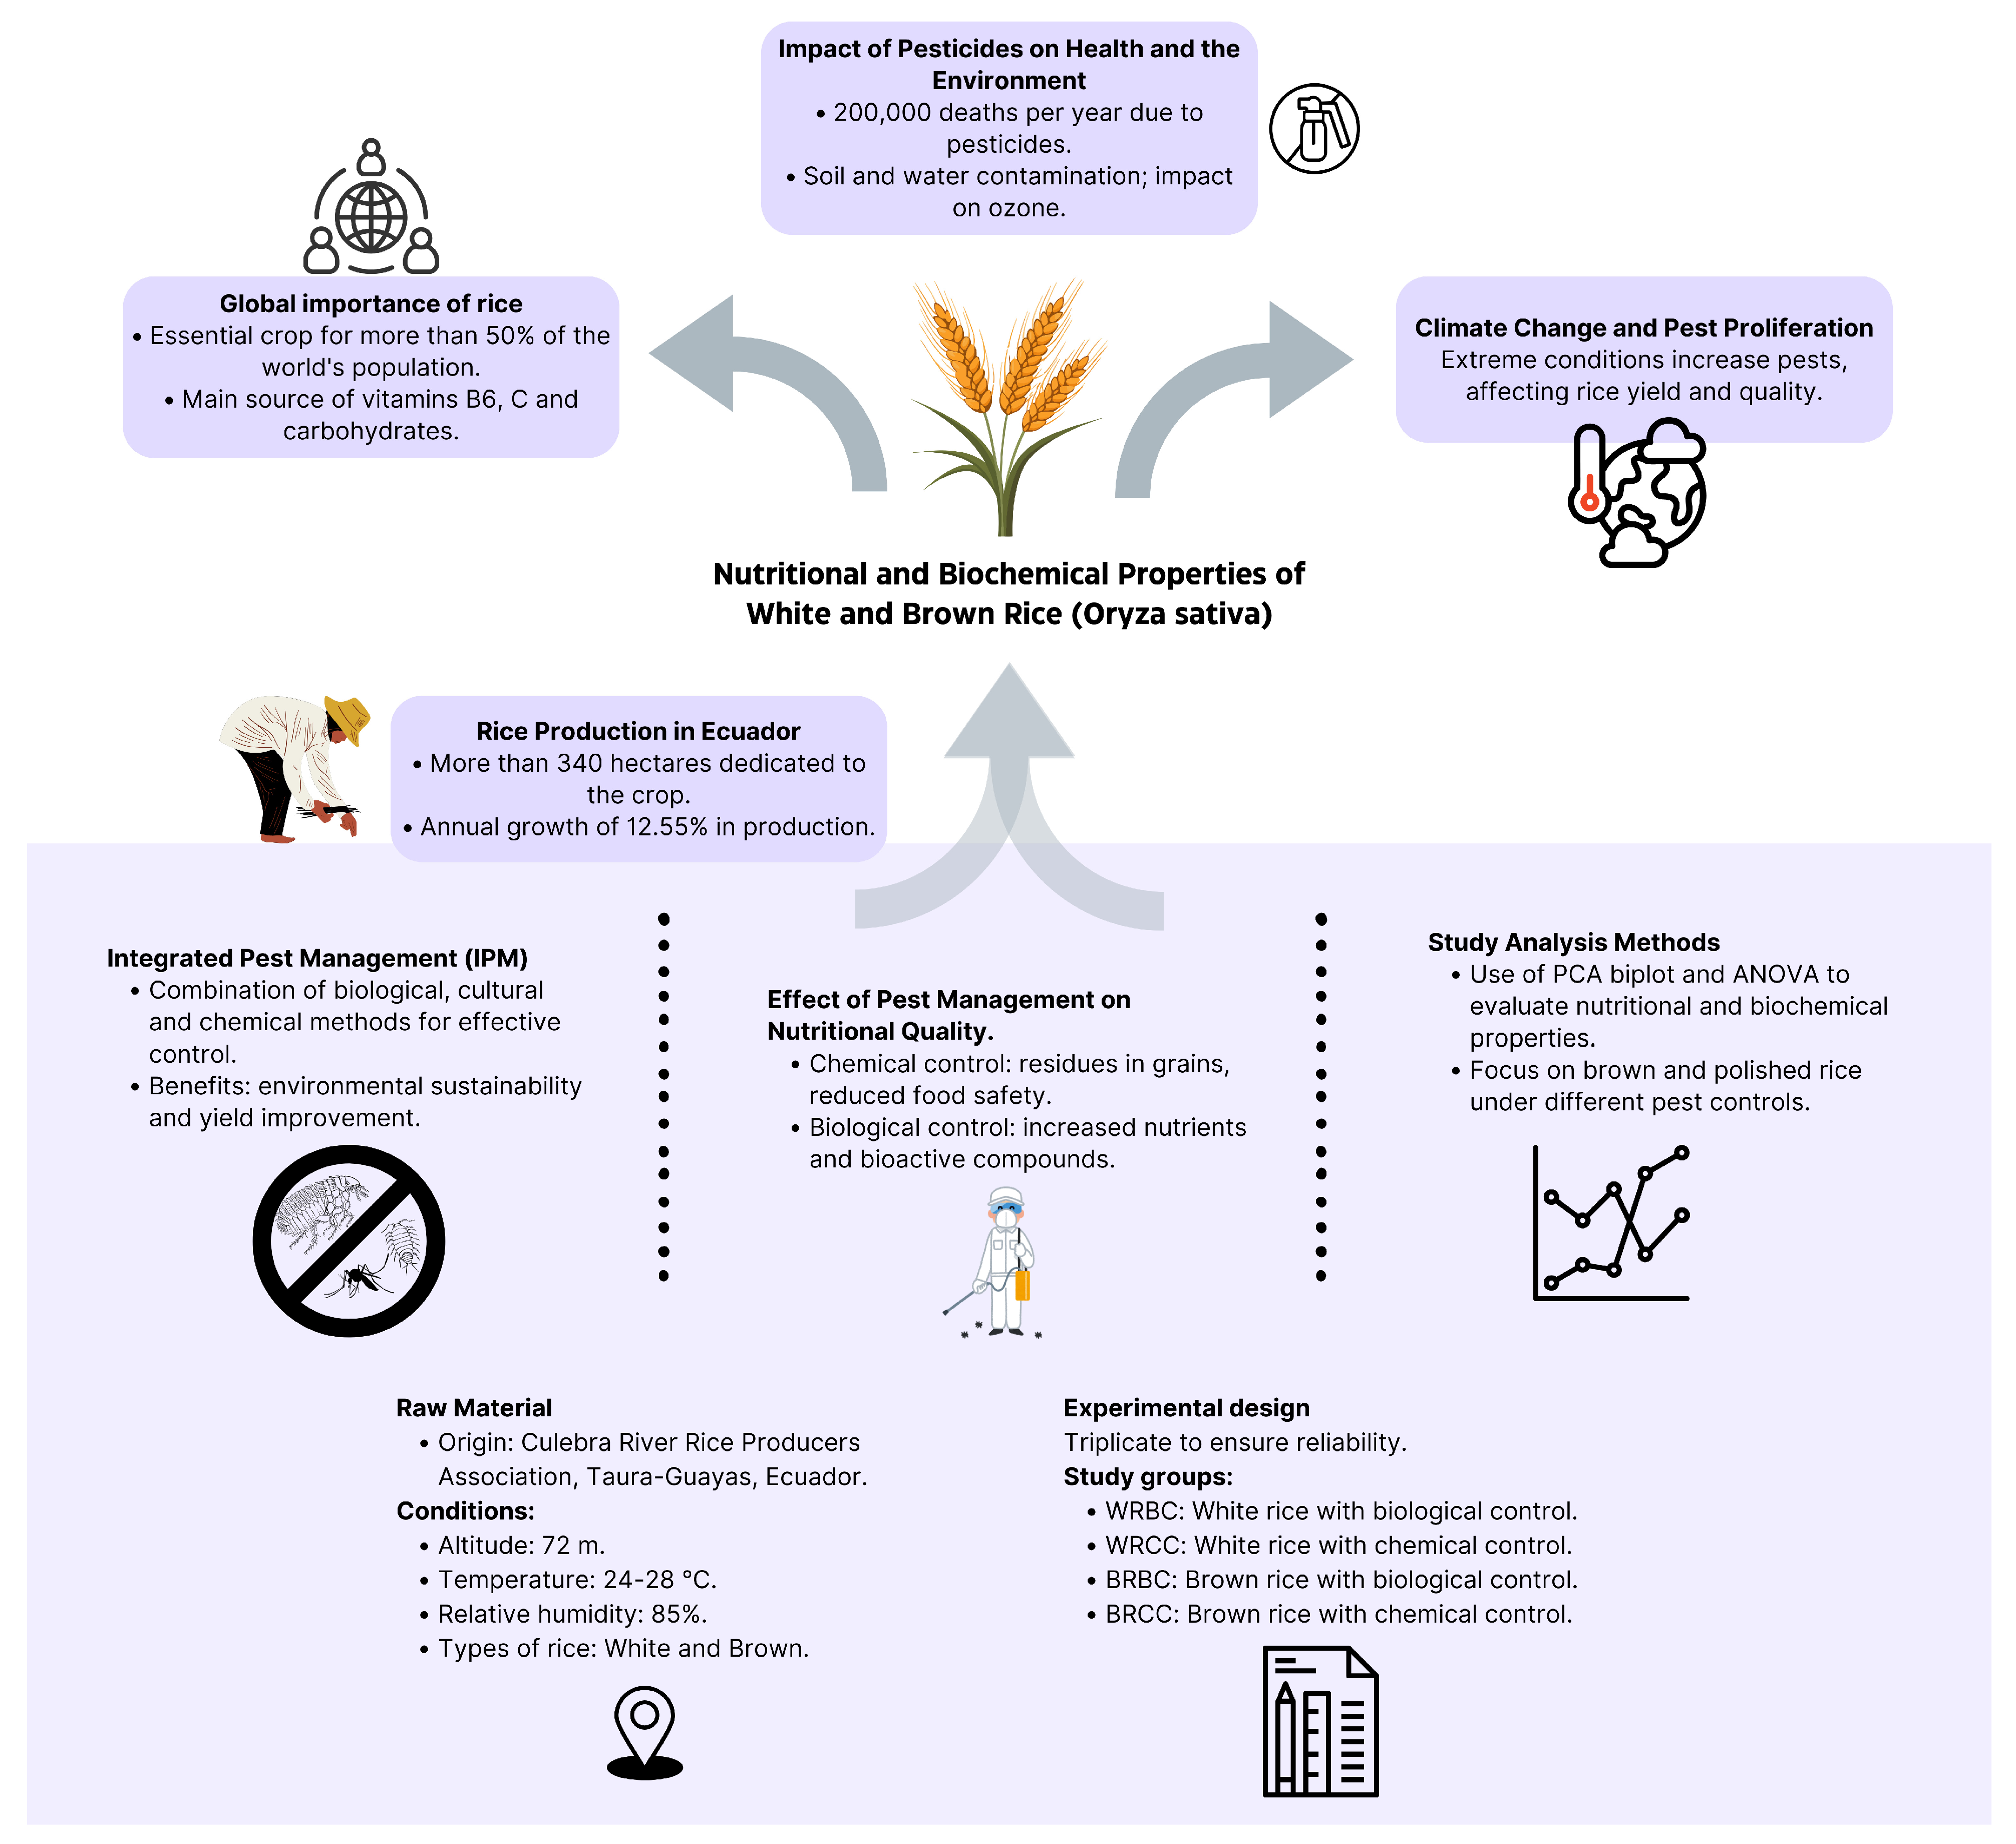
1. Introduction
2. Materials and Methods
2.1. Raw Materials
2.2. Experimental Design
- WRBC: White Rice—Biological Control.
- WRCC: White Rice—Chemical Control.
- BRBC: Brown Rice—Biological Control.
- BRCC: Brown Rice—Chemical Control.
2.3. Sample Preparation
2.4. Total Phenolic Compounds (TPC)
2.5. Antioxidant Activity (AA)
2.6. Gamma-Oryzanol (γ-Oryzanol)
2.7. Phytic Acid (PA)
2.8. Total Dietary Fiber (TDF)
- R1 = Weight of residue 1 from m1;
- R2 = Weight of residue 2 from m2;
- m1 = Weight of sample 1;
- m2 = Weight of sample 2;
- A = Weight of ash from R1;
- p = Protein weight from R2.
- BR = Blank residue;
- BA = Blank ash from BR2;
- BP = Blank protein from BR1.
2.9. Heavy Metals
2.10. Statistical Analysis
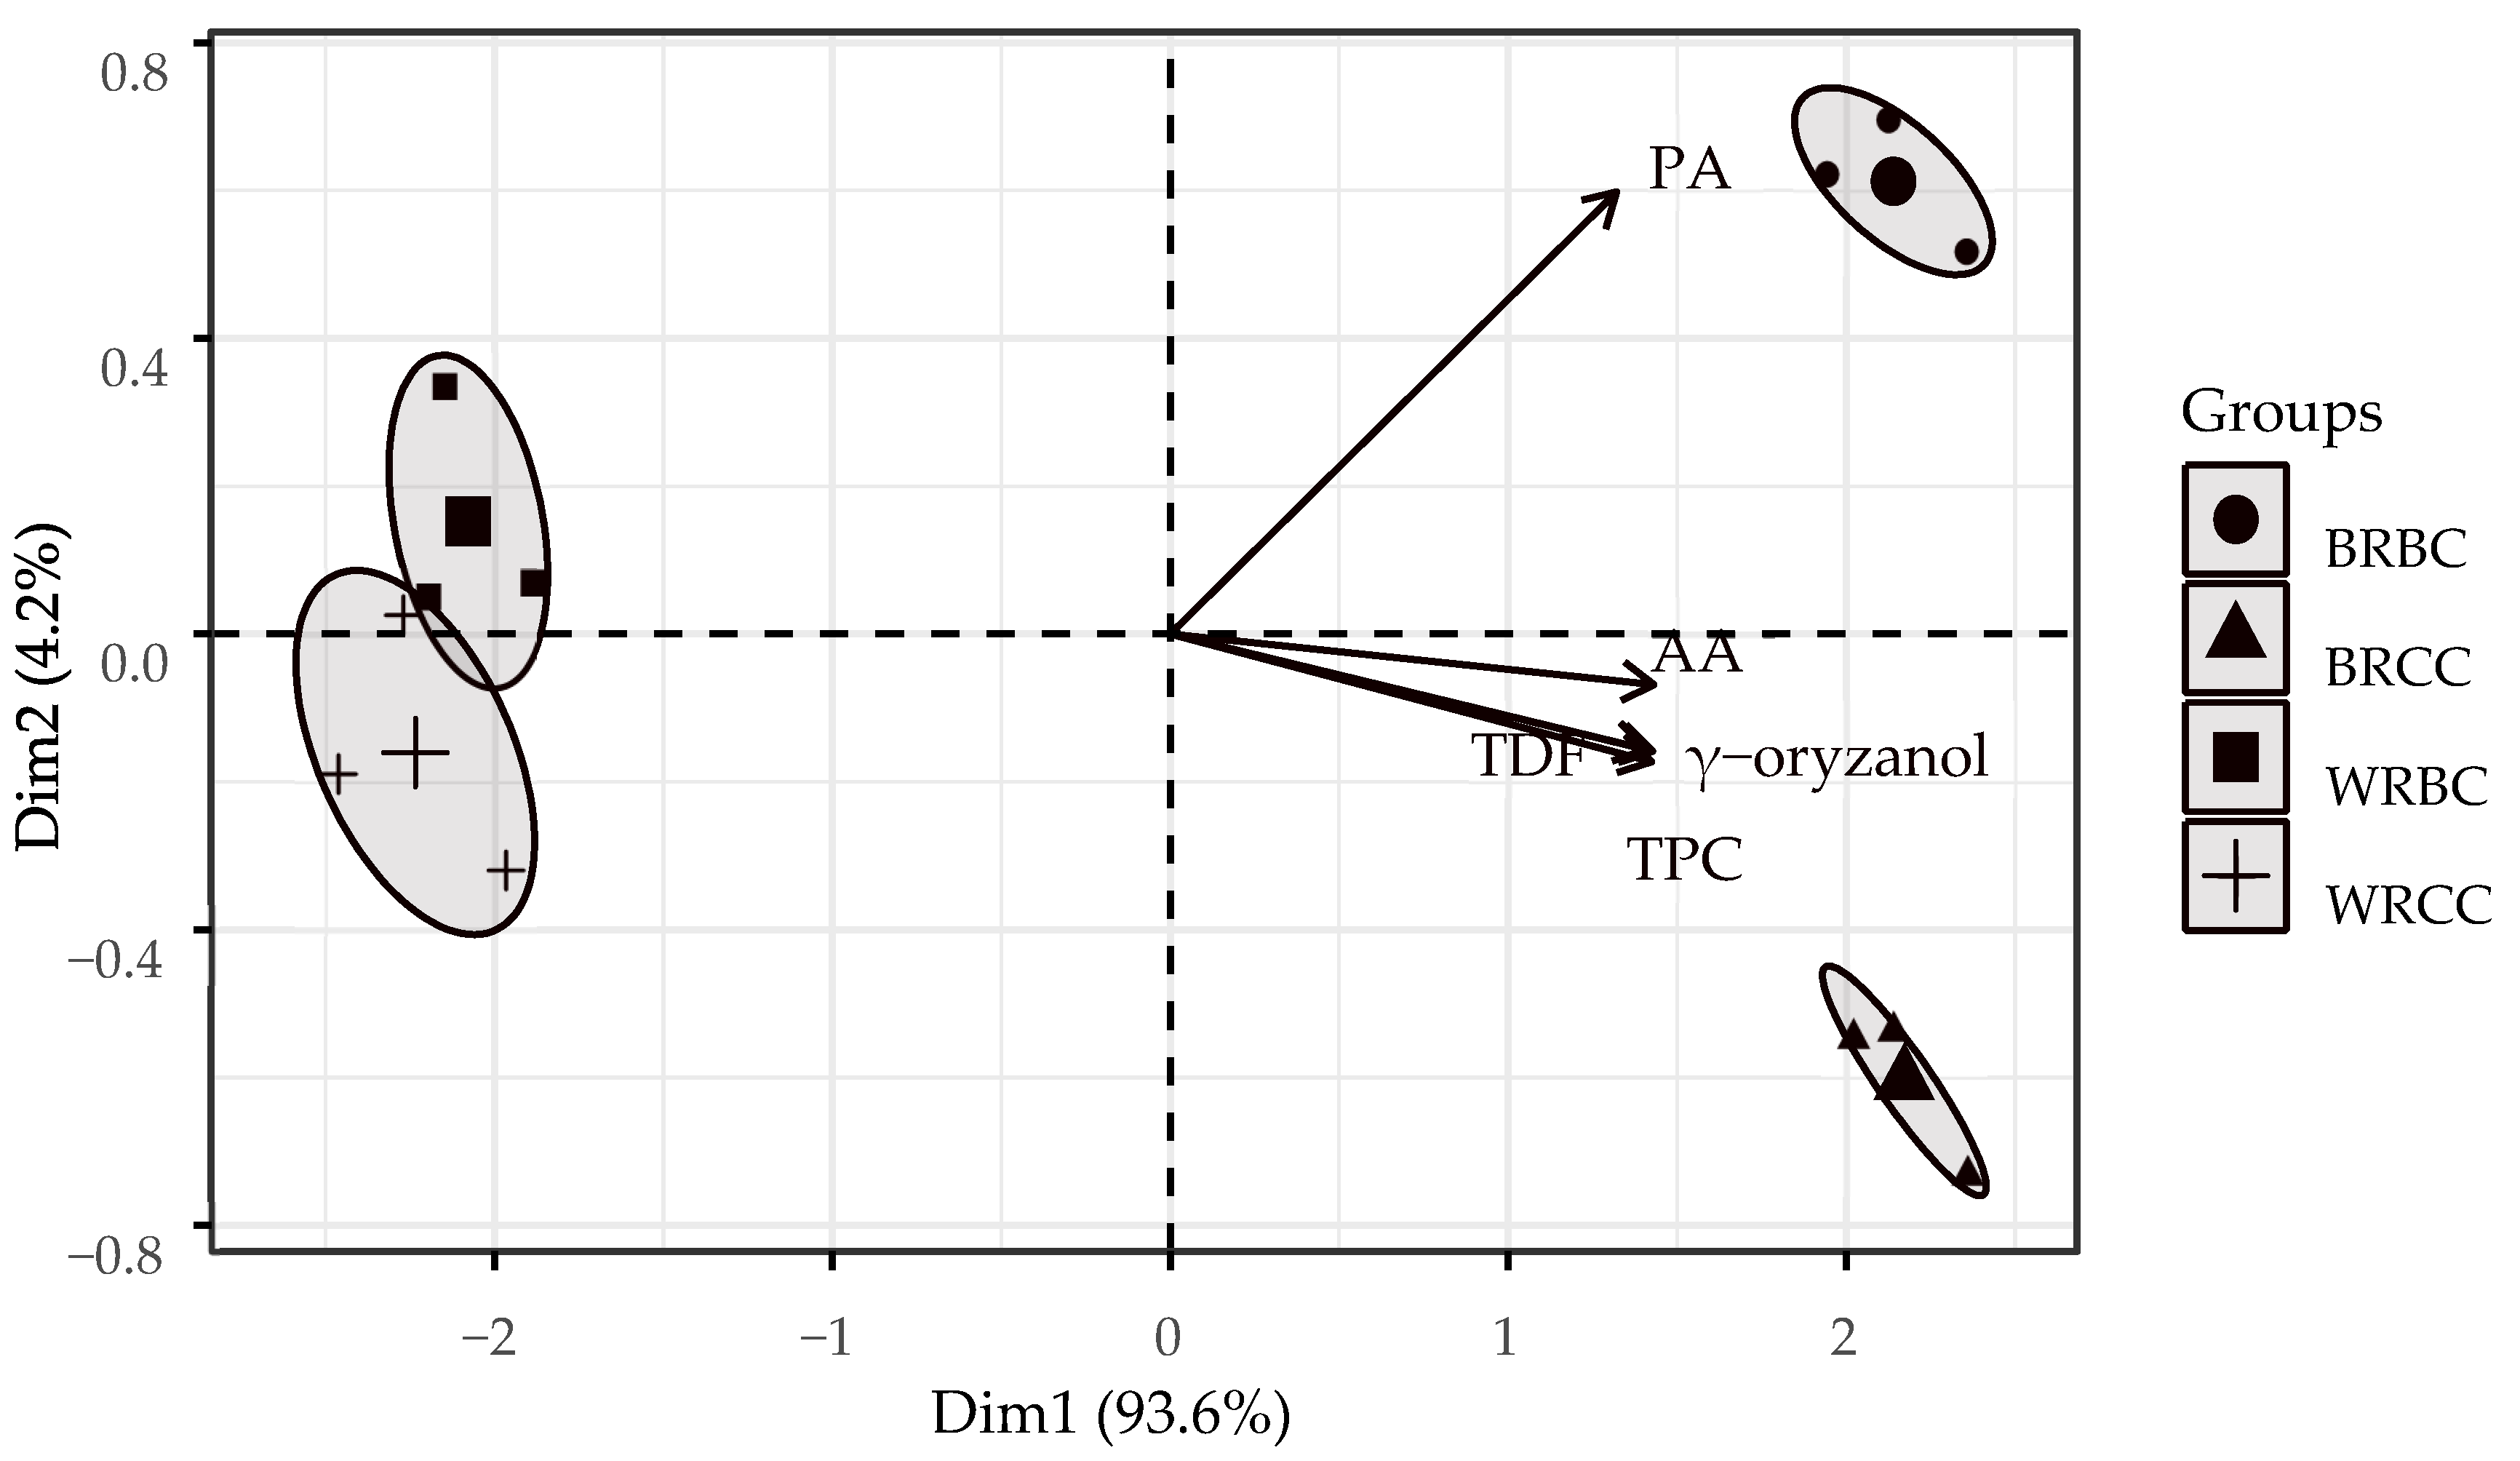
PCA Biplot Analysis
- is the original data matrix that we want to reduce in dimensionality.
- represents the singular value decomposition (SVD) of the matrix X.
- is the eigenvector matrix (or principal components) of the rows of X.
- is a diagonal matrix with the singular values.
- is the eigenvector matrix of the columns of X.
- is a submatrix of U, containing only the first q eigenvectors.
- is a weighted version of the diagonal matrix of singular values , adjusted by a parameter p. This parameter p allows control over how the singular values in the matrix are weighted.
- = is a submatrix of V, which also contains the first q eigenvectors.
- is the singular value matrix adjusted by the complementary parameter 1 − p. This is used to balance the weighting of the singular values in the matrix
3. Results and Discussion
3.1. Analysis of the Chemical and Biological Characteristics of the Grains
3.2. Heavy Metals
3.3. PCA Analysis
3.4. Evaluation of Key Rice Traits and Their Relationship to Pest Control Methods
- Phenolic compounds: Chosen for their role in the plant’s defense against stress caused by pests and for their antioxidant capacity. In addition, they are relevant indicators of the nutritional quality of rice in agricultural contexts [29].
- Dietary fiber: Analysis of dietary fiber allows the identification of possible effects of control methods on the structure and composition of this macronutrient essential for digestive health [30].
- Gamma oryzanol: Recognized for its antioxidant properties and potential health benefits, such as cholesterol reduction, this compound is sensitive to agricultural practices and environmental conditions [31].
- Phytic acid: Important for its function as phosphorus storage and its role as an anti-nutrient, its concentration varies according to the treatments used [29].
- Dietary fiber: Its analysis allows the identification of possible effects of control methods on the structure and composition of this macronutrient essential for digestive health [30].
- Gamma oryzanol: Recognized for its antioxidant properties and potential health benefits, such as cholesterol reduction, this compound is sensitive to agricultural practices and environmental conditions [31].
- Phytic acid: Important for its function as phosphorus storage and its role as an anti-nutrient, its concentration varies according to the treatments used [29].
- Antioxidant activity: Indicator of how control methods affect the ability of rice to counteract oxidative damage, an essential factor in the preservation of its nutritional quality [29].
3.5. Metabolic Changes Associated with Pest Control Methods
- Phenolic compounds: Biological control promotes phenol synthesis by activating the shikimic acid pathway, strengthening plant defenses and antioxidant capacity. In contrast, chemical methods tend to inhibit these responses by reducing the natural stimuli that activate these metabolic pathways [29].
- Phytic acid: Biological treatments enhance the interaction with soil microorganisms, optimizing nutrient uptake and favoring the accumulation of this compound. On the other hand, chemical pesticides can alter its synthesis by interfering with enzymatic processes related to phosphorus metabolism [32].
- Antioxidant activity: Biological controls stimulate systemic acquired defense responses (SARs), which enhances the presence of antioxidant compounds such as phenols and flavonoids. However, chemical control may limit these responses by reducing plant interaction with environmental factors that activate these natural mechanisms [29].
4. Limitations and Future Perspectives
- Limitations:
- The sample size and number of field sites may be somewhat limited; however, the study employs a robust bifactorial design with replications to ensure reliability.
- The focus of the study does not include nutritional markers, such as vitamins (B and E), essential minerals (iron and zinc), and amino acid profiles; however, it prioritized key bioactive compounds, such as total phenolic compounds and gamma-oryzanol.
- The analyses focused on plots located in one province of Ecuador, providing a valuable local perspective.
- Future Perspectives:
- The sample and field sites should be expanded, incorporating different growing areas and environmental conditions. This would allow analysis of variability associated with external factors and improve the representativeness of the findings.
- Analysis of vitamins, minerals, and amino acid profiles should be included in future studies to provide a more complete assessment of the impact of pest control methods on the functional and nutritional quality of rice.
- The geographical scope of the study should be expanded to rice cropping systems in different regions of the country, evaluating variations in the biochemical and nutritional composition of rice according to specific edaphic and climatic characteristics.
5. Conclusions
Author Contributions
Funding
Institutional Review Board Statement
Informed Consent Statement
Data Availability Statement
Acknowledgments
Conflicts of Interest
References
- FAOSTAT. FAO Statistics Database on the World Wide Web. FAOSTAT. 2019. Available online: http://www.fao.org/faostat/en/#data/QC/visualize (accessed on 12 June 2024).
- Al-hashimi, A.M. A Review: Growing Rice in the Controlled Environments. Biosci. Biotechnol. Res. Asia 2023, 20, 13–28. [Google Scholar] [CrossRef]
- Orbe, D.; Cuichán, M. Encuesta de Superficie y Producción Agropecuaria Continua; INEC (Instituto Nacional de Estadística y Censos): Quito, Ecuador, 2022; pp. 2–14. [Google Scholar]
- Jung, T.-D.; Shin, G.-H.; Kim, J.-M.; Choi, S.-I.; Lee, J.-H.; Lee, S.J.; Park, S.J.; Woo, K.S.; Oh, S.K.; Lee, O.-H. Comparative analysis of γ-oryzanol, β-glucan, total phenolic content and antioxidant activity in fermented rice bran of different varieties. Nutrients 2017, 9, 571. [Google Scholar] [CrossRef] [PubMed]
- Mao, C.; Song, Y.; Chen, L.; Ji, J.; Li, J.; Yuan, X.; Yang, Z.; Ayoko, G.A.; Frost, R.L.; Theiss, F. Human health risks of heavy metals in paddy rice based on transfer characteristics of heavy metals from soil to rice. Catena 2019, 175, 339–348. [Google Scholar] [CrossRef]
- Ngegba, P.M.; Cui, G.; Khalid, M.Z.; Zhong, G. Use of Botanical Pesticides in Agriculture as an Alternative to Synthetic Pesticides. Agriculture 2022, 12, 600. [Google Scholar] [CrossRef]
- El Cambio Climático Favorece la Propagación de Plagas Que Destruyen Los Cultivos. Available online: https://news.trust.org/item/20210602151218-6e6zv (accessed on 18 November 2022).
- Shang, H.; He, D.; Li, B.; Chen, X.; Luo, K.; Li, G. Environmentally Friendly and Effective Alternative Approaches to Pest Management: Recent Advances and Challenges. Agronomy 2024, 14, 1807. [Google Scholar] [CrossRef]
- Liang, X.; Liao, G.; Li, J.; Fan, W.; Liu, Y.; Wang, S.; Chen, L.; Wang, Y.; Liu, J. Exogenous ABA promotes resistance to Sitobion avenae (Fabricius) in rice seedlings. Pest. Manag. Sci. 2024, 80, 3389–3400. [Google Scholar] [CrossRef] [PubMed]
- Longkumer, I.Y.; Ahmad, M.A.; Choudhary, S.; Laichattiwar, M.A.; Bajia, R. Validation of Integrated Pest Management Modules against Piercing and Sucking Insect Pest of Rice. Agric. Sci. Dig. 2024, 44, 351–354. [Google Scholar] [CrossRef]
- Alam, M.Z.; Haque, M.M.; Islam, M.S.; Hossain, E.; Hasan, S.B.; Hasan, S.B.; Hossain, M.S. Comparative Study of Integrated Pest Management and Farmers Practices on Sustainable Environment in the Rice Ecosystem. Int. J. Zool. 2016, 2016, 7286040. [Google Scholar] [CrossRef]
- Afzal, F.; Khurshid, R.; Ashraf, M.; Gul Kazi, A. Reactive Oxygen Species and Antioxidants in Response to Pathogens and Wounding. In Oxidative Damage to Plants: Antioxidant Networks and Signaling; Elsevier Inc.: Amsterdam, The Netherlands, 2014; pp. 397–424. [Google Scholar]
- Khandayataray, P.; Murthy, M.K.; Samal, D.; Gurusubramanian, G. Sustainable Integrated Pest Management using Pheromones: Types, Synthesis, Mechanism of Action and Applications. Research Journal of Biotechnology. World Res. Assoc. 2024, 19, 140–157. [Google Scholar]
- Abubakar, Y.; Tijjani, H.; Egbuna, C.; Adetunji, C.O.; Kala, S.; Kryeziu, T.L.; Ifemeje, J.C.; Patrick-Iwuanyanwu, K.C. Pesticides, history, and classification. In Natural Remedies for Pest, Disease and Weed Control; Elsevier: Amsterdam, The Netherlands, 2019; pp. 29–42. [Google Scholar]
- Zimmerer, K.S.; Vanek, S.J.; Baumann, M.D.; van Etten, J. Global modeling of the socioeconomic, political, and environmental relations of farmer seed systems (FSS): Spatial analysis and insights for sustainable Development. Elementa 2023, 11, 00069. [Google Scholar] [CrossRef]
- Adeyi, A.A.; Babalola, B.; Akpotu, S.O. Occurrence, distribution, and risk of organochlorine pesticides in food and greenness assessment of method. Environ. Sci. Pollut. Res. 2021, 28, 33433–33444. [Google Scholar] [CrossRef] [PubMed]
- Varatharaju, G.; Nithya, K.; Suresh, P.; Rekha, M.; Balasubramanian, N.; Gomathinayagam, S.; Manoharan, P.T.; Shanmugaiah, V. Biocontrol properties and functional characterization of rice rhizobacterium Pseudomonas sp. VsMKU4036. J. Pure Appl. Microbiol. 2020, 14, 1545–1556. [Google Scholar] [CrossRef]
- Chandio, A.A.; Gokmenoglu, K.K.; Ahmad, M.; Jiang, Y. Towards Sustainable Rice Production in Asia: The Role of Climatic Factors. Earth Syst. Environ. 2022, 6, 1–14. [Google Scholar] [CrossRef]
- Didawat, R.K.; Sharma, V.K.; Nath, D.J.; Patra, A.; Kumar, S.; Biswas, D.R.; Chobhe, K.A.; Bandyopadhyay, K.K.; Trivedi, A.; Chopra, I.; et al. Soil biochemical properties and nutritional quality of rice cultivated in acidic inceptisols using long-term organic farming practices. Arch. Agron. Soil Sci. 2023, 69, 1282–1297. [Google Scholar] [CrossRef]
- Gao, H.; Peng, X.; Dai, L.; Li, J.; Yang, Q.; Dou, Z.; Xu, Q. Determination of Soil Cadmium Safety Thresholds for Food Production in a Rice-Crayfish Coculture System. Foods 2022, 11, 571. [Google Scholar] [CrossRef] [PubMed]
- Bilal, S.; Jan, S.S.; Shahid, M.; Asaf, S.; Khan, A.L.; Lubna; Al-Rawahi, A.; Lee, I.-J.; Al-Harrasi, A. Novel Insights into Exogenous Phytohormones: Central Regulators in the Modulation of Physiological, Biochemical, and Molecular Responses in Rice Under Metal(loid) Stress. Metabolites 2023, 13, 1036. [Google Scholar] [CrossRef] [PubMed]
- Kumar, A.; Lal, M.K.; Sahoo, U.; Sahoo, S.K.; Sah, R.P.; Tiwari, R.K.; Kumar, R.; Sharma, S. Combinatorial effect of heat processing and phytic acid on mineral bioavailability in rice grain. Food Chem. Adv. 2023, 2, 100232. [Google Scholar] [CrossRef]
- Saleh, A.S.M.; Wang, P.; Wang, N.; Yang, L.; Xiao, Z. Brown Rice Versus White Rice: Nutritional Quality, Potential Health Benefits, Development of Food Products, and Preservation Technologies. Compr. Rev. Food Sci. Food Saf. 2019, 18, 1070–1096. [Google Scholar] [CrossRef] [PubMed]
- Liu, Z.; Zhang, F.; Gao, S.; Zhang, L.; Fu, Q.; Cui, S. Neonicotinoid insecticides in paddy fields: Dissipation dynamics, migration, and dietary risk. Chemosphere 2024, 359, 142371. [Google Scholar] [CrossRef] [PubMed]
- Oh, S.; Lee, S.; Oh, S.; Cho, H.; Park, S.; Lee, H.; Kim, H.; Yeo, Y. Multivariate analysis for the safety assessment of genetically modified rices in the anti-nutrients and phenolic compounds. Int. J. Food Sci. Technol. 2016, 51, 765–776. [Google Scholar] [CrossRef]
- Tuncel, N.B.; Yilmaz, N. Gamma-oryzanol content, phenolic acid profiles and antioxidant activity of rice milling fractions. Eur. Food Res. Technol. 2011, 233, 577–585. [Google Scholar] [CrossRef]
- Cornejo, F.; Caceres, P.J.; Martínez-Villaluenga, C.; Rosell, C.M.; Frias, J. Effects of germination on the nutritive value and bioactive compounds of brown rice breads. Food Chem. 2015, 173, 298–304. [Google Scholar] [CrossRef] [PubMed]
- Bagchi, T.B.; Chattopadhyay, K.; Sivashankari, M.; Roy, S.; Kumar, A.; Biswas, T.; Pal, S. Effect of different processing technologies on phenolic acids, flavonoids and other antioxidants content in pigmented rice. J. Cereal Sci. 2021, 100, 103263. [Google Scholar] [CrossRef]
- Torino, M.I.; Limón, R.I.; Martínez-Villaluenga, C.; Mäkinen, S.; Pihlanto, A.; Vidal-Valverde, C.; Frias, J. Antioxidant and antihypertensive properties of liquid and solid state fermented lentils. Food Chem. 2013, 136, 1030–1037. [Google Scholar] [CrossRef] [PubMed]
- Cáceres, P.J.; Martínez-Villaluenga, C.; Amigo, L.; Frias, J. Maximising the phytochemical content and antioxidant activity of Ecuadorian brown rice sprouts through optimal germination conditions. Food Chem. 2014, 152, 407–414. [Google Scholar] [CrossRef] [PubMed]
- Srisaipet, A.; Nuddagul, M. Influence of Temperature on Gamma-Oryzanol Stability of Edible Rice Bran Oil During Heating. Int. J. Chem. Eng. Appl. 2014, 5, 303–306. [Google Scholar] [CrossRef]
- Reichwald, K.; Hatzack, F. Application of a modified Haug and Lantzsch method for the rapid and accurate photometrical phytate determination in soybean, wheat, and maize meals. J. Agric. Food Chem. 2008, 56, 2888–2891. [Google Scholar] [CrossRef] [PubMed]
- Gabriel, K.R. The biplot graphic display of matrices with application to principal component analysis. Biometrika 1971, 58, 453–467. [Google Scholar] [CrossRef]
- Galindo-Villardón, P. Una Alternativa de Representación Simultánea: HJ-Biplot. Qüestiió Quad. D’estadística I Investig. Oper. 1986, 10, 13–23. [Google Scholar]
- Lupotto, E.; Valè, G. Value of Wholegrain Rice in a Healthy Human Nutrition. Agriculture 2021, 11, 720. [Google Scholar] [CrossRef]
- Pramitha, J.L.; Rana, S.; Aggarwal, P.R.; Ravikesavan, R.; Joel, A.J.; Muthamilarasan, M. Diverse role of phytic acid in plants and approaches to develop low-phytate grains to enhance bioavailability of micronutrients. Adv. Genet. 2021, 107, 89–120. [Google Scholar] [PubMed]
- Biswas, S.; Sircar, D.; Mitra, A.; De, B. Phenolic constituents and antioxidant properties of some varieties of Indian rice. Nutr. Food Sci. 2011, 41, 123–135. [Google Scholar] [CrossRef]
- Naseri, M.; Vazirzadeh, A.; Kazemi, R.; Zaheri, F. Concentration of some heavy metals in rice types available in Shiraz market and human health risk assessment. Food Chem. 2015, 175, 243–248. [Google Scholar] [CrossRef] [PubMed]
- Abtahi, M.; Fakhri, Y.; Oliveri Conti, G.; Keramati, H.; Zandsalimi, Y.; Bahmani, Z.; Pouya, R.H.; Sarkhosh, M.; Moradi, B.; Amanidaz, N.; et al. Heavy metals (As, Cr, Pb, Cd and Ni) concentrations in rice (Oryza sativa) from Iran and associated risk assessment: A systematic review. Toxin Rev. 2017, 36, 331–341. [Google Scholar] [CrossRef]

| Source of Variation | Total Phenolic Compounds (mg Eq. AG/100 g) | Total Dietary Fiber (%) | γ-Oryzanol (mg Eq. γ-Oryzanol/100 g) | Phytic Acid (mg Eq. Phytic Acid/g) | Antioxidant Activity (mM Eq. Trolox/100 g) | |
|---|---|---|---|---|---|---|
| ANOVA | Rice | 6307 *** | 17.618 ** | 2367.9 *** | 2324.70 *** | 10,572,703 *** |
| Control | 36 | 0.225 | 12.69 | 352.34 *** | 376 | |
| R × C | 100 · | 0.0006 | 13.26 | 98.55 *** | 83,664 | |
| Residuals | 196 | 0.6322 | 78.43 | 19.36 | 393,824 | |
| R × C | WRBC | 61.16 ± 2.24 A | 1.23 ± 0.18 A | 3.62 ± 2.54 A | 16.11 ± 2.27 A | 1292.98 ± 49.71 A |
| BRBC | 101.23 ± 3.57 a | 3.66 ± 0.50 a | 29.61 ± 3.11 a | 49.68 ± 0.63 a | 3003.28 ± 303.37 a | |
| WRCC | 58.86 ± 7.56 A | 1.11 ± 0.05 A | 3.57 ± 1.19 A | 11.01 ± 1.99 B | 1137.18 ± 116.14 A | |
| BRCC | 111.72 ± 3.65 a | 3.98 ± 0.32 a | 33.77 ± 8.56 a | 33.11 ± 1.57 b | 3199.84 ± 218.26 a | |
| TPC | TDF | γ-Oryzanol | PA | AA | |
|---|---|---|---|---|---|
| TPC | 1 | ||||
| TDF | 0.955 *** | 1 | |||
| γ-oryzanol | 0.97 *** | 0.956 ** | 1 | ||
| PA | 0.846 * | 0.843 * | 0.851 * | 1 | |
| AA | 0.973 *** | 0.941 * | 0.979 *** | 0.876 * | 1 |
| Source | Parameters | Concentration (mg/Kg) |
|---|---|---|
| WRBC | Cadmium (Cd) | <0.30 |
| Arsenic (As) | <0.55 | |
| BRBC | Cadmium (Cd) | <0.30 |
| Arsenic (As) | <0.55 | |
| WRCC | Cadmium (Cd) | <0.30 |
| Arsenic (As) | <0.55 | |
| BRCC | Cadmium (Cd) | <0.30 |
| Arsenic (As) | <0.55 |
Disclaimer/Publisher’s Note: The statements, opinions and data contained in all publications are solely those of the individual author(s) and contributor(s) and not of MDPI and/or the editor(s). MDPI and/or the editor(s) disclaim responsibility for any injury to people or property resulting from any ideas, methods, instructions or products referred to in the content. |
© 2025 by the authors. Licensee MDPI, Basel, Switzerland. This article is an open access article distributed under the terms and conditions of the Creative Commons Attribution (CC BY) license (https://creativecommons.org/licenses/by/4.0/).
Share and Cite
Villamar-Aveiga, M.d.R.; Villamar-Aveiga, C.V.; Ortiz-Mata, J.D.; Valenzuela-Cobos, J.D. Nutritional and Biochemical Characterization of White and Brown Rice (Oryza sativa) Subjected to Different Pest Control Methods. Appl. Sci. 2025, 15, 2190. https://doi.org/10.3390/app15042190
Villamar-Aveiga MdR, Villamar-Aveiga CV, Ortiz-Mata JD, Valenzuela-Cobos JD. Nutritional and Biochemical Characterization of White and Brown Rice (Oryza sativa) Subjected to Different Pest Control Methods. Applied Sciences. 2025; 15(4):2190. https://doi.org/10.3390/app15042190
Chicago/Turabian StyleVillamar-Aveiga, Mónica del Rocío, Carla Verónica Villamar-Aveiga, Jhonny Darwin Ortiz-Mata, and Juan Diego Valenzuela-Cobos. 2025. "Nutritional and Biochemical Characterization of White and Brown Rice (Oryza sativa) Subjected to Different Pest Control Methods" Applied Sciences 15, no. 4: 2190. https://doi.org/10.3390/app15042190
APA StyleVillamar-Aveiga, M. d. R., Villamar-Aveiga, C. V., Ortiz-Mata, J. D., & Valenzuela-Cobos, J. D. (2025). Nutritional and Biochemical Characterization of White and Brown Rice (Oryza sativa) Subjected to Different Pest Control Methods. Applied Sciences, 15(4), 2190. https://doi.org/10.3390/app15042190