
Detection of Welding Defects Tracked by YOLOv4 Algorithm

Abstract
1. Introduction
2. YOLOv4 Algorithm
3. Algorithm Improvement
3.1. k-Means++ Clustering
3.2. Framework Optimization
3.2.1. YOLOv4-cs1
3.2.2. YOLOv4-cs2
4. Experiment
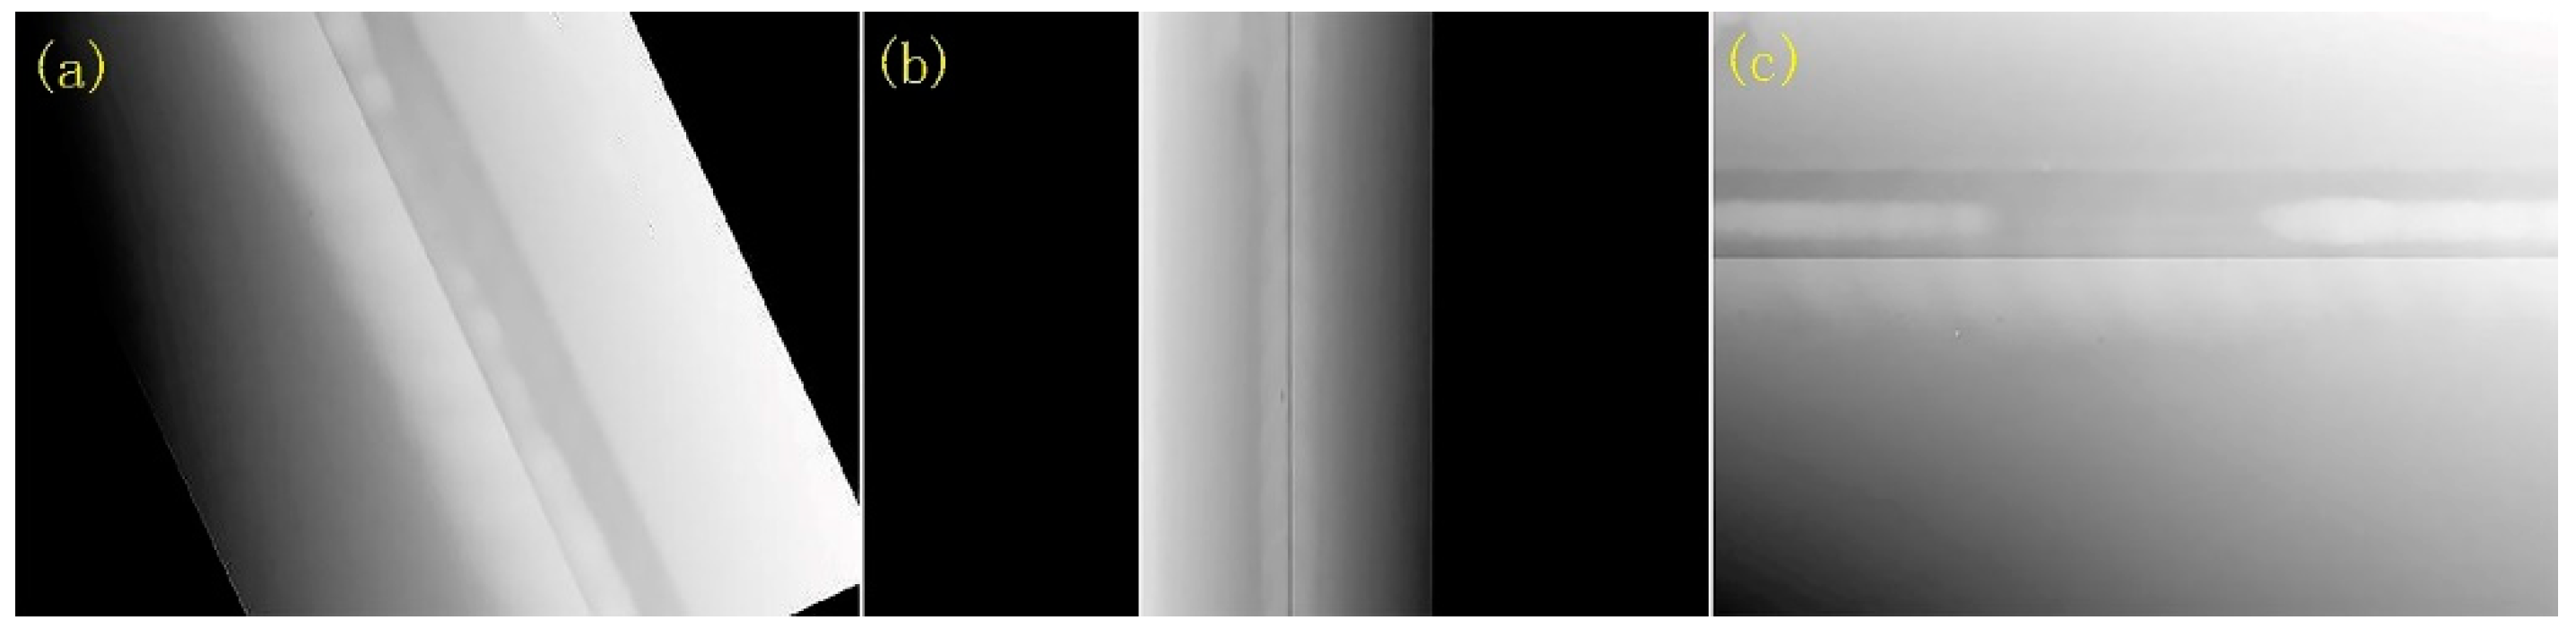
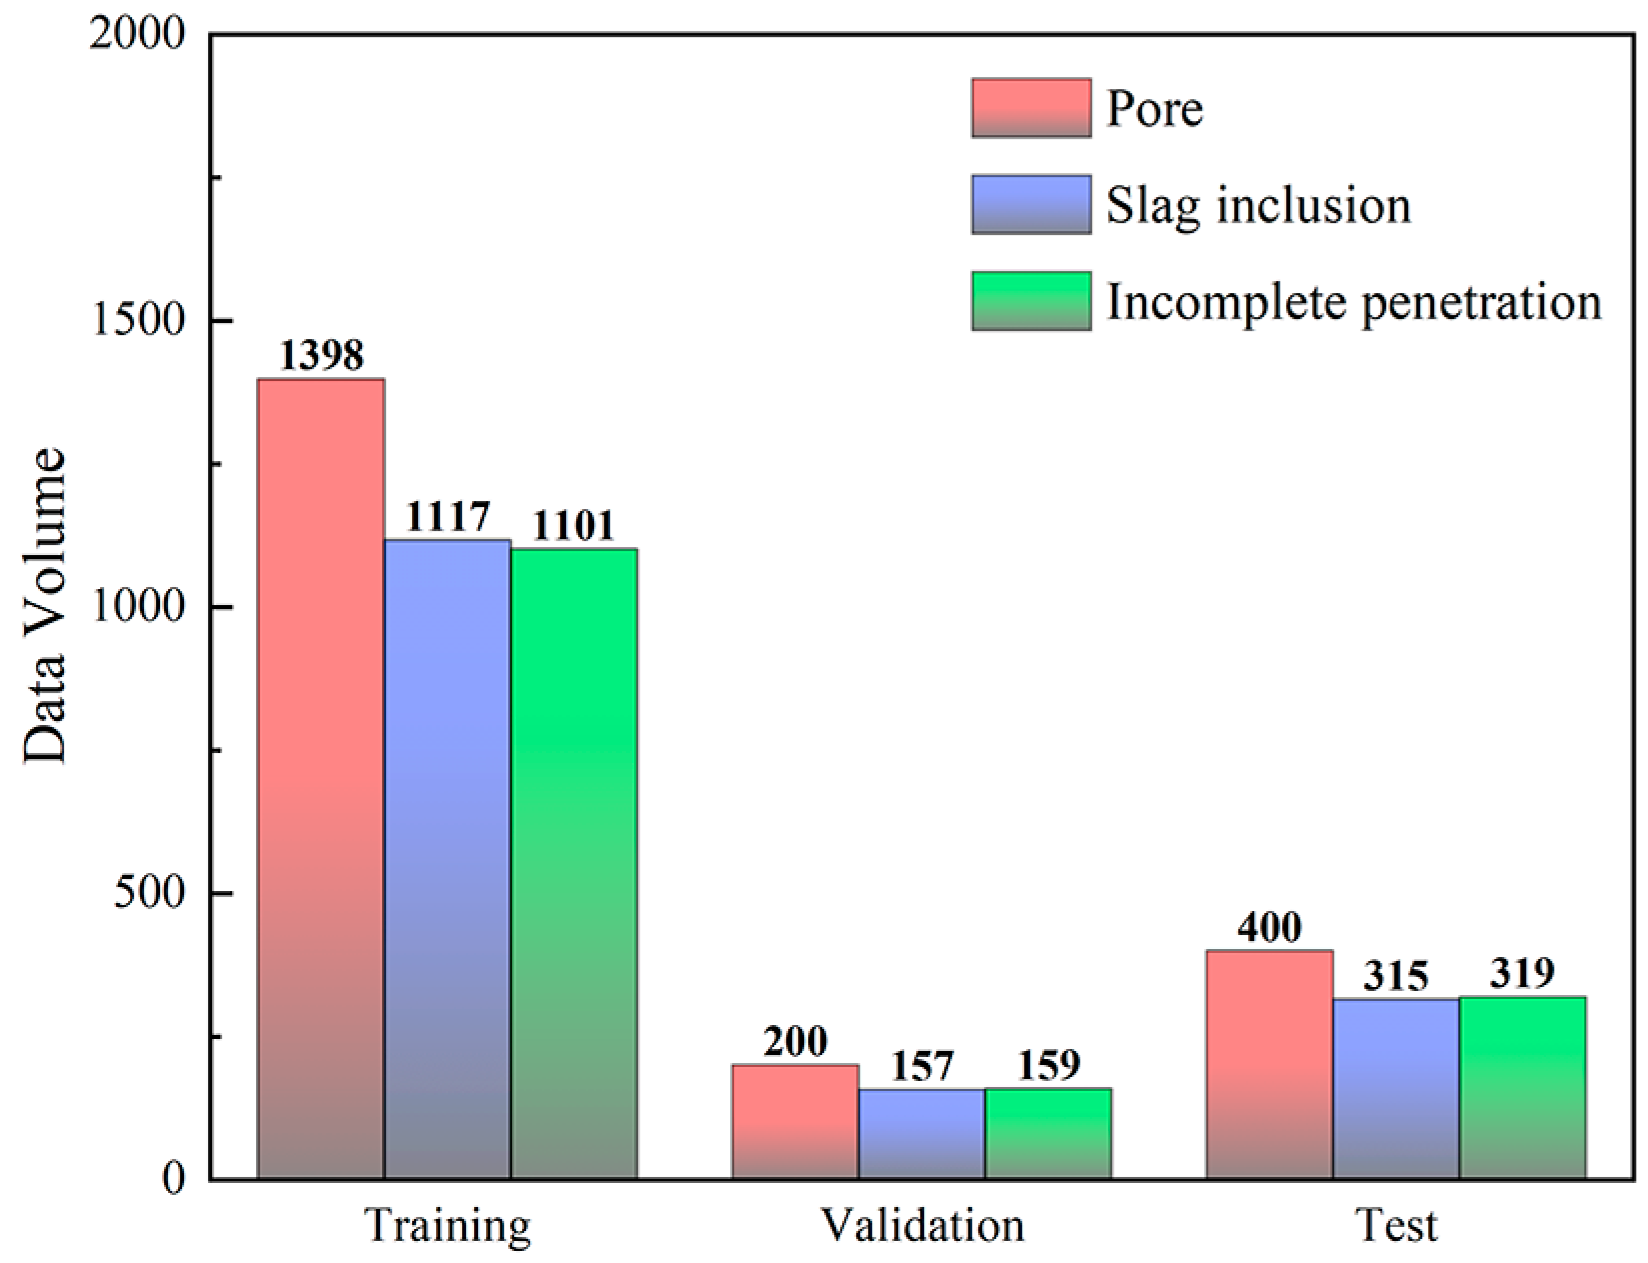
4.1. Dataset
4.2. Hardware Facilities
4.3. Model Training
4.4. Experimental Results and Analysis
4.4.1. Comparison with Other Object Detection Models
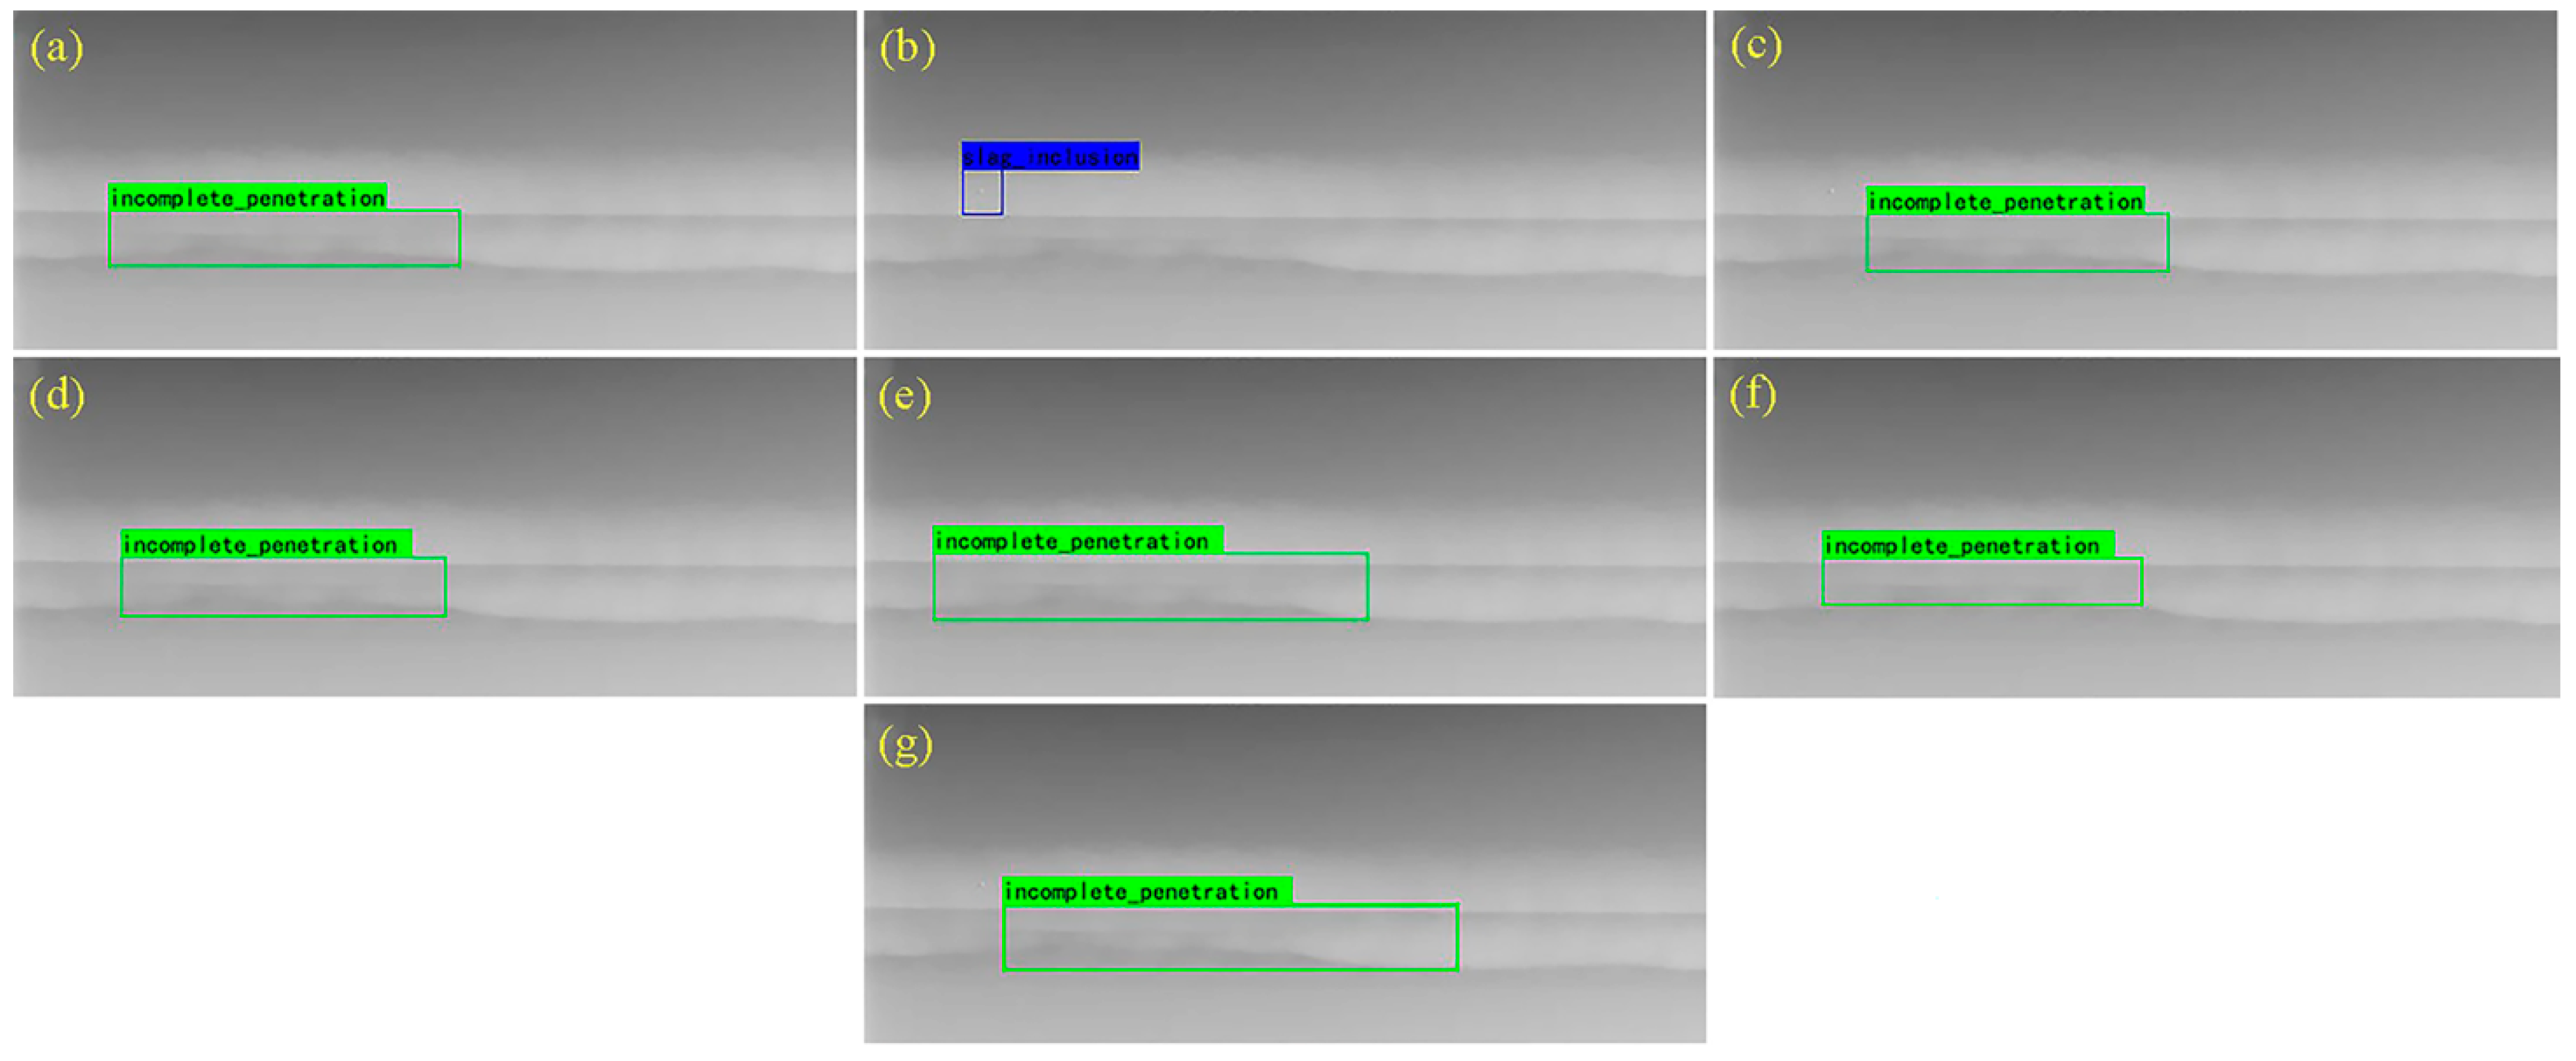
4.4.2. Comparison of Test Results
5. Conclusions
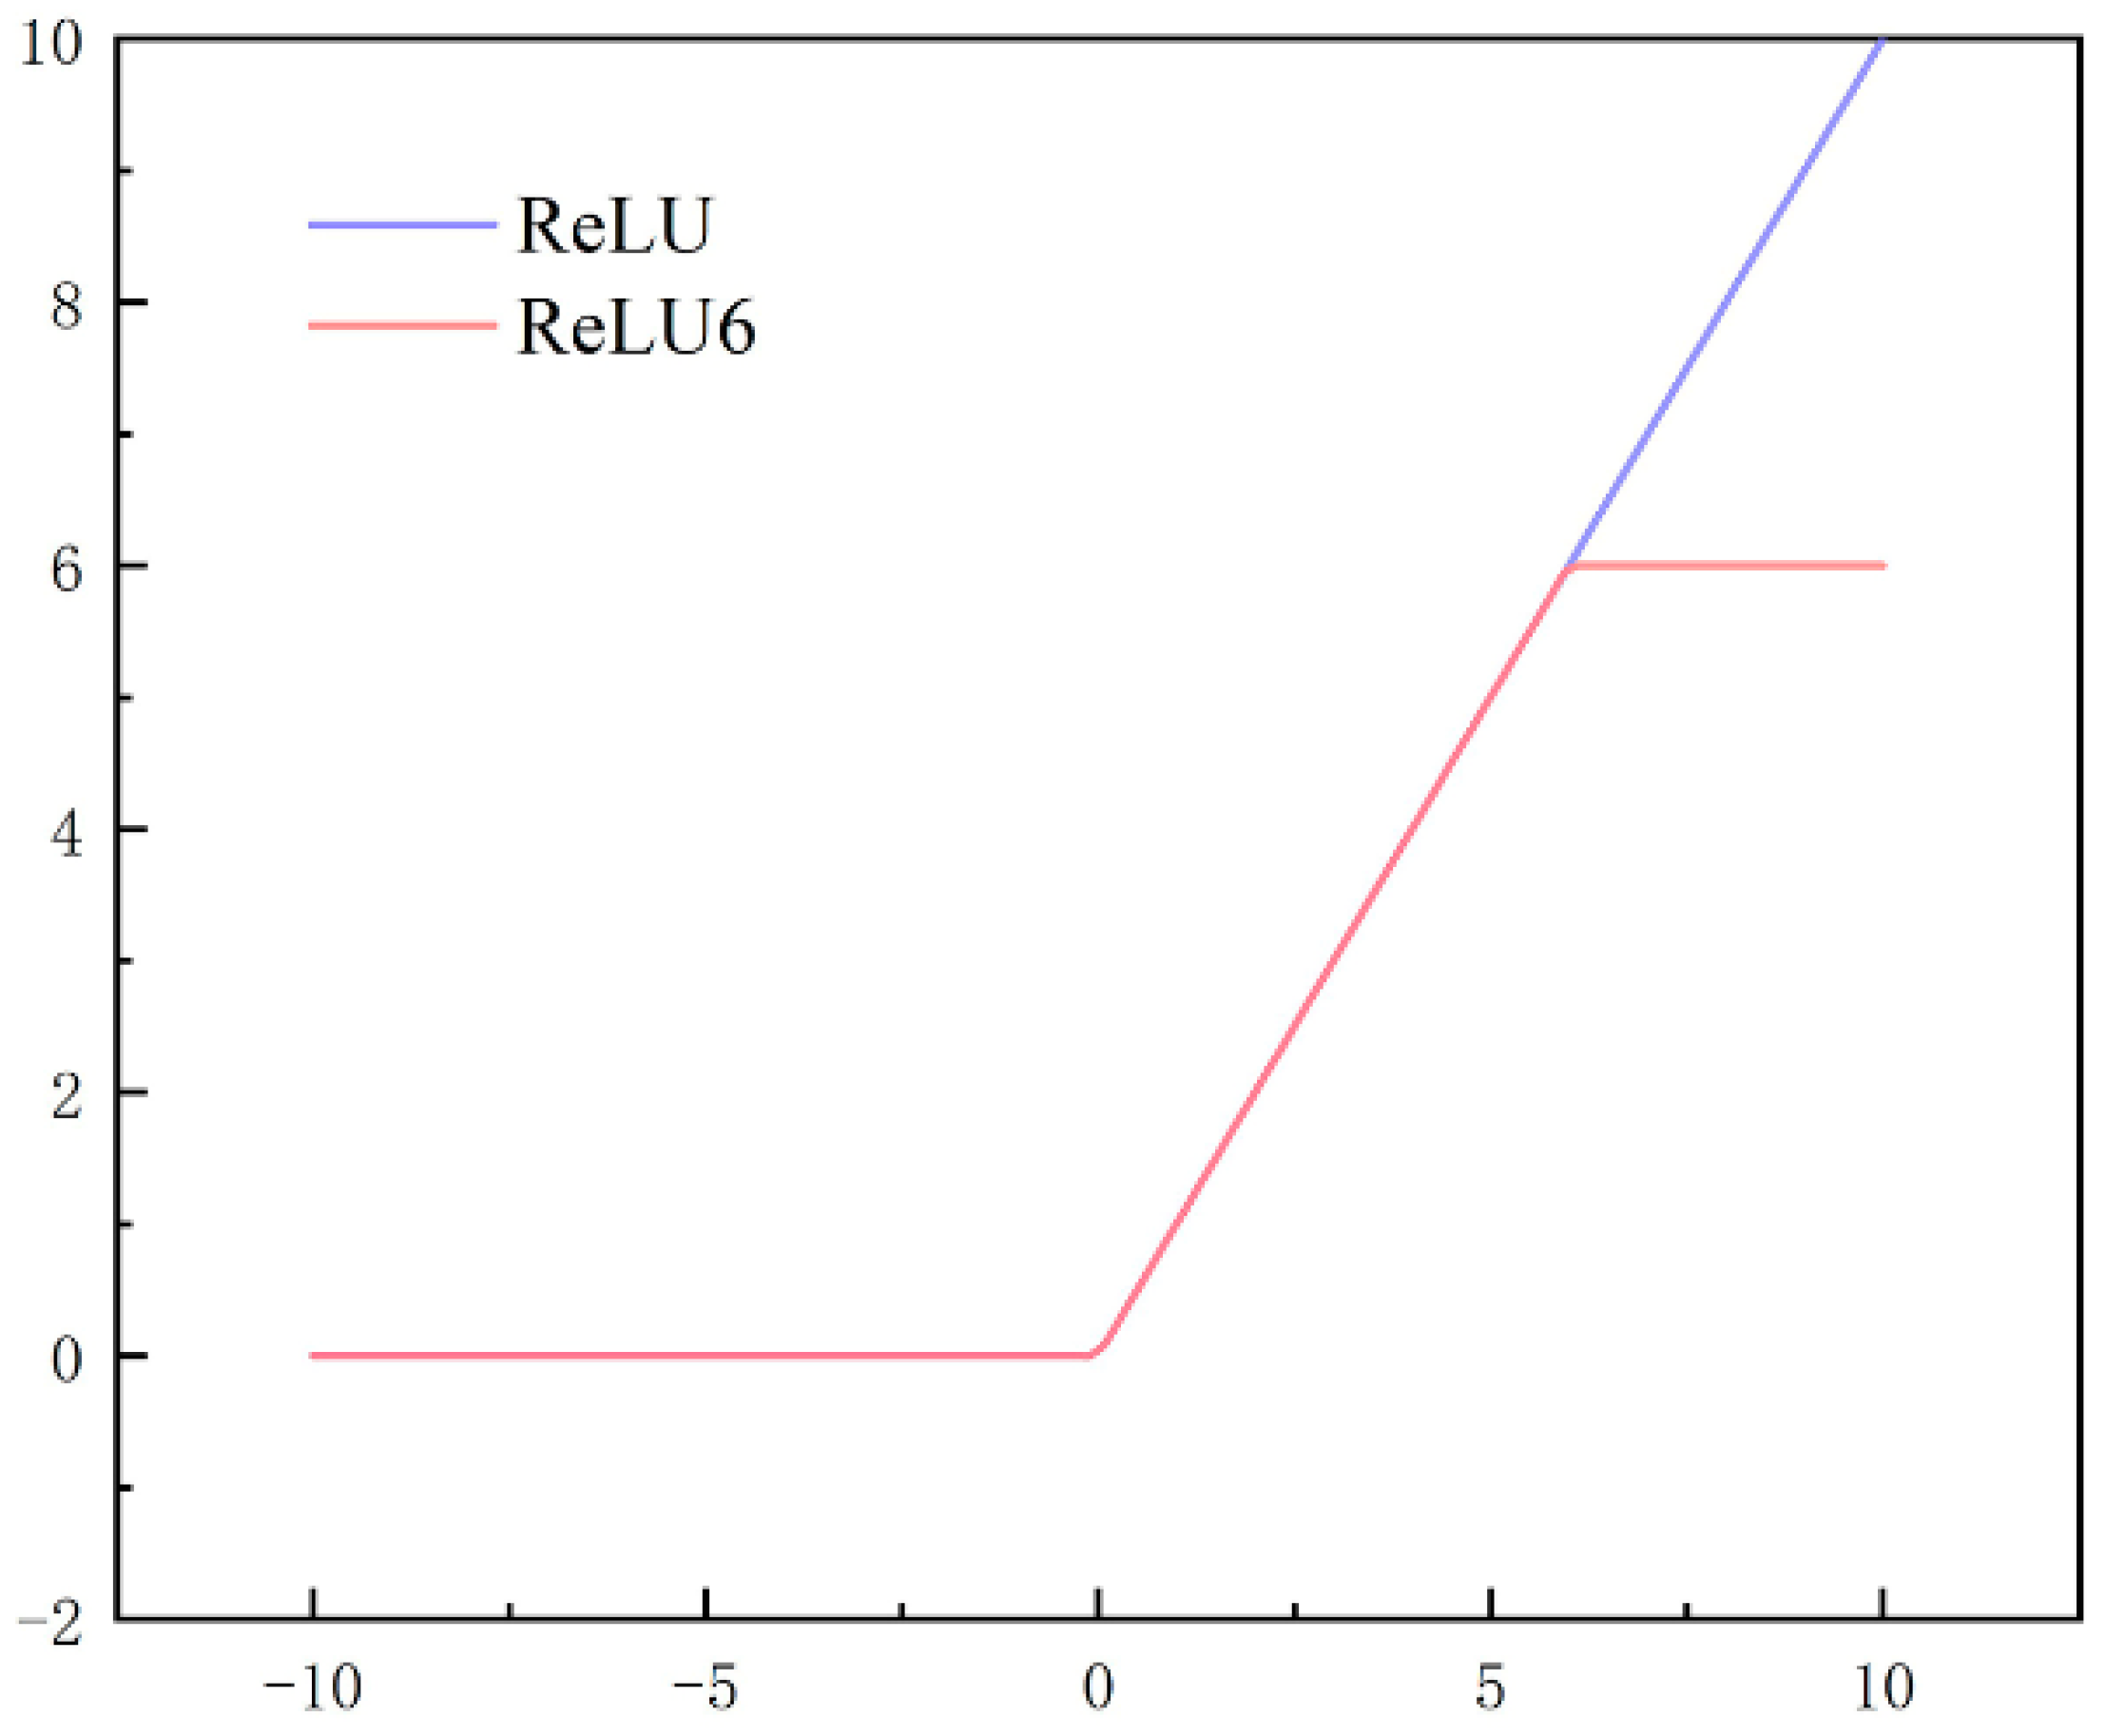
- An improved model, YOLOv4-cs1, is proposed. This model primarily modifies the fusion method involving residual blocks, the feature extraction approach of the PANet network, and the activation functions. As a result, the model can better learn edge information.
- YOLOv4-cs2 further improves upon YOLOv4-cs1. In YOLOv4-cs2, the residual block structures and activation functions corresponding to different convolution kernels are modified to accelerate the learning of rare features. Two SPP (Spatial Pyramid Pooling) modules are added after the third and fourth residual blocks to expand the model’s receptive field.
- The results indicate that the recall rates for pores and slag inclusion are significantly improved in both optimized models, which is attributed to their enhanced ability to learn edge information. In the future, we will continue to focus on designing an advanced intelligent detection system for aluminum alloy weld defects that is aimed at improving the safety and automation of equipment.
Author Contributions
Funding
Institutional Review Board Statement
Informed Consent Statement
Data Availability Statement
Conflicts of Interest
References
- Du, W.; Shen, H.; Fu, J.; Zhang, G.; He, Q. Approaches for improvement of the X-ray image defect detection of automobile casting aluminum parts based on deep learning. NDT E Int. 2019, 107, 102144. [Google Scholar] [CrossRef]
- Arkin, E.; Yadikar, N.; Xu, X.; Aysa, A.; Ubul, K. A survey: Object detection methods from CNN to transformer. Multimed. Tools Appl. 2023, 82, 21353–21383. [Google Scholar] [CrossRef]
- He, K.; Zhang, X.; Ren, S.; Sun, J. Spatial pyramid pooling in deep convolutional networks for visual recognition. IEEE Trans. Pattern Anal. Mach. Intell. 2015, 37, 1904–1916. [Google Scholar] [CrossRef] [PubMed]
- Girshick, R. Fast R-CNN. arXiv 2015, arXiv:1504.08083. [Google Scholar]
- Ren, S. Faster R-CNN: Towards real-time object detection with region proposal networks. arXiv 2015, arXiv:1506.01497. [Google Scholar] [CrossRef] [PubMed]
- Zhou, H.-Y.; Gao, B.-B.; Wu, J. Adaptive feeding: Achieving fast and accurate detections by adaptively combining object detectors. In Proceedings of the 2017 IEEE International Conference on Computer Vision, Venice, Italy, 22–29 October 2017; pp. 3505–3513. [Google Scholar]
- Jiang, P.; Ergu, D.; Liu, F.; Cai, Y.; Ma, B. A review of yolo algorithm developments. Procedia Comput. Sci. 2022, 199, 1066–1073. [Google Scholar] [CrossRef]
- Ross, T.-Y.; Dollár, G. Focal loss for dense object detection. In Proceedings of the 2017 IEEE International Conference on Computer Vision, Venice, Italy, 22–29 October 2017; pp. 2980–2988. [Google Scholar]
- Liu, W.; Anguelov, D.; Erhan, D.; Szegedy, C.; Reed, S.; Fu, C.-Y.; Berg, A.C. SSD: Single shot multibox detector. In Computer Vision–ECCV 2016: 14th European Conference; Springer: Cham, Switzerland, 2016; Part I; pp. 21–37. [Google Scholar]
- Zhao, Z.; He, P. Yolo-mamba: Object detection method for infrared aerial images. Signal Image Video Process 2024, 18, 8793–8803. [Google Scholar] [CrossRef]
- Huang, L.; Wang, Z.; Fu, X. Pedestrian detection using retinanet with multi-branch structure and double pooling attention mechanism. Multimed. Tools Appl. 2024, 83, 6051–6075. [Google Scholar] [CrossRef]
- Biffi, L.J.; Mitishita, E.; Liesenberg, V.; dos Santos, A.A.; Gonçalves, D.N.; Estrabis, N.V.; Silva, J.d.A.; Osco, L.P.; Ramos, A.P.M.; Centeno, J.A.S.; et al. Atss deep learning-based approach to detect apple fruits. Remote Sens. 2020, 13, 54. [Google Scholar] [CrossRef]
- Guo, R.; Liu, H.; Xie, G.; Zhang, Y. Weld defect detection from imbalanced radiographic images based on contrast enhancement conditional generative adversarial network and transfer learning. IEEE Sens. J. 2021, 21, 10844–10853. [Google Scholar] [CrossRef]
- Kumaresan, S.; Aultrin, K.S.J.; Kumar, S.S.; Anand, M.D. Deep learning-based weld defect classification using vgg16 transfer learning adaptive fine-tuning. Int. J. Interact. Des. Manuf. 2023, 17, 2999–3010. [Google Scholar] [CrossRef]
- Ji, C.; Wang, H.; Li, H. Defects detection in weld joints based on visual attention and deep learning. NDT E Int. 2023, 133, 102764. [Google Scholar]
- Liu, M.; Chen, Y.; Xie, J.; He, L.; Zhang, Y. Lf-yolo: A lighter and faster yolo for weld defect detection of X-ray image. IEEE Sens. J. 2023, 23, 7430–7439. [Google Scholar] [CrossRef]
- Pan, K.; Hu, H.; Gu, P. Wd-yolo: A more accurate yolo for defect detection in weld x-ray images. Sensors 2023, 23, 8677. [Google Scholar] [CrossRef]
- Yang, L.; Xu, S.; Fan, J.; Li, E.; Liu, Y. A pixel-level deep segmentation network for automatic defect detection. Expert Syst. Appl. 2023, 215, 119388. [Google Scholar] [CrossRef]
- Zuo, F.; Liu, J.; Fu, M.; Wang, L.; Zhao, Z. An efficient anchor-free defect detector with dynamic receptive field and task alignment. IEEE Trans. Ind. Inform. 2024, 20, 8536–8547. [Google Scholar] [CrossRef]
- Zuo, F.; Liu, J.; Fu, M.; Wang, L.; Zhao, Z. STMA-net: A spatial transformation-based multi-scale attention network for complex defect detection with X-ray images. IEEE Trans. Instrum. Meas. 2024, 73, 5014511. [Google Scholar] [CrossRef]
- Gu, J.; Xie, Z.Q.; Zhang, X.Y. Weld Defect Detection based on Improved Deep Learning. J. Astronaut. Metrol. Meas. 2020, 40, 75–79. [Google Scholar]
- Guo, F.; Qian, Y.; Shi, Y.F. Real-time railroad track components inspection based on the improved YOLOv4 framework. Automat. Constr. 2021, 125, 103596. [Google Scholar] [CrossRef]
- Mi, J.; Wen, X.; Sun, C.; Lu, Z.; Jing, W. Energy-efficient and Low Package Loss Clustering in UAV-assisted WSN using Kmeans++ and Fuzzy Logic. In Proceedings of the 2019 IEEE/CIC International Conference on Communications Workshops in China, ICCC Workshops 2019, Changchun, China, 11–13 August 2019; pp. 210–215. [Google Scholar]
- Adnan, R.M.; Khosravinia, P.; Karimi, B.; Kisi, O. Prediction of hydraulics performance in drain envelopes using Kmeans based multivariate adaptive regression spline. Appl. Soft. Comput. 2021, 100, 107008. [Google Scholar] [CrossRef]
- Wang, G.; Yuan, G.; Li, T.; Lv, M. An multi-scale learning network with depthwise separable convolutions. IPSJ Trans. Comput. Vis. Appl. 2018, 10, 11. [Google Scholar] [CrossRef]


| Processor | Graphics Card | Memory |
|---|---|---|
| AMD R7 4800H (TSMC, Taiwan, Chian) | NVIDIA GTX 1650Ti (NVIDIA, Santa Clara, CA, USA) | 16 G |
| Status | Size | Batch Size | Learning Rate | Decay | Eps | Epoch |
|---|---|---|---|---|---|---|
| Before | 416 × 416 | 8 | 1 × 10⁻³ | 5 × 10⁻⁵ | 1 × 10⁻⁸ | 0–85 |
| After | 416 × 416 | 2 | 1 × 10⁻⁴ | 5 × 10⁻⁵ | 1 × 10⁻⁸ | 86–180 |
| Model | Pores | Slag Inclusions | Incomplete Penetration | |||
|---|---|---|---|---|---|---|
| Precision | Recall | Precision | Recall | Precision | Recall | |
| YOLOv4-cs2 | 91.81% | 83.12% | 92.19% | 92% | 87.19% | 51.96% |
| YOLOv4-cs1 | 92.97% | 73.88% | 94.1% | 85.68% | 89.6% | 46.8% |
| YOLOv4 | 97.28% | 57.33% | 94.2% | 73.47% | 81.12% | 58.36% |
| YOLOv3 | 97.31% | 65.07% | 98.42% | 79.05% | 93.8% | 48.10% |
| YOLOv4-Tiny | 94.05% | 47.26% | 98.38% | 64.11% | 93.75% | 8.42% |
| Centernet | 99.71% | 18.76% | 99.77% | 45.79% | 99.9% | 0.11% |
| SSD | 95.26% | 43.33% | 97.56% | 63.26% | 99.9% | 1.12% |
| Model | Pore F1 | Slag Inclusion F1 | Incomplete Penetration F1 |
|---|---|---|---|
| YOLOv4-cs2 | 0.87 | 0.92 | 0.65 |
| YOLOv4-cs1 | 0.82 | 0.89 | 0.62 |
| YOLOv4 | 0.72 | 0.83 | 0.68 |
| YOLOv3 | 0.78 | 0.88 | 0.64 |
| YOLOv4-Tiny | 0.63 | 0.78 | 0.15 |
| Centernet | 0.32 | 0.63 | 0.002 |
| SSD | 0.6 | 0.77 | 0.02 |
| Model | Pore AP | Slag Inclusion AP | Incomplete Penetration AP | mAP |
|---|---|---|---|---|
| YOLOv4-cs2 | 92% | 96% | 74% | 87.5% |
| YOLOv4-cs1 | 90% | 96% | 72% | 85.79% |
| YOLOv4 | 88% | 92% | 75% | 84.81% |
| YOLOv3 | 88% | 95% | 76% | 86.30% |
| YOLOv4-Tiny | 71% | 84% | 43% | 65.93% |
| Centernet | 87% | 93% | 74% | 84.75% |
| SSD | 83% | 91% | 49% | 74.11% |
Disclaimer/Publisher’s Note: The statements, opinions and data contained in all publications are solely those of the individual author(s) and contributor(s) and not of MDPI and/or the editor(s). MDPI and/or the editor(s) disclaim responsibility for any injury to people or property resulting from any ideas, methods, instructions or products referred to in the content. |
© 2025 by the authors. Licensee MDPI, Basel, Switzerland. This article is an open access article distributed under the terms and conditions of the Creative Commons Attribution (CC BY) license (https://creativecommons.org/licenses/by/4.0/).
Share and Cite
Chen, Y.; Wu, Y. Detection of Welding Defects Tracked by YOLOv4 Algorithm. Appl. Sci. 2025, 15, 2026. https://doi.org/10.3390/app15042026
Chen Y, Wu Y. Detection of Welding Defects Tracked by YOLOv4 Algorithm. Applied Sciences. 2025; 15(4):2026. https://doi.org/10.3390/app15042026
Chicago/Turabian StyleChen, Yunxia, and Yan Wu. 2025. "Detection of Welding Defects Tracked by YOLOv4 Algorithm" Applied Sciences 15, no. 4: 2026. https://doi.org/10.3390/app15042026
APA StyleChen, Y., & Wu, Y. (2025). Detection of Welding Defects Tracked by YOLOv4 Algorithm. Applied Sciences, 15(4), 2026. https://doi.org/10.3390/app15042026